Article

Cross Assessment of Twenty-One Different Methods for Missing Precipitation Data Estimation

by
Asaad M. Armanuos
1,
Nadhir Al-Ansari
2 and
Zaher Mundher Yaseen
3,*
1
Irrigation and Hydraulics Engineering Department, Civil Engineering Department, Faculty of Engineering, Tanta University, Tanta 31511, Egypt
2
Civil, Environmental and Natural Resources Engineering, Lulea University of Technology, 97187 Lulea, Sweden
3
Sustainable Developments in Civil Engineering Research Group, Faculty of Civil Engineering, Ton Duc Thang University, Ho Chi Minh City 758307, Vietnam
*
Author to whom correspondence should be addressed.
Atmosphere 2020, 11(4), 389; https://doi.org/10.3390/atmos11040389
Submission received: 17 March 2020 / Revised: 10 April 2020 / Accepted: 10 April 2020 / Published: 15 April 2020
(This article belongs to the Section Meteorology)

Abstract

:
The results of metrological, hydrological, and environmental data analyses are mainly dependent on the reliable estimation of missing data. In this study, 21 classical methods were evaluated to determine the best method for infilling the missing precipitation data in Ethiopia. The monthly data collected from 15 different stations over 34 years from 1980 to 2013 were considered. Homogeneity and trend tests were performed to check the data. The results of the different methods were compared using the mean absolute error (MAE), root-mean-square error (RMSE), coefficient of efficiency (CE), similarity index (S-index), skill score (SS), and Pearson correlation coefficient (rPearson). The results of this paper confirmed that the normal ratio (NR), multiple linear regression (MLR), inverse distance weighting (IDW), correlation coefficient weighting (CCW), and arithmetic average (AA) methods are the most reliable methods of those studied. The NR method provides the most accurate estimations with rPearson of 0.945, mean absolute error of 22.90 mm, RMSE of 33.695 mm, similarity index of 0.999, CE index of 0.998, and skill score of 0.998. When comparing the observed results and the estimated results from the NR, MLR, IDW, CCW, and AA methods, the MAE and RMSE were found to be low, and high values of CE, S-index, SS, and rPearson were achieved. On the other hand, using the closet station (CS), UK traditional, linear regression (LR), expectation maximization (EM), and multiple imputations (MI) methods gave the lowest accuracy, with MAE and RMSE values varying from 30.424 to 47.641 mm and from 49.564 to 58.765 mm, respectively. The results of this study suggest that the recommended methods are applicable for different types of climatic data in Ethiopia and arid regions in other countries around the world.

Graphical Abstract

1. Introduction

Hydrological, climatological, and metrological analyses are mainly based on the availability of rainfall data [1], although problems associated with missing data are common and exist for various reasons. This may be the result of stations being relocated because of urbanization, errors in the methods implemented for measuring the rainfall amount, or the breakdown of instruments for a specific period, particularly in areas of flooding [2]. The analysis results of metrological and hydrological models can be affected in cases that include rainfall data series with missing values [3]. As a result, filling the gaps left by the missing data and estimating the missing values has become very important in recent hydrological studies [2]. Data infilling approaches utilize different methods for estimating missing climatological data [4,5]. The estimation methods for missing data can be categorized into three groups: statistical, empirical, and function fitting methods [6]. However, several studies classified the approaches for infilling missing data into four methods: deterministic methods, stochastic methods, artificial intelligence methods, and geostatistical methods [7,8,9,10]. Deterministic and geostatistical approaches are the most commonly implemented and include the arithmetic average (AA), normal ratio (NR), single best estimator (SBE), inverse distance weighting (IDW), coefficient of correlation weighting (CCW), and multiple linear regression (MLR) within a 50 to 250 km radius from the target station [11,12,13,14]. Nevertheless, the challenge is choosing the most suitable method to be implemented for estimating the missing climate data [7,15]. The efficiency of these approaches varies from area to area depending on the variances in climate and the metrological elements to be estimated [13]. The slope, topography, surface, and metrological conditions are the main local factors affecting the climate elements [7]. The arithmetic simple mean method (AA), inverse distance methods (IDW), and correlation coefficient weighting method (CCW) are considered to be empirical methods [16]; the linear regression (LR), MLR, and weighted linear regression (WLR) methods are considered to be statistical methods. The use of empirical and statistical methods mainly depends on the characteristics of the missing data [17]. The application of these approaches is mainly dependent on the period of the data gap, the season, the climate in the study region, the density and distribution of stations, and the characteristics of the archived data [18,19]. Xia et al. [6] estimated the missing data based on the closet neighboring station considering a geometric weighting. Willmott et al. [20] used the arithmetic average (AA) of the data from the neighboring station to estimate the missing values [20]. Teegavarapu and Chandramouli [21] estimated the rainfall missing values based on inverse distance weighting (IDW), neural networks, and the kriging method using the data from neighboring stations [21]. The results confirmed that the accuracy of the IDW method can be improved through a better definition of weighting parameters and a surrogate measure for distances [21]. De Silva et al. [13] and Suhaila et al. [2] used different methods, such as AA, NR, aerial rainfall ratio, IDW, CCW, and a combination of the IDW and CCW methods. The results confirmed that the NR method is the best method for estimating the missing data compared with the other methods. The most suitable method to estimate missing rainfall data can change for various regions based on the rainfall patterns and the spatial distribution [13]. Pizarro et al. and Xia et al. used simple LR and MLR for predicting the missing precipitation and temperature data, respectively [6,22]. Alfaro and Pacheco applied different estimation methods to estimate missing rainfall data, including the LR model and the NR method [23]. The results of Xia et al., Alfaro and Pacheco, and Pizarro et al. confirmed that the most suitable approach is the multiple linear regression method [6,22,23]. Dastorani et al. [24] used four approaches for estimating the missing data, i.e., the NR method, CCW, an artificial neural network (ANN), and an adaptive neuro-fuzzy inference system (ANFIS) method. The ANFIS approach was found to be the most suitable method for missing flow data, whereas the performance of the ANN approach was found to be more reliable than traditional methods. The literature review confirms that there are no substantial investigations that assess the different methods for estimating missing precipitation data in arid regions such as Ethiopia, and most studies have been implemented in countries with wet climates. This study aims to investigate the application of 21 different methods for predicting the missing rainfall data in arid areas of Ethiopia and to determine the most suitable method. The 21 investigated methods are AA, NR, the geographical coordinates (GC) method, the normal ratio with geographical coordinates (NRGC), IDW, modified inverse distance weighting (MIDW), CCW, LR, MLR, MI, the Nonlinear Iterative Partial Least Squares NIPALS algorithm for missing data, UK traditional (UK), expectation maximization (EM), CS, modified coefficient correlation weighting (MCCW), modified correlation coefficient with inverse distance weighting (MCCWID), modified normal ratio with inverse distance (NRID), modified old normal ratio with inverse distance (ONRID), normal ratio inverse distance weighting with correlation (NRIDWCC), modified normal ratio based on correlation (MNR), and modified normal ratio based on square root distance (MNR-T).

2. Material and Methods

2.1. Study Area and Data Analysis

The Blue Nile River is considered the main tributary of the River Nile, with a total drainage area of approximately 176,000 km2, around 17% of Ethiopia’s total area. The study area is located in the upper Blue Nile Basin. The study area contains dry and arid areas and is indexed as a dry/arid climate [25]. The average values of the annual precipitation and temperature in the study area are 94.25 mm and 17 °C, respectively. The monthly precipitation data between 1980 and 2013 from the fifteen rain-gauge stations located in Ethiopia, namely, Motta, Adet, Amba Marim, Ancharo, Bahir Dar, Combolcha, Degelo, Dejein, Gondar, Haik, Korem, Mekane Selem, Nefas Mewcha, Yejuibe, and Yetemen, were used in this study. The monthly precipitation data used here were collected from the National Water Research Center (NWRC) of Egypt and the National Meteorological Agency (NMA) of Ethiopia. The type of climate at all stations was calculated using the De Martonne [26] aridity index (I), as shown in the following equation:
I = P T + 10
where T and P are the average values of the annual temperature (°C) and precipitation (mm), respectively. Figure 1 indicates the study area. Table 1 shows the geographic coordinates of the included weather stations, their elevations, and the properties of the precipitation data.
In the current study, about 10% of the total precipitation data were randomly assumed to be missing and so needed to be estimated using the different statistical methods. The assumed missing data, in this study, were used to check the results of the presented methods by comparing the observed precipitation with the estimations. In addition to the randomly chosen missing data, the year 2011 was selected to be the example from the study period to check the performance of the applied statistical methods, i.e., the observed monthly precipitation for 2011 was compared with the estimated values. In this study, the Motta station was considered the target station. The Motta station is located almost in the middle of the study area in respect to its longitude and latitude. After performing the statistical analysis of the available data and a quality control (a homogeneity test and trend test), the challenge was to assess the performance of various classic statistical approaches for predicting the missing data of precipitation. The 21 statistical methods used for estimating of rainfall missing data are outlined below.

2.1.1. Simple Arithmetic Average (AA)

The AA method is known as the simple method. The AA method is extensively applied to estimate the missing data of metrological studies. The application of the AA method is acceptable if the stations are uniformly spread in the study area and the measurements of the individual station do not change greatly from the average [27]. The missing data are estimated based on the arithmetic average of the nearest stations around the target station. The gaps of data can be obtained as follows:
Y i = i = 1 n X i   n
where Yi is the missing climate value at the target station, Xi is the measured value of the climatic parameter in the surrounding stations, and n is the number of nearby stations.

2.1.2. Normal Ratio (NR)

The NR method was firstly recommended by [28] to estimate missing rainfall data, and was recently modified by Young (1992) [29]. The NR method is applied to compute the missing data if the normal annual rainfall of the surrounding stations exceeds 10% of the target station [30]. This method mainly depends on the mean ratio of rainfall data between neighboring stations and the target station in order to weigh the impact of each neighboring gauge. The missing rainfall data can be computed by the following equation:
Y i = 1   n   i = 1 n N s N i   X i
where Ns is the mean of available rainfall data at the target station, Ni is the mean of the available rainfall data at the ith surrounding stations, and n is the number of surrounding stations considered in the calculation of this method.

2.1.3. Geographical Coordinates (GC)

GC is considered a weighting technique and was proposed to compute missing rainfall data [15]. The weight coefficient is calculated based on the geographical coordinates of the stations (longitude and latitude). The position of the target station represents the center point in this method. The missing data are estimated depending on the distances from the target station to the surrounding stations according to the following equation:
Y i = i = 1 n ( 1 x i 2 + y i 2 i = 1 n 1 x i 2 + y i 2 )   X i
where xi and yi are the longitude and latitude of the ith nearby station.

2.1.4. Normal Ratio With Geographical Coordinates (NRGC)

The NRGC method combines both the NR and GC methods. This method is used to predict missing rainfall data. The NRGC method is commonly used and is considered to be the best method for missing data estimation as it adjusts the location of stations to achieve the best performance, combining aspects of both methods. For the NRGC method, the missing data are computed by Equation (5):
Y i = i = 1 n ( ( 1 x i 2 + y i 2 )   ( N s N i ) i = 1 n ( 1 x i 2 + y i 2 ) ( N s N i ) )   X i

2.1.5. Inverse Distance Weighting (IDW)

IDW is a common method for filling in missing data [31]. The computation of the missing values of rainfall depends on the distance between the target station and surrounding stations. The greatest weight is applied to the nearest station. In this method, the missing data are calculated using the observed data at the nearby stations, as in Equation (6):
Y i = i = 1 n ( ( 1 d i k ) i = 1 n ( 1 d i k ) )   X i
where di is the distance from the target station to the ith surrounding station, and k is the distance of friction varying from 1 to 6 [32].

2.1.6. Modified Inverse Distance Weighting (MIDW)

Golkhatmi et al. (2012) and Viale and Garreaud (2015) confirmed that elevation has an important effect on rainfall, therefore the difference in elevation between the target and neighboring stations was implemented to improve the performance of the IDW method [33,34], as can be seen in Equation (7):
Y i = i = 1 n ( ( 1 h i a . d i k ) i = 1 n ( 1 h i a . d i k ) )   X i
where hi is the absolute value of difference in elevation between the target and surrounding station, and the exponent a is a power variable. In this study, values of a and k ranging from 1 to 3 were checked, and values of a = k = 1 were adjusted to calculate the missing rainfall data.

2.1.7. Correlation Coefficient Weighted (CCW)

Teegavarapu and Chandramouli (2005) confirmed that the effectiveness of this method relies on the strength of the correlation between the target stations and the surroundings stations. Therefore, the equation of the IDW method was adapted to include the strength correlation as follows [21]:
Y i = i = 1 n ( ( r i ) i = 1 n ( r i ) )   X i
where ri is the Pearson correlation coefficient (rPearson) between the target station and each neighboring station.

2.1.8. Linear Regression (LR)

Linear regression is a statistical method used to estimate missing weather data at any gauge station with similar climatological conditions. The LR method in statistics is a technique to find a relationship between a dependent variable Y and one independent variable X. The LR method is a regression analysis and is commonly used in practical applications [35]. In the current study, the data from the Adet station was implemented to compute the missing data values of the Motta station (the target station) through the LR statistical method:
Y i = a + ( b .   X i )
where Yi is the estimated rainfall data, and Xi is the observed rainfall value of the neighboring station; a is the intercept, and b is the regression coefficient, both of which can be computed from the following equations:
a = Y ¯ ( b .   X ¯ )
and
b = i = 1 n x y i = 1 n x   .   i = 1 n y n i = 1 n x 2 ( i = 1 n x )   x 2 n
where Y ¯ and X ¯ are mean values of the rainfall data in the Y and X stations, respectively.

2.1.9. Multiple Linear Regression (MLR)

In the MLR method, the missing rainfall data are estimated by computing the regression coefficient between the target station and the most highly correlated nearby stations [6,36]:
Y i = b o + i = 1 n b i X i
where Y i is the estimated rainfall data, X i is the observed rainfall value of the ith surrounding station, bi are the regression coefficients of the ith surrounding stations, and n is the number of nearest stations included in the calculation method.

2.1.10. Multiple Imputation (MI)

The MI method was proposed by Rubin [37] for infilling missing data. This method should be implemented in cases where the missing data are randomly distributed. The missing rainfall data in this method were replaced by a set of realistic values considering an uncertainty in excess of the corrected precise value of the missing data to be assigned [17]. The imputation procedure for the estimation of the missing value is repeated five times and the parameter estimates are averaged through the implementation of discrete analysis [38,39]. The multiple imputation approach can be performed in different statistical packages, for example SAS, the Amelia II package, EMCOV, SPLUS, and Mplus [40,41]. In this study, the multiple imputations were implemented through XLSTAT statistical software.

2.1.11. NIPALS Algorithm for Missing Data (NIPALS)

The NIPALS method was firstly proposed by [42], and was called the NILES algorithm. The NIPALS algorithm implements principle components analysis (PCA) on the datasets containing the missing data through an iterative system. It depends on computing the slopes of the least square line which crosses the origin points of the measured data. In this stage, the eigenvalues are calculated by the changes of the NIPALS components. The convergence of the NIPALS algorithm is related to the missing data percentage [43]. In this study, the NIPALS algorithm for estimating the missing rainfall data was implemented through XLSTAT software.

2.1.12. UK Traditional Method (UK)

The UK traditional method was proposed by the UK Meteorological Office for estimating missing metrological data (temperature and sunshine) considering a comparison between the target station and a single nearby station [4]. In the current research, the ratio of the mean rainfall in the target station (Motta station) to the mean rainfall at the neighboring station (Adet station), which has the highest correlation coefficient, was computed. Then, the missing rainfall data were estimated by multiplying the computed ratio by the rainfall data of the nearest station with the highest rPearson in relation to the target station.

2.1.13. Expectation Maximization (EM)

The EM method was first suggested by [44], in order to solve the problems found in the maximum likelihood technique [44]. This method combines both the statistical approach and the algorithmic application. It is used extensively by researchers for missing data problems [44]. The conditional expectation step and maximization step are the two main steps in the EM algorithm procedure. The expectation step equation gives the conditional expectations of the missing values and the model parameter estimation, whereas, the maximization step determines the estimation of the model parameters in order to maximize the log likelihood function of the complete data from the first step. The two steps are iterated until convergence is reached [45].

2.1.14. Closest Station Method (CSM)

In this approach, the closest station to the target station is firstly identified. Secondly, the missing weather data of the target are estimated using the closest station data. Thirdly, the estimated weather data are modified using the ratio of the long-term means for that year [4]. In the literature, different methods can be found which have a similar concept, such as the nearest neighbor (NN) and single best estimator (SIB). The nearest neighbor (NN) method is considered to be a simple method for filling in missing rainfall data. It depends on the use of the data from the nearest station to fill in the missing data of the target station [46]. The nearest station is considered to be the station with the highest rPearson in relation to the target station or the closest station based on location and distance. In this method, the values of the closed station can be implemented to fill in the missing data without any changes [47]. The SIB approach is considered as being an analogous and simple method that uses the closest neighboring station to fill the gaps of the target station. The missing data of the target station are computed using the nearest station with the highest positive value of rPearson in relation to the target station [48].

2.1.15. Modified Coefficient Correlation Weighting (MCCW)

The CCW method depends on the rPearson between the surroundings stations and the target station. Suhaila et al. [2] modified the CCW method by taking into account different values of the power of the rPearson to improve the CCW method and provide more weight in its calculations. The missing data can be estimated using the MCCW method as follows:
Y i = i = 1 n ( r i P i = 1 n r i P )   X i
where ri is the rPearson between the target station and ith nearby station, and P is the power of the rPearson, ranging from 2 to 6.

2.1.16. Modified Correlation Coefficient with Inverse Distance Weighting (MCCIDW)

This method is a combination of the IDW and CCW methods and is used for estimating the missing weather data values [2]. The IDW technique mainly depends on the distance from the target station to the nearest stations. The MCCIDW method gives a power for the correlation coefficient and the distance, ranging from 1 to 6, and the missing data can be calculated from the following formula:
Y i = i = 1 n ( ( r i P d i P ) i = 1 n ( r i P d i P ) )   X i

2.1.17. Modified Normal Ratio with Inverse Distance (NRID)

The NRID method is a combination of the modified NR method [29] and the IDW method and is considered the simplest approach for estimating missing weather data [49]. The modified NR method mainly reflects the positive spatial correlation between the target station and the nearby stations. The following formula can be used to compute the missing rainfall data using the NRID method [50]:
Y i = i = 1 n ( ( ( n 2 ) . r i 2 ( 1 r i 2 ) . d i 2 ) i = 1 n ( n   . r i P ( 1 r i P ) . d i 2 ) )   X i

2.1.18. Modified Old Normal Ratio with Inverse Distance (ONRID):

A combination of the NR method and the ID method improves the results of both methods in terms of filling in missing data [2]. The ONRID method is a combination of the modified old normal ratio method and the ID method [50]. The missing data are estimated using the following equation [2,50]:
Y i = i = 1 n ( ( N s N i   .   d i 2   ) i = 1 n ( N s N i   .   d i 2   ) )   X i

2.1.19. Normal Ratio Inverse Distance Weighting with Correlation (NRIDC)

Azman et al. (2015) first proposed this method, known as NRIDC, as being a combination of three methods: the NR, IDW, and CCW methods [50]. The NRIDC is considered to be the same method as the NRID, proposed by Suhaila et al. (2008), with the addition of the correlation coefficient [2,50]. According to this method, the missing data can be estimated using the following formula:
Y i = i = 1 n ( (   r i P .   N s N i   .   d i 2   ) i = 1 n (   r i P .   N s N i   .   d i 2   ) )   X i
where the power of the correlation coefficient P should be more than 4.

2.1.20. Modified Normal Ratio Based on Correlation (MNR)

Young (1992) modified the old NR method by including the correlation coefficient between the target station and the surrounding stations [29]. Therefore, the weighting of this method and the formula for calculating the missing data are given as follows:
Y i = i = 1 n ( ( ( n 2 ) . r i 2 ( 1 r i 2 ) ) i = 1 n ( n   . r i P ( 1 r i P ) ) )   X i

2.1.21. Modified Normal Ratio Based on Square Root Distance (MNR-T):

Tang et al. (1996) first discussed the impact of the distance from the target station to the ith surrounding station [11]. In 1996, they proposed the MNR-T method for filling in precipitation data gaps in Malaysia. The MNR-T method is calculated as follows [11]:
Y i = i = 1 n N s N i   . ( d i 1 / P i = 1 n d i 1 / P )   X i
where the power of the distance p ranges from 1.5 to 2.

2.2. Methods Performance

The efficiency of the filling data was compared using six different error indices: mean absolute error (MAE), root mean square error (RMSE), coefficient of efficiency (CE), similarity index (S-index), skill score (SS), and rPearson. The error measures were used to compare the estimations with the observed values. The six error indices are given as follows:
i. Mean absolute error (MAE)
The MAE is considered to be a valuable measure used in different model evaluations. It measures the value of the estimated error. This method is recommended by Willmott et al. (2009) [51]. The best method for estimating the massing value should be related to the lowest computed value of MAE. The value range of MAE is between 0.0 and +∞, [52]. The MAE is computed using the following equation:
M A E = 1 n i = 1 n | Y i ^ Y i |
ii. Root mean square error (RMSE)
The RMSE is usually implemented to evaluate the performance and efficiency of the different estimated models in meteorological research studies [53,54,55]. It measures the difference between the estimated and observed values. The best method gives the lowest computed value of the RMSE. The RMSE value varies from 0 to +∞. The RMSE is presented as follows:
R M S E = i = 1 n ( Y i ^ Y i ) 2 n
iii. Coefficient of efficiency (CE)
The coefficient of efficiency values range from −1 to +1. A CE value of 1.0 shows a perfect match between the estimated data and the measured data. A value of CE of 0.0 shows that the method’s estimations are as accurate as the mean value of the measured data. However, a value of CE less than 0.0 shows that the mean of the observed values is a better estimator than the model. A value of CE close to 1.0 shows a good accuracy [4]. CE is calculated from the following equation:
C E = 1 i = 1 n ( Y i ^ Y i ) 2 i = 1 n ( Y i ^ Y ¯ ) 2
iv. Similarity index (S- index)
The S-index is the index of agreement for evaluating the method performance; this involves the agreement percentage between the estimated and observed values. The values of the S-index vary between 0.0 in a case of complete disagreement and 1.0 in a case of perfect and reliable agreement [56]. The similarity index is computed as follows:
S   i n d e x = 1 i = 1 n ( Y i ^ Y i ) 2 i = 1 i = n ( | Y i ^ Y ¯ | + | Y i Y ¯ |   ) 2
v. Skill score (SS)
The SS is used to measure the quality of the method in terms of estimating the missing data. A calculated positive value of SS shows that the used method can improve the estimates. The closer the SS value is to 1.0, the more reliable the estimation. An SS value of 1.0 indicates a perfect estimation of the missing data [57,58,59]. The skill score index (SS) is calculated as follows:
S S = 1 i = 1 n ( Y i Y i ^   ) 2 i = 1 n ( Y ¯ Y i ^   ) 2
vi. Pearson correlation coefficient (rPearson)
The correlation coefficient indicates the relationship strength between the observed and estimated data. A higher positive value of Pearson coefficient shows that the estimates will be high or low values when the observed is high or low, respectively, and gives evidence that the used method is suitable for predicting missing data [13,60]. The correlation coefficient can be calculated from the following equation:
r P e a r s o n = i = 1 n ( Y i ^ Y ¯ ) . ( Y i Y ¯ i ) i = 1 n ( Y i ^ Y ¯ ) 2 .   i = 1 n ( Y i Y ¯ i ) 2
where Y i is the estimated value, Y i ^ is the observed value, and Y ¯ i   and   Y ¯ are the average precipitation values of estimated and observed data, respectively.

3. Results and Discussion

In the following section, the results of the current study will be shown in two subsections. Firstly, the results of the accuracy of the archived data and secondly the analysis of results of applied methods will be shown by comparing the observed monthly precipitation with estimated values considering different statistical indices.

3.1. Accuracy of the Station Data

Table 2 presents the investigated values of correlation coefficients for the monthly precipitation data. The Motta station was chosen as the target station. The precipitation at the Motta station is very strongly correlated with the Adet (rPearson = 0.91), Amba Marim (0.80), Bair Dar (0.89), Combolcha (0.82), Dejein (0.88), Gondar (0.84), Nefas Mewcha (0.84), Wegel Tena (0.83), and Yetemen (0.82) stations. On the other hand, the investigated correlation is strongly correlated between the Motta station and the remaining stations, with rPearson ranging from 0.71 to 0.77, as shown in Table 2. The result of the rPearson coefficient of the monthly precipitation data at the different stations is significant and valid for modeling. Very strong correlation coefficients were obtained between Degolo and Nefas Mewcha stations (0.94), Degolo and Amba Mariam stations (0.93), Combolcha and Amba Mariam (0.92), Adet station with Motta and also Bahir Dar (0.91), and Haik and Ancharo stations (0.90). Moderate values of rPearson were obtained between Yejuibe and Yetemen, Nefas Mewcha and Gondar, Adet, and Ancharo, corresponding to rPearson equal to 0.60, 0.43, and 0.42, respectively. A weak value of rPearson equal to 0.34 was found only between Gondar and Haik stations.
In order to check the accuracy of the available data, the normal homogeneity test (SNHT), Pettitt’s test, and the Mann–Kendall (MK) trend test were applied to the precipitation data using the XLSTAT software (Table 3 and Table 4). Alexandersson (1986) developed the SNHT in order to discover the variety in precipitation data series [61]. The MK trend test was developed by [62,63,64] to evaluate if there is a monotonic downward or upward trend of the target parameter over time. In the SNHT, the null hypothesis (H0) indicates that the used data are homogenous, while the alternative hypothesis (H1) indicates that the used data are heterogeneous.
In the MK trend test, the null hypothesis (H0) is randomness and the absence of any trends in the data; on the other hand, the alternative hypothesis (H1) indicates that the data are non-random and trends exist in the data. In the results of the MK trend test, if the p-value exceeds the significance level (α), the null hypothesis (H0) is acceptable; otherwise, the alternative hypothesis (H1) is confirmed. The results of the SNHT show that the p-value for all stations ranged from 0.069 (Yetemen) to 0.995 (Haik), with the consequence that the null hypothesis (H0) is acceptable and the used monthly data at each station is homogenous. The p-values for remaining stations ranged from 0.368 to 0.989.
Regarding the results of Pettitt’s test, the computed p-value for monthly precipitation data in different stations ranged from 0.06 (Amba Mariam) to 0.993 (Combolcha). The computed p-values exceed 5%, meaning that the null hypothesis should be accepted and confirming the homogeneity of the archived data for each station. In respect to the results of the Mann Kendall test, the calculated p-values range from 0.05 to 0.818. The highest computed p-value equals 0.818, at Adet station, followed by Haik (0.882), Dejein (0.865), Amba Mariam (0.740), Motta (0.552), and Degolo (0.551). The lowest computed values of p-values in the MK test were obtained in Korem, Yejuibe, Bahir Dar, and Nefas Mewcha, equal to 0.229, 0.172, 0.147, and 0.121, respectively. All p-values exceed 5%, which confirms that no trends exist in the archived data for each station. The analysis of the mentioned tests in Table 3 and Table 4 confirmed that the monthly precipitation data are independent and homogenous at all of the used stations, and as a result can be implemented with confidence.

3.2. Comparison Between the Proposed Mmethods Results

In the current study, we hypothesized that 10% of the data might not be measured and so may need to be estimated. Firstly, the 21 methods were applied to the random missing monthly data (24 months), and the observed precipitation of the target station was compared to the estimated values from the applied methods. Secondly, the performance of the applied methods was checked to estimate the monthly precipitation of the years 2004 and 2011. Thirdly, the accuracy of the proposed methods was checked by estimating the precipitation over the period from 1990 to 1998. The number of the nearest stations engaged in the different estimation methods was reliant on the method itself. For example, for the UK, CS, and LR methods, only data from one station is used (that with the highest correlation coefficient in relation to the target station). On the other hand, in the AA, NR, GC, NRGC, IDW, MIDW, CCW, NIPALS, EM, MCCW, MCCWID, NRID, ONRID, NRIDC, MNR, and MNR-T methods, data from all the neighboring stations were used in the calculations. In the MLR method, data from five nearby stations with strong correlation values with the target station were used in the method calculations. The best obtained results for the MLR method were observed when the monthly precipitation data at the Adet, Bahir Dar, Degelo, Haik, and Yetemen stations were implemented. In the MI method, different combinations of input numbers regarding neighboring stations (differing from one station to five stations) were implemented to determine which of them performed best. In the MI method, the best results were attained by including data from five stations. The best obtained results for the MI method were observed when the monthly precipitation data at the Adet, Bahir Dar, Combolcha, Dejein, and Gondar stations were used and compared with measured data. Table 5 shows the results of six different performance criteria for comparison between the different statistical methods.
i. MAE values for estimated precipitation values compared with observed values
The minimum and maximum MAE values are 22.90 mm (NR) and 47.641 mm (MI). The average value of MAE equals 27.99 mm. In respect to MAE, Table 5 shows that among the presented methods, the simple NR, NRID, MLR, NRIDWCC, ONRID, IDW, MNR, MCCW, CCW, AA, and NRGC methods are the most accurate with MAE values of 22.90, 23.175, 23.181, 23.480, 23.689, 23.709, 23.983, 25.276, 25.288, 25.547, and 25.65 mm, respectively. Application of NR, NRID, MLR, NRIDWCC, ONRID, IDW, MNR, MCCW, CCW, and AA methods improves the estimation of missing data versus the observed value with MAE. These methods were followed by MNR-T (26.958 mm), MCCWID (28.254 mm), GC (28.099 mm), NIPALS (28.419 mm), and CS (30.424 mm) with MAE ranges from 26.958 to 30.424 mm. The EM, UK, LR, and MI are the worst performing methods with MAE equal to 31.278, 31.474, 33.601, 35.785, and 47.641 mm respectively. Among all the approaches, UK, LR, and MI are considered to be the worst estimation methods according to the value of MAE. This can be related to the fact that these methods include few neighboring stations in their calculation.
ii. RMSE values for estimated precipitation values compared with observed Values
The RMSE values of estimated precipitation compared with observed values for the different methods ranges from 33.695 mm (NR) to 58.765 mm (MI). The average value of RMSE equals 41.68 mm. The NR, IDW, MLR, MNR-T, CCW, NRGC, and MCCW methods achieved the most accurate results with the lowest values of RMSE, compared with other methods, equal to 33.695, 35.011, 35.573, 35.713, 35.919, 36.104, and 36.230 mm, respectively. These applied methods were followed by ONRID (37.114 mm), NRIDWCC (37.397 mm), MNR-T (37.713 mm), NRID (38.032 mm), AA (38.671 mm), GC (39.387 mm), NIPALS (42.516 mm), MIDW (43.304 mm), and MCCWID (46.167 mm). In addition, the CS, EM, UK, LR, and MI methods are considered the lowest accuracy methods with RMSE values of 49.564, 51.453, 52.756, 54.130, and 58.765 mm, respectively. The MI is considered the worst performing method compared with the other applied methods, with RMSE equal to 58.765 mm, just under double the average RMSE value.
iii. CE, S-index, and SS values for estimated precipitation values compared with observed values
The values of CE and SS for all applied methods range from 0.995 to 0.998, while the minimum and maximum values of S-index equal 0.998 and 0.999, respectively. The computed values of CE are close to 1.0, thus confirming the accuracy of the applied methods to estimate the missing precipitation based on the observed values. Regarding the CE and SS values, AA, NR, GC, NRGC, IDW, MLR, MCCW, NRID, ONRID, NRIDWCC, MNR, and MNR-T are considered the most reliable and accurate methods with CE of 0.998, followed by MIDW, NIPALS, and MCCWID, with a CE value of 0.997. All the presented methods show a reliable estimation of missing precipitation data with an S-index close to 1.0. On the other hand, the LR, UK, EM, and CS methods demonstrated the lowest accuracy regarding the CE and SS index. In respect to the CE value, S-index, and SS, the results of the AA, NR, GC, NRGC, IDW, MLR, MCCW, NRID, ONRID, NRIDWCC, MNR, and MNR-T methods show a reliable estimation of the predictive data with a value close to 1.0.
iv. rPearson values for estimated precipitation values compared with observed values
Regarding the rPearson between the estimated values and observed values, all the methods demonstrated a very strong correlation, with rPearson ranging from 0.872 to 0.999. Regarding the results of rPearson, the IDW, NR, AA, MNR, MLR, CCW, MCCW, ONRID, NRIDWCC, and MNR-T methods are the most accurate and reliable methods, with rPearson equal to 0.999, 0.945, 0.944, 0.943, 0.940, 0.937, 0.936, 0.935, 0.934, and 0.932, respectively. These methods achieved the highest correlation values between the estimated and observed precipitation values. These methods were followed by GC, NIPALLS, MCCWID, and MIDW methods, with rPearson equal to 0.924, 0.914, 0.914, and 0.908, respectively. On the other hand, the UK, CS, LR, EM, and MI methods show lower values of the mentioned criteria, equal to 0.884, 0.881, 0.875, 0.872, and 0.864, respectively. The IDW, NR, AA, MNR, MLR, and CCW methods are considered the most reliable and accurate methods, with the highest values of rPearson compared with the other applied methods. This can be confirmed from Figure 2, as the estimated values match well with the observed values for the IDW, NR, AA, MNR, MLR, and CCW methods. The analysis of results in Table 5 and Figure 2 shows that of the implemented statistical methods, the NR, MLR, IDW, CCW, and AA methods are the most reliable and accurate. It can be noted that using the NR method achieves accurate estimations with an rPearson of 0.945, mean absolute error of 22.90 mm, RMSE of 33.695 mm, CE index of 0.998, similarity index of 0.999, and skill score of 0.998. The NR is followed by the MLR method with a Pearson correlation coefficient of 0.940, mean absolute error of 23.181 mm, RMSE of 35.573 mm, CE index of 0.998, similarity index of 0.999, and skill score of 0.998. The results confirm that the NR, MLR, IDW, CCW, and AA methods are the more suitable and accurate methods to estimate missing precipitation data. These results support the findings by [4,6,12,65]. Most importantly, the NR, MLR, IDW, CCW, and AA methods may be used in other arid areas with similar climate conditions.
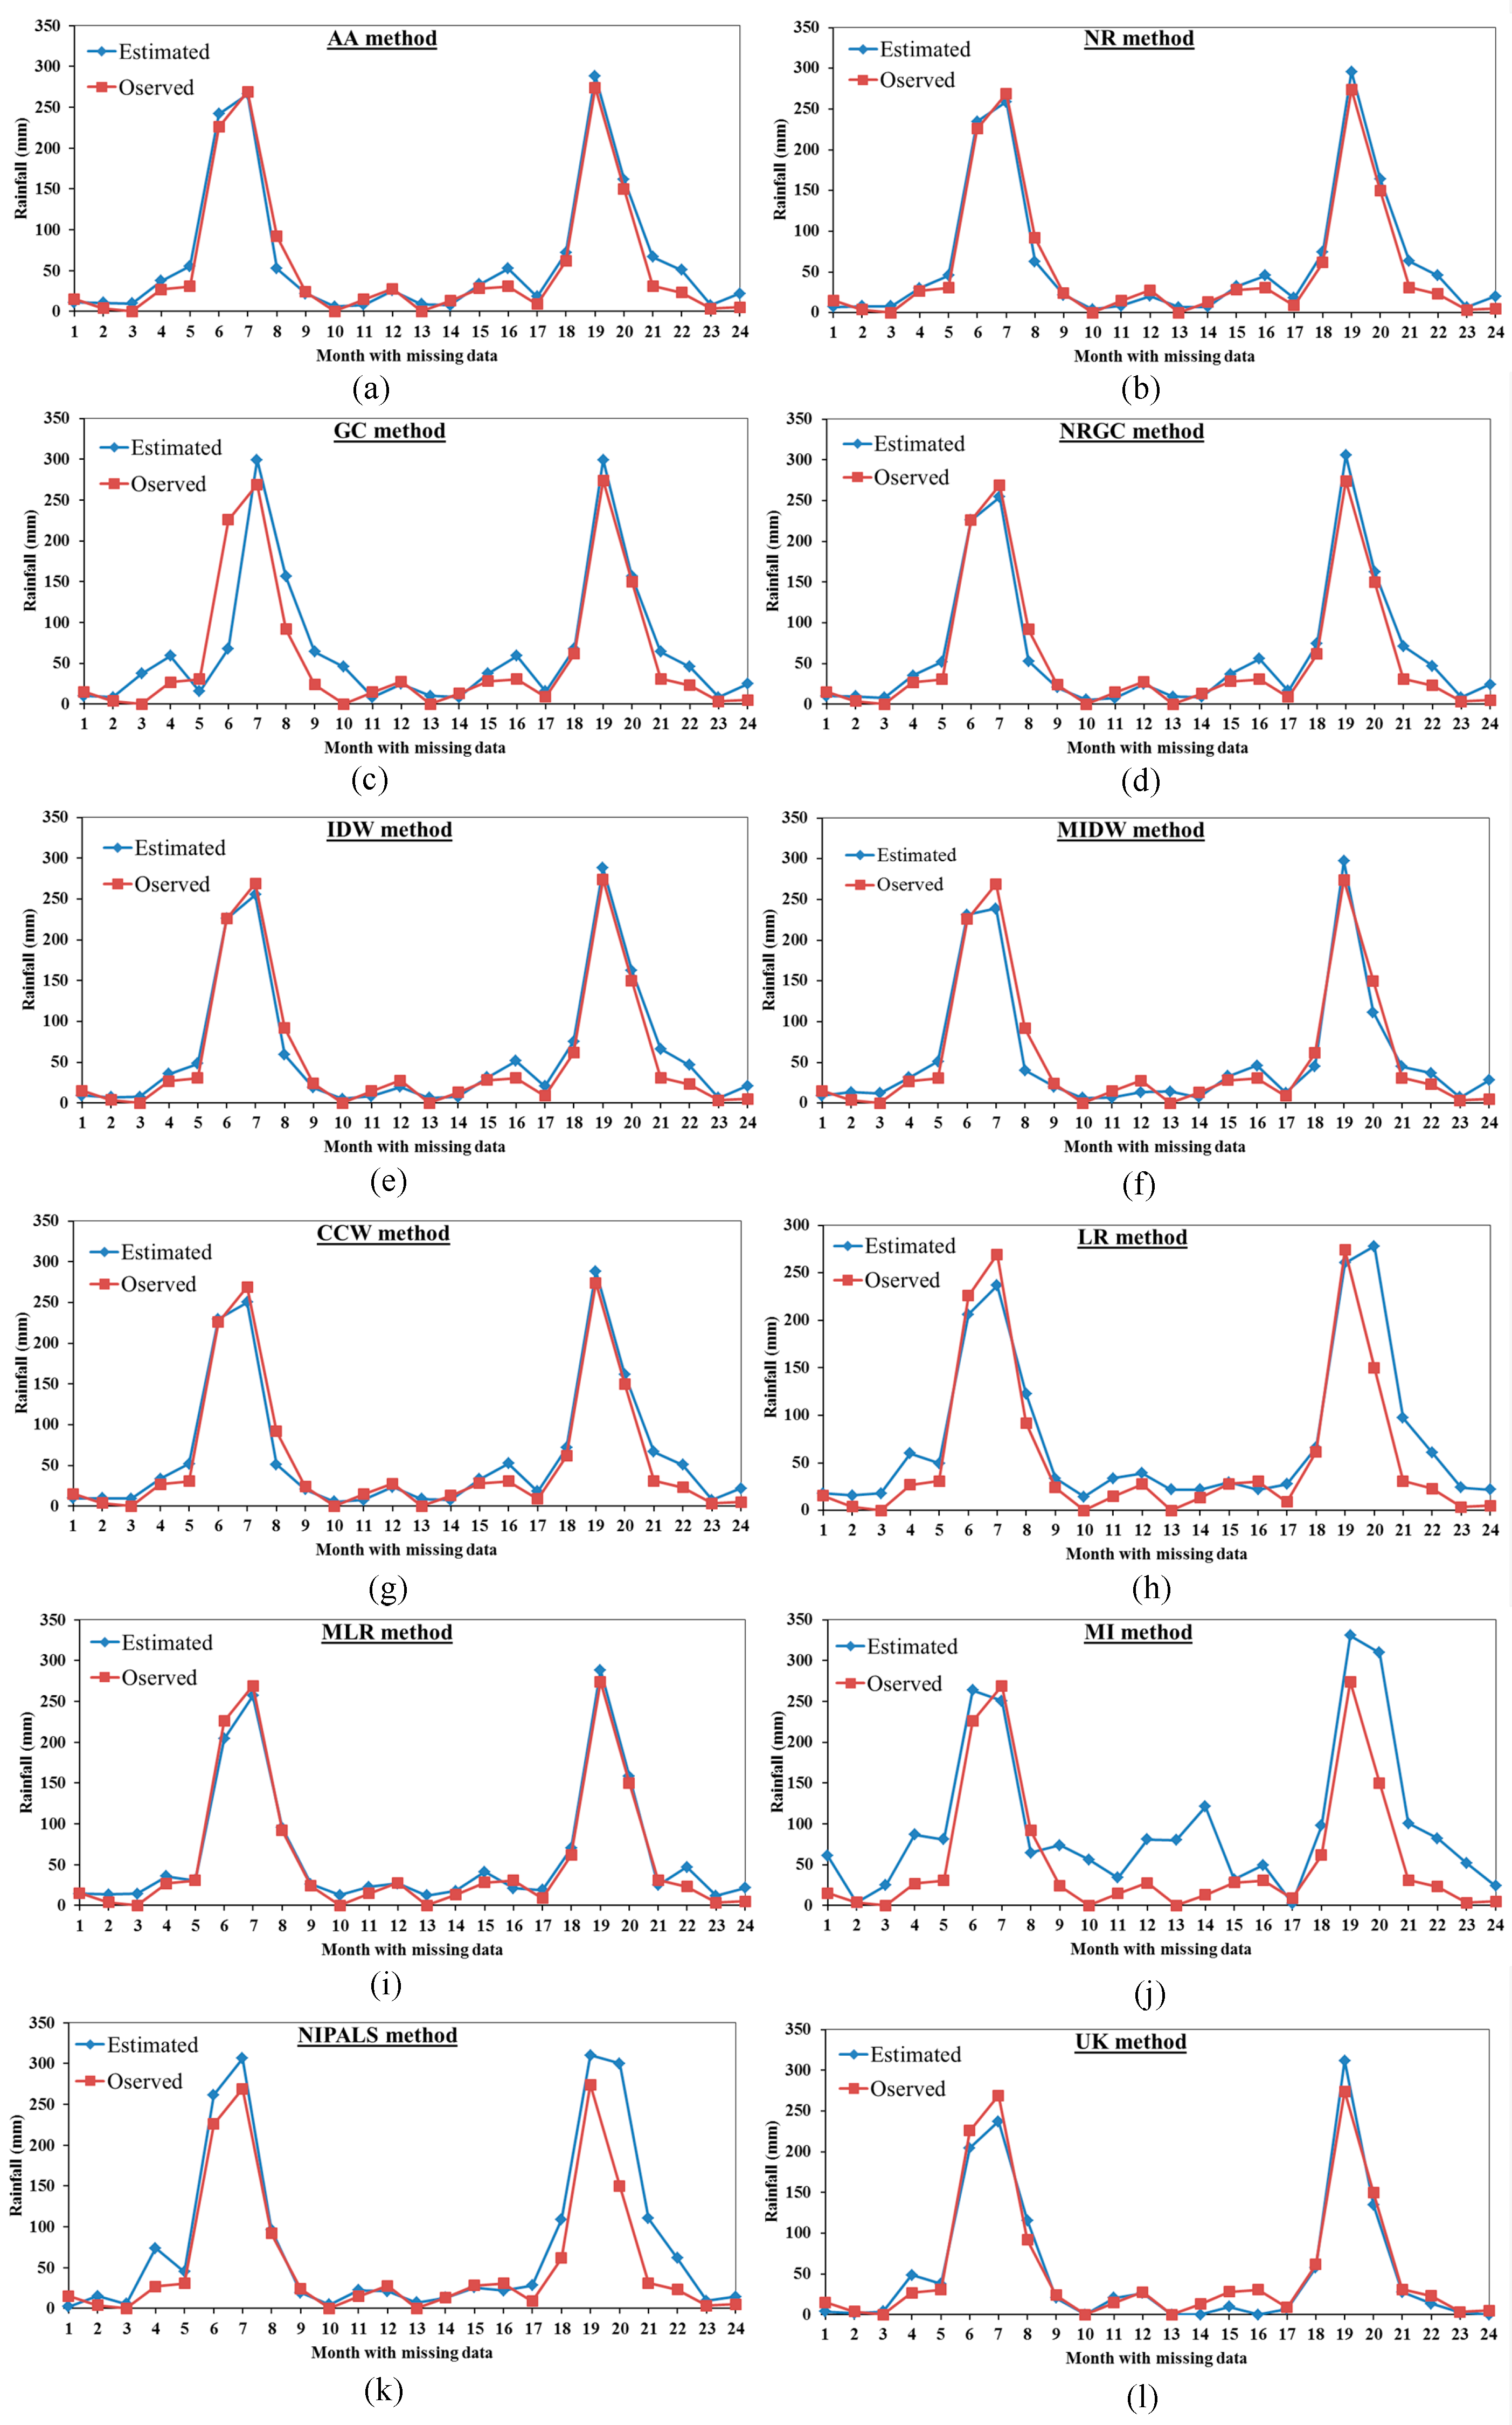
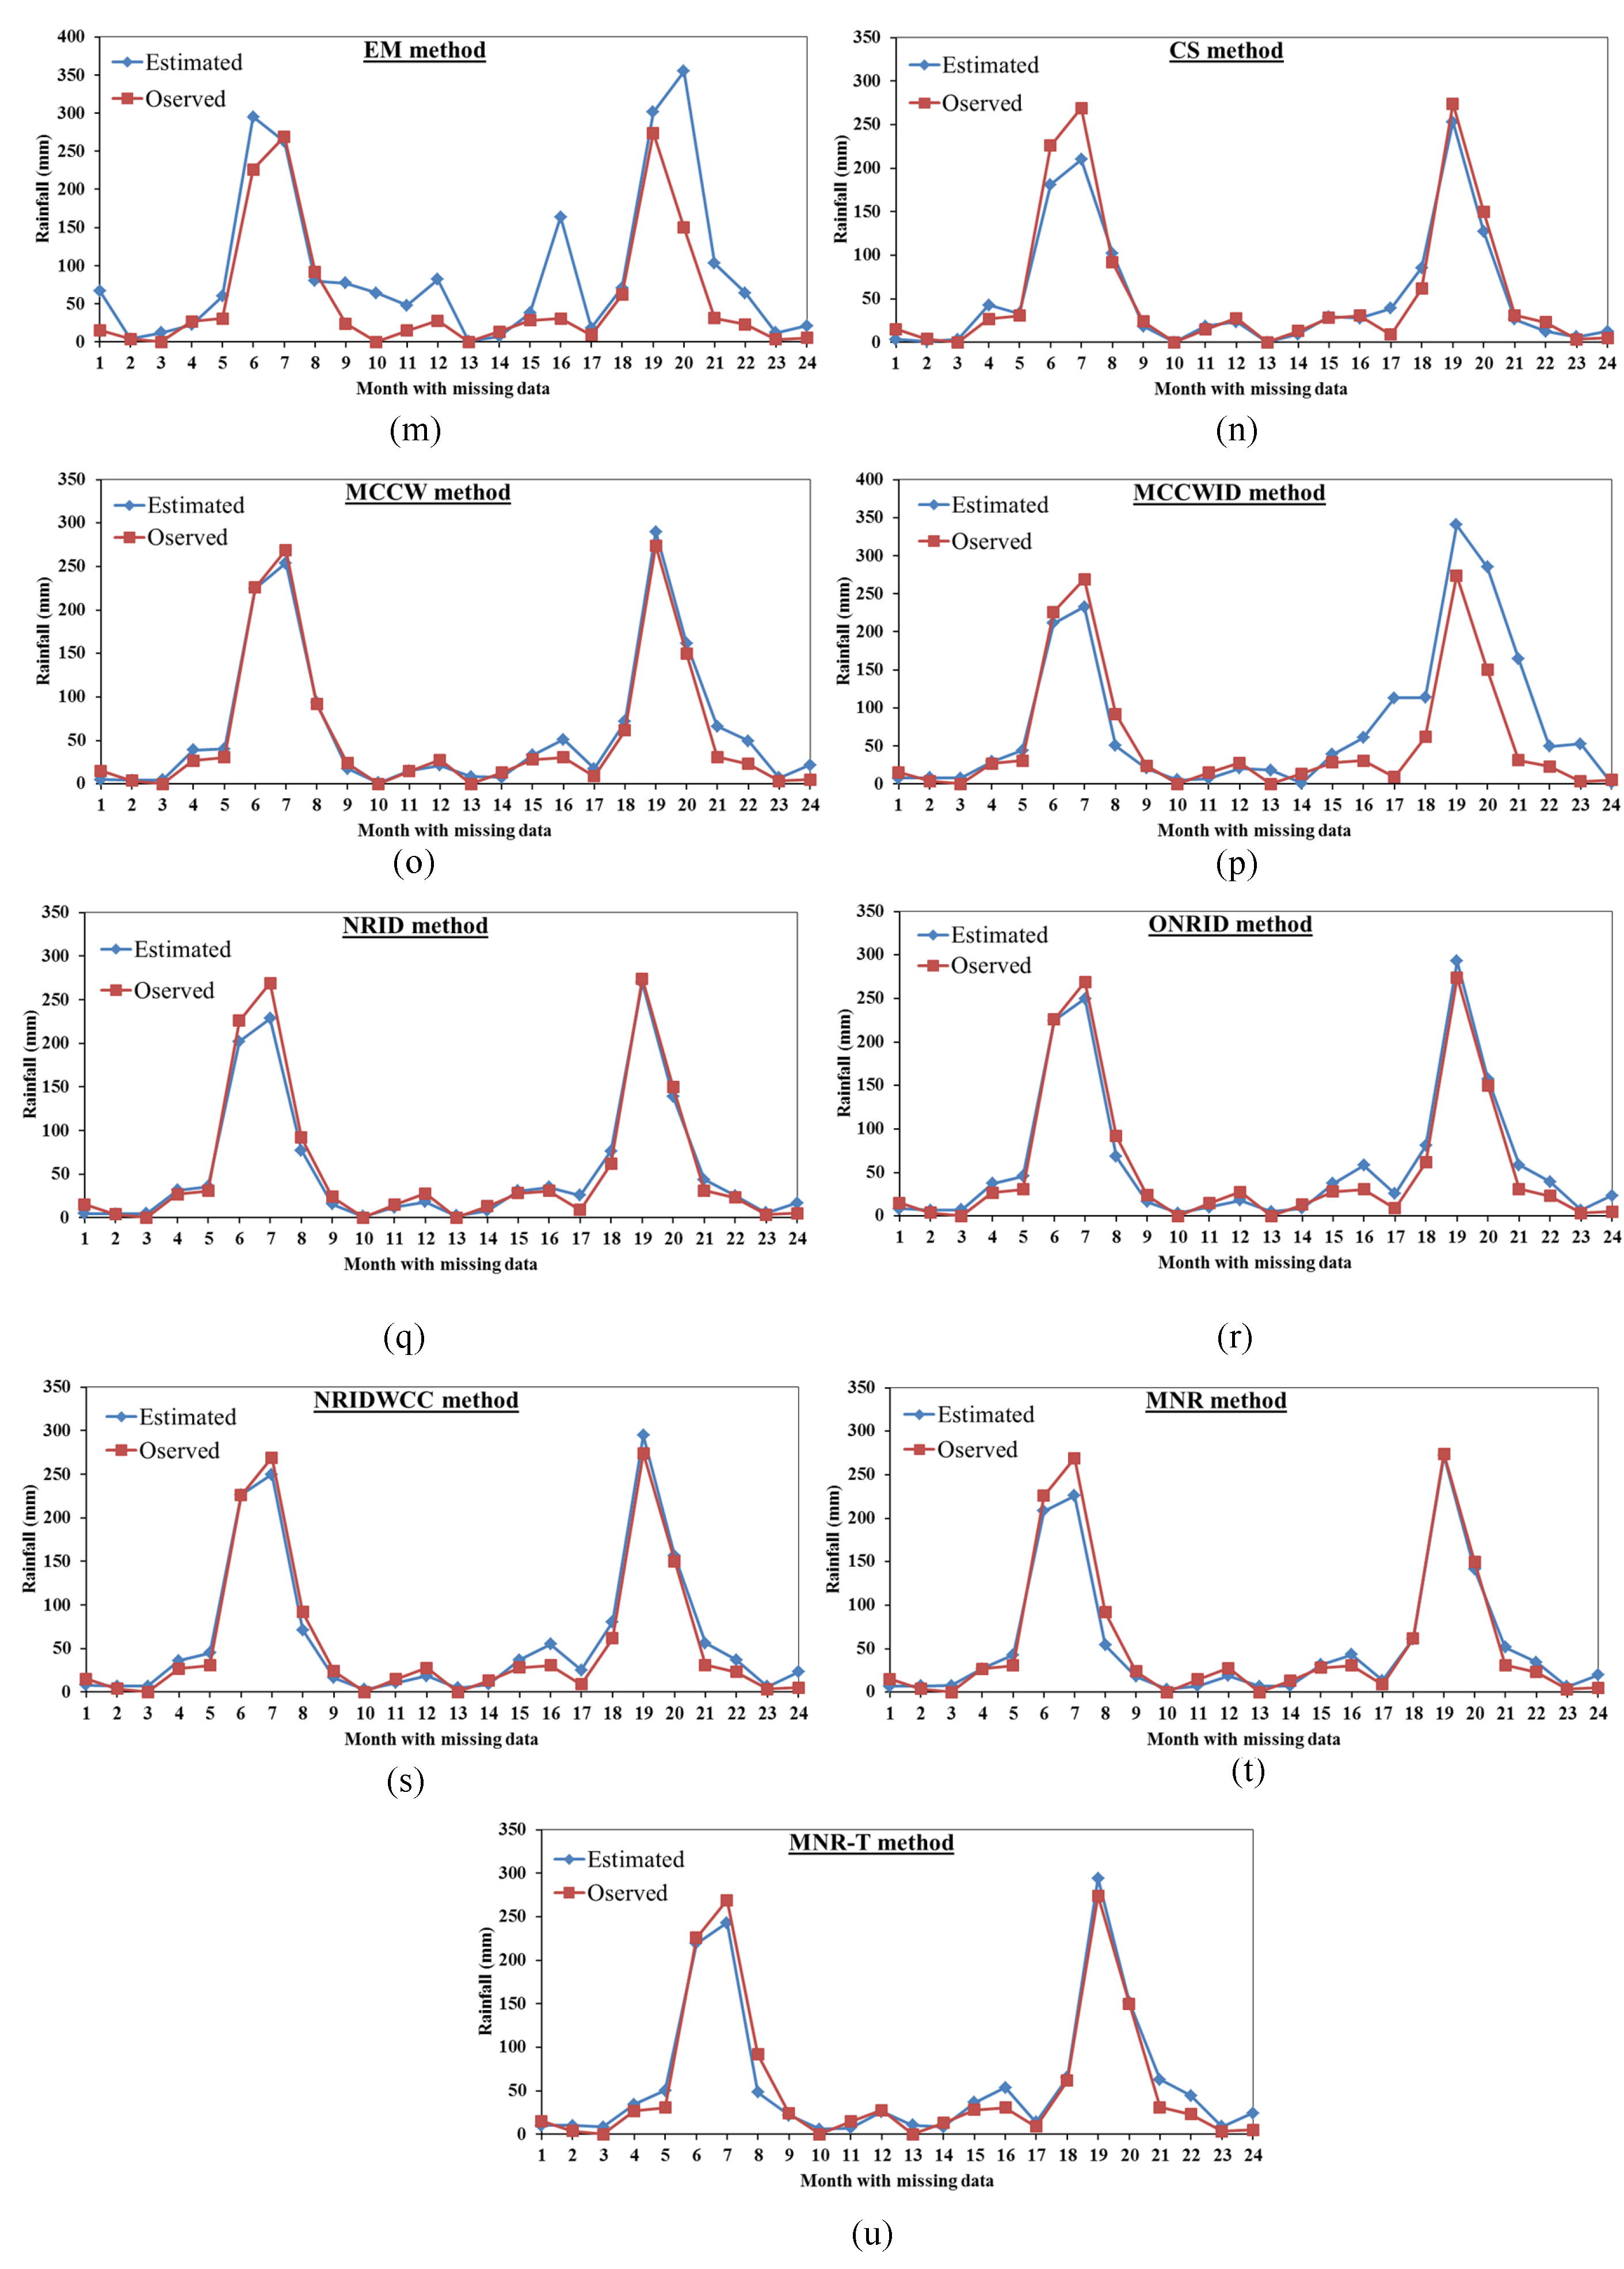
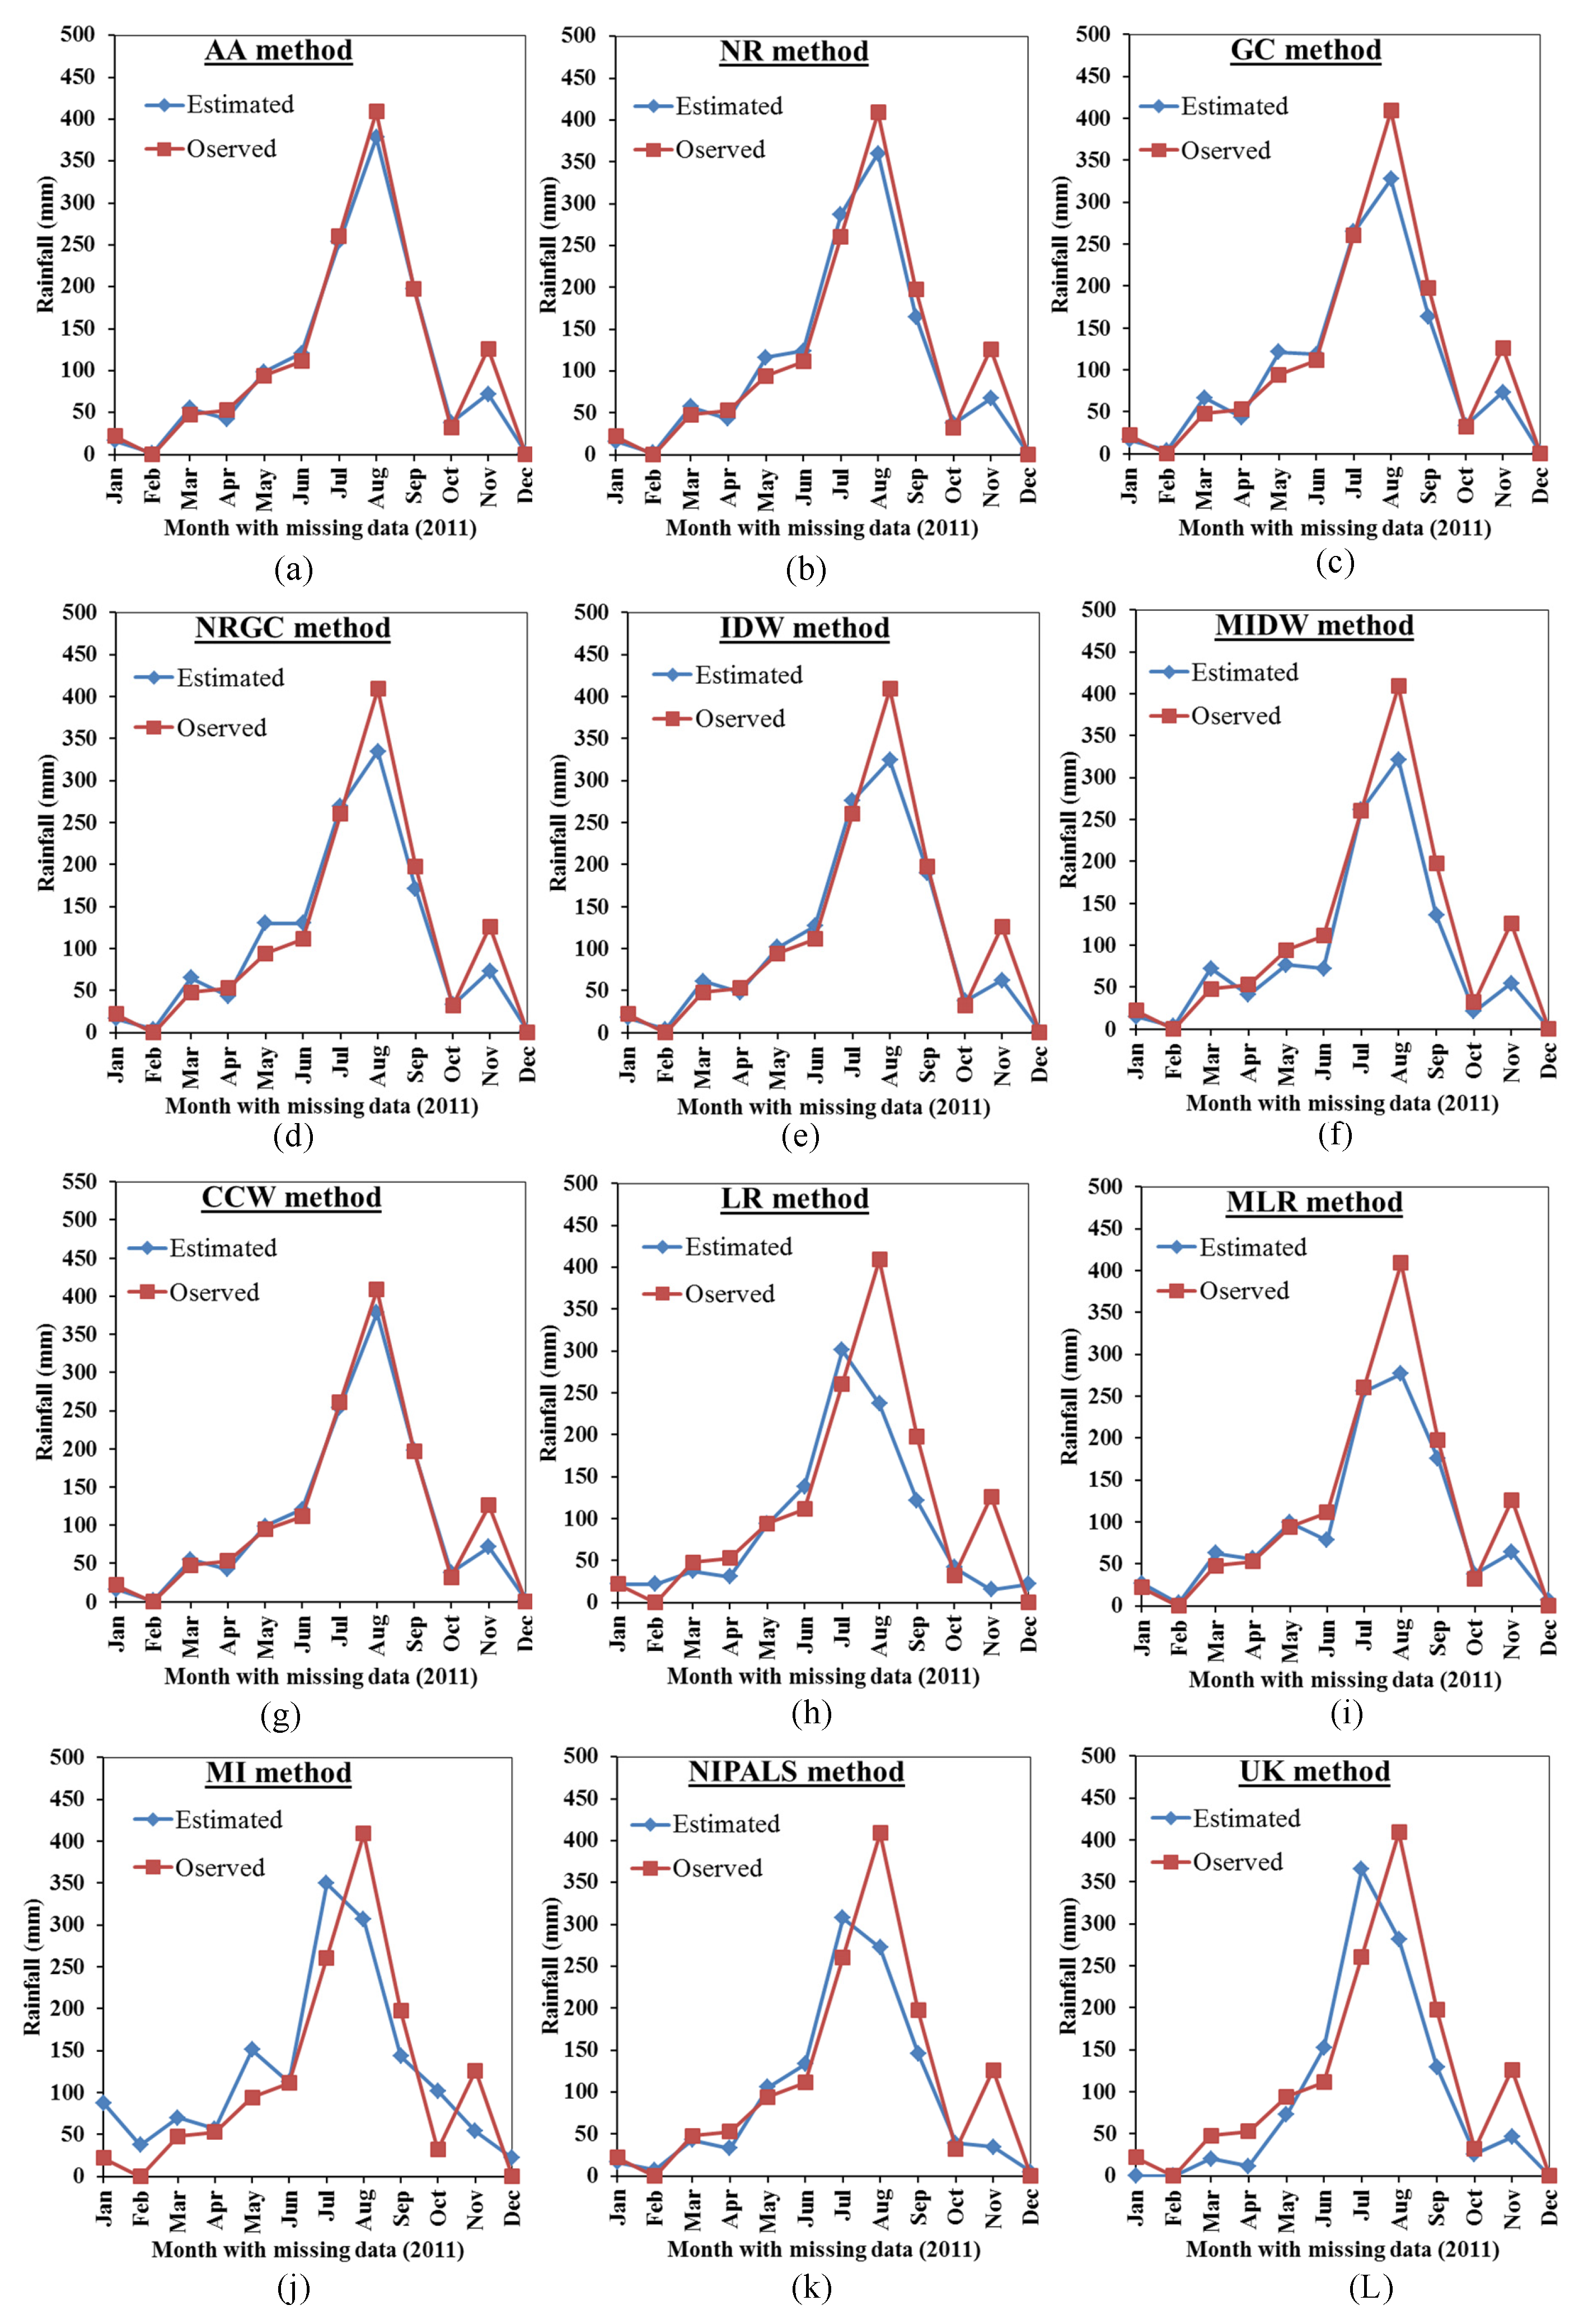
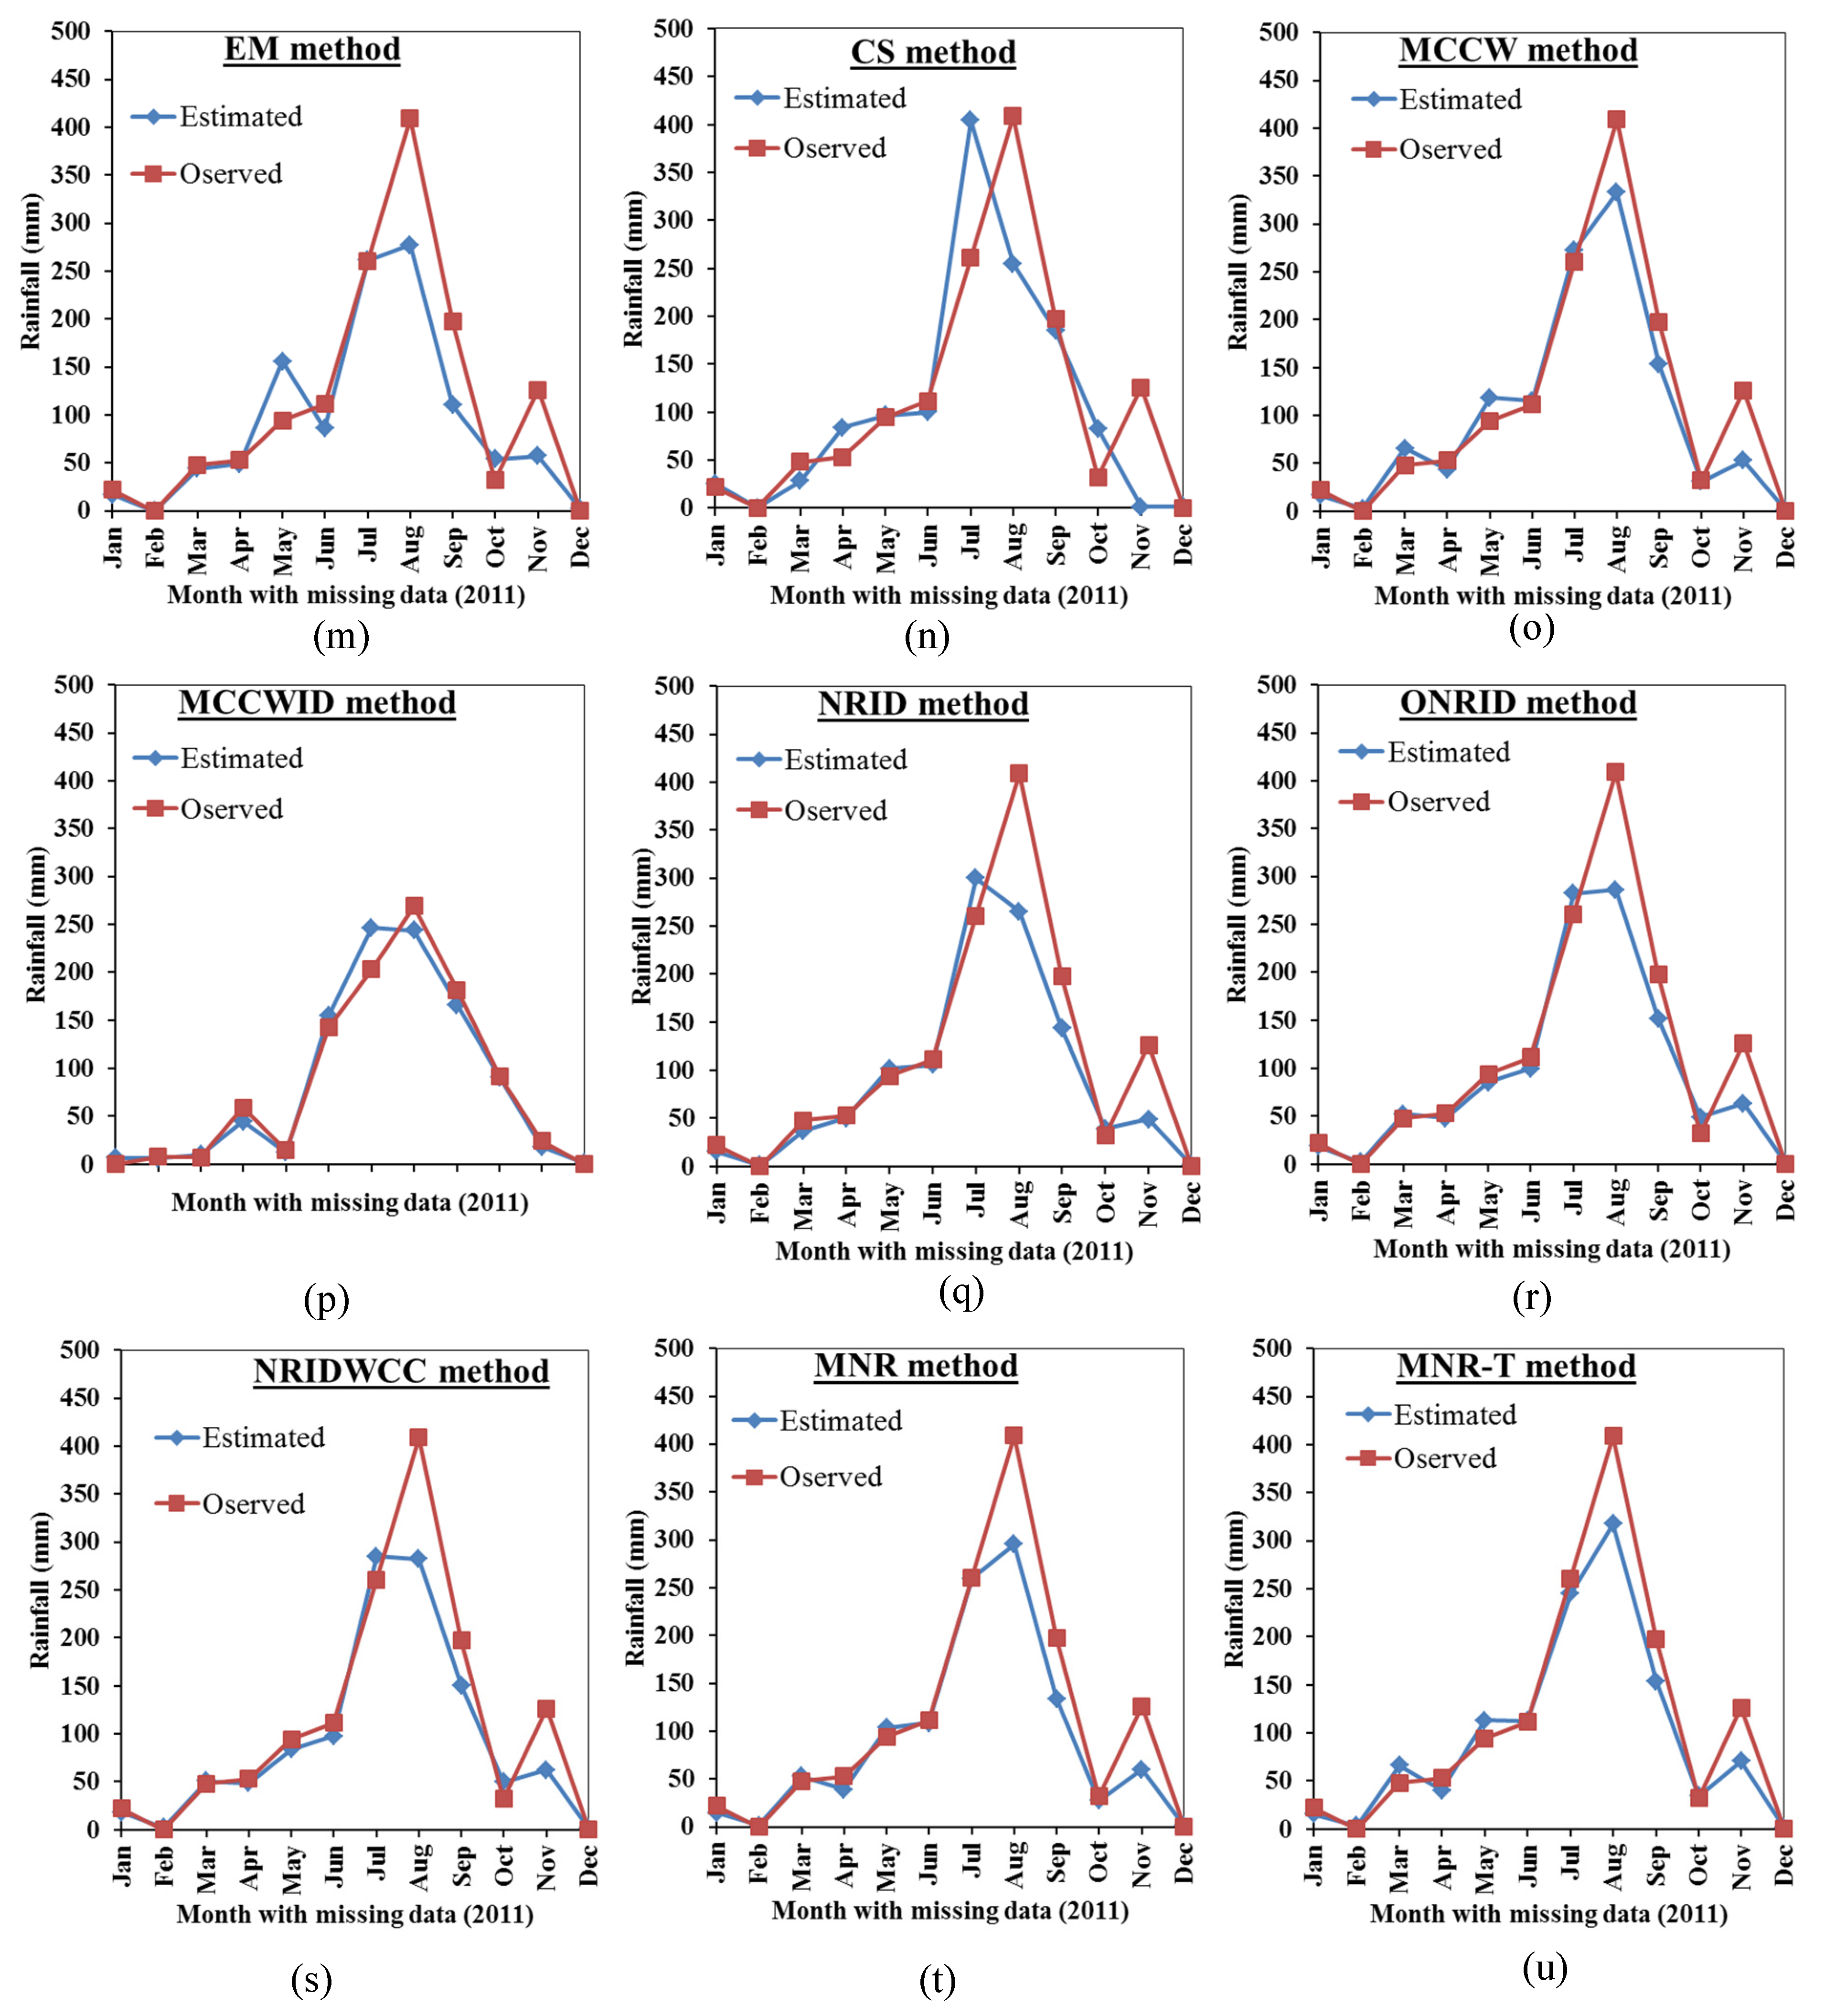
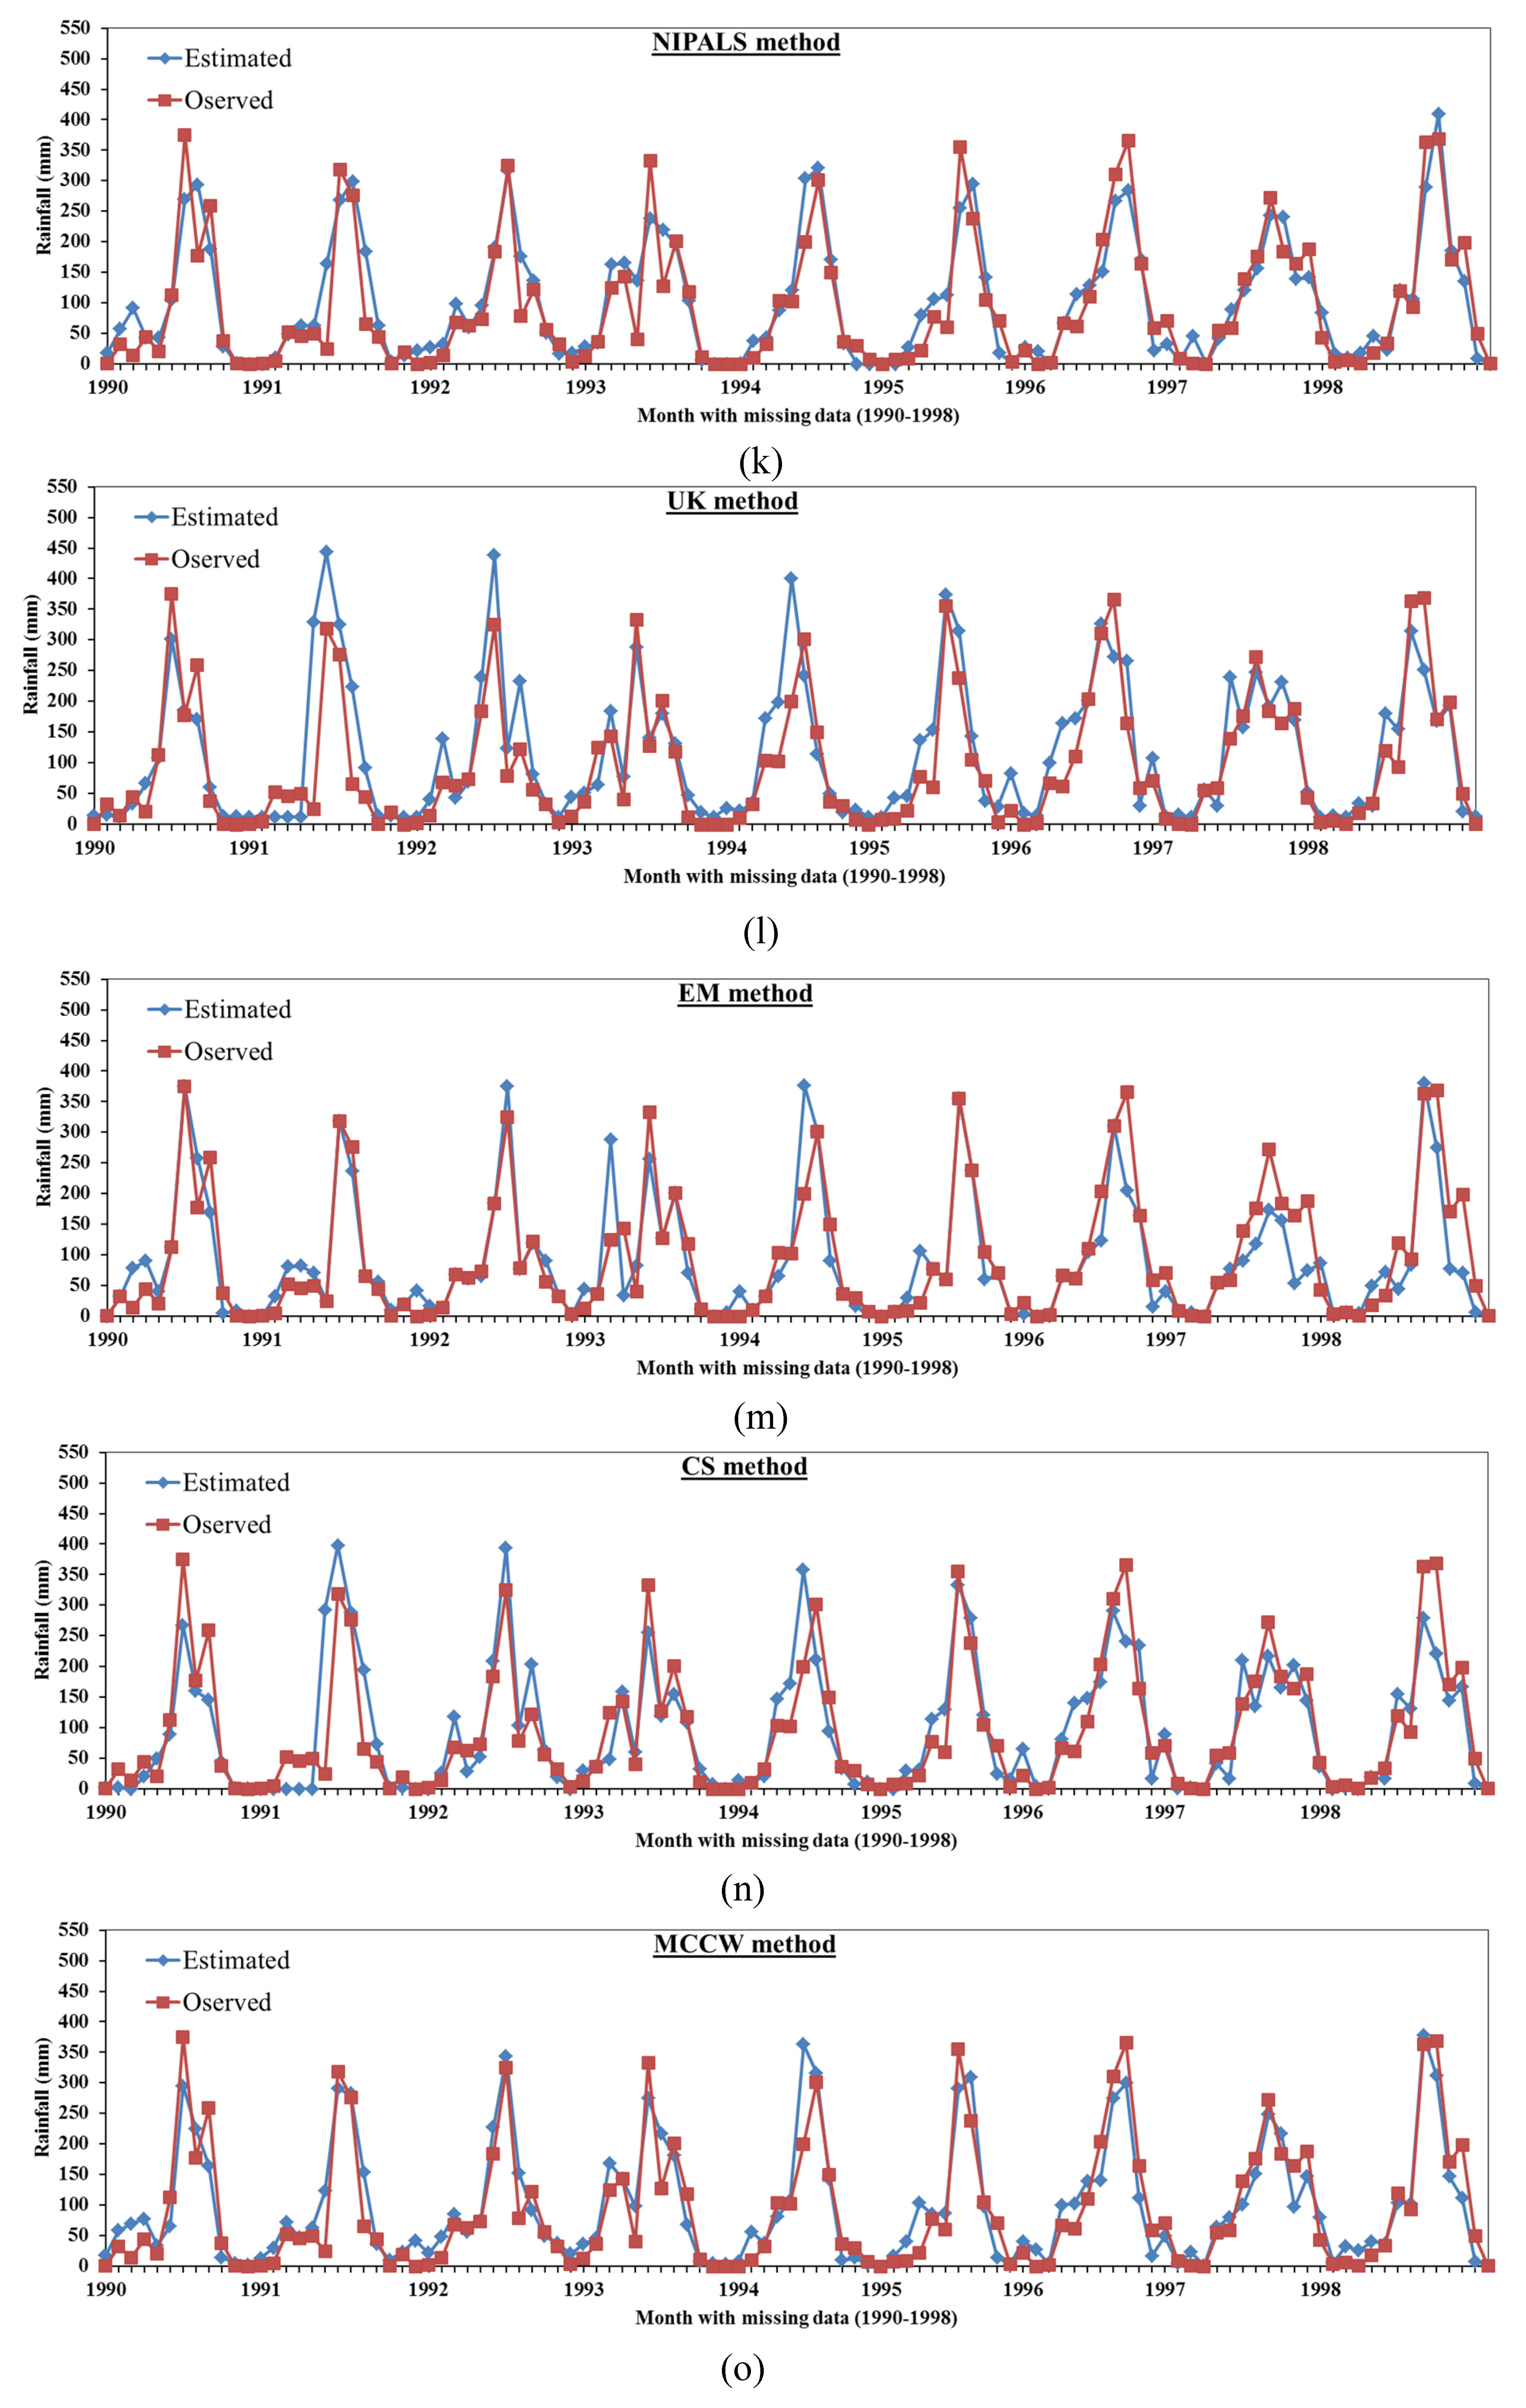
Time series charts and scatter diagrams comparing the observed and estimated values of precipitation are shown in Figure 2, Figure 3 and Figure 4. Figure 2 compares the observed precipitation with the estimated values for the random missing data. The analysis of results of Table 5 indicates that the CS, EM, UK, LR, and MI methods have minimum accuracy compared with the other methods in this study. The MAE is 30.424, 31.278, 33.601, 35.785, and 47.641 mm for the CS, EM, UK, LR, and MI methods, respectively. In addition, the RMSE is 49.564, 51.453, 52.756, 54.130, and 58.765 mm for the CS, EM, UK, LR, and MI methods, respectively. The CS, UK, LR, and MI methods have the lowest accuracy, which may be related to the nature of these statistical methods, i.e., a small number of stations are included that have the minimum correlation with the target station. It can be seen from Figure 2 that the estimated precipitation values are close to the observed value for the NR, MLR, IDW, CCW, and AA methods. On the other hand, the CS, EM, UK, LR, and MI methods show the lowest accuracy where the estimated values do not match well the observed values. The results of Figure 2 confirm the analysis of statistical indices for different statistical methods in Table 5.
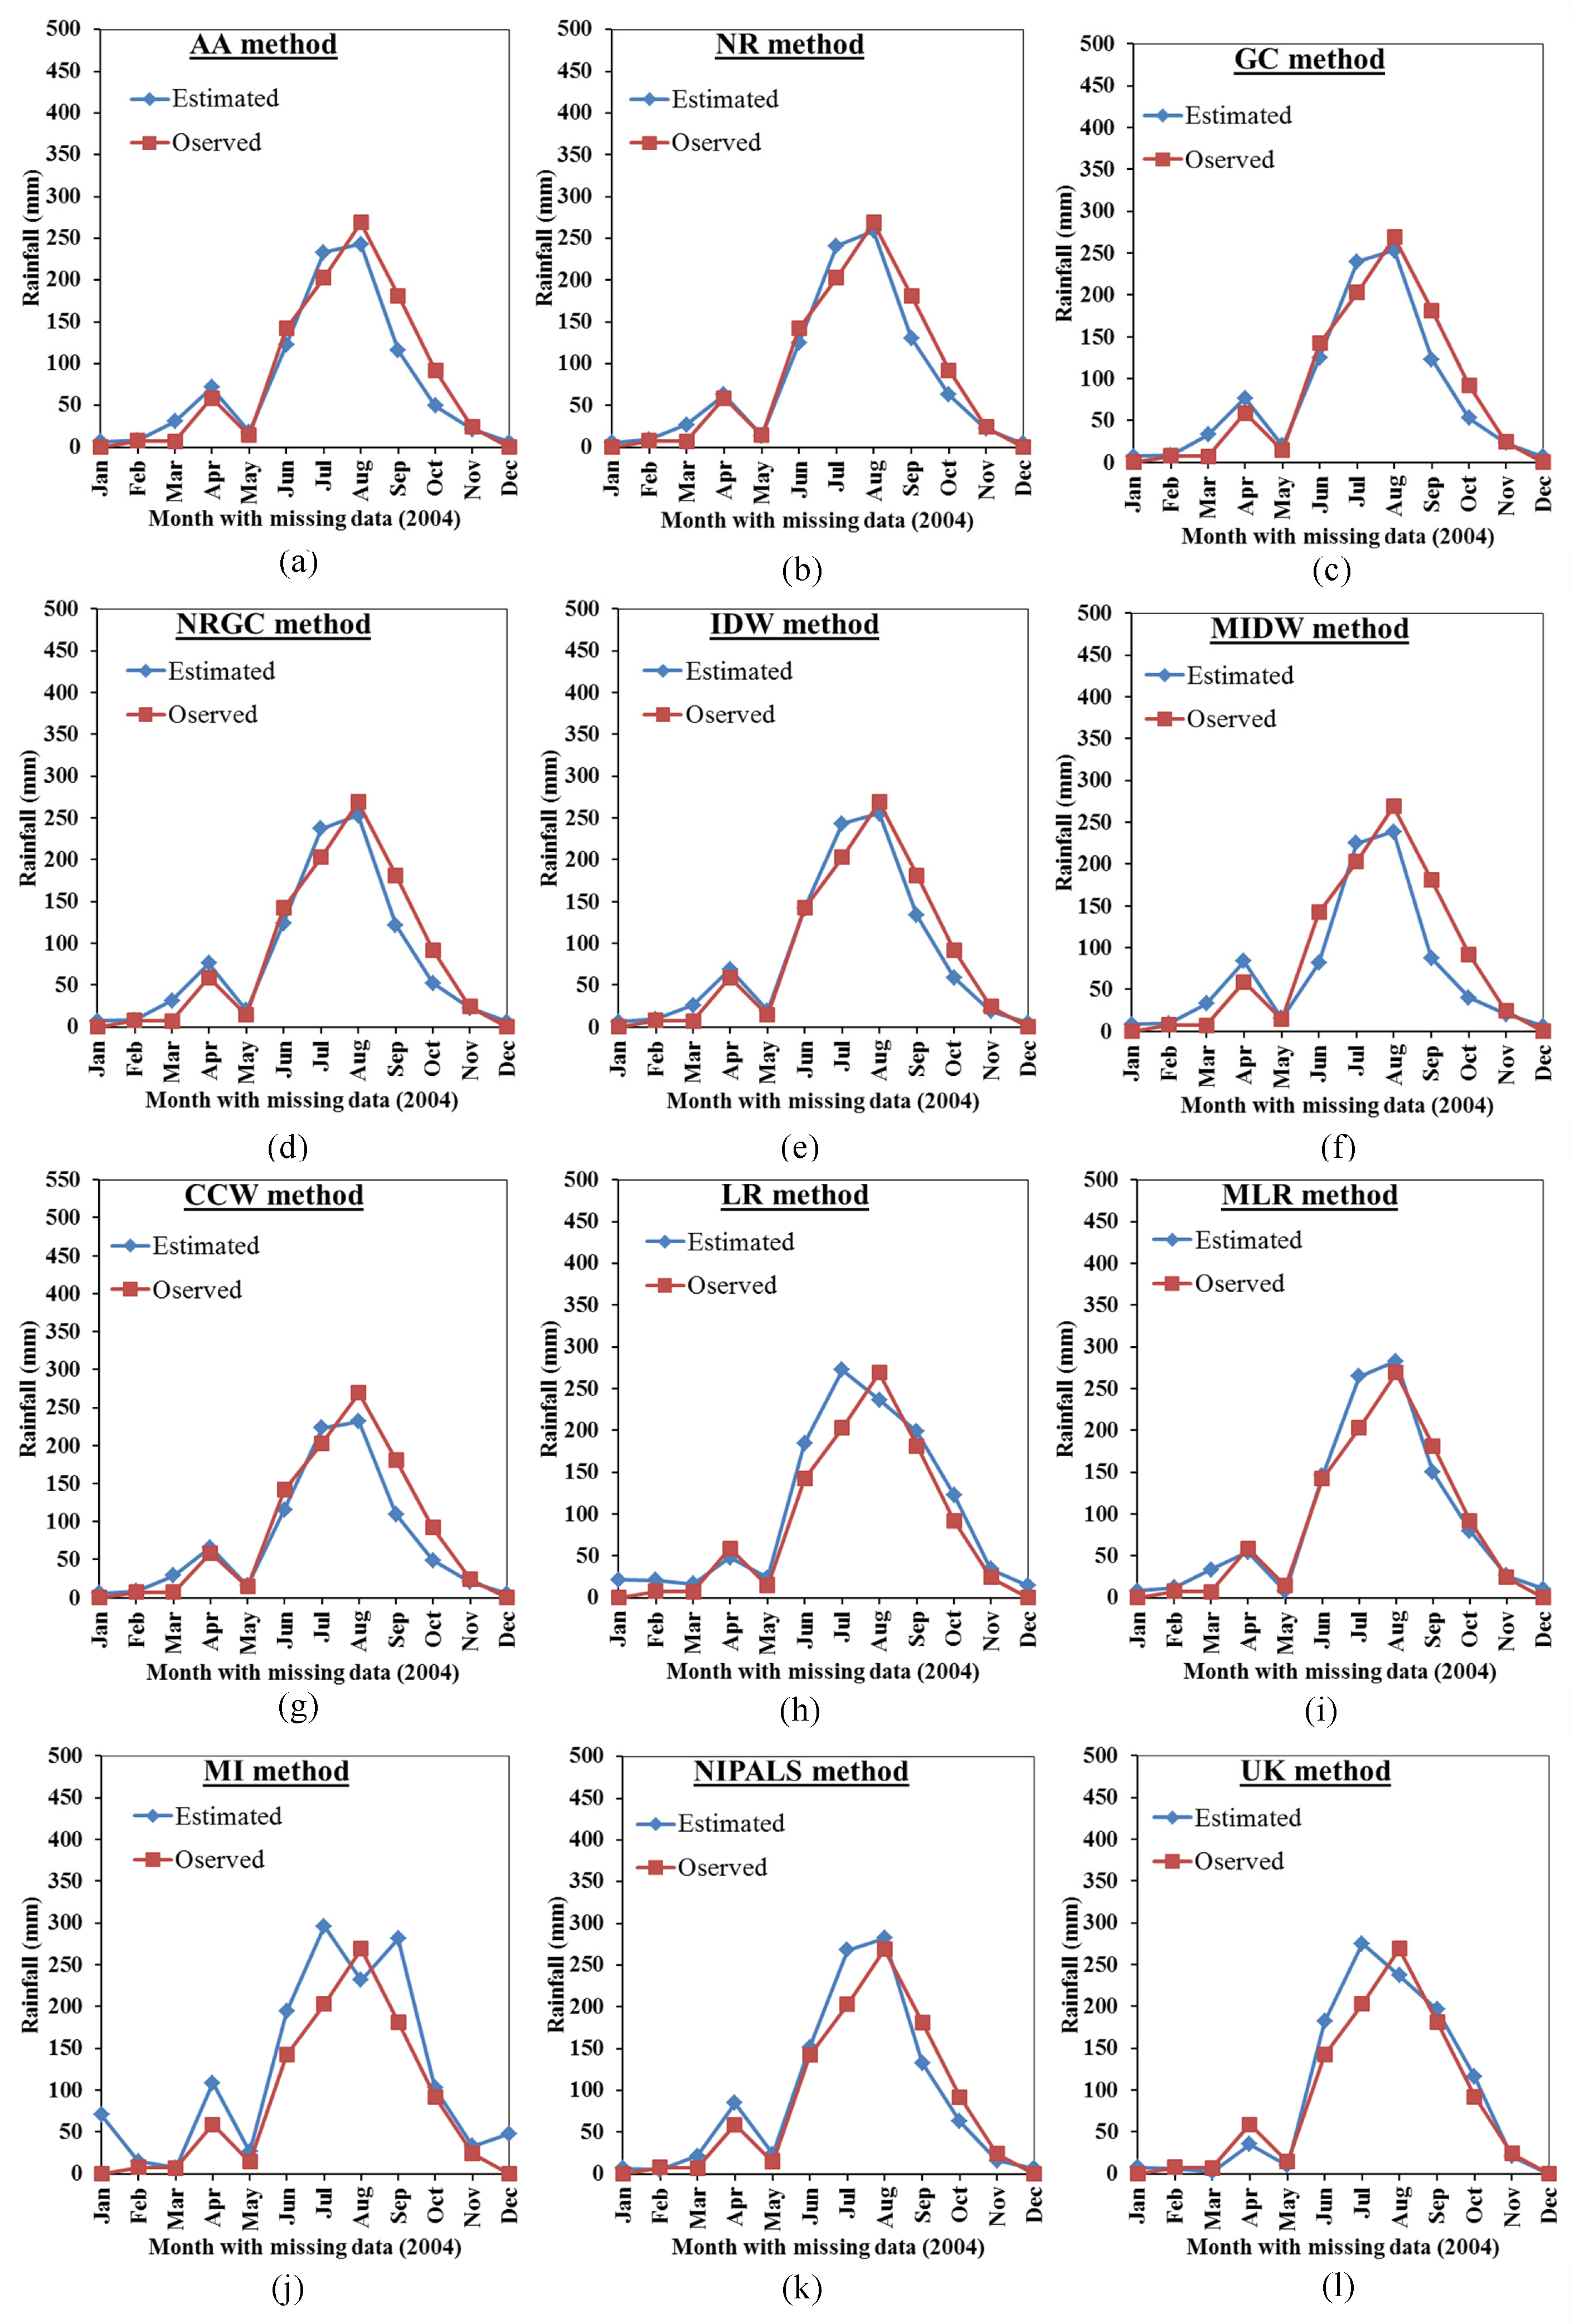
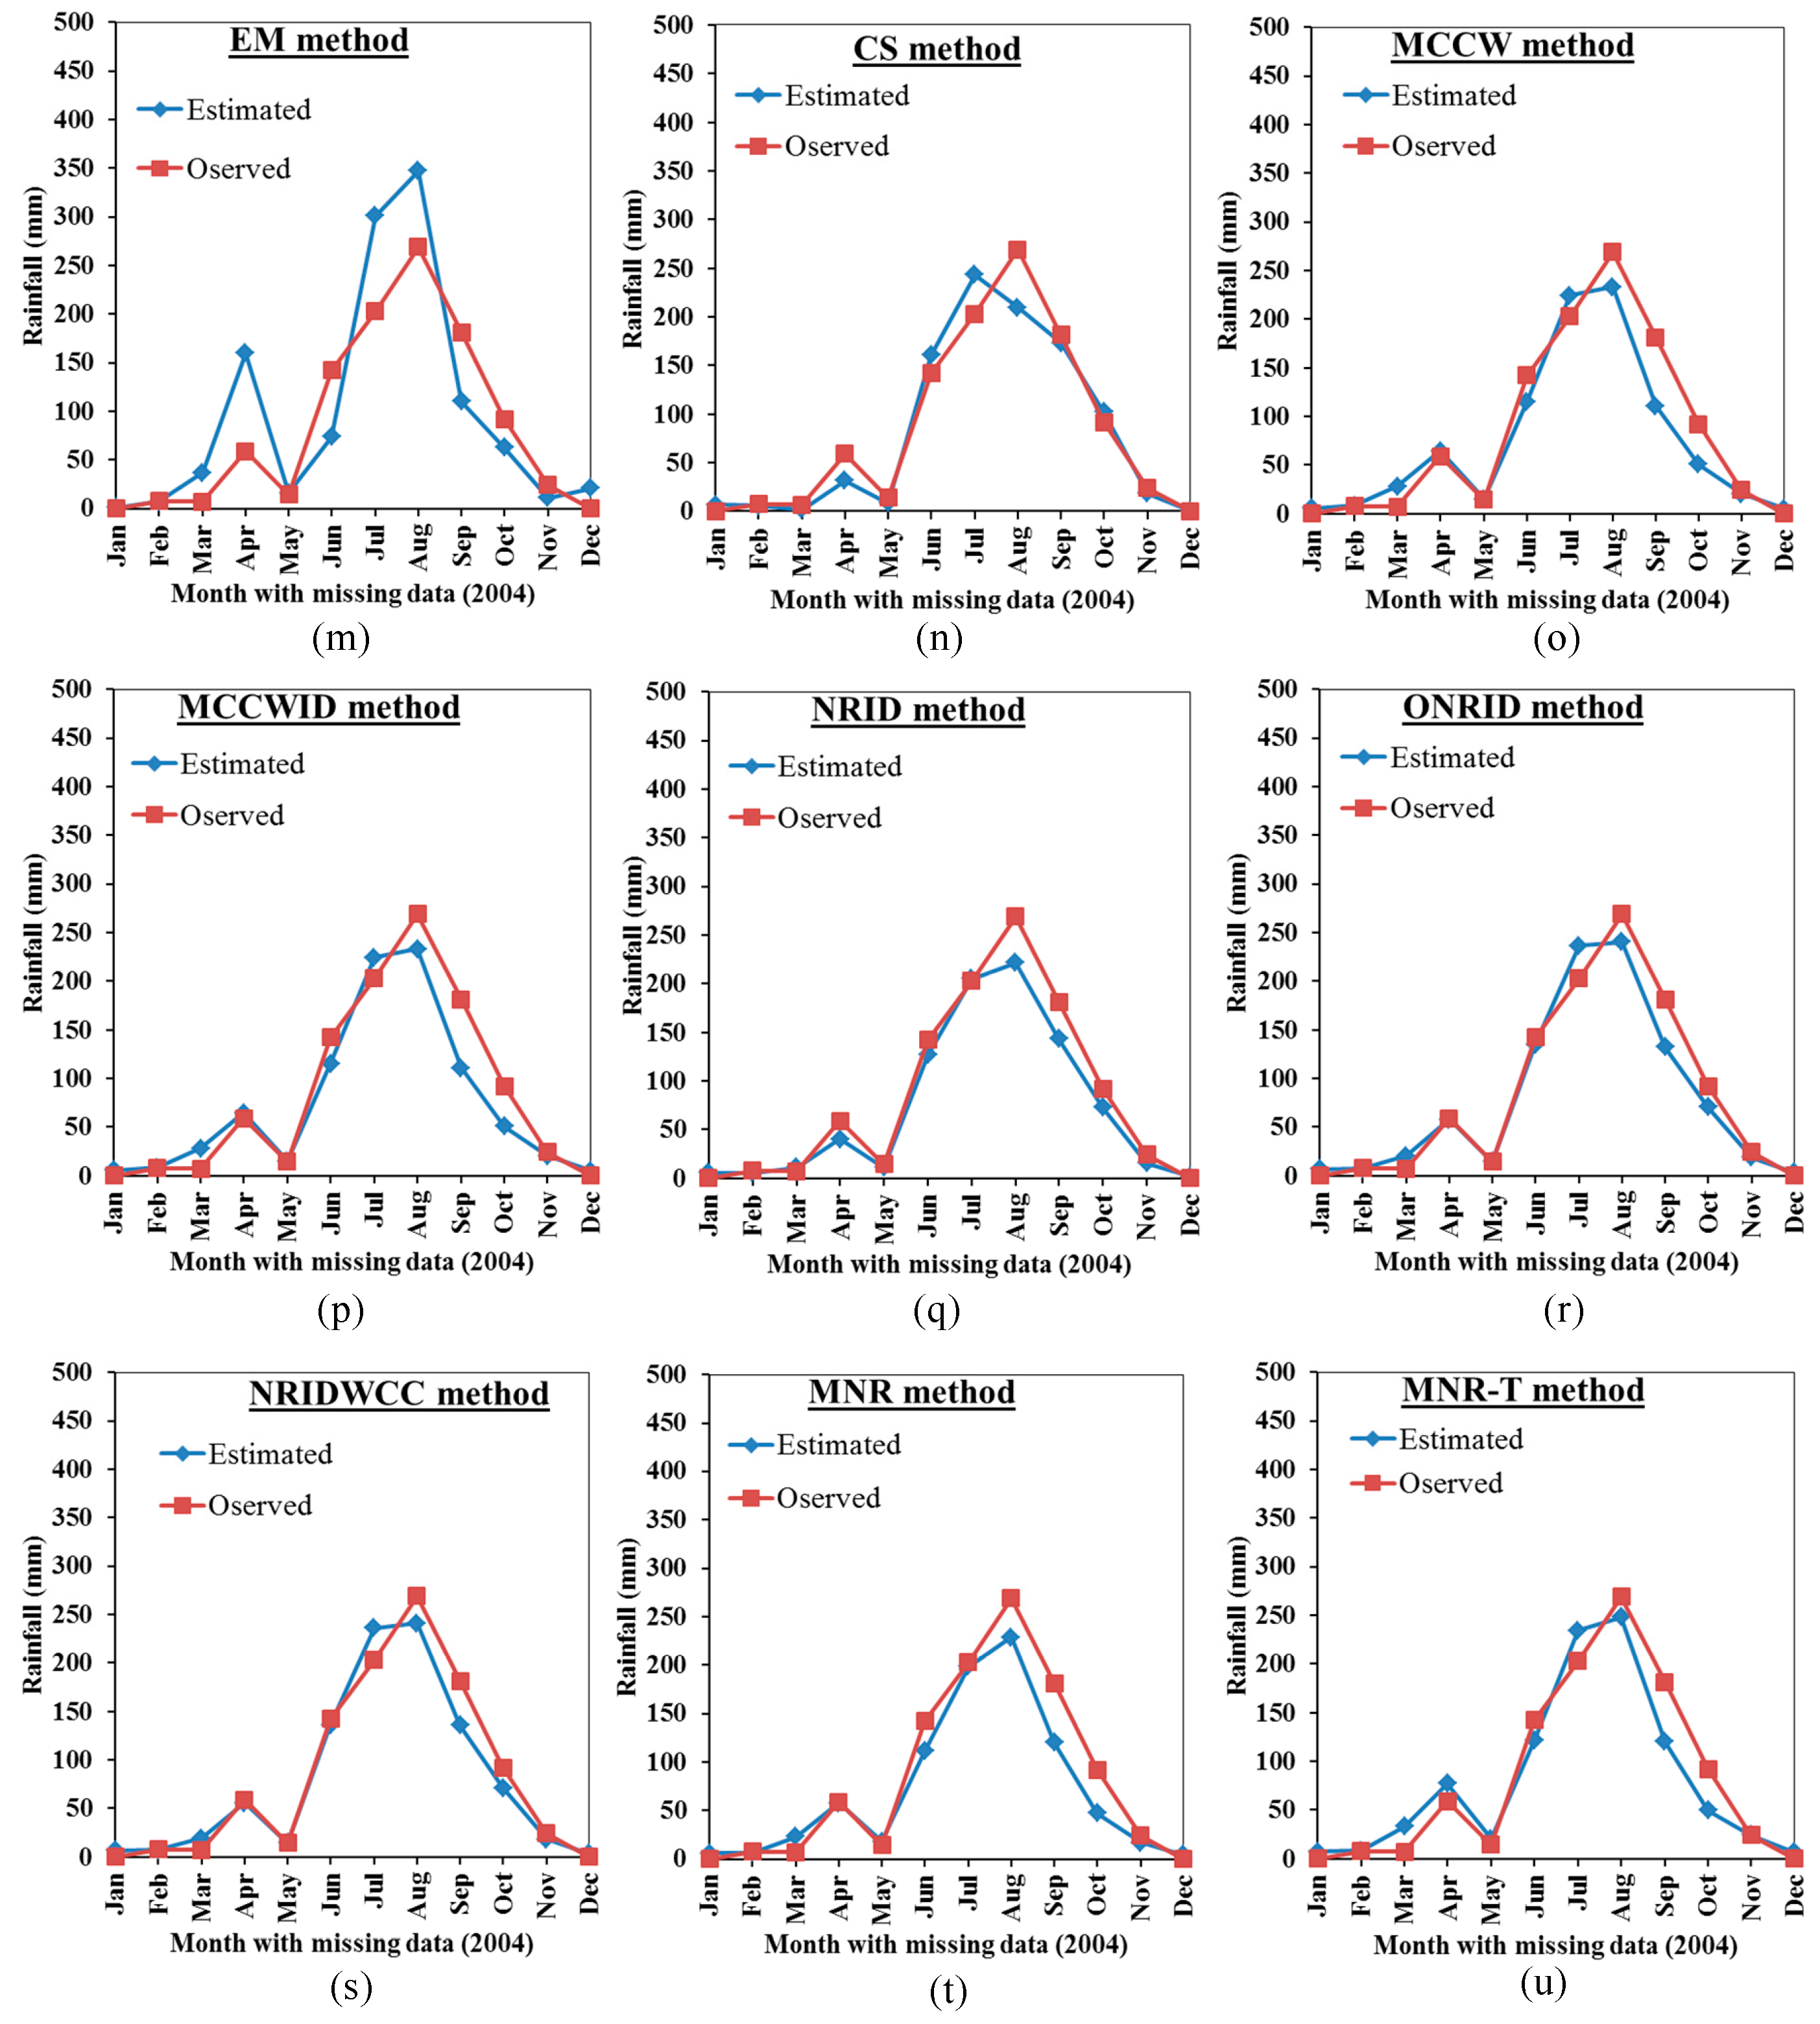
Figure 3 shows the results compared between the observed and estimated precipitation in respect to the monthly data of the year 2004 using the 21 different statistical methods. It can be seen that the estimated precipitation values almost match well with the observed values for the NR, MLR, IDW, MNR, NRGC, CCW, and AA methods. The MAE between the observed and estimated monthly precipitation for the year 2011 equals 15.274, 15.414, 15.506, 18.415, 19.108, 20.063, and 20.383 mm for the NR, MLR, IDW, MNR, NRGC, CCW, and AA methods respectively, while the RMSE equals 21.879, 22.468, 21.828, 26.935, 25.569, 27.269, and 28.975 mm for the same methods, respectively. The results of NR, MLR, IDW, MNR, NRGC, CCW, and AA appear to be more reliable and accurate compared with other methods. The correlation coefficients between the estimated and observed precipitation equal 0.970, 0.974, 0.970, 0.976, 0.959, 0.956, and 0.957 for NR, MLR, IDW, MNR, NRGC, CCW, and AA, respectively. On the other hand, the results of UK, LR, MI, and EM show the lowest accuracy as the monthly estimated values do not match the observed values. The MAE of the UK, LR, MI, and EM methods equals 18.867, 23.411, 40.815, and 42.675 mm, with RMSE equal to 27.728, 29.056, 52.354, and 56.208 mm, respectively. The results of Figure 4, for comparison between estimated monthly data with observed values for the year 2004, confirm the results of Figure 2 for estimating random missing data and the analysis of Table 5.
Figure 4 shows the compared results between the observed and estimated precipitation in respect to the monthly data of the year 2011 using the 21 different statistical methods. It can be seen that the estimated precipitation values almost match well with the observed values for the AA, CCW, IDW, NR, NRGC, and MLR methods. The correlation coefficients between the estimated and observed precipitation equal 0.989, 0.989, 0.971, 0.976, 0.972, and 0.962 for AA, CCW, IDW, NR, NRGC, and MLR, respectively. The MAE between the observed and estimated monthly precipitation for the year 2011 equals 11.48, 11.54, 18.82, 19.55, 21.17, and 24.83 mm for the AA, CCW, IDW, NR, NRGC, and MLR methods, respectively, while the RMSE equals 18.83, 18.99, 31.77, 26.60, 30.40, and 40.05 mm for the same methods, respectively. The results of AA, CCW, IDW, NR, NRGC, and MLR appear more reliable and accurate compared with other methods. On the other hand, the results of EM, CS, LR, MI, and UK show the lowest accuracy as the monthly estimated values do not match the observed values. The MAE of the EM, CS, LR, MI, and UK methods equals 34.305, 46.20, 42.69, 49.49, and 44.808 mm with RMSE equal to 53.77, 73.03, 65.50, 58.51, and 59.98mm, respectively. The results of Figure 4, for comparison between estimated monthly data with observed values for the year 2011, confirm the results of Figure 2 and Figure 3 for estimating random missing data and the analysis of Table 5.
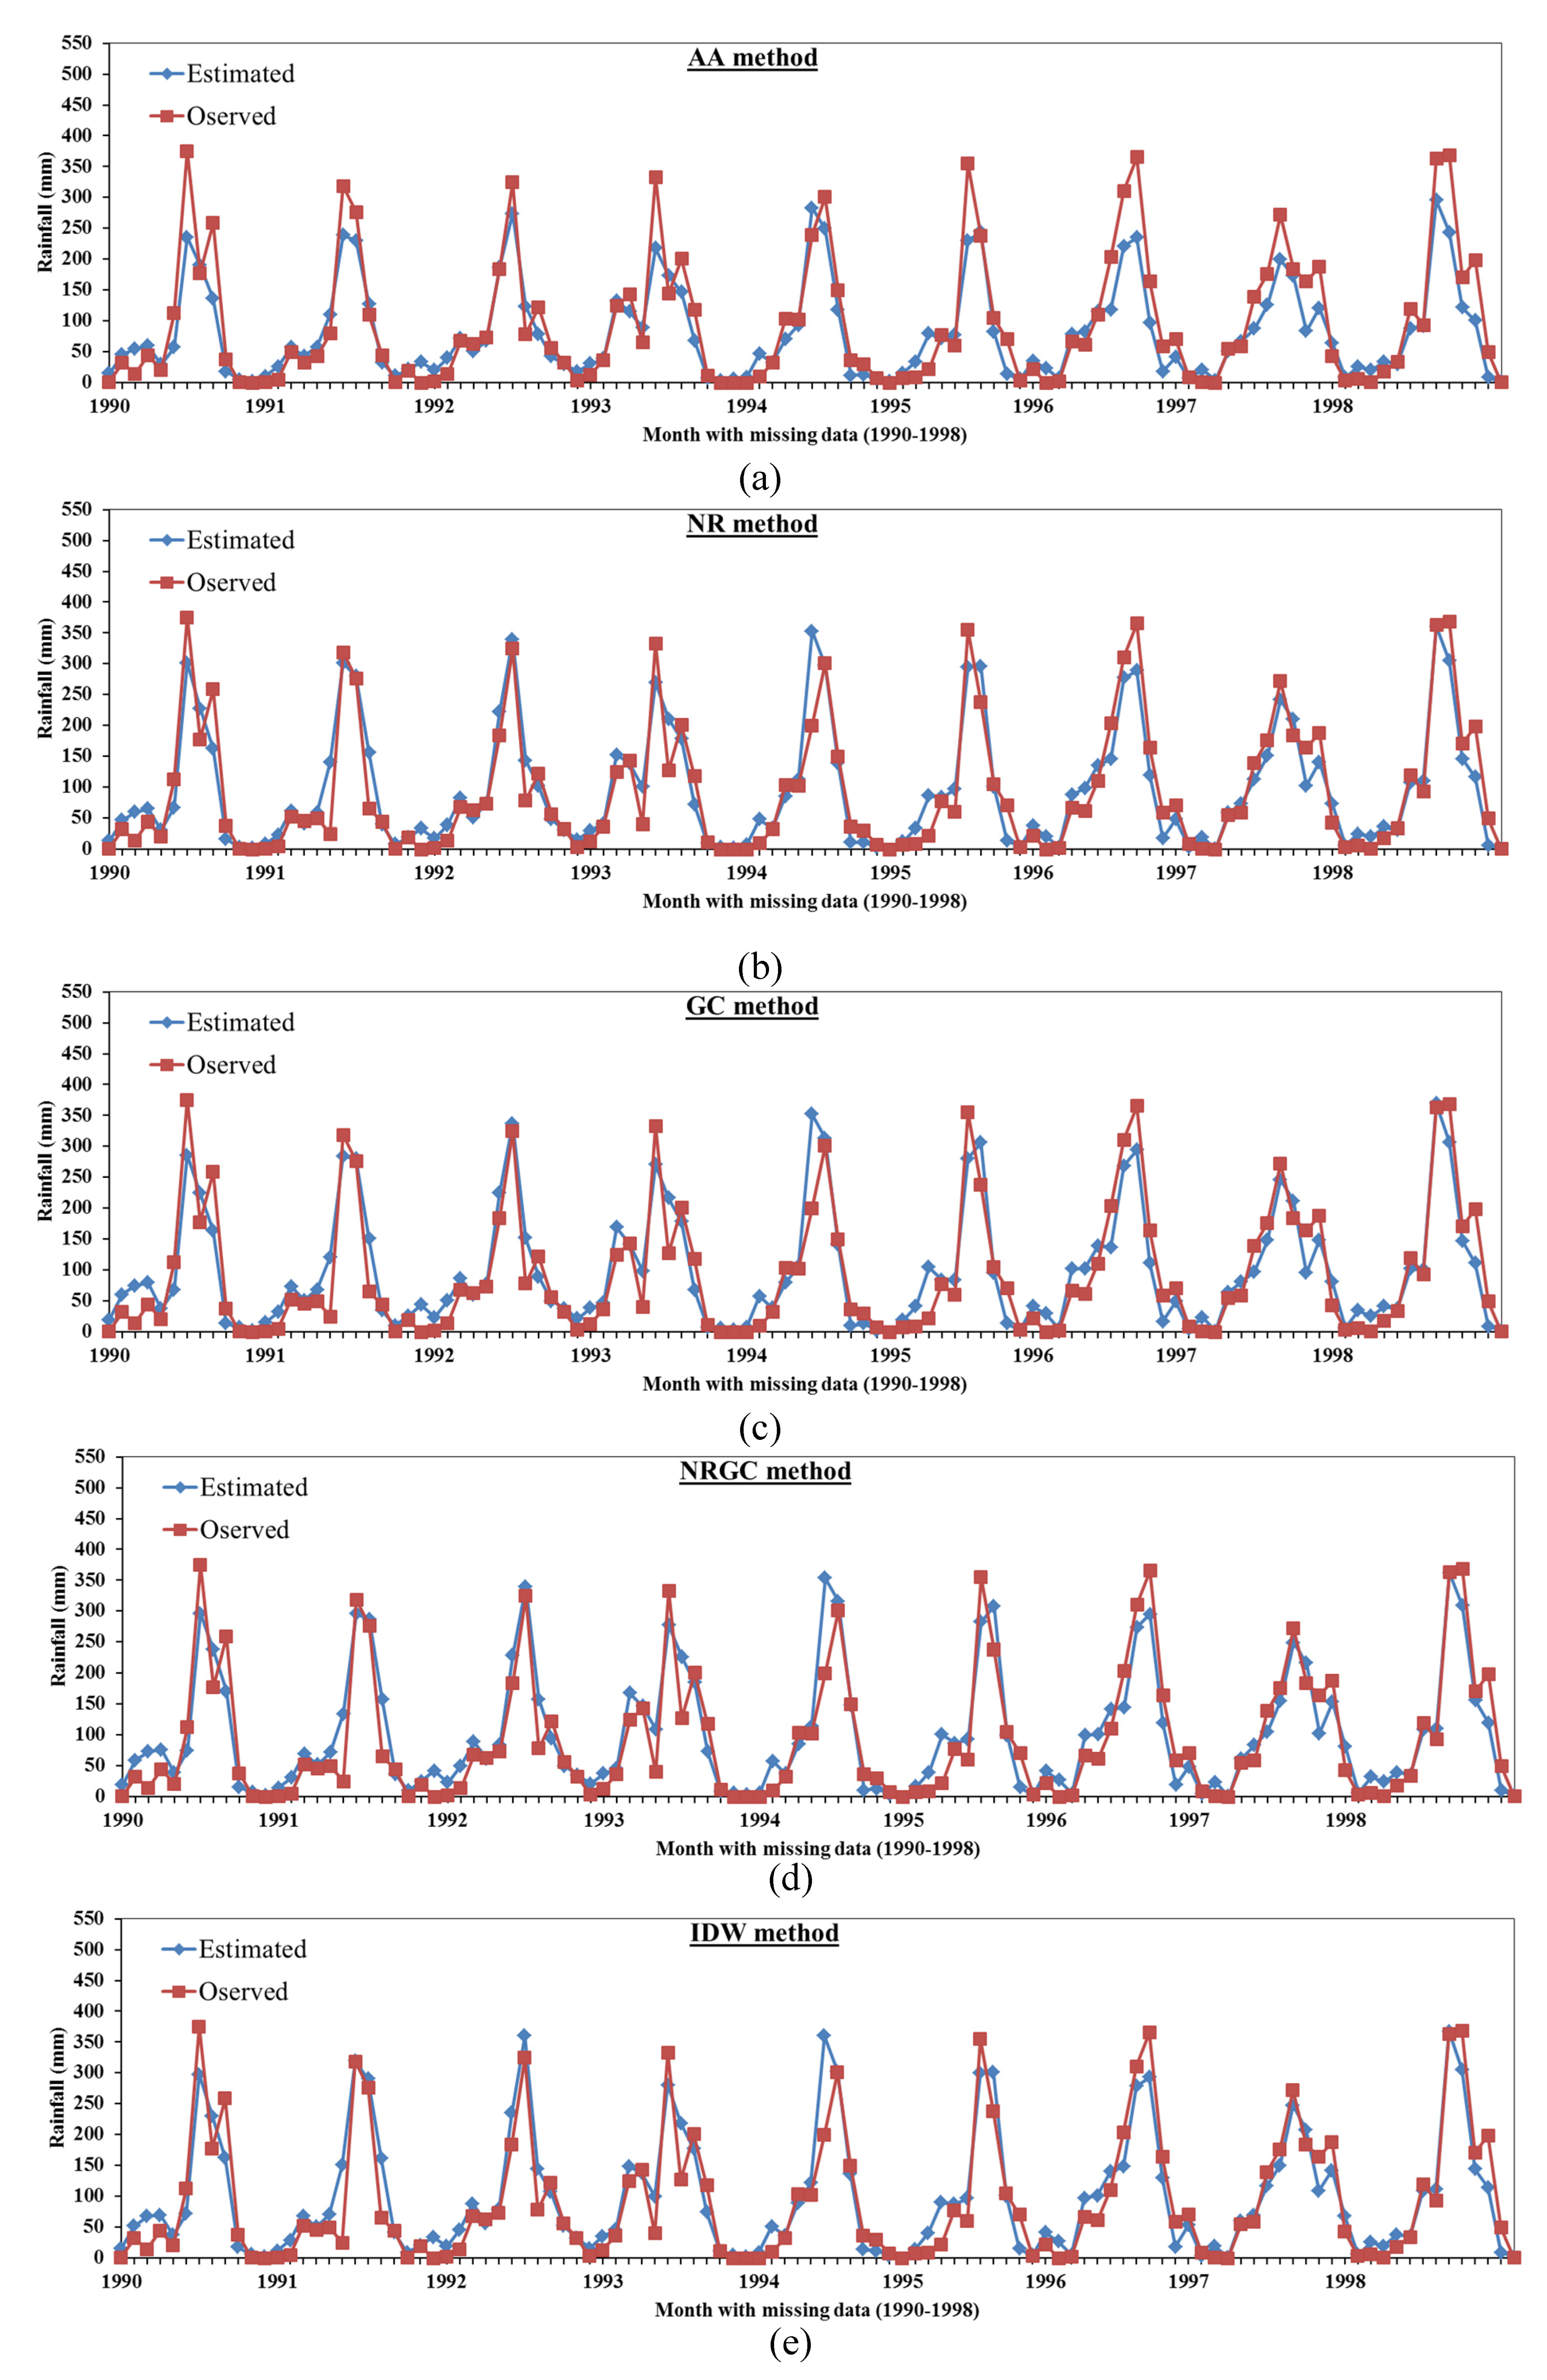
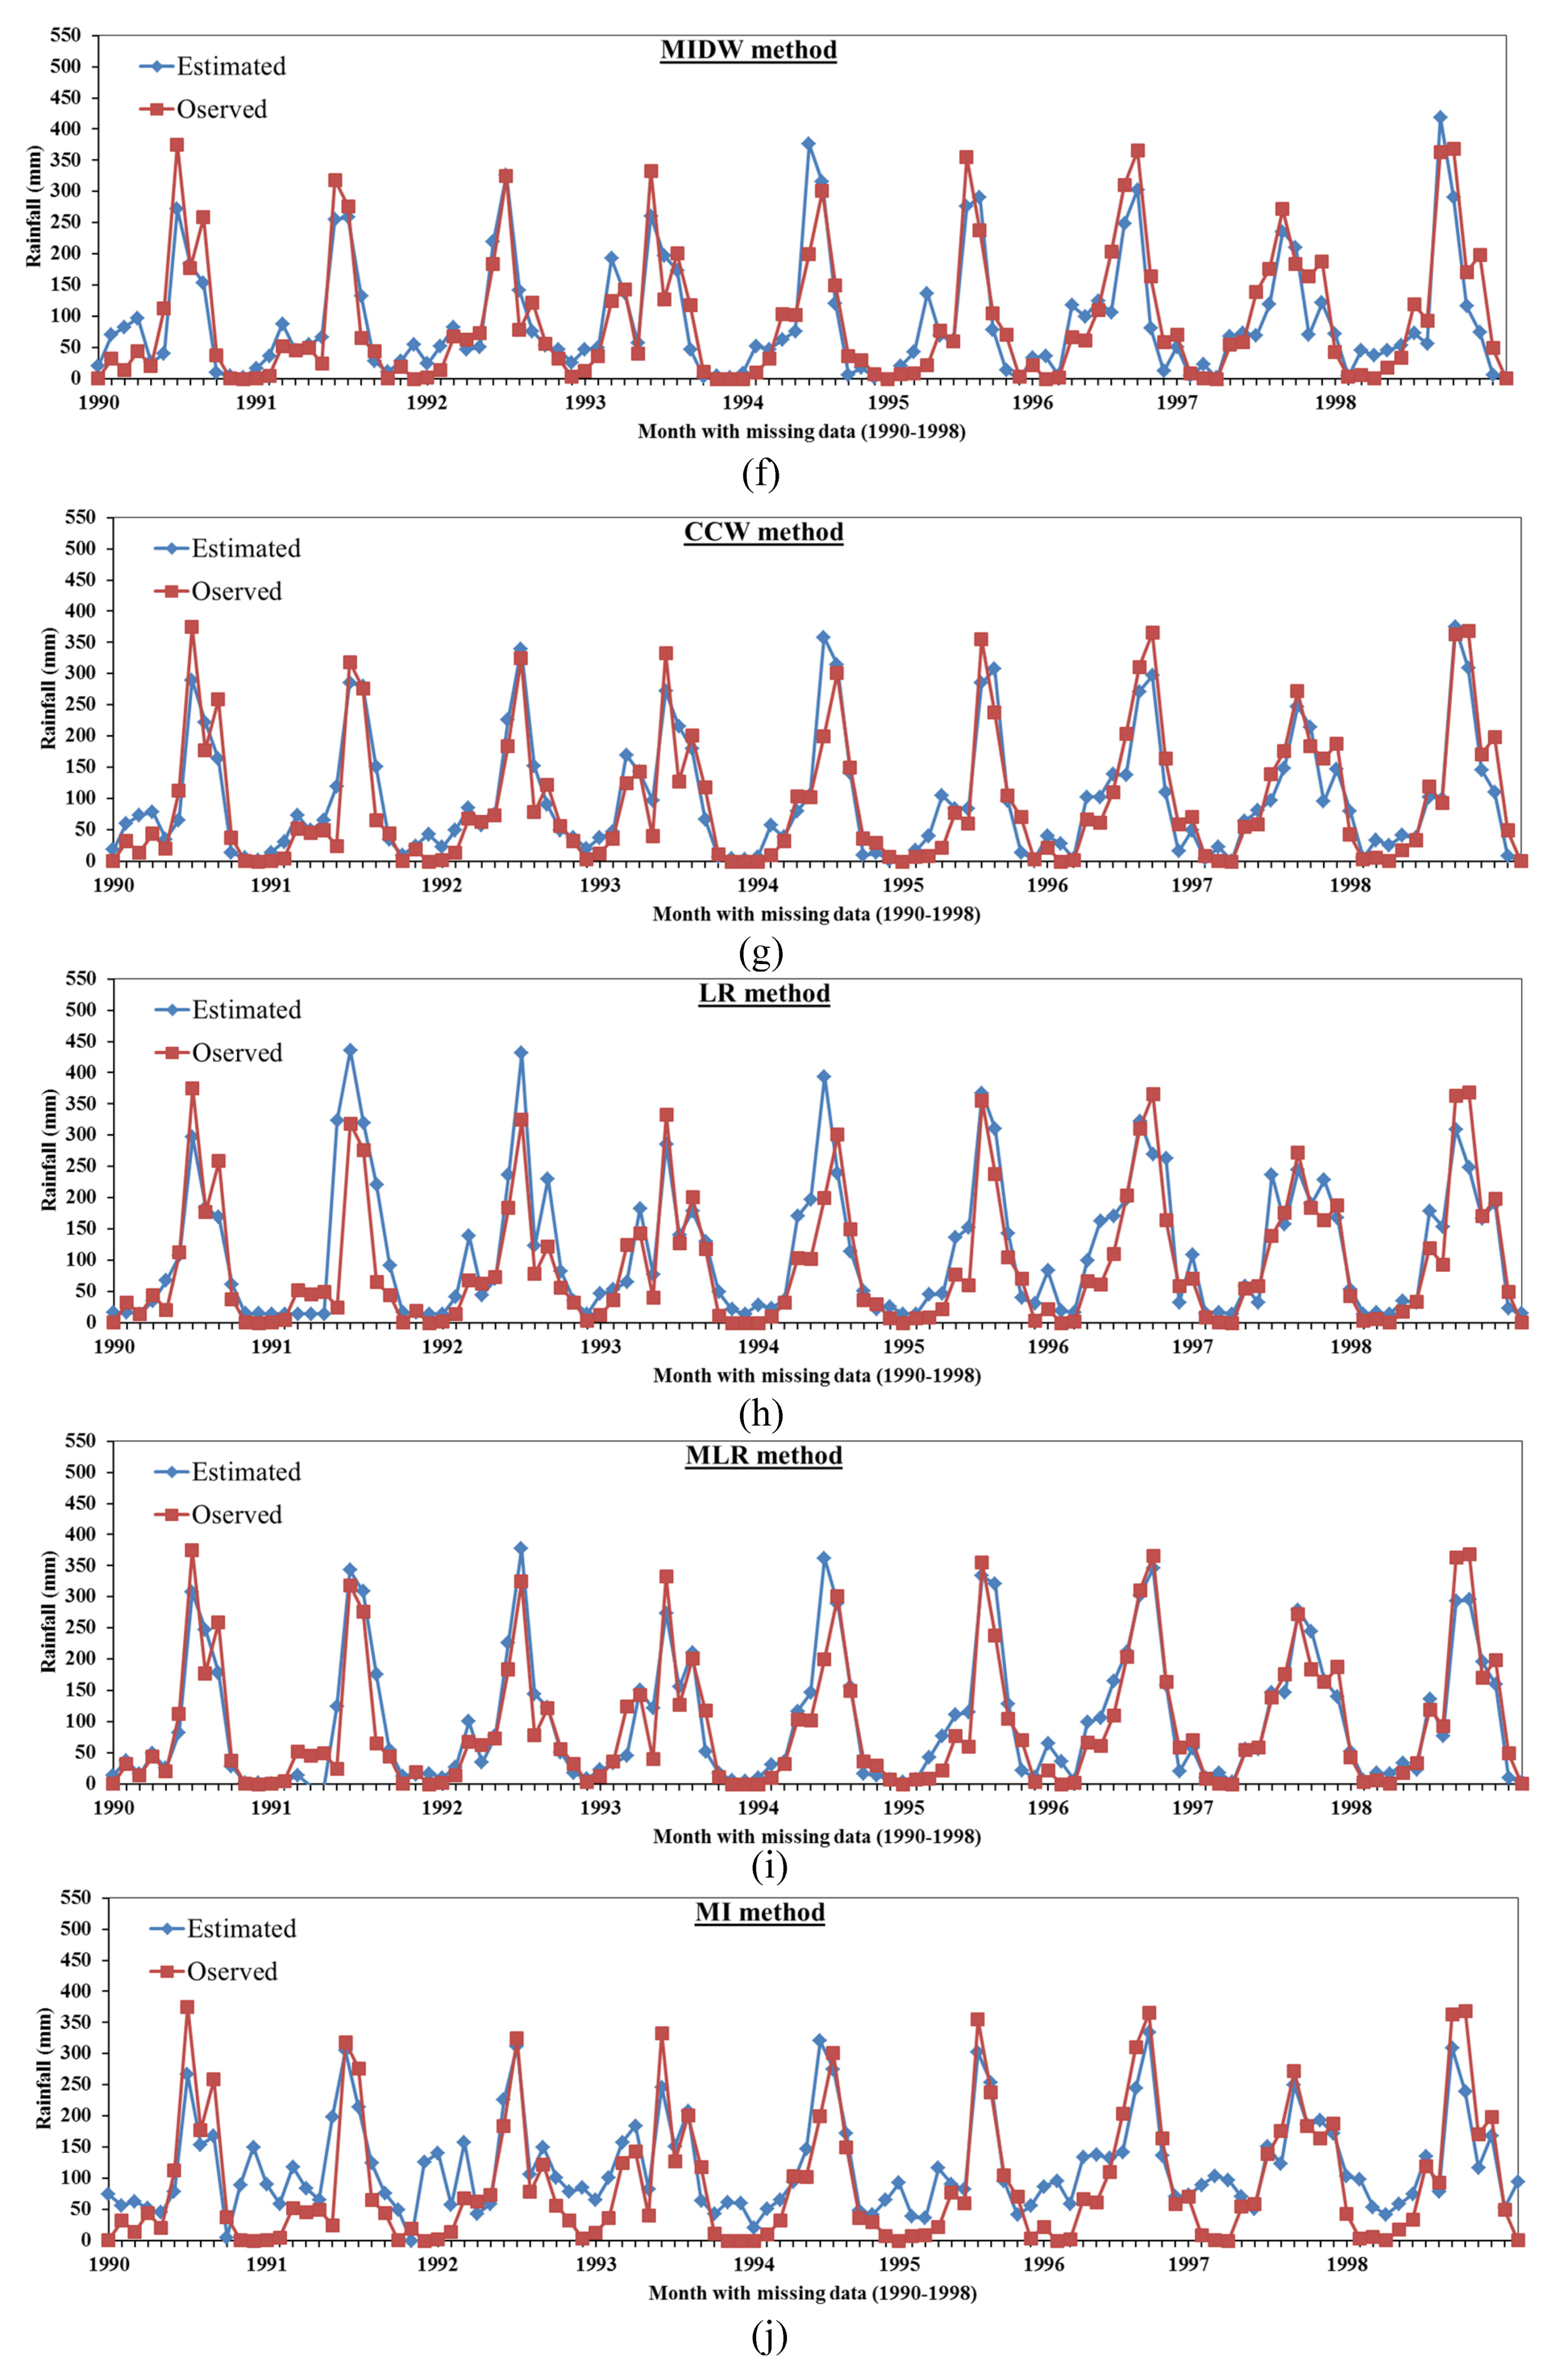
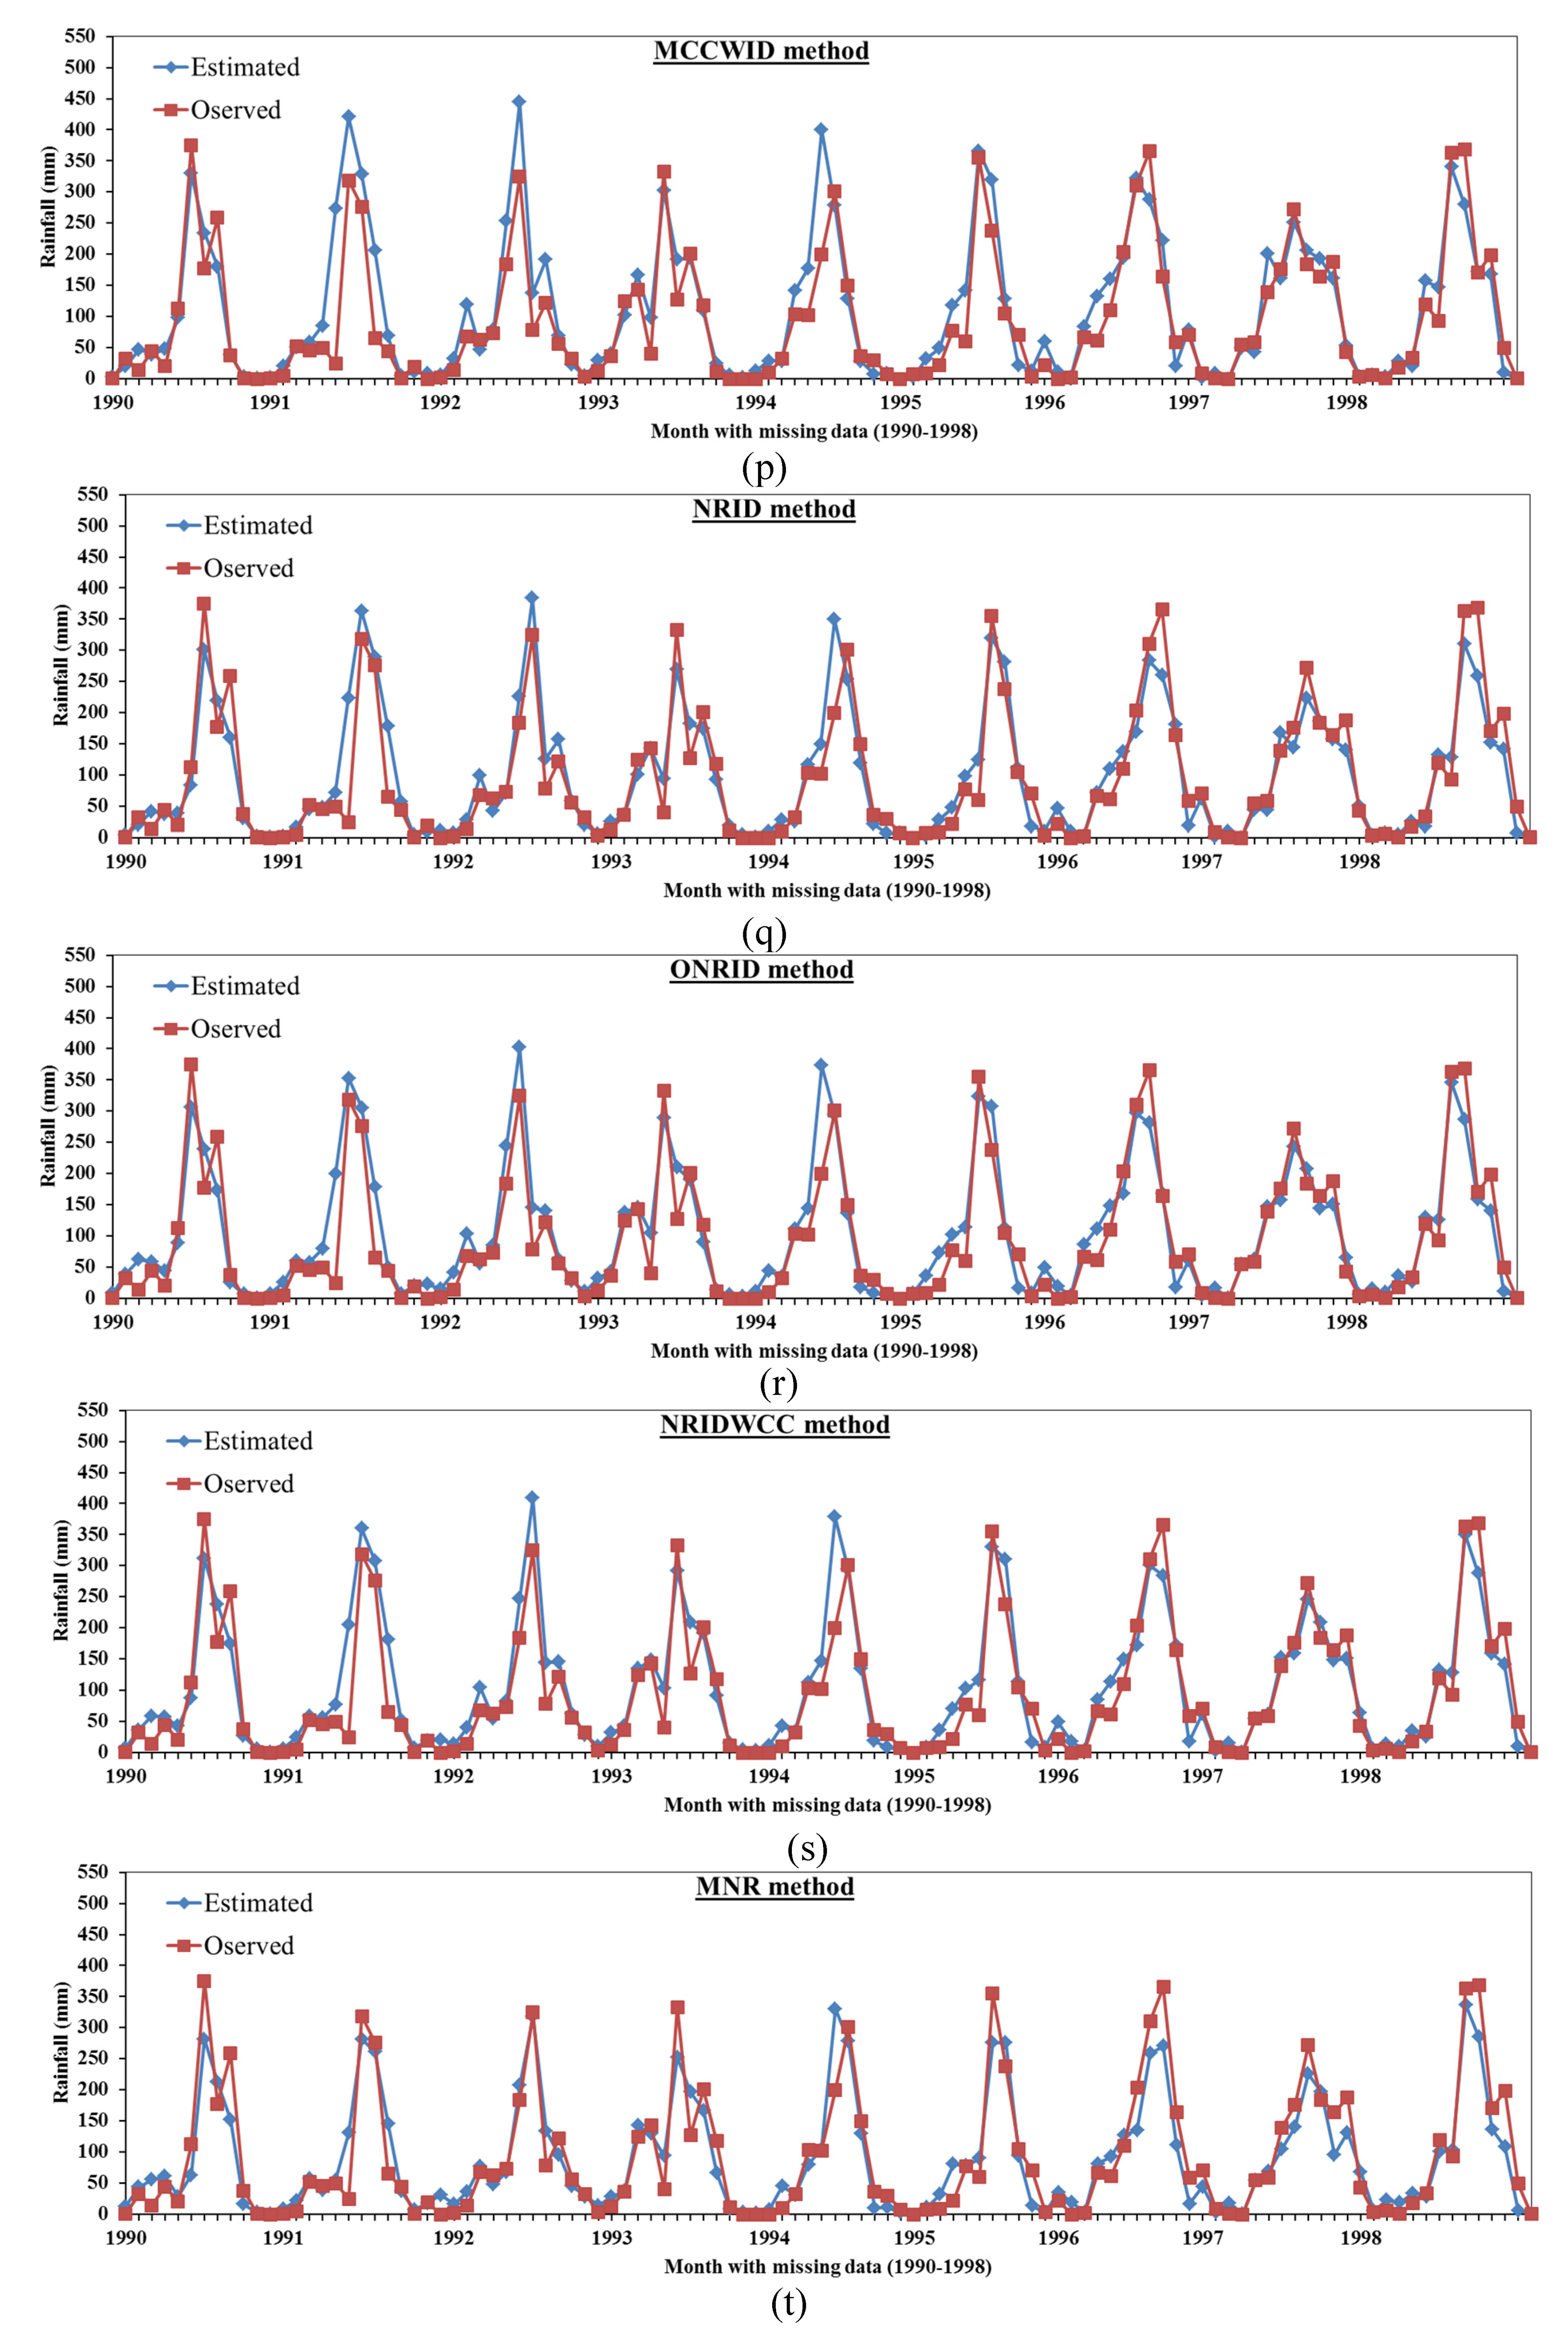
Figure 5 shows the compared results between the observed and estimated precipitation in respect to the monthly data of the period from 1990 to 1998 using the 21 different statistical methods. It can be seen that the estimated precipitation values almost match well with the observed values for the NR, NRID, NRGC, MLR, ONRID, MNR, IDW, and CCW methods. The correlation coefficients between the estimated and observed precipitation equal 0.9313, 0.9192, 0.9243, 0.9260, 0.9313, 0.9323, 0.999, and 0.9217 for NR, NRID, NRGC, MLR, ONRID, MNR, IDW, and CCW, respectively. The MAE between the observed and estimated monthly precipitation for the period from 1990 to 1998 equals 26.64, 26.69, 26.72, 26.80, 27.17, 27.60, 27.84, and 30.18 mm for the NR, NRID, NRGC, MLR, ONRID, MNR, IDW, and CCW methods, respectively, while the RMSE equals 38.28, 41.46, 40.51, 39.09, 41.13, 39.21, 39.47, and 40.89 mm for the same methods, respectively. The results of NR, MLR, IDW, and CCW appear to be more reliable and accurate compared with other methods. On the other hand, the results of EM, CS, UK, LR, and MI show the lowest accuracy as the monthly estimated values do not match the observed values. The MAE of the EM, CS, UK, LR, and MI methods equals 28.03, 34.33, 38.93, 39.07, and 48.52 mm with RMSE equal to 48.23, 53.03, 58.49, 58.23, and 59.71 mm, respectively. The results of Figure 5, for comparison between estimated monthly data with observed values for the years from 1990 to 1998, confirm the results of Figure 2, Figure 3 and Figure 4 for estimating missing data and the analysis of Table 5.
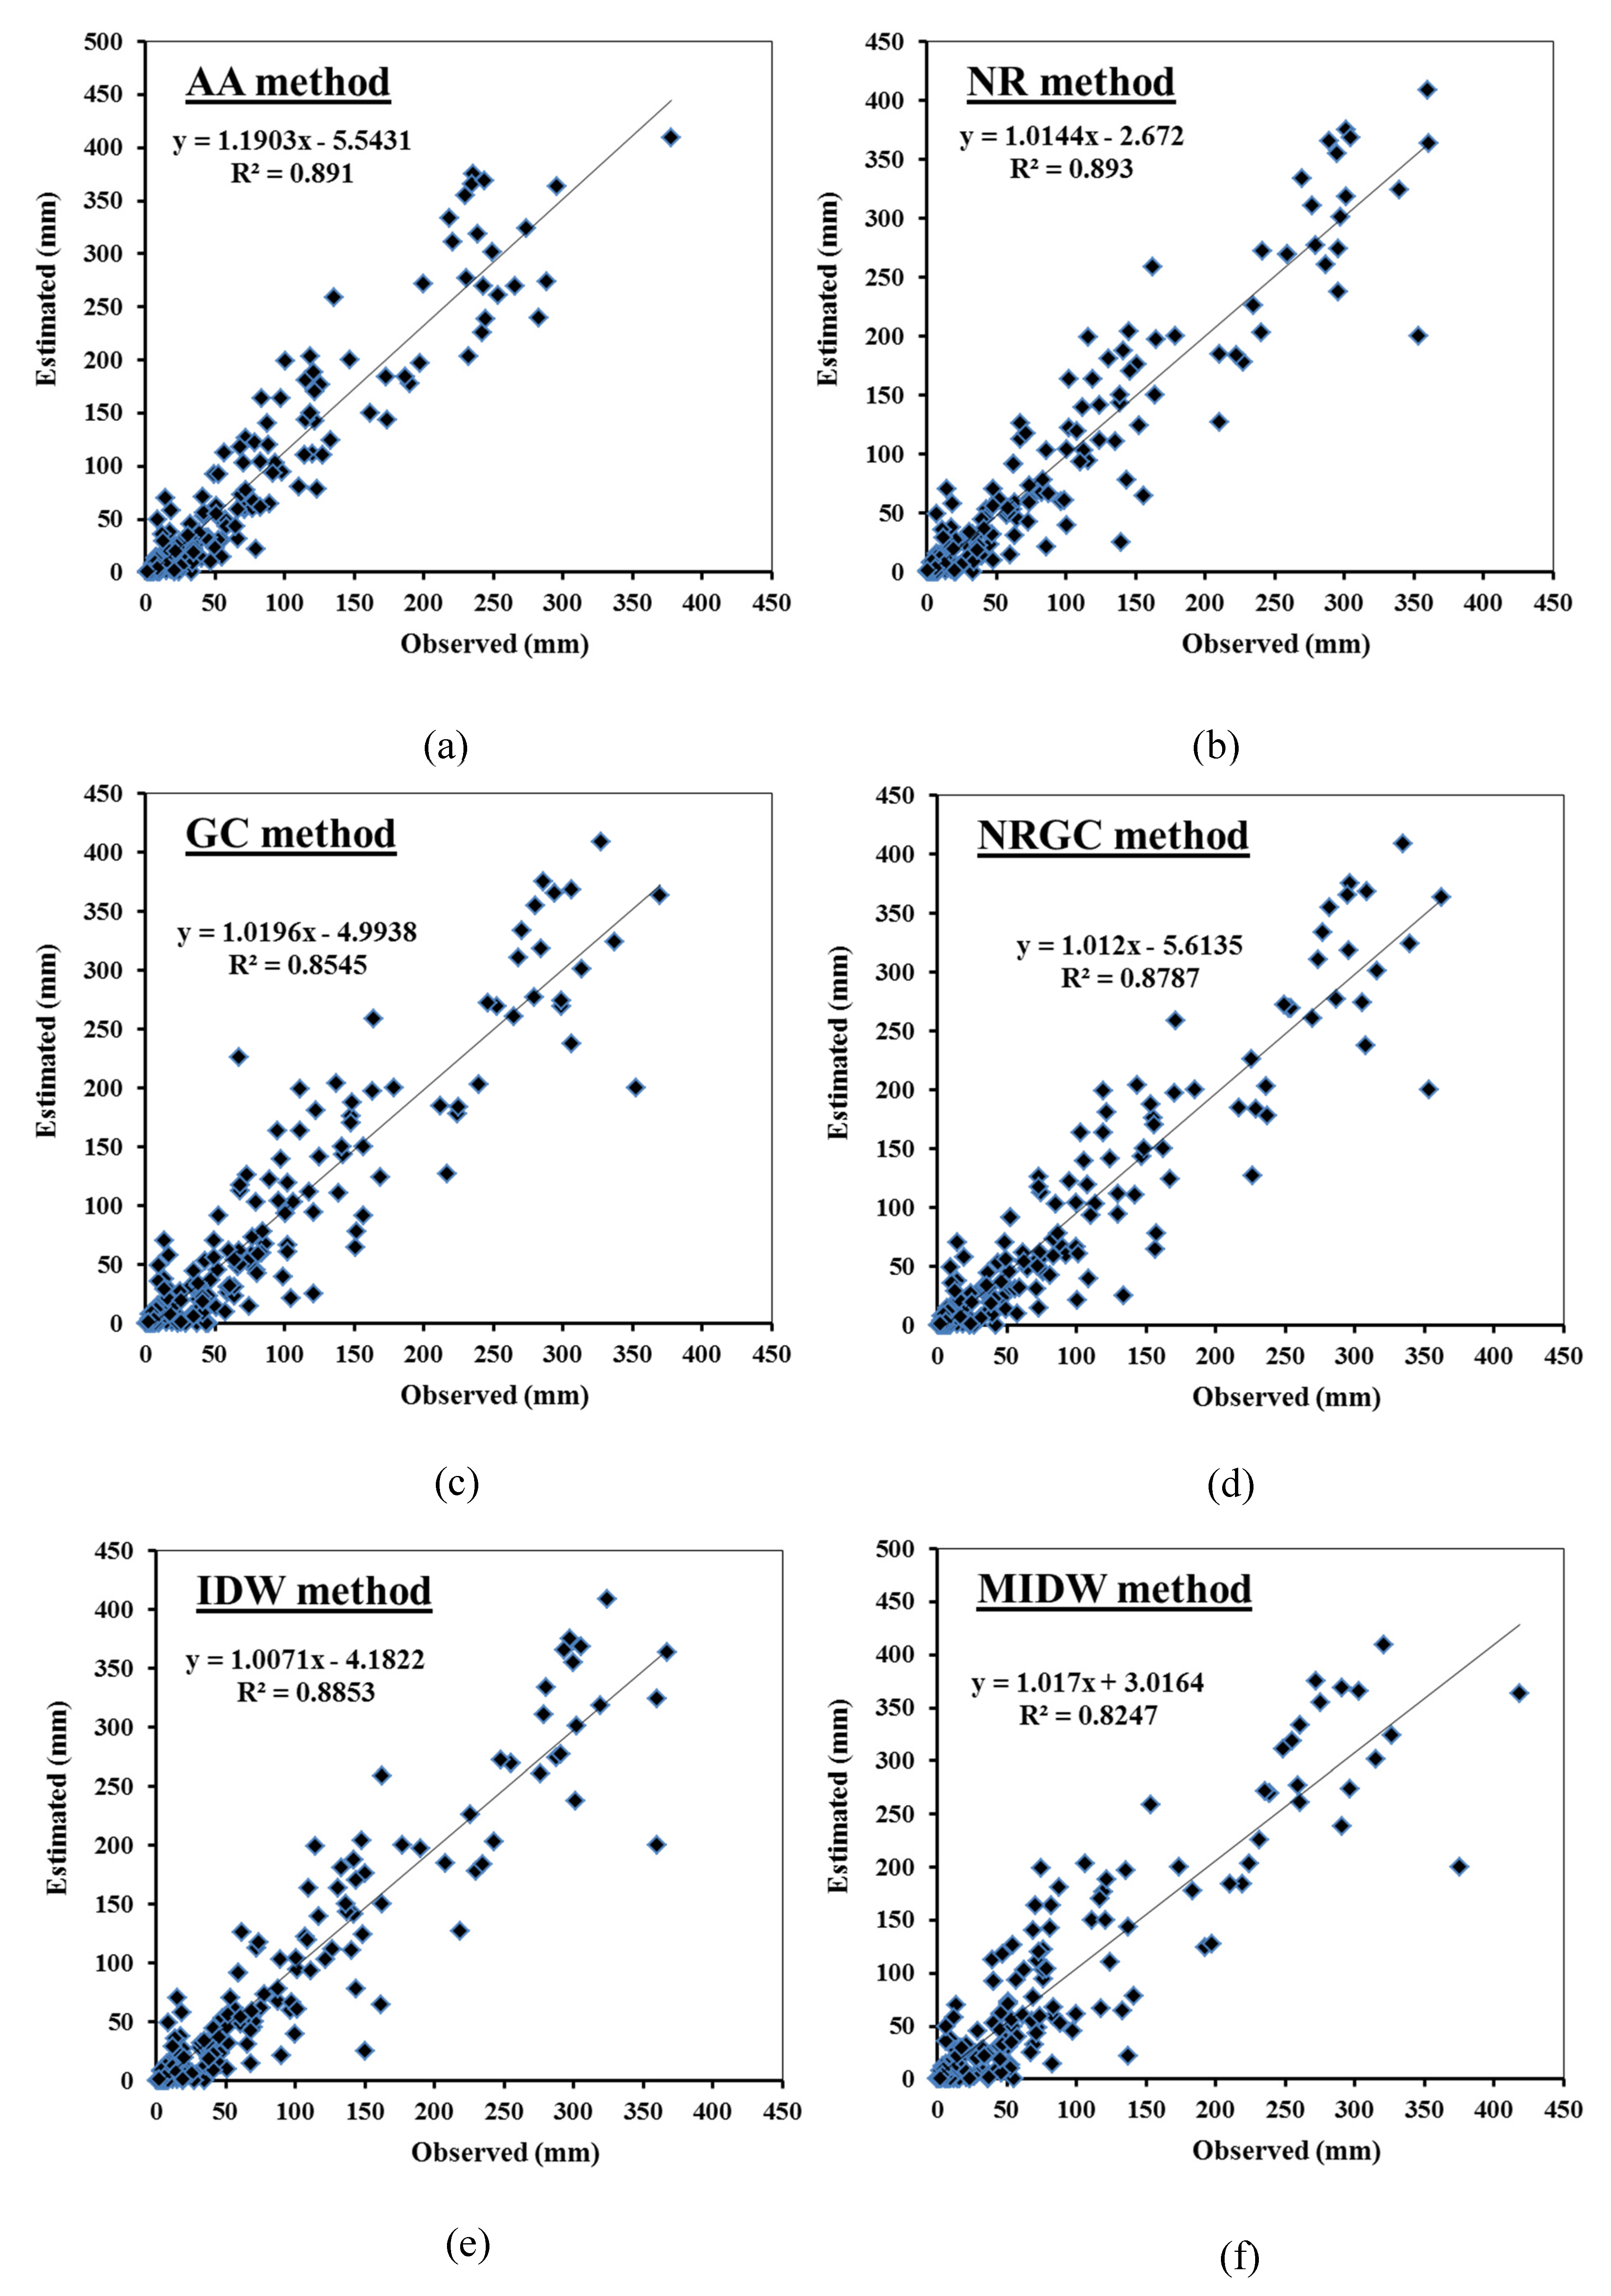
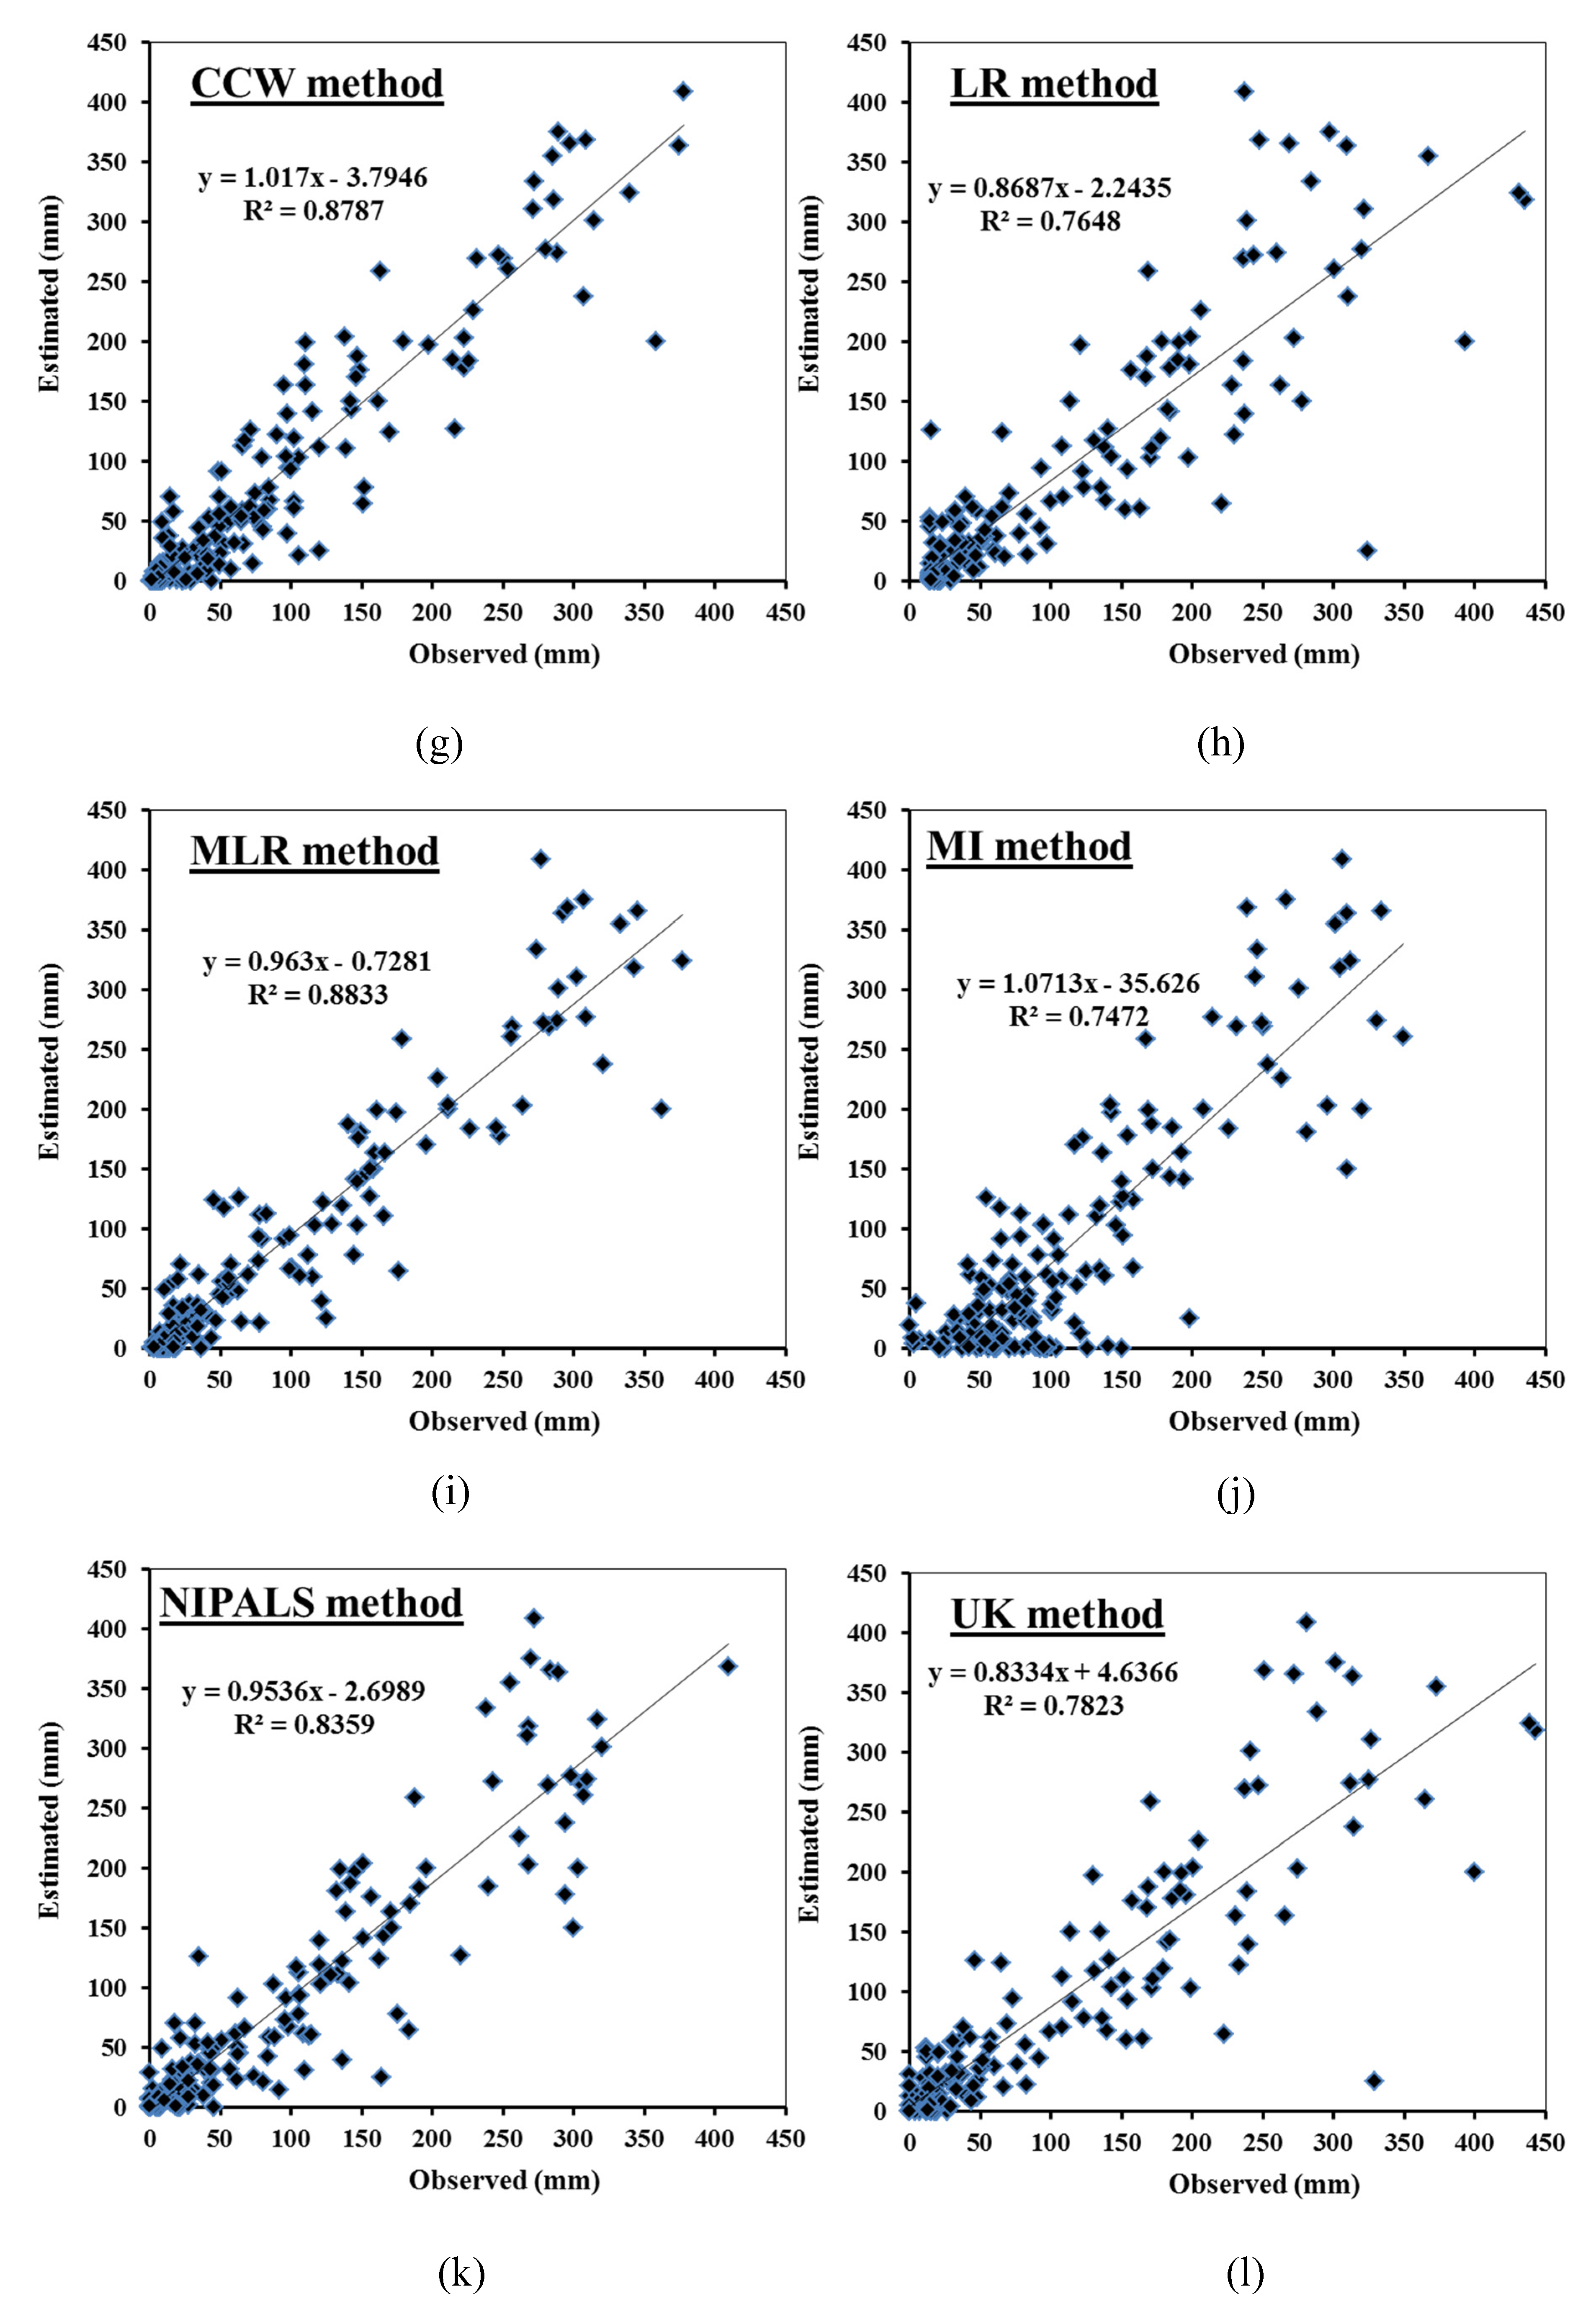
Figure 6 shows the scatter plot for comparing the monthly observed and estimated values of precipitation using different methods. The R-squared (R2) values varied across the methods, ranging from 0.7472 to 0.893. The best estimates based on R2 were achieved for NR and AA methods, with R2 equal to 0.893 and 0.891, respectively, followed by MNR (0.8887), IDW (0.8853), MLR (0.8833), NRGC (0.8787), CCW (0.8787), MCCW (0.8765), and NRIDWCC (0.8727). These results confirm that about 87.27% of the estimated precipitation can be estimated with these methods from the observed values. Moderate values of R2 were obtained for MNR-T, NRID, GC, NIPALS, MCCWID, and MIDW, with R2 equal to 0.8694, 0.8633, 0.8361, 0.8359, and 0.8247, respectively. The lowest values of R2 were found using the methods of UK, CS, LR, EM, and MI to estimate the missing precipitation, with R2 equal to 0.7823, 0.7756, 0.7648, 0.7596, and 0.7472, respectively. The methods with the lowest values of R2 are methods that use a small number of neighboring stations in predicting the missing values of precipitation.

4. Conclusions

In the current study, the monthly precipitation at 15 stations located in the Upper Blue Nile Basin UBNB was considered for the period from 1980 to 2013. The collected data were first tested using the MK trend test, SNHT, and Pettitt’s test. The precipitation data used was homogenous in all of the included stations, and no trends existed. Twenty-one different statistical methods for estimating missing precipitation data were applied; these were the AA, NR, GC, NRGC, MIDW, CCW, LR, MLR, MI, NIPALS, UK, EM, CS, MCCW, MCCWID, NRID, ONRID, NRIDC, MNR, and MNR-T methods. The results were compared using six different indices: MAE, RMSE, CE, S-index, SS, and rPearson. The results indicate that the simple NR, MLR, IDW, CCW, and AA methods are the most accurate and suitable of all the applied methods. The NR, MLR, IDW, CCW, and AA methods achieved minimum MAE and RMSE values and high values of CE, S-index, SS, and rPearson. As a result, using the simple NR, MLR, IDW, CCW, and AA methods in arid regions with similar climatic conditions is recommended. The NR method achieves reasonably accurate estimations, with an rPearson value of 0.945, MAE of 22.90 mm, RMSE of 33.695 mm, CE of 0.998, S-index of 0.999, and SS-index of 0.998. The NRID, MCCW, NRIDWCC, MNR, ONRID, MNR-T, and MCCWID methods are considered to be moderately accurate for filling in the missing data in the study area. These methods achieved moderate values of MAE and RMSE, ranging from 15.366 to 17.111 mm and from 24.128 to 28.860 mm, respectively. On the other hand, the CS, EM, UK, LR, and MI methods achieved the lowest accuracies, with MAE and RMSE values ranging from 30.424 to 47.641 mm and from 49.564 to 58.765 mm, respectively. As a result of their simplicity and high accuracy, the NR, MLR, IDW, CCW, and AA methods are recommended for filling in missing climate data in arid climates. The results reported in this research suggest that the recommended methods are applicable for arid regions in other countries.

Author Contributions

Conceptualization, A.M.A., Z.M.Y. and N.A.-A.; Data curation, A.M.A. and Z.M.Y.; Formal analysis, A.M.A., Z.M.Y. and N.A.-A.; Investigation, A.M.A., Z.M.Y. and N.A.-A.; Methodology, A.M.A. and Z.M.Y.; Project administration, A.M.A.; Resources, A.M.A.; Software, A.M.A.; Supervision, N.A.-A.; Validation, A.M.A.; Visualization, Z.M.Y.; Writing—original draft, A.M.A., Z.M.Y. and N.A.-A.; Writing—review & editing, A.M.A., Z.M.Y. and N.A.-A. All authors have read and agreed to the published version of the manuscript.

Funding

This research received no external funding.

Conflicts of Interest

There is no conflict of interest is declared by the authors.

References

  1. Qutbudin, I.; Shiru, M.S.; Sharafati, A.; Ahmed, K.; Al-Ansari, N.; Yaseen, Z.M.; Shahid, S.; Wang, X. Seasonal drought pattern changes due to climate variability: Case study in Afghanistan. Water 2019, 11, 1096. [Google Scholar] [CrossRef] [Green Version]
  2. Suhaila, J.; Sayang, M.D.; Jemain, A.A. Revised spatial weighting methods for estimation of missing rainfall data. Asia-Pac. J. Atmos. Sci. 2008, 44, 93–104. [Google Scholar]
  3. Yaseen, Z.; Ebtehaj, I.; Kim, S.; Sanikhani, H.; Asadi, H.; Ghareb, M.; Bonakdari, H.; Wan Mohtar, W.; Al-Ansari, N.; Shahid, S. Novel hybrid data-intelligence model for forecasting monthly rainfall with uncertainty analysis. Water 2019, 11, 502. [Google Scholar] [CrossRef] [Green Version]
  4. Kashani, M.H.; Dinpashoh, Y. Evaluation of efficiency of different estimation methods for missing climatological data. Stoch. Environ. Res. Risk Assess. 2012, 26, 59–71. [Google Scholar] [CrossRef]
  5. Kim, J.W.; Pachepsky, Y.A. Reconstructing missing daily precipitation data using regression trees and artificial neural networks for SWAT streamflow simulation. J. Hydrol. 2010, 394, 305–314. [Google Scholar] [CrossRef]
  6. Xia, Y.; Fabian, P.; Stohl, A.; Winterhalter, M. Forest climatology: Estimation of missing values for Bavaria, Germany. Agric. For. Meteorol. 1999, 96, 131–144. [Google Scholar] [CrossRef] [Green Version]
  7. Campozano, L.; Sánchez, E.; Avilés, Á.; Samaniego, E. Evaluation of infilling methods for time series of daily precipitation and temperature: The case of the ecuadorian andes. Maskana 2014, 5, 99–115. [Google Scholar] [CrossRef]
  8. Wagner, P.D.; Fiener, P.; Wilken, F.; Kumar, S.; Schneider, K. Comparison and evaluation of spatial interpolation schemes for daily rainfall in data scarce regions. J. Hydrol. 2012, 464, 388–400. [Google Scholar] [CrossRef]
  9. Xiao, W.; Nazario, G.; Wu, H.; Zhang, H.; Cheng, F. A neural network based computational model to predict the output power of different types of photovoltaic cells. PLoS ONE 2017, 12, e0184561. [Google Scholar] [CrossRef] [Green Version]
  10. Yaseen, Z.M.; Sulaiman, S.O.; Deo, R.C.; Chau, K.-W. An enhanced extreme learning machine model for river flow forecasting: State-of-the-art, practical applications in water resource engineering area and future research direction. J. Hydrol. 2018, 569, 387–408. [Google Scholar] [CrossRef]
  11. Tang, W.Y.; Kassim, A.H.M.; Abubakar, S.H. Comparative studies of various missing data treatment methods-Malaysian experience. Atmos. Res. 1996, 42, 247–262. [Google Scholar] [CrossRef]
  12. Eischeid, J.K.; Pasteris, P.A.; Diaz, H.F.; Plantico, M.S.; Lott, N.J. Creating a serially complete, national daily time series of temperature and precipitation for the western United States. J. Appl. Meteorol. 2000, 39, 1580–1591. [Google Scholar] [CrossRef]
  13. De Silva, R.P.; Dayawansa, N.D.K.; Ratnasiri, M.D. A comparison of methods used in estimating missing rainfall data. J. Agric. Sci. 2007, 3. [Google Scholar] [CrossRef]
  14. Radi, N.F.A.; Zakaria, R.; Azman, M.A. Estimation of missing rainfall data using spatial interpolation and imputation methods. In AIP conference proceedings; American Institute of Physics: College Park, MD, USA, 2015; Volume 1643, pp. 42–48. [Google Scholar]
  15. Yozgatligil, C.; Aslan, S.; Iyigun, C.; Batmaz, I. Comparison of missing value imputation methods in time series: The case of Turkish meteorological data. Theor. Appl. Climatol. 2013, 112, 143–167. [Google Scholar] [CrossRef]
  16. Willmott, C.J.; Robeson, S.M. Climatologically aided interpolation (CAI) of terrestrial air temperature. Int. J. Climatol. 1995, 15, 221–229. [Google Scholar] [CrossRef]
  17. Little, R.J.A.; Rubin, D.B. Factored likelihood methods, ignoring the missing-data mechanism. Stat. Anal. Missing Data 2002, 133–163. [Google Scholar] [CrossRef]
  18. Gyau-Boakye, P.; Schultz, G.A. Filling gaps in runoff time series in West Africa. Hydrol. Sci. J. 1994, 39, 621–636. [Google Scholar] [CrossRef]
  19. Salih, S.Q.; Sharafati, A.; Ebtehaj, I.; Sanikhani, H.; Siddique, R.; Deo, R.C.; Bonakdari, H.; Shahid, S.; Yaseen, Z.M. Integrative stochastic model standardization with genetic algorithm for rainfall pattern forecasting in tropical and semi-arid environments. Hydrol. Sci. J. 2020, 1–13. [Google Scholar] [CrossRef]
  20. Willmott, C.J.; Robeson, S.M.; Feddema, J.J. Estimating continental and terrestrial precipitation averages from rain-gauge networks. Int. J. Climatol. 1994, 14, 403–414. [Google Scholar] [CrossRef] [Green Version]
  21. Teegavarapu, R.S.V.; Chandramouli, V. Improved weighting methods, deterministic and stochastic data-driven models for estimation of missing precipitation records. J. Hydrol. 2005, 312, 191–206. [Google Scholar] [CrossRef]
  22. Pizarro, R.; Ausensi, P.; Aravena, D.; Sangüesa, C.; León, L.; Balocchi, F. Evaluación de métodos hidrológicos para la completación de datos faltantes de precipitación en estaciones de la región del Maule, Chile. Aqua-Lac 2009, 1, 172–185. [Google Scholar]
  23. Alfaro, R.; Pacheco, R. Aplicación de algunos métodos de relleno a series anuales de lluvia de diferentes regiones de Costa Rica. Tópicos Meteorológicos y Oceanográficos 2000, 7, 1–20. [Google Scholar]
  24. Dastorani, M.T.; Moghadamnia, A.; Piri, J.; Rico-Ramirez, M. Application of ANN and ANFIS models for reconstructing missing flow data. Environ. Monit. Assess. 2009, 166, 421–434. [Google Scholar] [CrossRef] [PubMed]
  25. Bhagat, S.K.; Welde, W.; Tesfaye, O.; Tung, T.M.; Al-Ansari, N.; Salih, S.Q.; Yaseen, Z.M. Evaluating physical and fiscal water leakage in water distribution system. Water 2019, 11, 2091. [Google Scholar] [CrossRef] [Green Version]
  26. De Martonne, E. Aridité et indices d’aridité. Académie Des Sci. Comptes Rendus 1923, 182, 1935–1938. [Google Scholar]
  27. Te, C.V.; Maidment, D.R.; Mays, L.W. Applied hydrology. In Water Resources Handbook; McGraw-Hill: New York, NY, USA, 1988; ISBN 978-0070108103. [Google Scholar]
  28. Paulhus, J.L.H.; Kohler, M.A. Interpolation of missing precipitation records. Mon. Weather Rev. 1952, 80, 129–133. [Google Scholar] [CrossRef] [Green Version]
  29. Young, K.C. A Three-way model for interpolating for monthly precipitation values. Mon. Weather Rev. 1992, 120, 2561–2569. [Google Scholar] [CrossRef]
  30. Singh, V.P. Elementary Hydrology; Prentice-hall Of India Pvt Ltd.: Delhi, India, 1994. [Google Scholar]
  31. Wei, E.C.; McGuiness, J.L.N. Reciprocal Distance Square Method: A Computer Technique for Estimating Areal Precipitation; US Department of Agriculture (USDA): Washington, DC, USA, 1973.
  32. Vieux, B.E. Distributed Hydrologic Modeling Using GIS, 2nd ed.; Kluwer Academic Publishers: Dordrecht, The Netherlands, 2001; pp. 1–17. [Google Scholar]
  33. Golkhatmi, N.S.; Sanaeinejad, S.H.; Ghahraman, B.; Pazhand, H.R. Extended modified inverse distance method for interpolation rainfall. Int. J. Eng. Invent. 2012, 3, 57–65. [Google Scholar]
  34. Viale, M.; Garreaud, R. Orographic effects of the subtropical and extratropical Andes on upwind precipitating clouds. J. Geophys. Res. Atmos. 2015, 120, 4962–4974. [Google Scholar] [CrossRef]
  35. Yan, X.; Su, X. Linear Regression Analysis: Theory and Computing; World Scientific: Singapore, 2009; ISBN 9812834109. [Google Scholar]
  36. Teegavarapu, R.S.V. Estimation of missing precipitation records integrating surface interpolation techniques and spatio-temporal association rules. J. Hydroinform. 2009, 11, 133–146. [Google Scholar] [CrossRef]
  37. Rubin, D.B. An overview of multiple imputation. In Proceedings of the Survey Research Methods Section of the American Statistical Association; American Statistical Association: Alexandria, VA, USA, 1988; pp. 79–84. [Google Scholar]
  38. Little, R.J.A.; Rubin, D.B. Statistical Analysis with Missing Data; John Wiley & Sons: Hoboken, NJ, USA, 2019; Volume 793, ISBN 0470526793. [Google Scholar]
  39. Schafer, J.L. Multiple imputation: A primer. Stat. Methods Med Res. 1999, 8, 3–15. [Google Scholar] [CrossRef] [PubMed]
  40. Schafer, J.L.; Graham, J.W. Missing data: Our view of the state of the art. Psychol. Methods 2002, 7, 147–177. [Google Scholar] [CrossRef] [PubMed]
  41. Myers, T.A. Goodbye, listwise deletion: Presenting hot deck imputation as an easy and effective tool for handling missing data. Commun. Methods Meas. 2011, 5, 297–310. [Google Scholar] [CrossRef]
  42. Wold, H.O.A. Nonlinear Estimation by Iterative Least Square Procedures; Research Papers in Statistics; David, F., Ed.; Wiley: New York, NY, USA, 1968; pp. 411–444. [Google Scholar]
  43. Tenenhaus, M. La Régression PLS: Théorie et Pratique; Editions Technip: Paris, France, 1998; ISBN 2710807351. [Google Scholar]
  44. Dempster, A.P.; Laird, N.M.; Rubin, D.B. Maximum likelihood from incomplete data via the EM algorithm. J. R. Stat. Soc. Ser. B (Methodol.) 1977, 39, 1–22. [Google Scholar]
  45. Schneider, T. Analysis of incomplete climate data: Estimation of mean values and covariance matrices and imputation of missing values. J. Clim. 2001, 14, 853–871. [Google Scholar] [CrossRef]
  46. Eskelson, B.N.I.; Temesgen, H.; Lemay, V.; Barrett, T.M.; Crookston, N.L.; Hudak, A.T. The roles of nearest neighbor methods in imputing missing data in forest inventory and monitoring databases. Scand. J. For. Res. 2009, 24, 235–246. [Google Scholar] [CrossRef] [Green Version]
  47. Bárdossy, A.; Pegram, G. Infilling missing precipitation records—A comparison of a new copula-based method with other techniques. J. Hydrol. 2014, 519, 1162–1170. [Google Scholar] [CrossRef]
  48. Kanda, N.; Negi, H.S.; Rishi, M.S.; Shekhar, M.S. Performance of various techniques in estimating missing climatological data over snowbound mountainous areas of Karakoram Himalaya. Meteorol. Appl. 2017, 25, 337–349. [Google Scholar] [CrossRef]
  49. Hubbard, K.G. Spatial variability of daily weather variables in the high plains of the USA. Agric. For. Meteorol. 1994, 68, 29–41. [Google Scholar] [CrossRef]
  50. Azman, M.A.; Zakaria, R.; Ahmad Radi, N.F. Estimation of missing rainfall data in Pahang using modified spatial interpolation weighting methods. In Proceedings of the AIP Conference Proceedings, Yogyakarta, Indonesia, 11–13 November 2015. [Google Scholar]
  51. Willmott, C.J.; Matsuura, K.; Robeson, S.M. Ambiguities inherent in sums-of-squares-based error statistics. Atmos. Environ. 2009, 43, 749–752. [Google Scholar] [CrossRef]
  52. Tung, T.M.; Yaseen, Z.M. A survey on river water quality modelling using artificial intelligence models: 2000–2020. J. Hydrol. 2020, 585, 124670. [Google Scholar]
  53. Savage, N.H.; Agnew, P.; Davis, L.S.; Ordóñez, C.; Thorpe, R.; Johnson, C.E.; O’Connor, F.M.; Dalvi, M. Air quality modelling using the met office unified model (AQUM OS24-26): Model description and initial evaluation. Geosci. Model Dev. 2013, 6, 353–372. [Google Scholar] [CrossRef] [Green Version]
  54. Chai, T.; Kim, H.-C.; Lee, P.; Tong, D.; Pan, L.; Tang, Y.; Huang, J.; McQueen, J.; Tsidulko, M.; Stajner, I. Evaluation of the united states national air quality forecast capability experimentalreal-time predictions in 2010 using air quality system ozone and NO2 measurements. Geosci. Model Dev. 2013, 6, 1831–1850. [Google Scholar] [CrossRef] [Green Version]
  55. Chai, T.; Draxler, R.R. Root mean square error (RMSE) or mean absolute error (MAE)?—Arguments against avoiding RMSE in the literature. Geosci. Model Dev. 2014, 7, 1247–1250. [Google Scholar] [CrossRef] [Green Version]
  56. Willmott, C.J. On the validation of models. Phys. Geogr. 1981, 2, 184–194. [Google Scholar] [CrossRef]
  57. Libonati, R.; Trigo, I.; DaCamara, C.C. Correction of 2 m-temperature forecasts using Kalman Filtering technique. Atmos. Res. 2008, 87, 183–197. [Google Scholar] [CrossRef]
  58. Porto de Carvalho, J.R.; Assad, E.D.; Pinto, H.S. Kalman filter and correction of the temperatures estimated by PRECIS model. Atmos. Res. 2011, 102, 218–226. [Google Scholar] [CrossRef]
  59. Carvalho, J.R.P.D.; Nakai, A.M.; Monteiro, J.E.B.A. Spatio-temporal modeling of data imputation for daily rainfall series in homogeneous zones. Rev. Bras. de Meteorol. 2016, 31, 196–201. [Google Scholar] [CrossRef] [Green Version]
  60. Afan, H.A.; Allawi, M.F.; El-Shafie, A.; Yaseen, Z.M.; Ahmed, A.N.; Malek, M.A.; Koting, S.B.; Salih, S.Q.; Mohtar, W.H.M.W.; Lai, S.H. Input attributes optimization using the feasibility of genetic nature inspired algorithm: Application of river flow forecasting. Sci. Rep. 2020, 10, 1–15. [Google Scholar] [CrossRef]
  61. Alexandersson, H. A homogeneity test applied to precipitation data. J. Climatol. 1986, 6, 661–675. [Google Scholar] [CrossRef]
  62. Hoeffding, W.; Kendall, M.G. Rank correlation methods. Econometrica 1957, 25, 181. [Google Scholar] [CrossRef]
  63. Gilbert, R.O. Statistical methods for environmental pollution monitoring. Biometrics 1988, 44, 319. [Google Scholar] [CrossRef] [Green Version]
  64. Mann, H.B. Nonparametric tests against trend. Econometrica 1945, 13, 245. [Google Scholar] [CrossRef]
  65. Sattari, M.-T.; Rezazadeh-Joudi, A.; Kusiak, A. Assessment of different methods for estimation of missing data in precipitation studies. Hydrol. Res. 2017, 48, 1032–1044. [Google Scholar] [CrossRef]
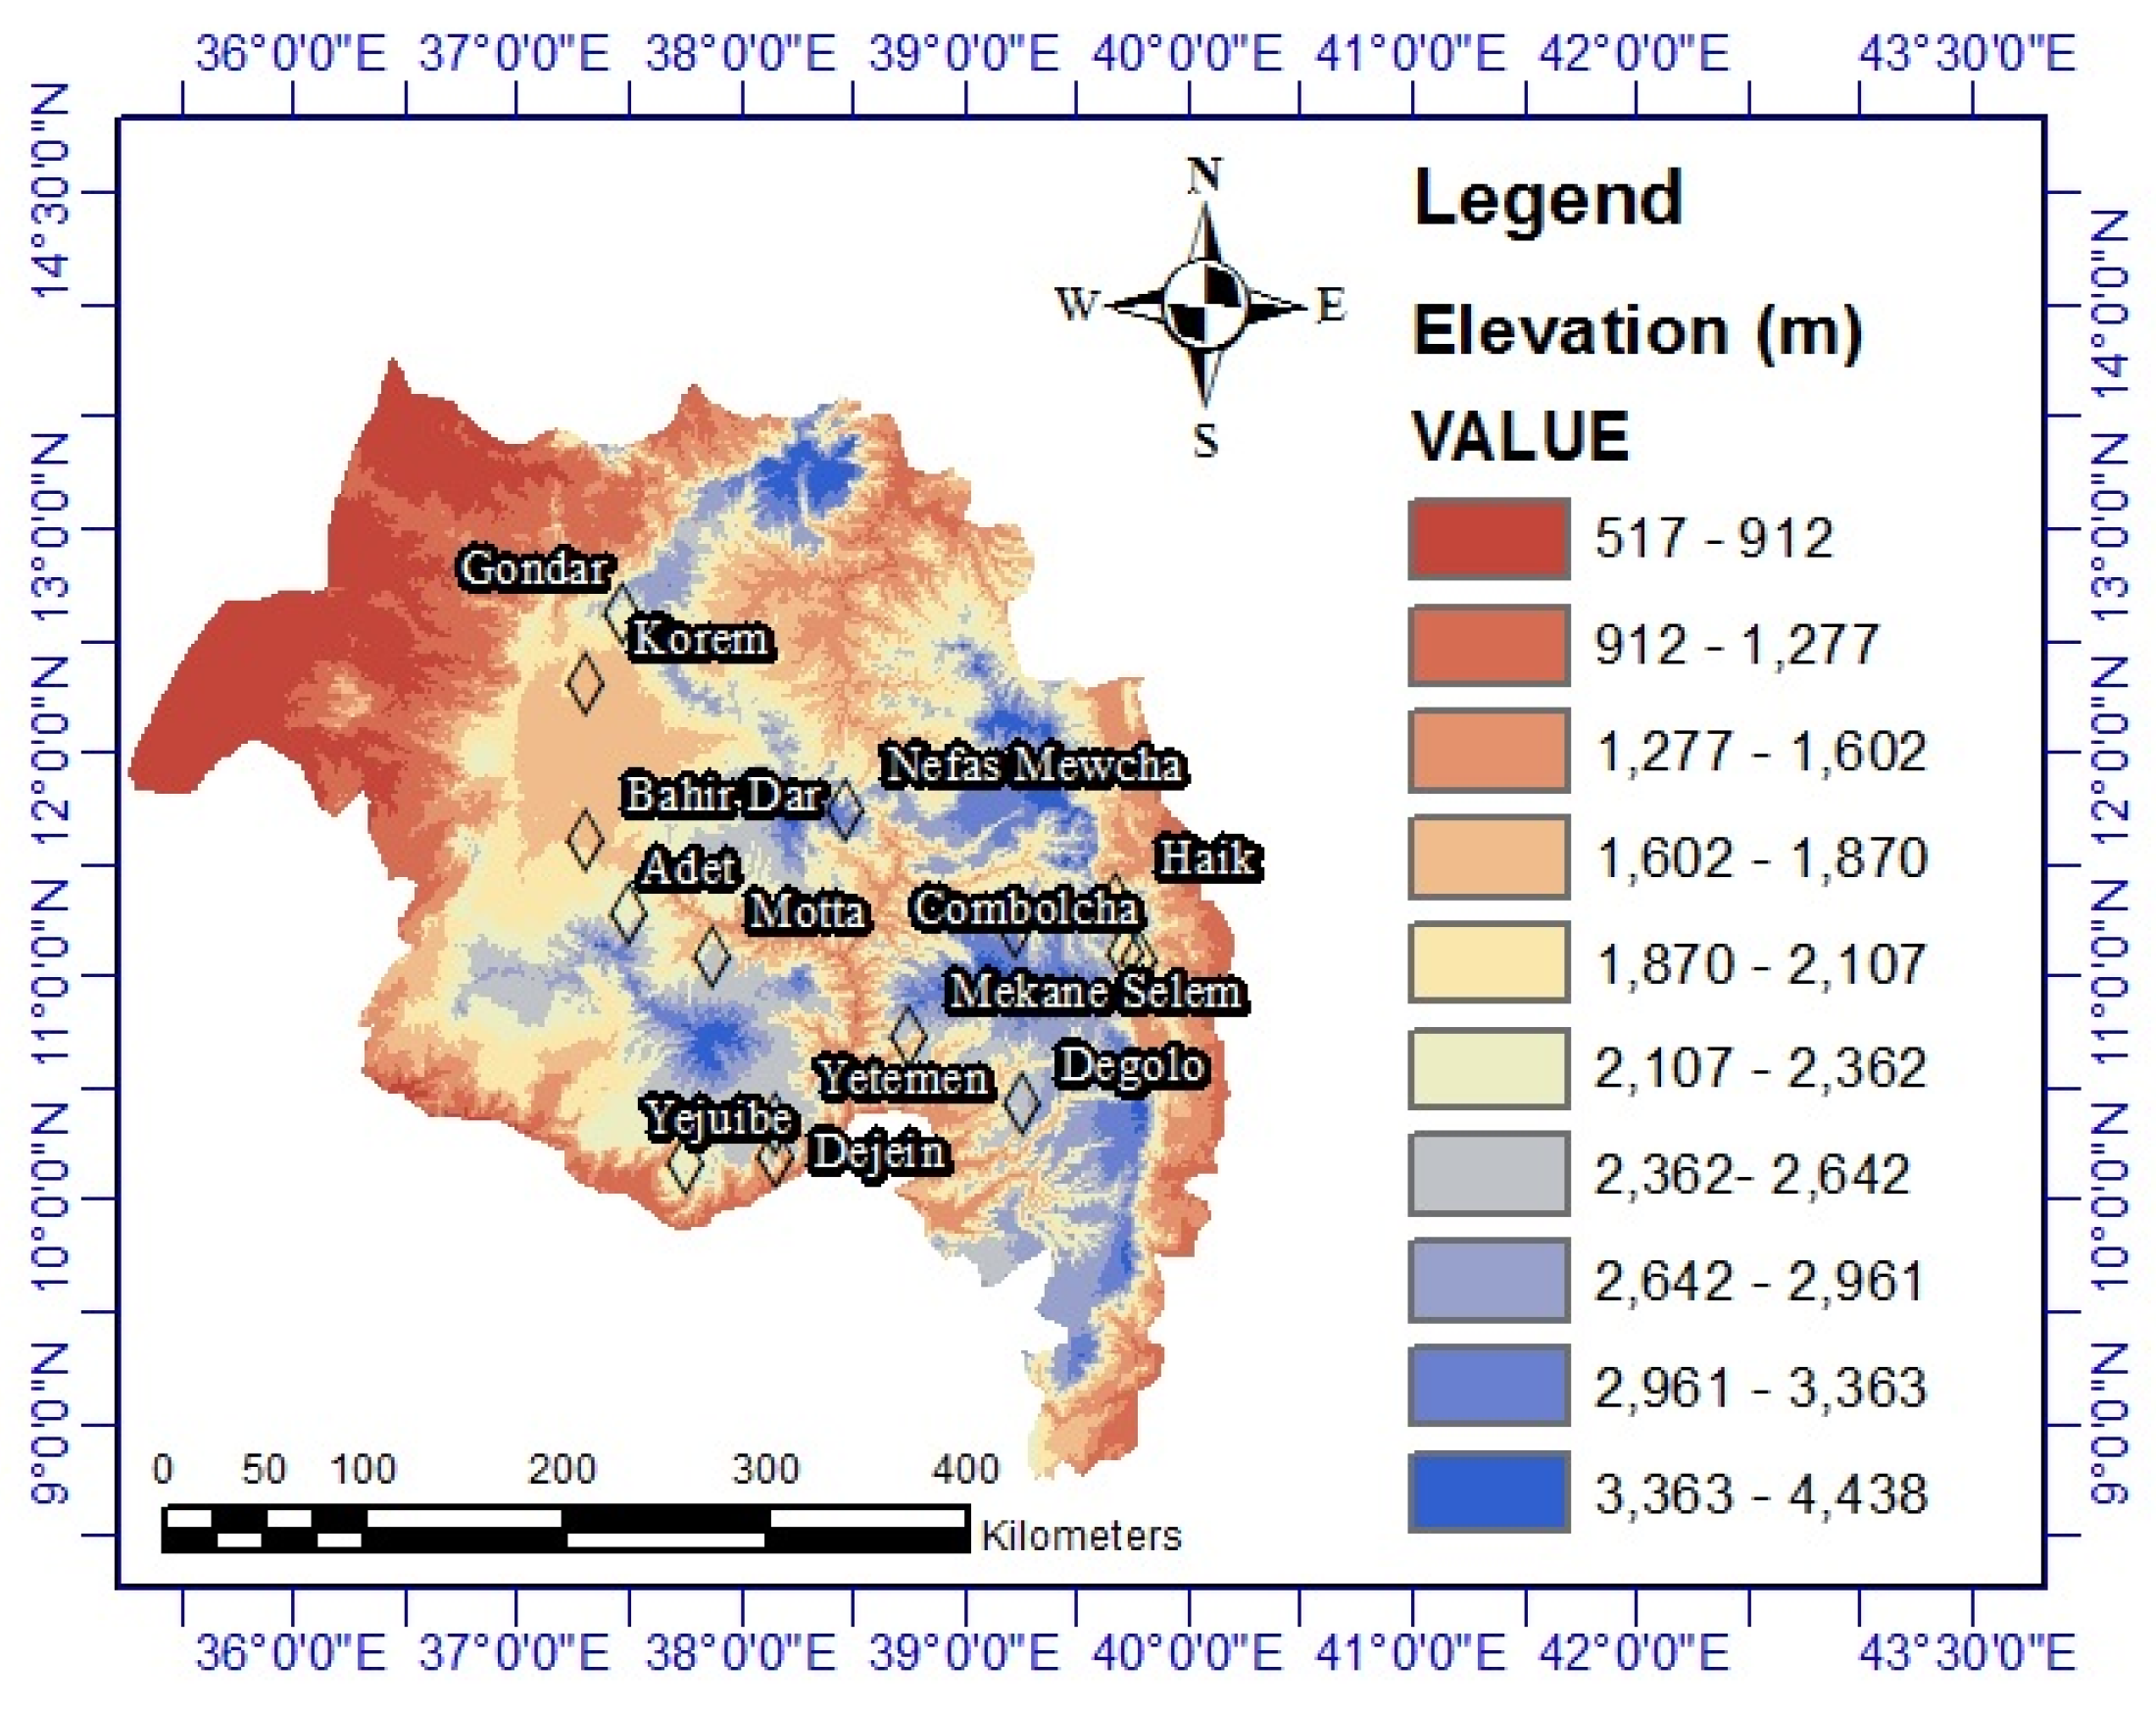
Figure 1. Study area location.
Atmosphere 11 00389 g001
Figure 2. Comparison between the estimated and observed time series of precipitation for random missing data using different methods: (a), AA; (b), NR; (c), GC; (d), NRGC; (e), IDW; (f), MIDW; (g), CCW; (h), LR; (i), MLR; (j), MI; (k), NIPALS; (l), UK; (m), EM; (n), CS; (o), MCCW; (p), MCCWID; (q), NRID; (r), ONRID; (s), NRIDWCC; (t), MNR; (u), MNR-T.
Atmosphere 11 00389 g002aAtmosphere 11 00389 g002b
Figure 3. Comparison between the estimated and observed time series of precipitation for the year 2004 using different methods: (a), AA; (b), NR; (c), GC; (d), NRGC; (e), IDW; (f), MIDW; (g), CCW; (h), LR; (i), MLR; (j), MI; (k), NIPALS; (l), UK; (m), EM; (n), CS; (o), MCCW; (p), MCCWID; (q), NRID; (r), ONRID; (s), NRIDWCC; (t), MNR; (u), MNR-T.
Atmosphere 11 00389 g003aAtmosphere 11 00389 g003b
Figure 4. Comparison between the estimated and observed time series of precipitation for the year 2011 using different methods: (a), AA; (b), NR; (c), GC; (d), NRGC; (e), IDW; (f), MIDW; (g), CCW; (h), LR; (i), MLR; (j), MI; (k), NIPALS; (l), UK; (m), EM; (n), CS; (o), MCCW; (p), MCCWID; (q), NRID; (r), ONRID; (s), NRIDWCC; (t), MNR; (u), MNR-T.
Atmosphere 11 00389 g004aAtmosphere 11 00389 g004b
Figure 5. Comparison between the estimated and observed time series of precipitation for the years from 1990 to 1998 using different methods: (a), AA; (b), NR; (c), GC; (d), NRGC; (e), IDW; (f), MIDW; (g), CCW; (h), LR; (i), MLR; (j), MI; (k), NIPALS; (l), UK; (m), EM; (n), CS; (o), MCCW; (p), MCCWID; (q), NRID; (r), ONRID; (s), NRIDWCC; (t), MNR; (u), MNR-T.
Atmosphere 11 00389 g005aAtmosphere 11 00389 g005bAtmosphere 11 00389 g005cAtmosphere 11 00389 g005dAtmosphere 11 00389 g005e
Figure 6. Scatter plot of estimated and observed precipitation values for different methods: (a), AA; (b), NR; (c), GC; (d), NRGC; (e), IDW; (f), MIDW; (g), CCW; (h), LR; (i), MLR; (j), MI; (k), NIPALS; (l), UK; (m), EM; (n), CS; (o), MCCW; (p), MCCWID; (q), NRID; (r), ONRID; (s), NRIDWCC; (t), MNR; (u), MNR-T.
Atmosphere 11 00389 g006aAtmosphere 11 00389 g006bAtmosphere 11 00389 g006cAtmosphere 11 00389 g006d
Table 1. Precipitation data characteristics and the geographic location of the implemented stations.
StationLatitude (N)Longitude (E)Elevation
(m)
Statistical Properties
Index of AridityClimate TypeMin Rainfall (mm)Max
Rainfall
(mm)
Average Rainfall (mm)Standard
Deviation
Motta: Target11.0737.8723973.57dry/arid0.0443.696.68108.8
Adet11.2737.4922243.50dry/arid0.0463.4100.3110.3
Amba Marim11.2039.2228973.17dry/arid0.0529.475.23111.7
Ancharo11.0539.7821743.26dry/arid0.0598.898.29114.2
Bahir Dar11.6037.3018383.94dry/arid0.0649.5117.8155.2
Combolcha11.0839.7218572.83dry/arid0.0542.884.5897.45
Degelo10.4239.2526052.81dry/arid0.0546.973.24104.6
Dejein10.1738.1524454.01dry/arid0.0645.4112.2123.61
Gondar12.6137.4722963.17dry/arid0.0568.997.03117.3
Haik11.3139.6824963.51dry/arid0.0880.999.65112.9
Korem12.3037.3024702.75dry/arid0.0435.681.0198.15
Mekane Selem10.7438.7626342.89dry/arid0.0456.078.2587.89
Nefas Mewcha11.7338.4728983.75dry/arid0.0690.187.23116.2
Yejuibe10.1537.7521523.76dry/arid0.0640.2111.4127.9
Yetemen10.3338.1524153.99dry/arid0.0872.1109.2132.5
Table 2. Correlation matrix of the investigated stations.
MottaAdetAmba MarimAncharoBahir DarCombolchaDegeloDejeinGondarHaikKoremMekane SelemNefas MewchaYejuibeYetemen
Motta1.00.910.790.760.890.820.710.880.840.770.720.790.840.810.82
Adet0.911.00.780.420.910.780.790.820.840.700.650.780.850.790.79
Amba Marim0.800.781.00.900.780.920.930.830.740.880.820.870.920.680.75
Ancharo0.760.420.901.00.730.910.890.780.660.900.820.830.830.620.71
Bahir Dar0.890.910.780.731.00.760.700.850.880.710.690.750.850.770.81
Combolcha0.820.780.920.910.761.00.760.820.750.890.820.810.890.670.69
Degelo0.710.790.930.890.700.761.00.890.790.880.810.820.940.740.80
Dejein0.880.820.830.780.850.820.891.00.860.770.710.800.800.760.80
Gondar0.840.840.740.660.880.750.790.861.00.340.650.710.430.740.76
Haik0.770.700.880.900.710.890.880.770.341.00.430.750.770.600.70
Korem0.720.650.820.820.690.820.810.710.650.431.00.710.810.840.65
Mekane Selem0.790.780.870.830.750.810.820.800.710.750.711.00.890.650.79
Nefas Mewcha0.840.850.920.830.850.890.940.800.430.770.810.891.00.710.83
Yejuibe0.810.790.680.620.770.670.740.760.740.600.840.650.711.00.81
Yetemen0.820.790.750.710.810.690.800.800.760.700.650.790.830.811.0
Table 3. Results of the normal homogeneity test (SNHT) and Pettitt’s test for the selected stations.
StationsSNHT TestPettitt’s Testa
p-ValueRisk of Rejecting Ho (%)p-ValueRisk of Rejecting Ho (%)
Motta0.36836.80.16316.30.05
Adet0.86986.90.76176.10.05
Amba Marim0.98498.40.0606.000.05
Ancharo0.94694.60.28028.00.05
Bahir Dar0.74974.90.22022.00.05
Combolcha0.98998.90.99399.30.05
Degelo0.97997.90.39139.10.05
Dejein0.90890.80.0898.900.05
Gondar0.62562.50.16216.20.05
Haik0.99599.50.62262.20.05
Korem0.71571.50.25125.10.05
Mekane Selem0.14414.40.44244.20.05
Nefas Mewcha0.76476.40.65865.80.05
Yejuibe0.75175.10.17017.00.05
Yetemen0.0696.920.18618.580.05
Table 4. Results of the Mann–Kendall (MK) trend test for the investigated stations.
StationMK Trend Testa
p-ValueKendal’s tauRisk of Rejecting Ho (%)
Motta0.552−0.027755.180.05
Adet0.8180.013081.780.05
Amba Marim0.740.08574.000.05
Ancharo0.0500.09505.000.05
Bahir Dar0.147−0.075214.680.05
Combolcha0.256−0.050625.590.05
Degelo0.551−0.036255.130.05
Dejein0.865−0.008286.540.05
Gondar0.7790.008477.880.05
Haik0.882−0.006288.210.05
Korem0.224−0.059622.420.05
Mekane Selem0.404−0.047340.440.05
Nefas Mewcha0.121−0.080312.140.05
Yejuibe0.1720.086317.190.05
Yetemen0.4330.029343.350.05
Table 5. Comparison between the performance criteria values for the different methods applied.
MethodStudied Errors
MAERMSECES-indexSSrPearson
AA25.54738.6710.9980.9990.9980.944
NR22.90033.6950.9980.9990.9980.945
GC28.09939.3870.9980.9990.9980.924
NRGC25.66536.1040.9980.9990.9980.937
IDW23.70935.0110.9980.9980.9980.999
MIDW31.47443.3040.9970.9990.9970.908
CCW25.28835.9190.9980.9990.9980.937
LR35.78554.1300.9960.9990.9960.875
MLR23.18135.5730.9980.9990.9980.940
MI47.64158.7650.9950.9990.9950.864
NIPALS28.41942.5160.9970.9990.9970.914
UK33.60152.7560.9960.9980.9960.884
EM31.27851.4530.9960.9990.9960.872
CS30.42449.5640.9960.9990.9960.881
MCCW25.27636.2300.9980.9990.9980.936
MCCWID28.25446.1670.9970.9990.9970.914
NRID23.17538.0320.9980.9990.9980.929
ONRID23.68937.1140.9980.9990.9980.935
NRIDWCC23.48037.3970.9980.9990.9980.934
MNR23.98335.9440.9980.9990.9980.943
MNR-T26.95837.7130.9980.9990.9980.932