O3 Sensitivity and Contributions of Different NMHC Sources in O3 Formation at Urban and Suburban Sites in Shanghai

 ,
,
Abstract
1. Introduction
2. Methodology
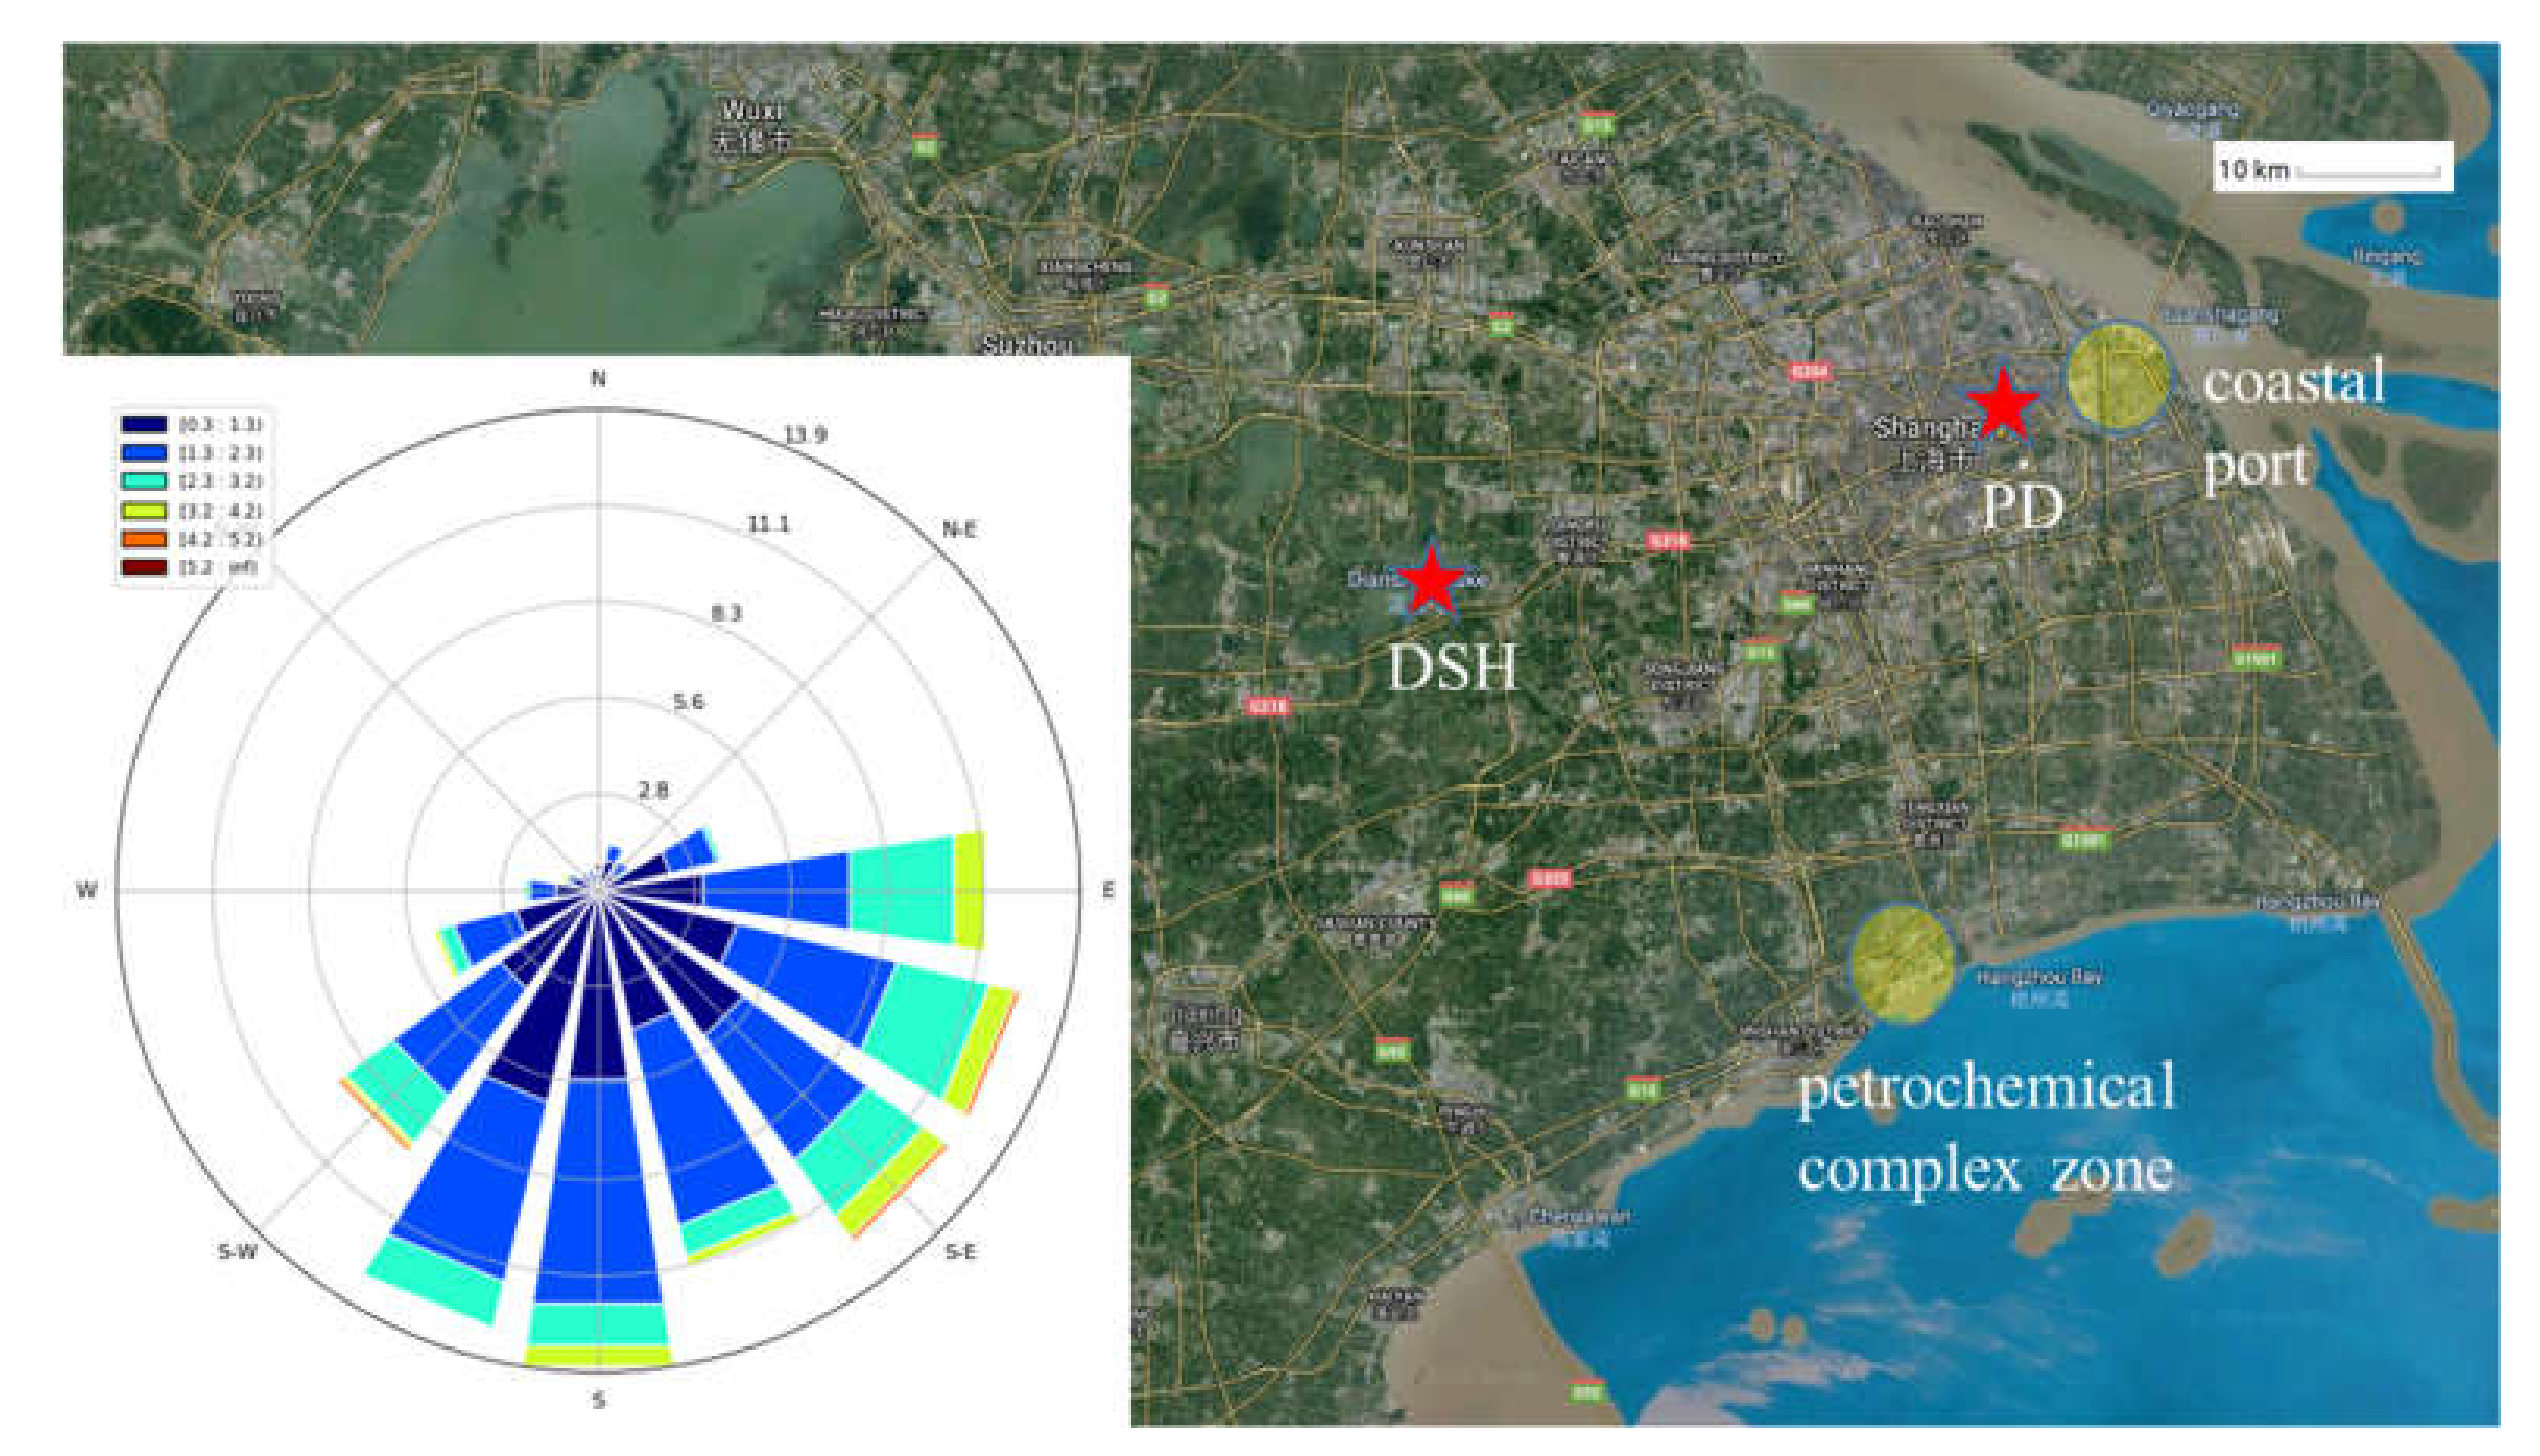
2.1. Measurements
2.2. Positive Matrix Factorization Model
2.3. Observation-Based Model
3. Results and Discussion
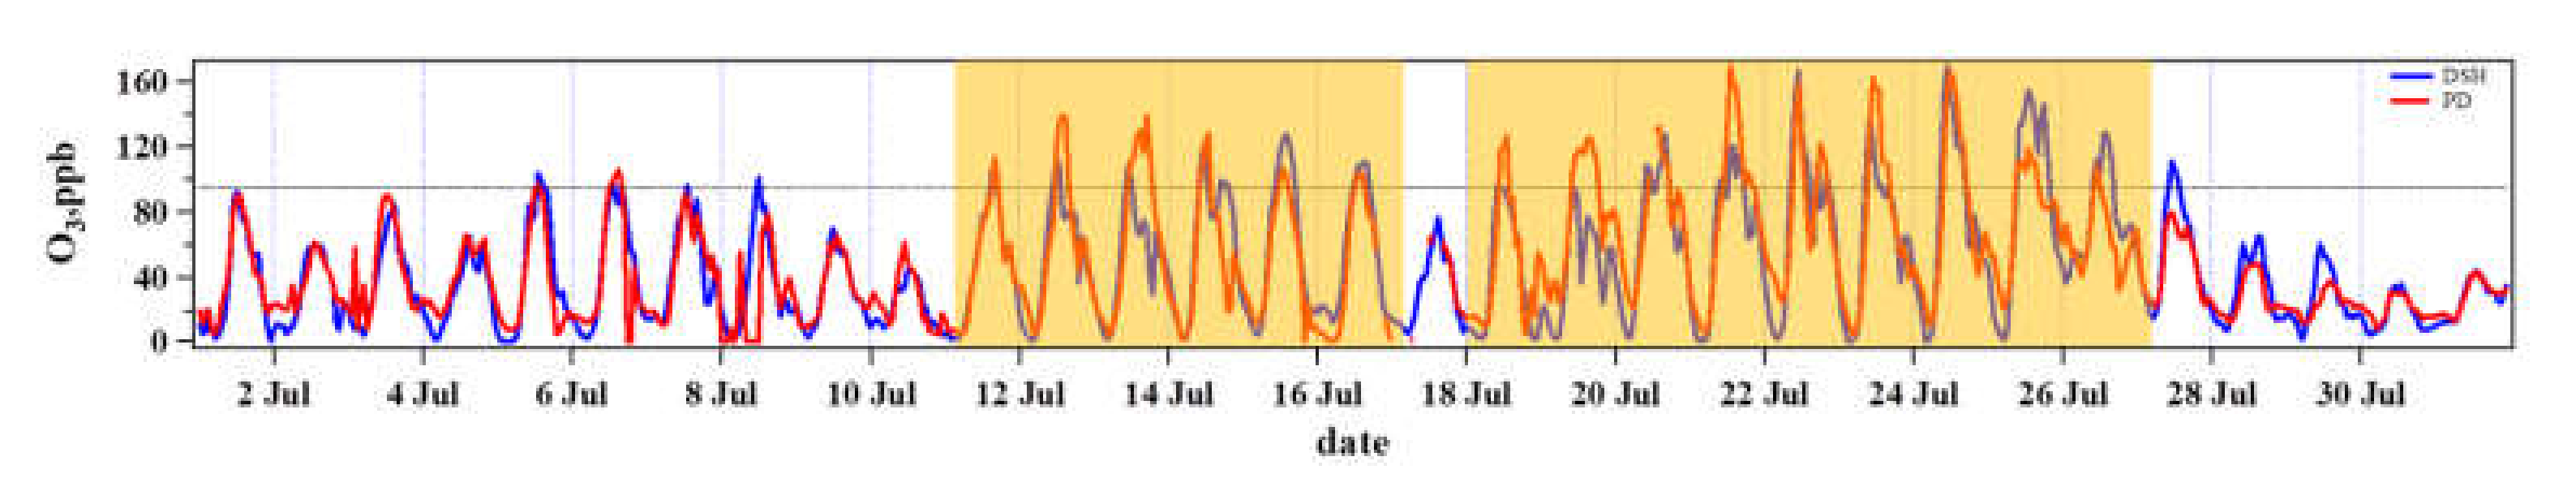
3.1. O3 Pollution Characteristics
3.2. O3 Formation Sensitivity to Its Precursors during Pollution Episodes
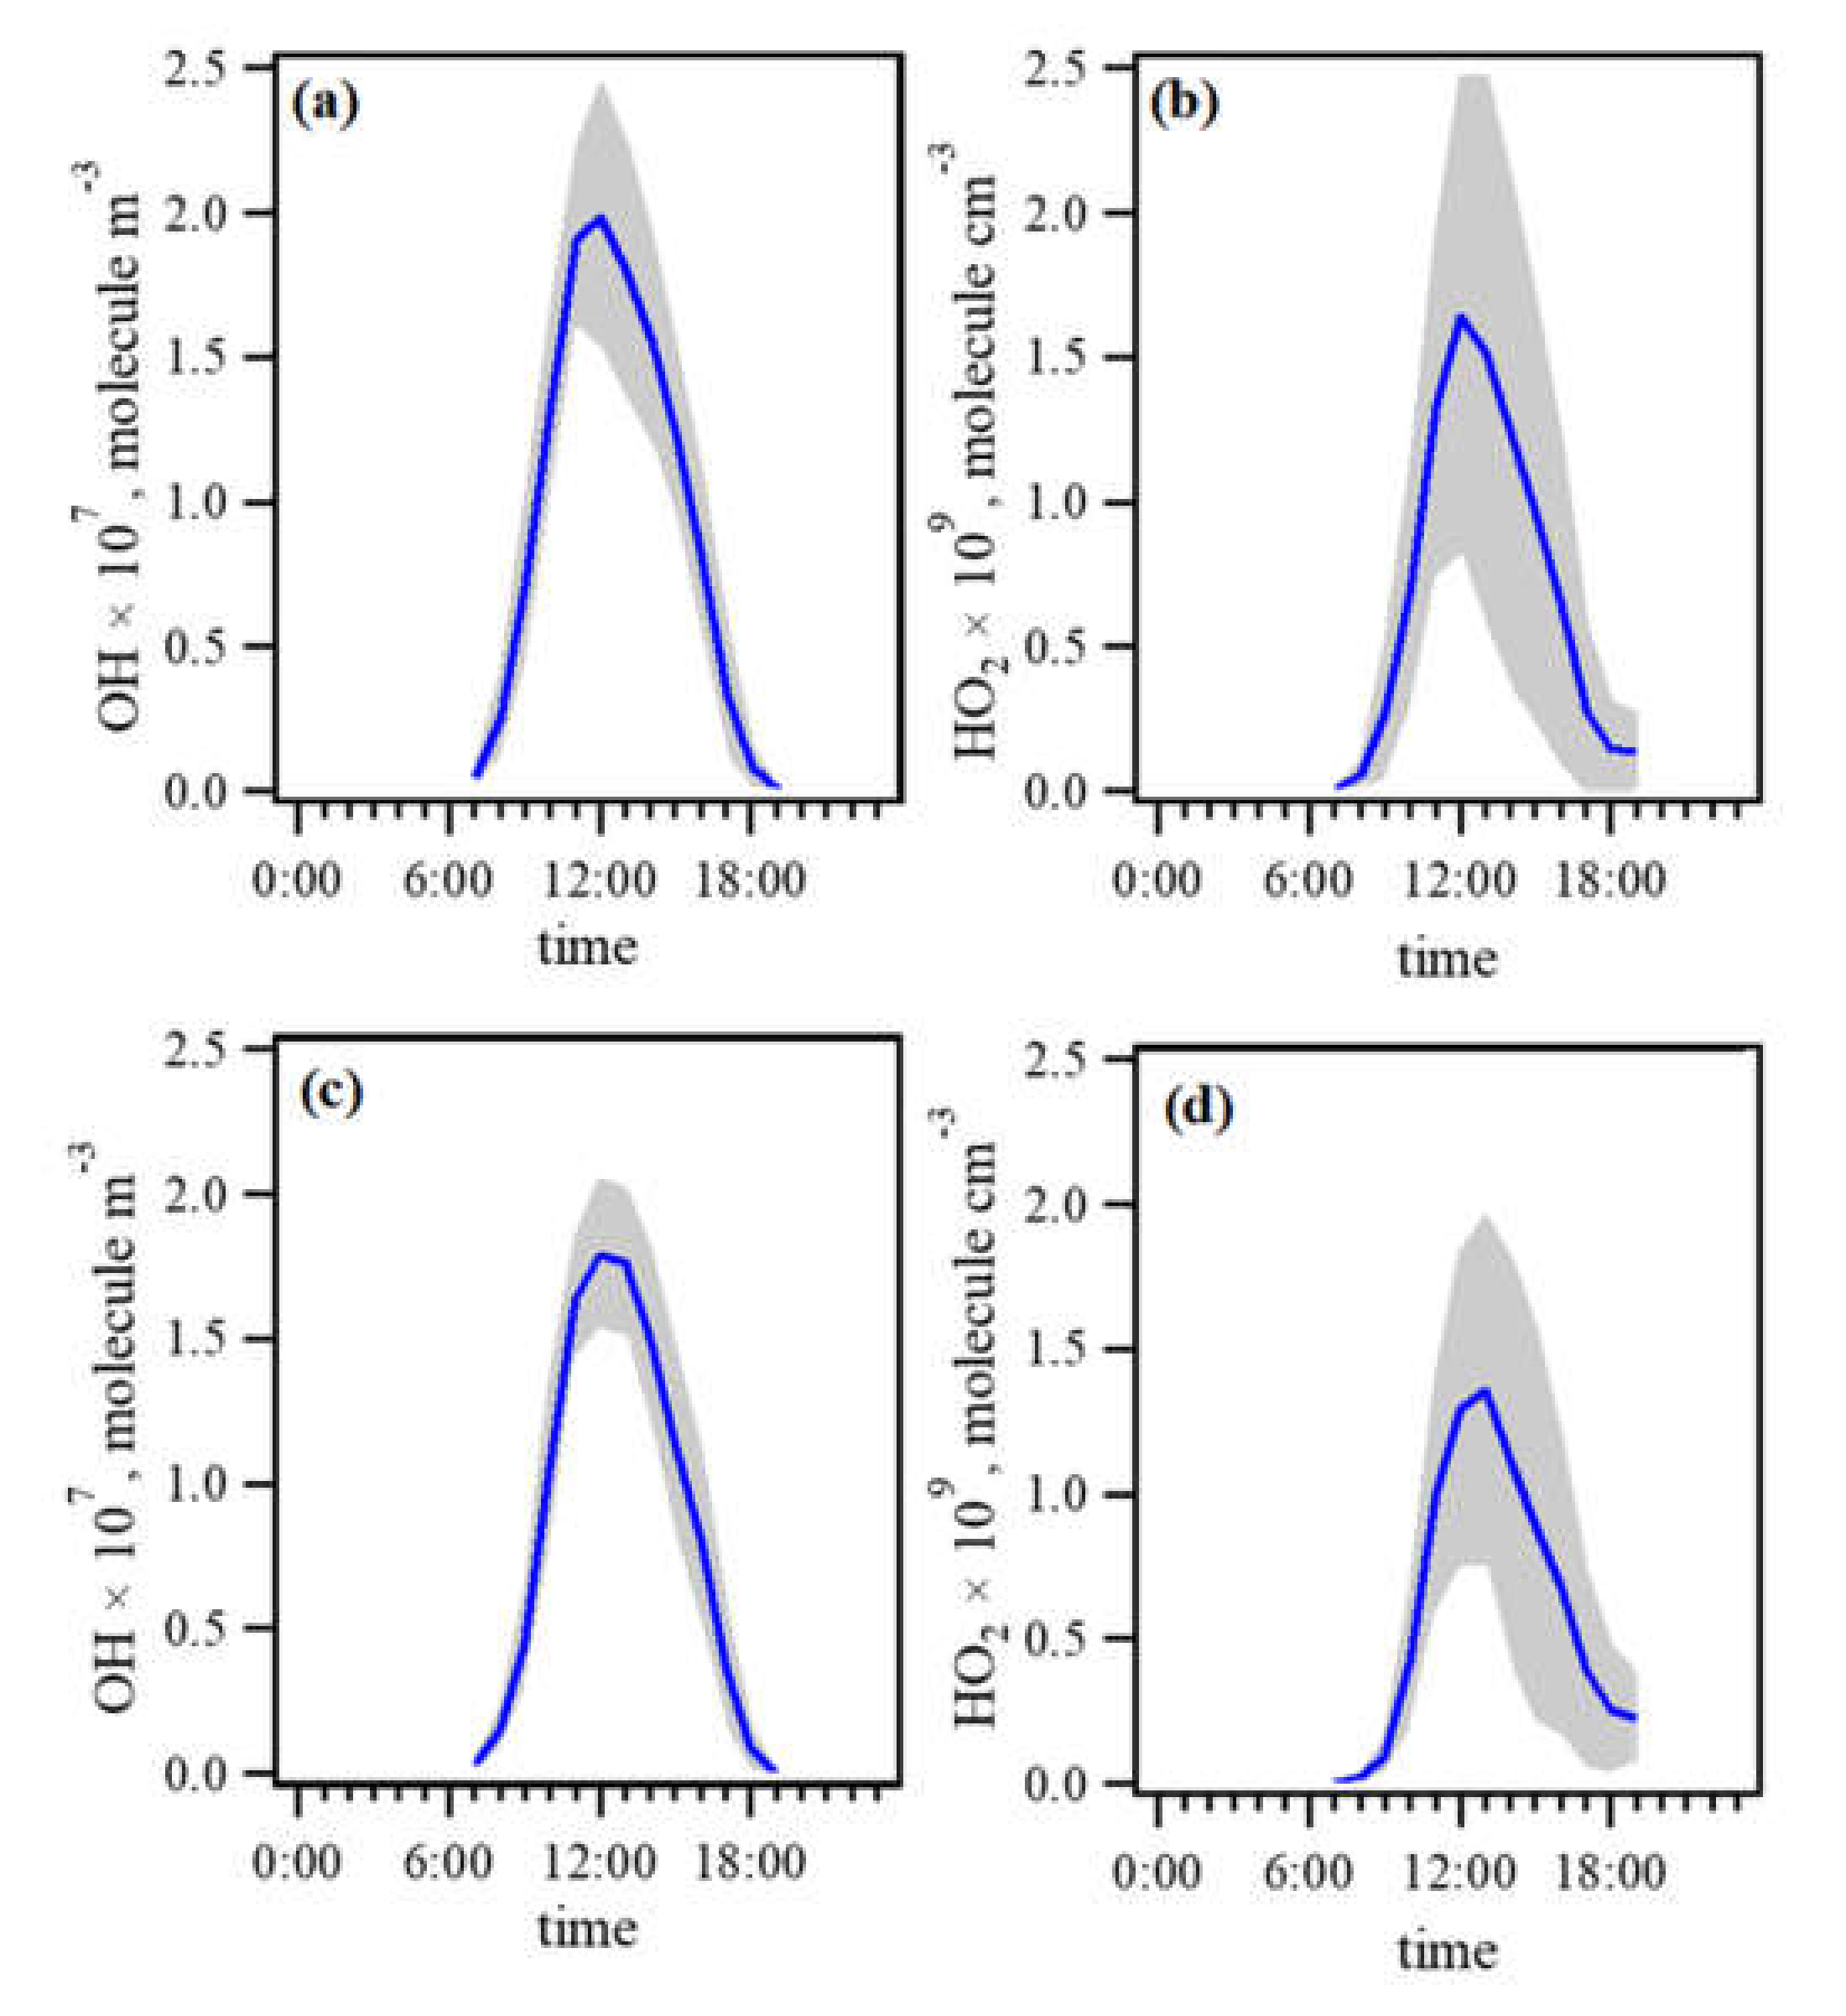
3.2.1. Model Performance Evaluation: OH and HO2 Simulation
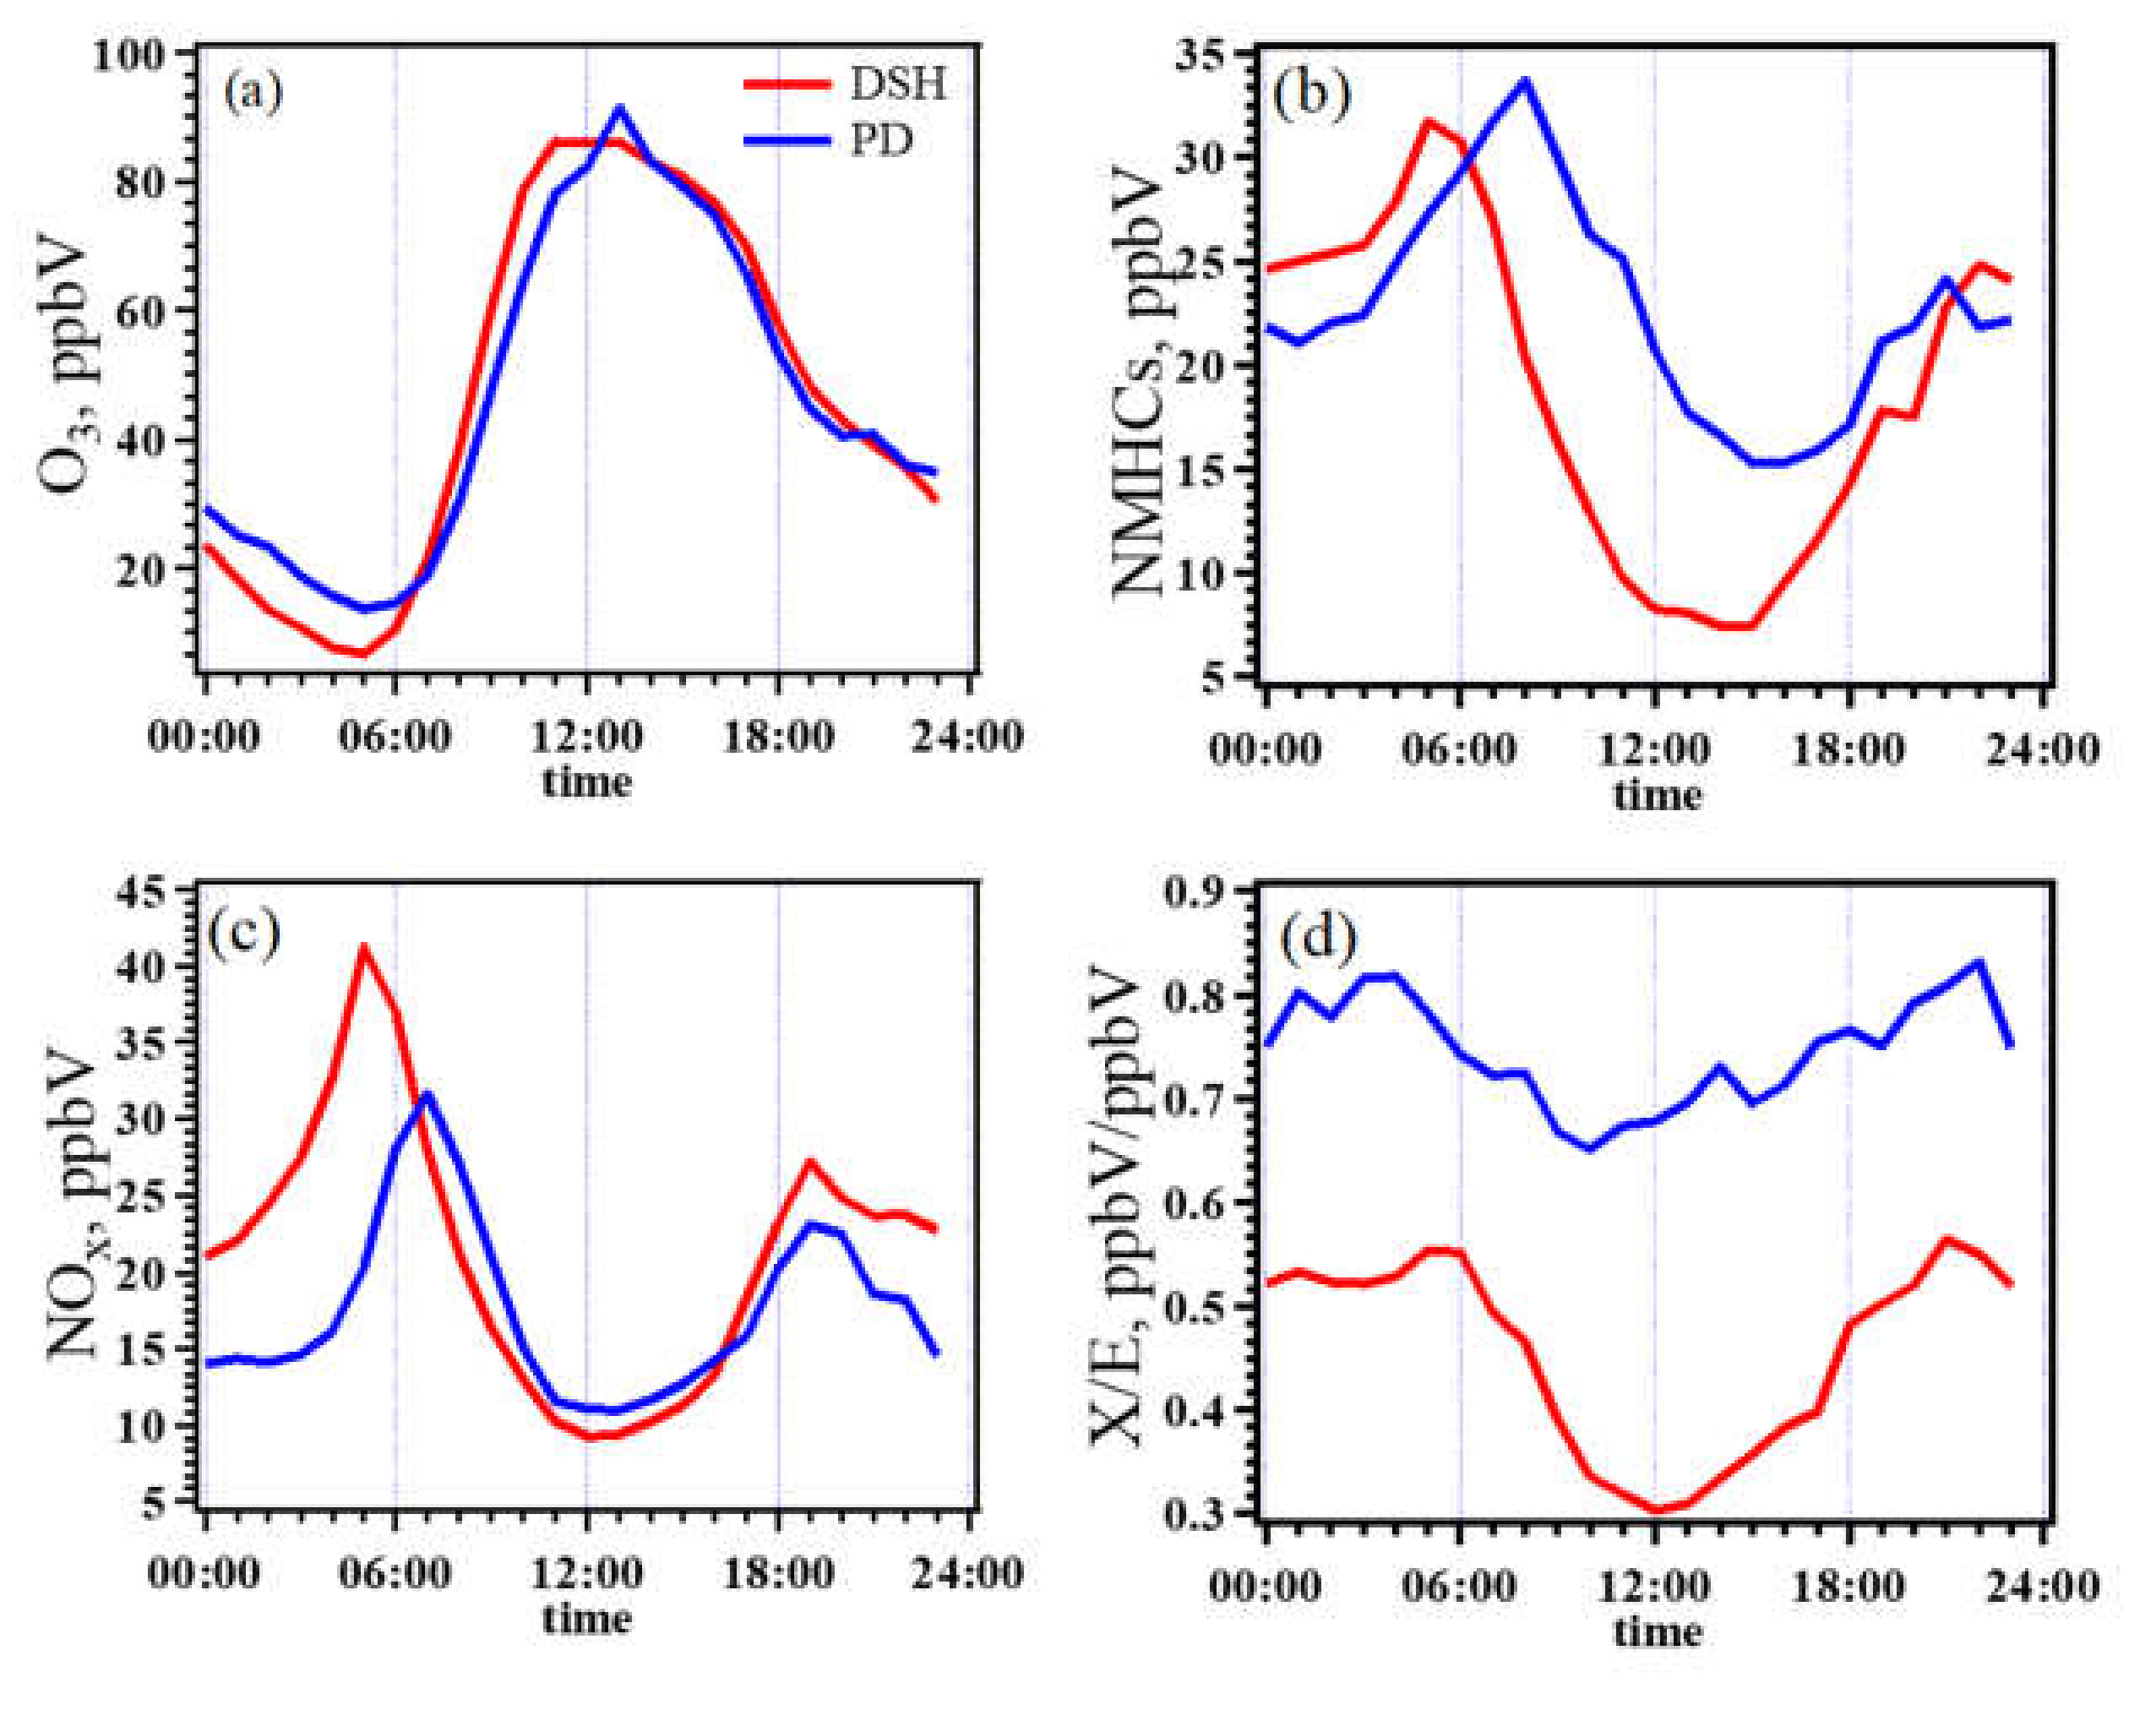
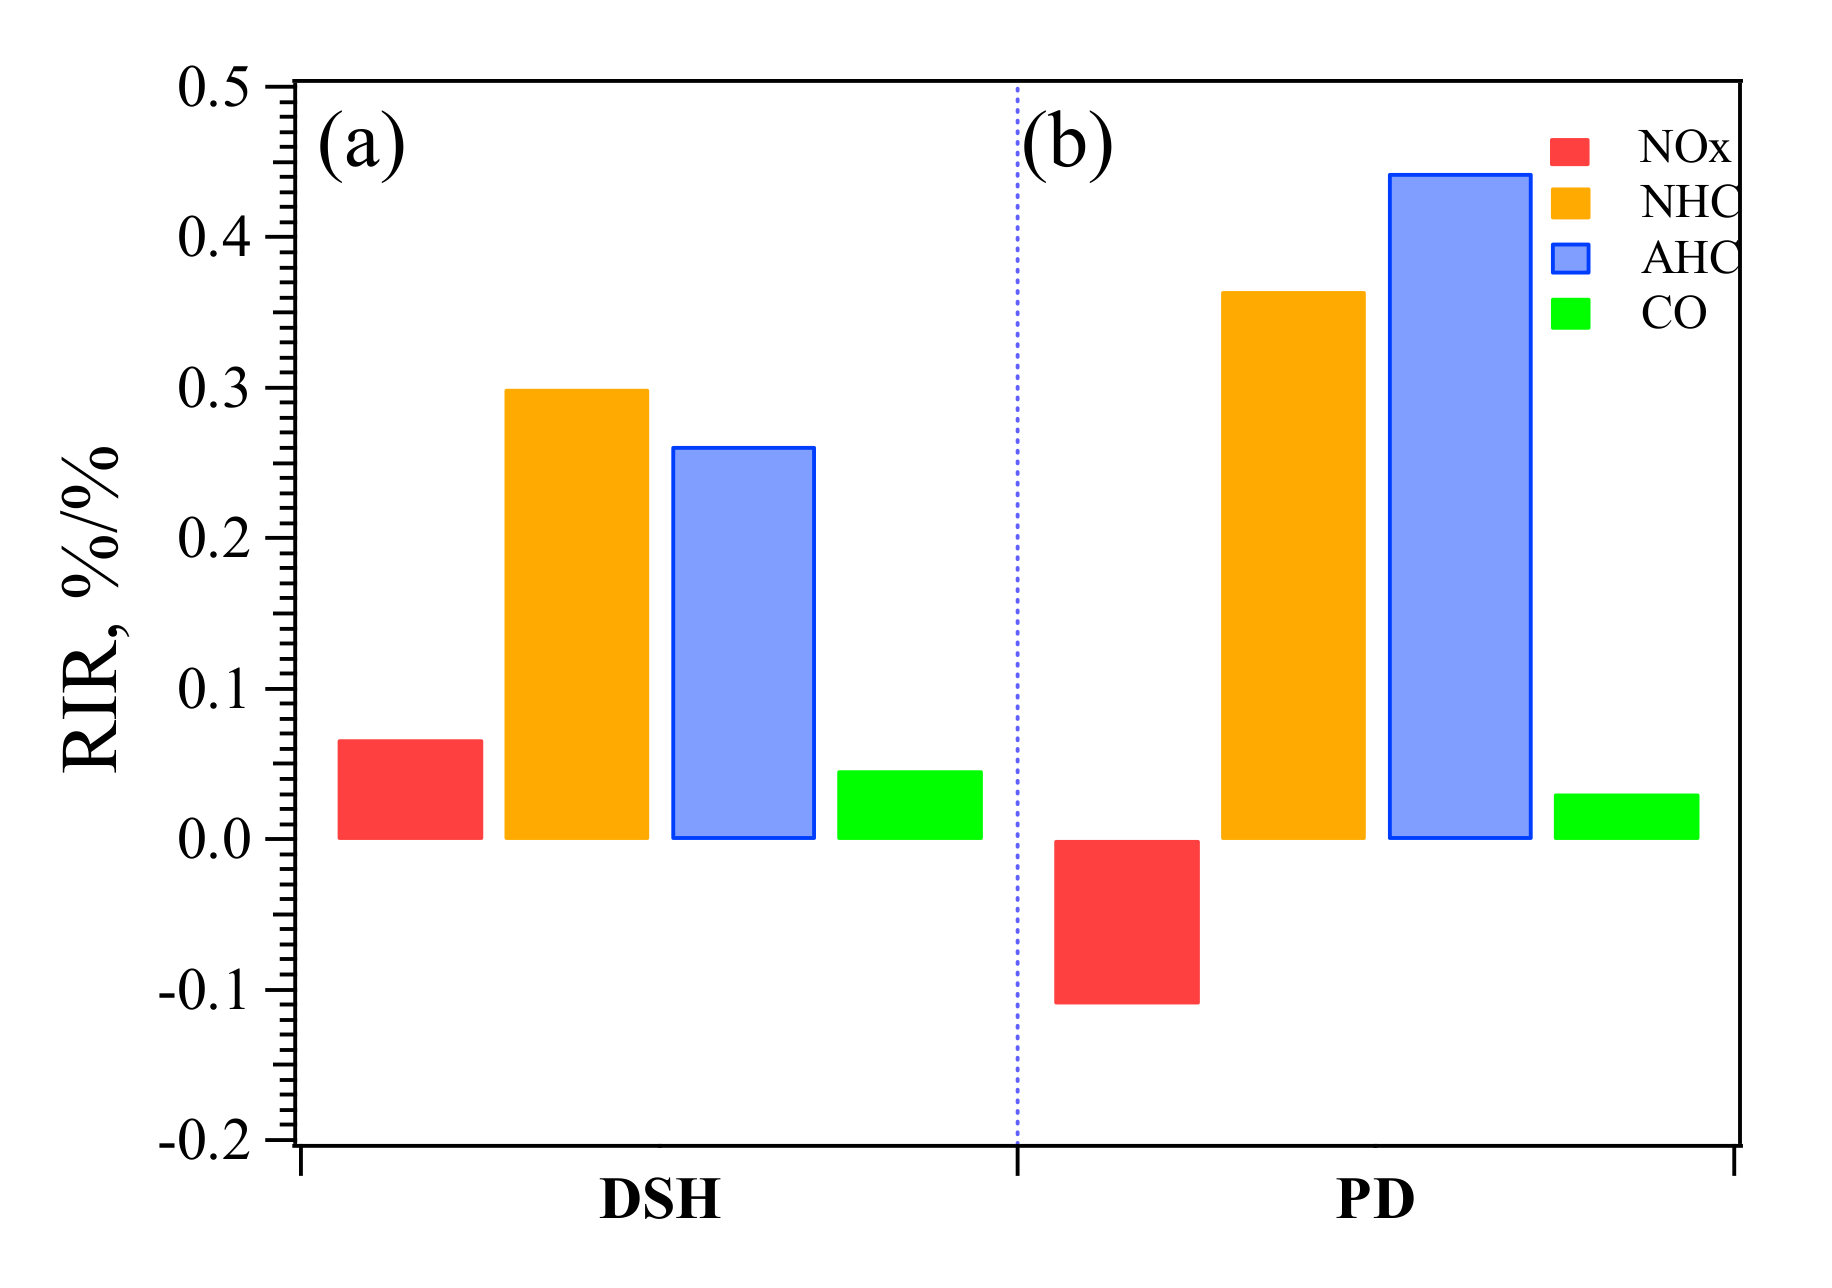
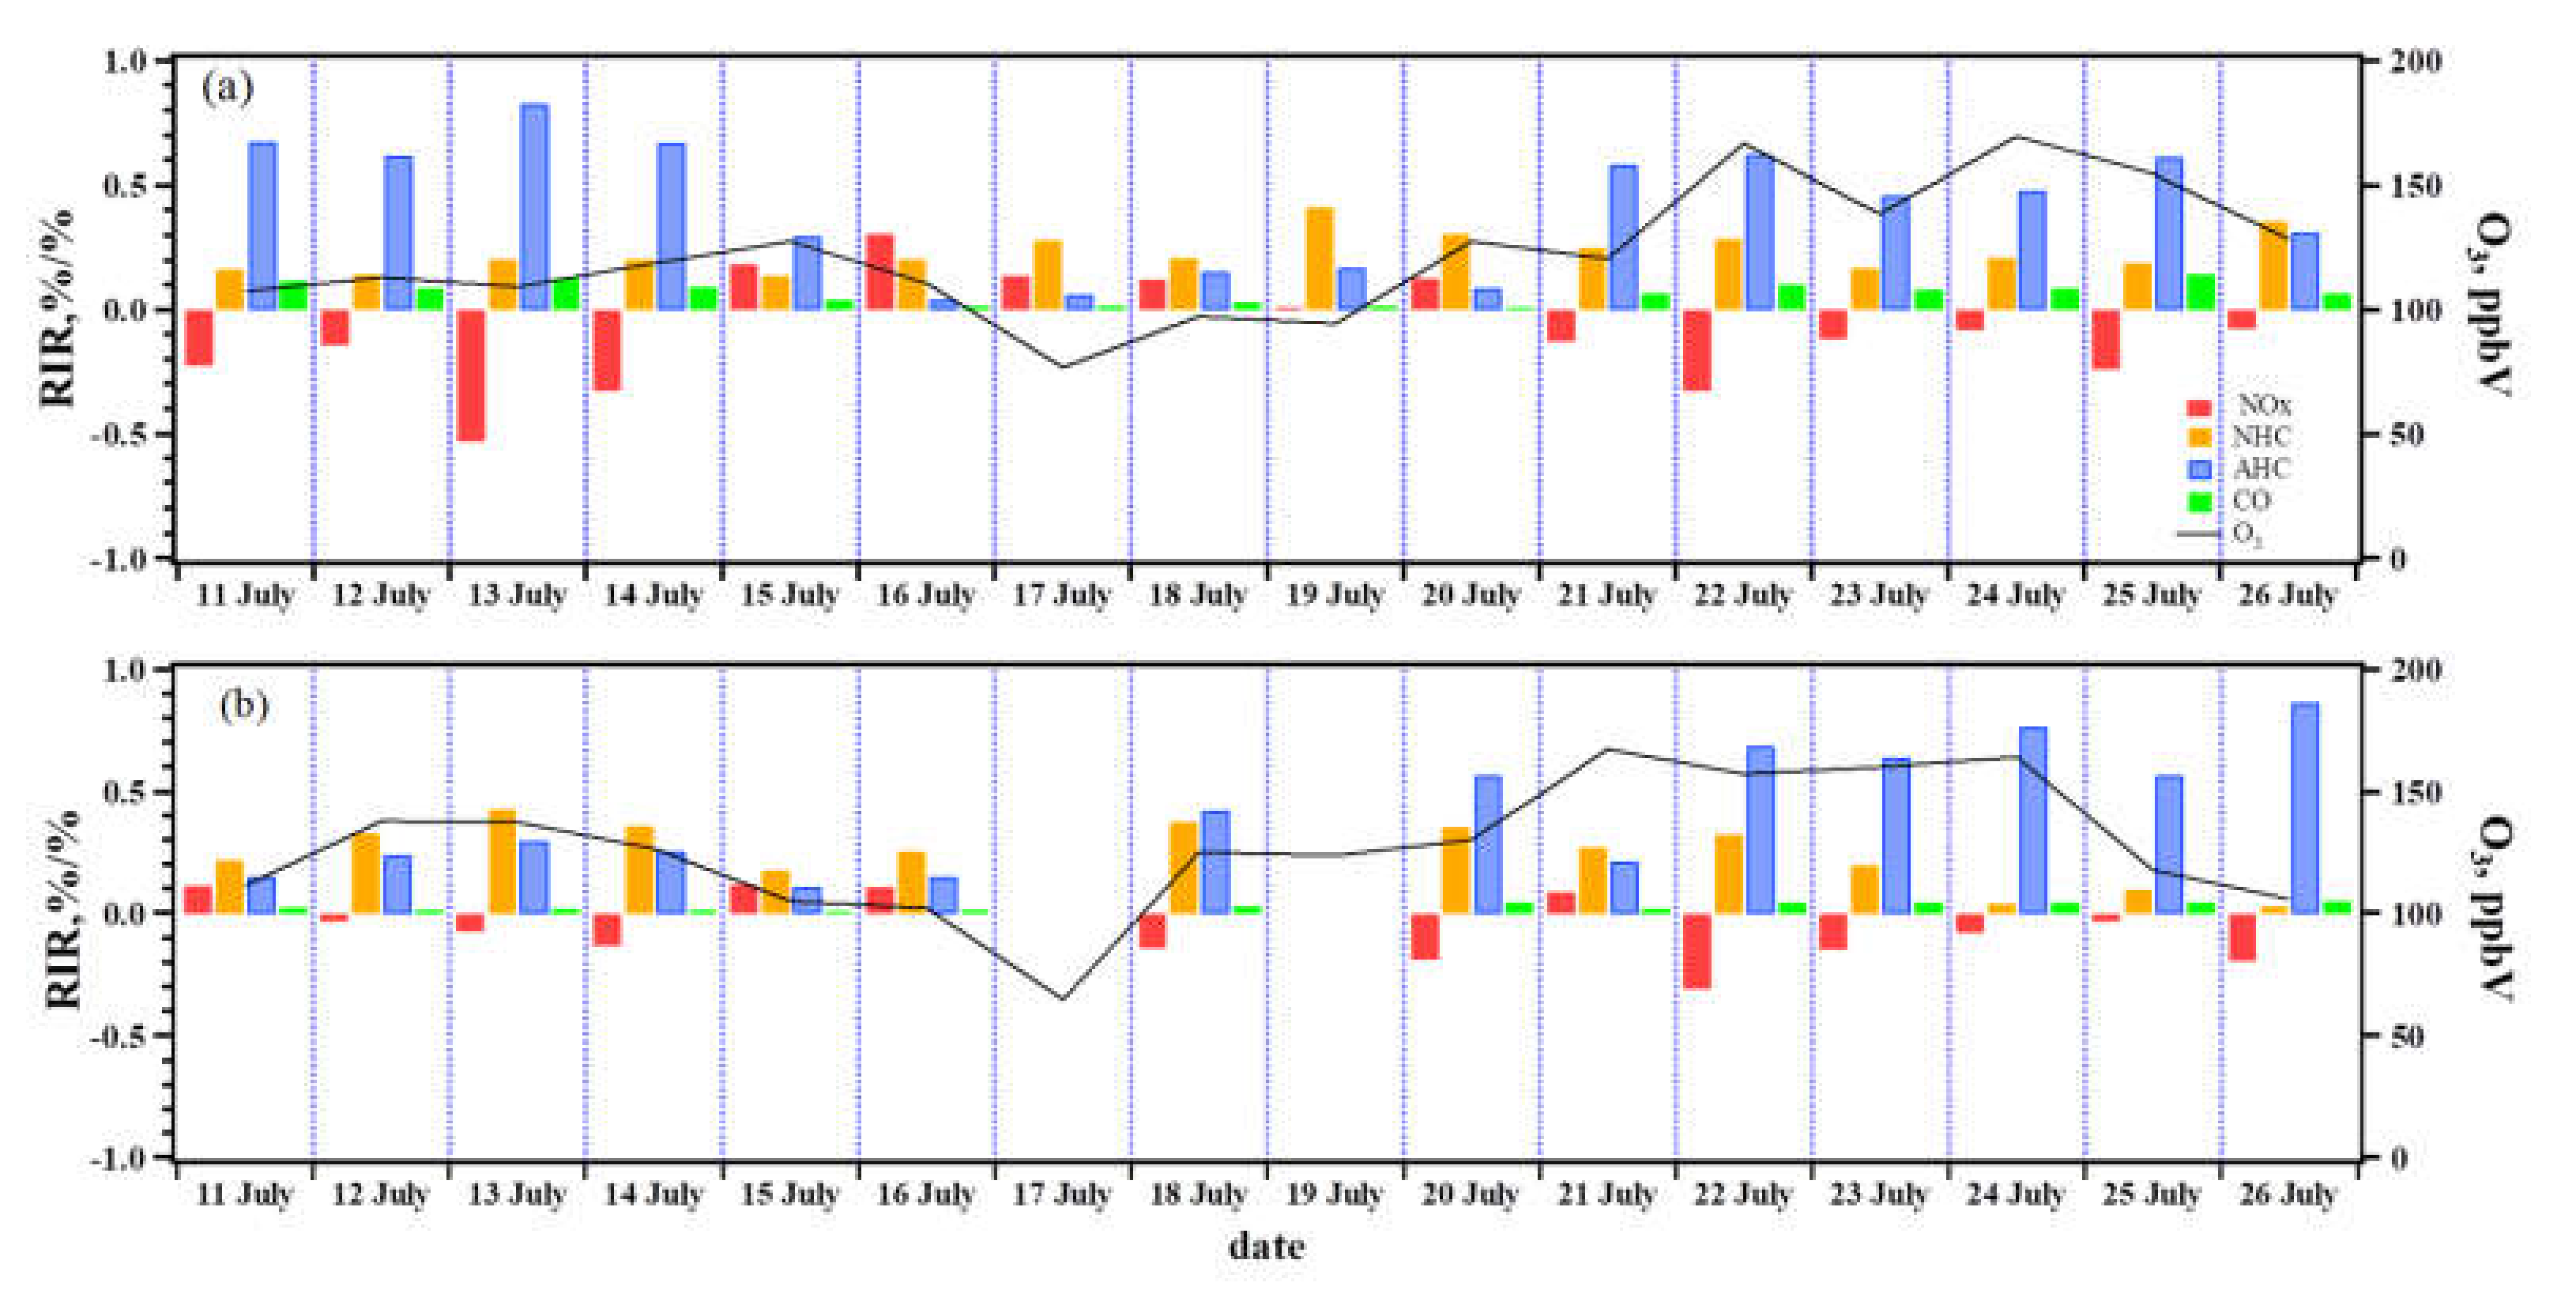
3.2.2. O3–NMHC–NOx Sensitivity at the PD and DSH Sites
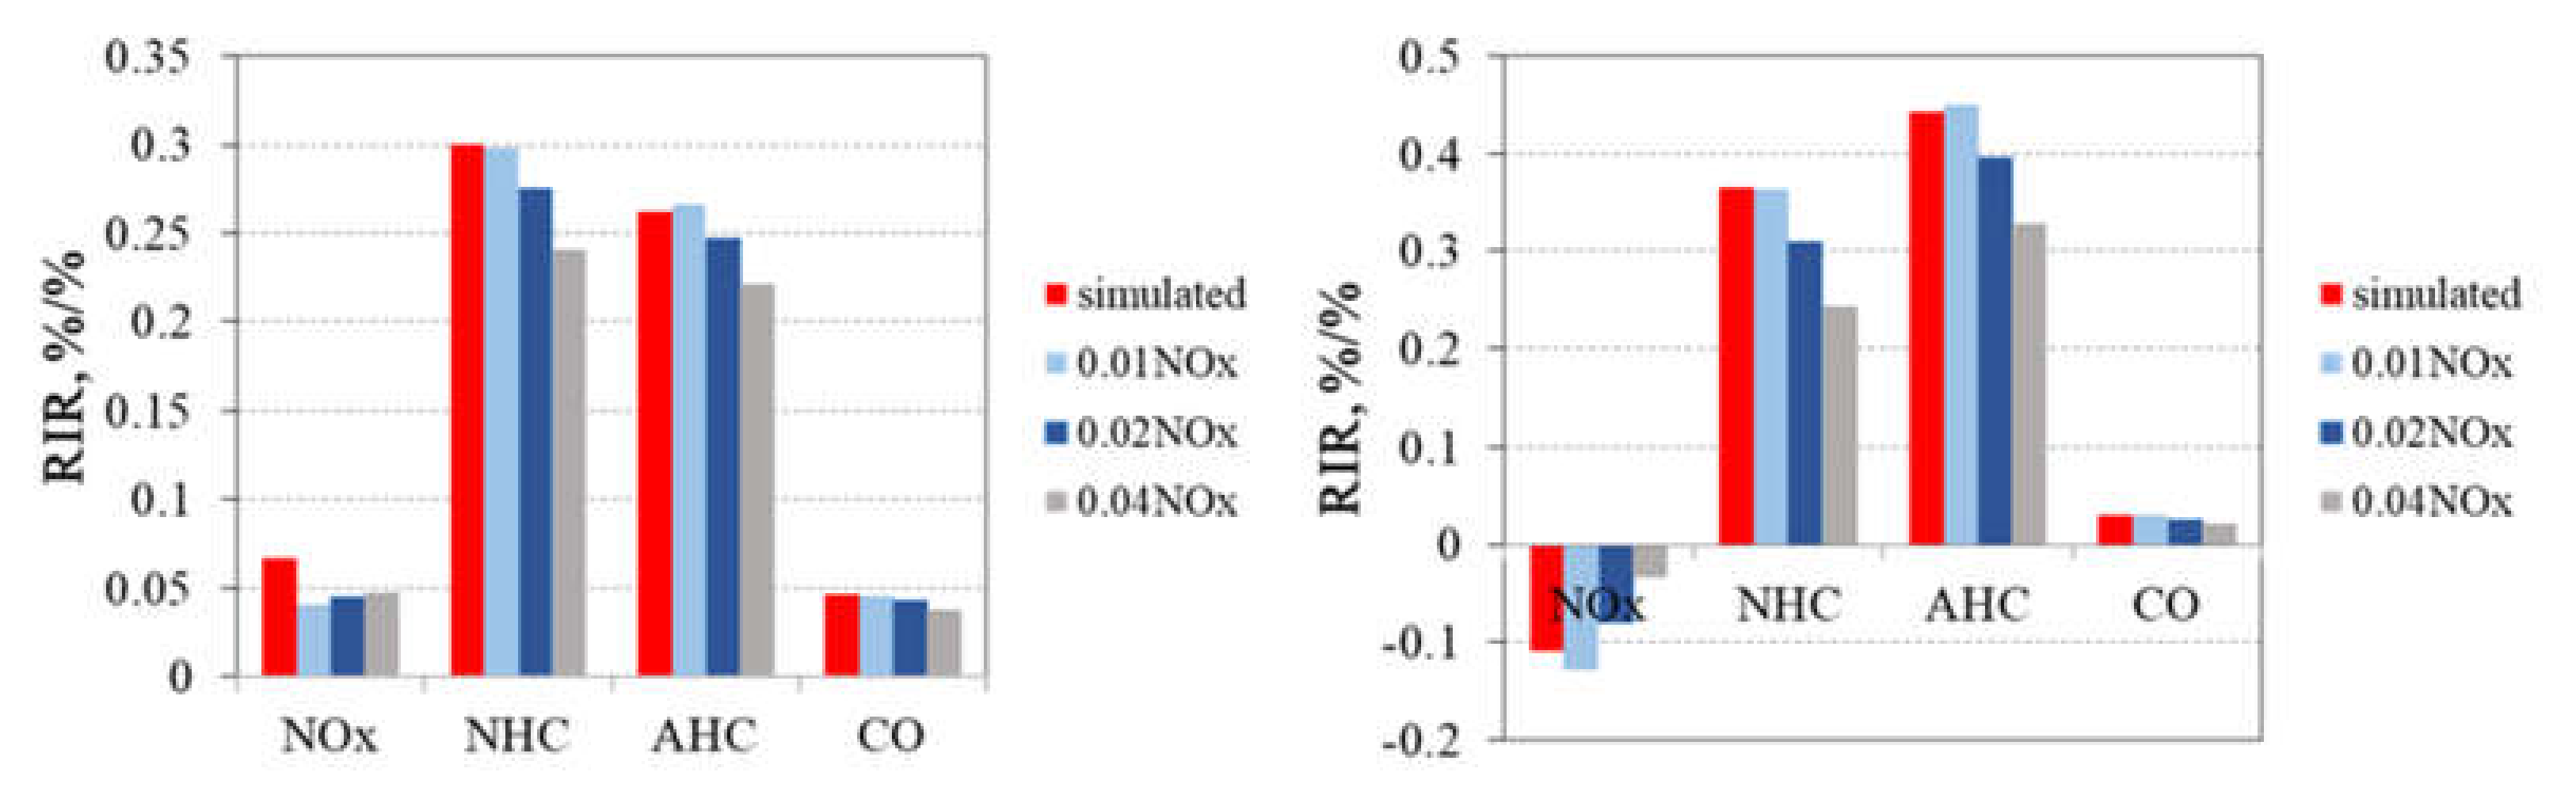
3.2.3. Impact of Gaseous Nitrous Acid (HONO) on OBM-Derived O3 Formation Regime
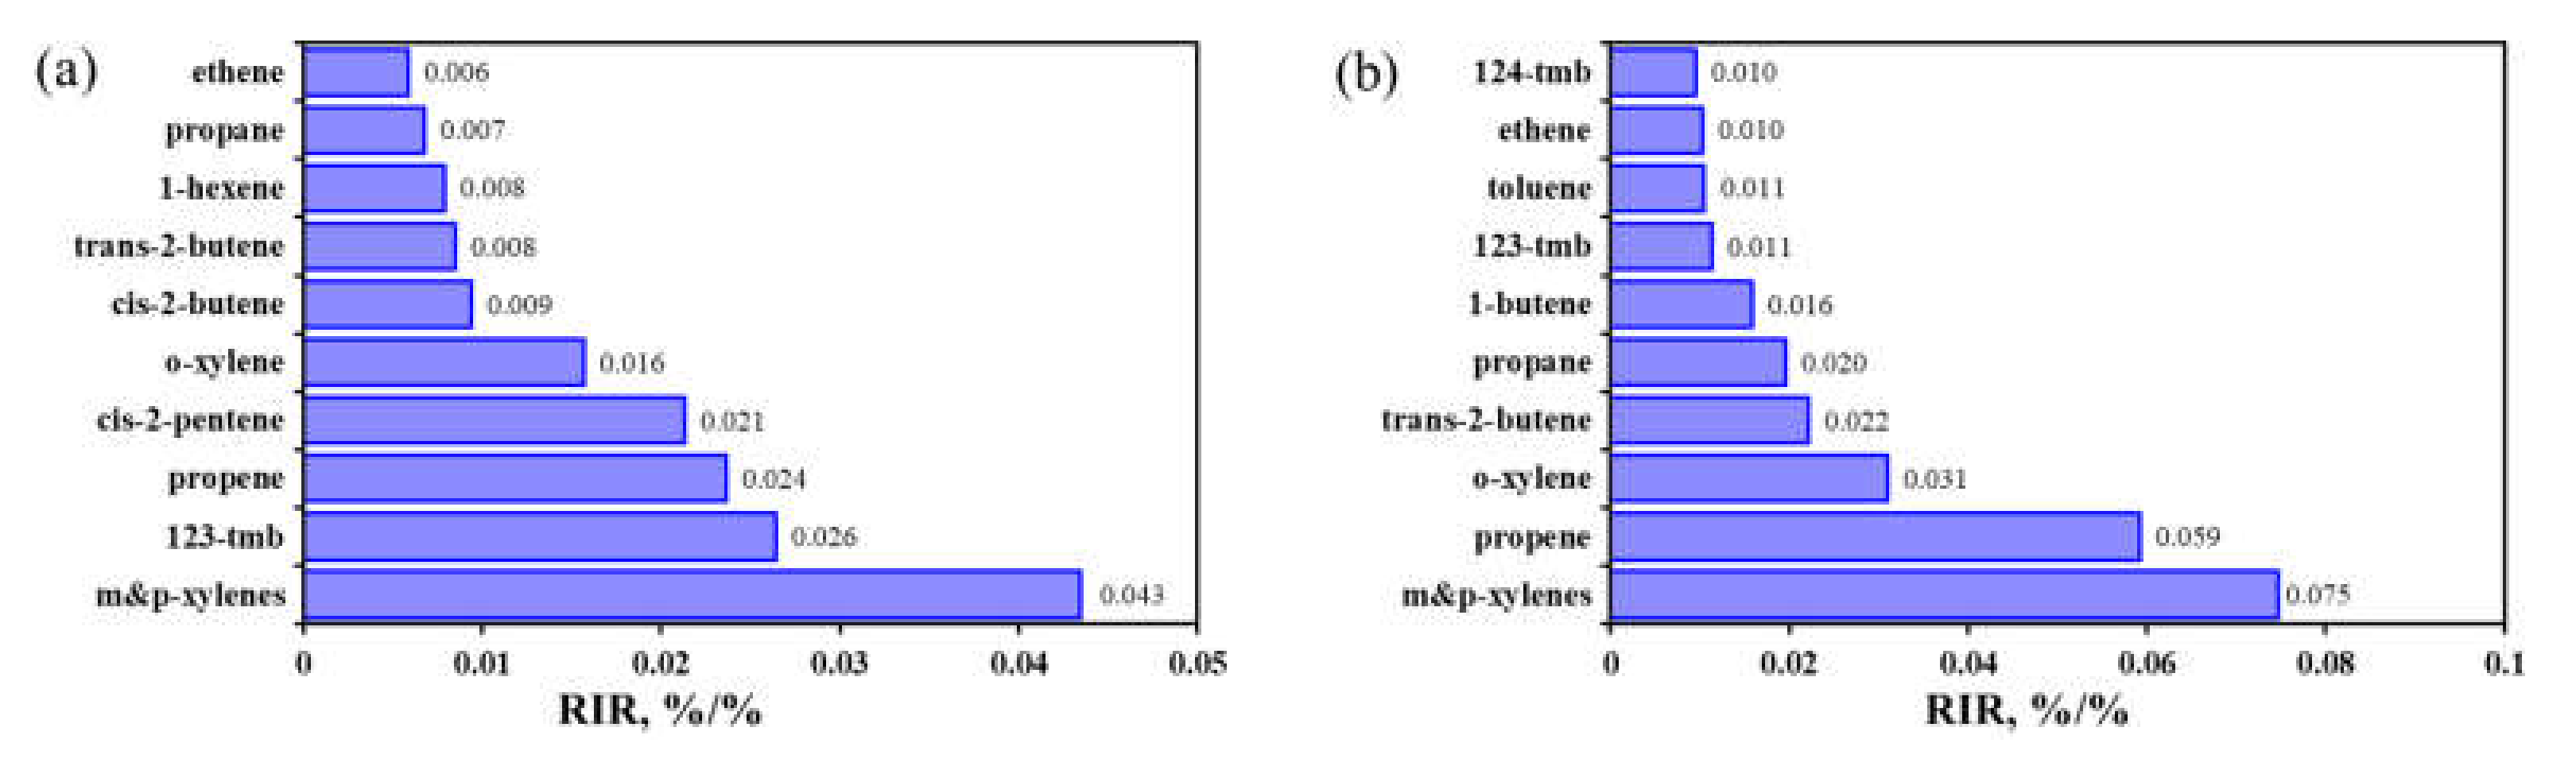
3.2.4. Key Anthropogenic NMHC Species in O3 Formation
3.3. Contributions from Different Anthropogenic Sources on O3 Formation
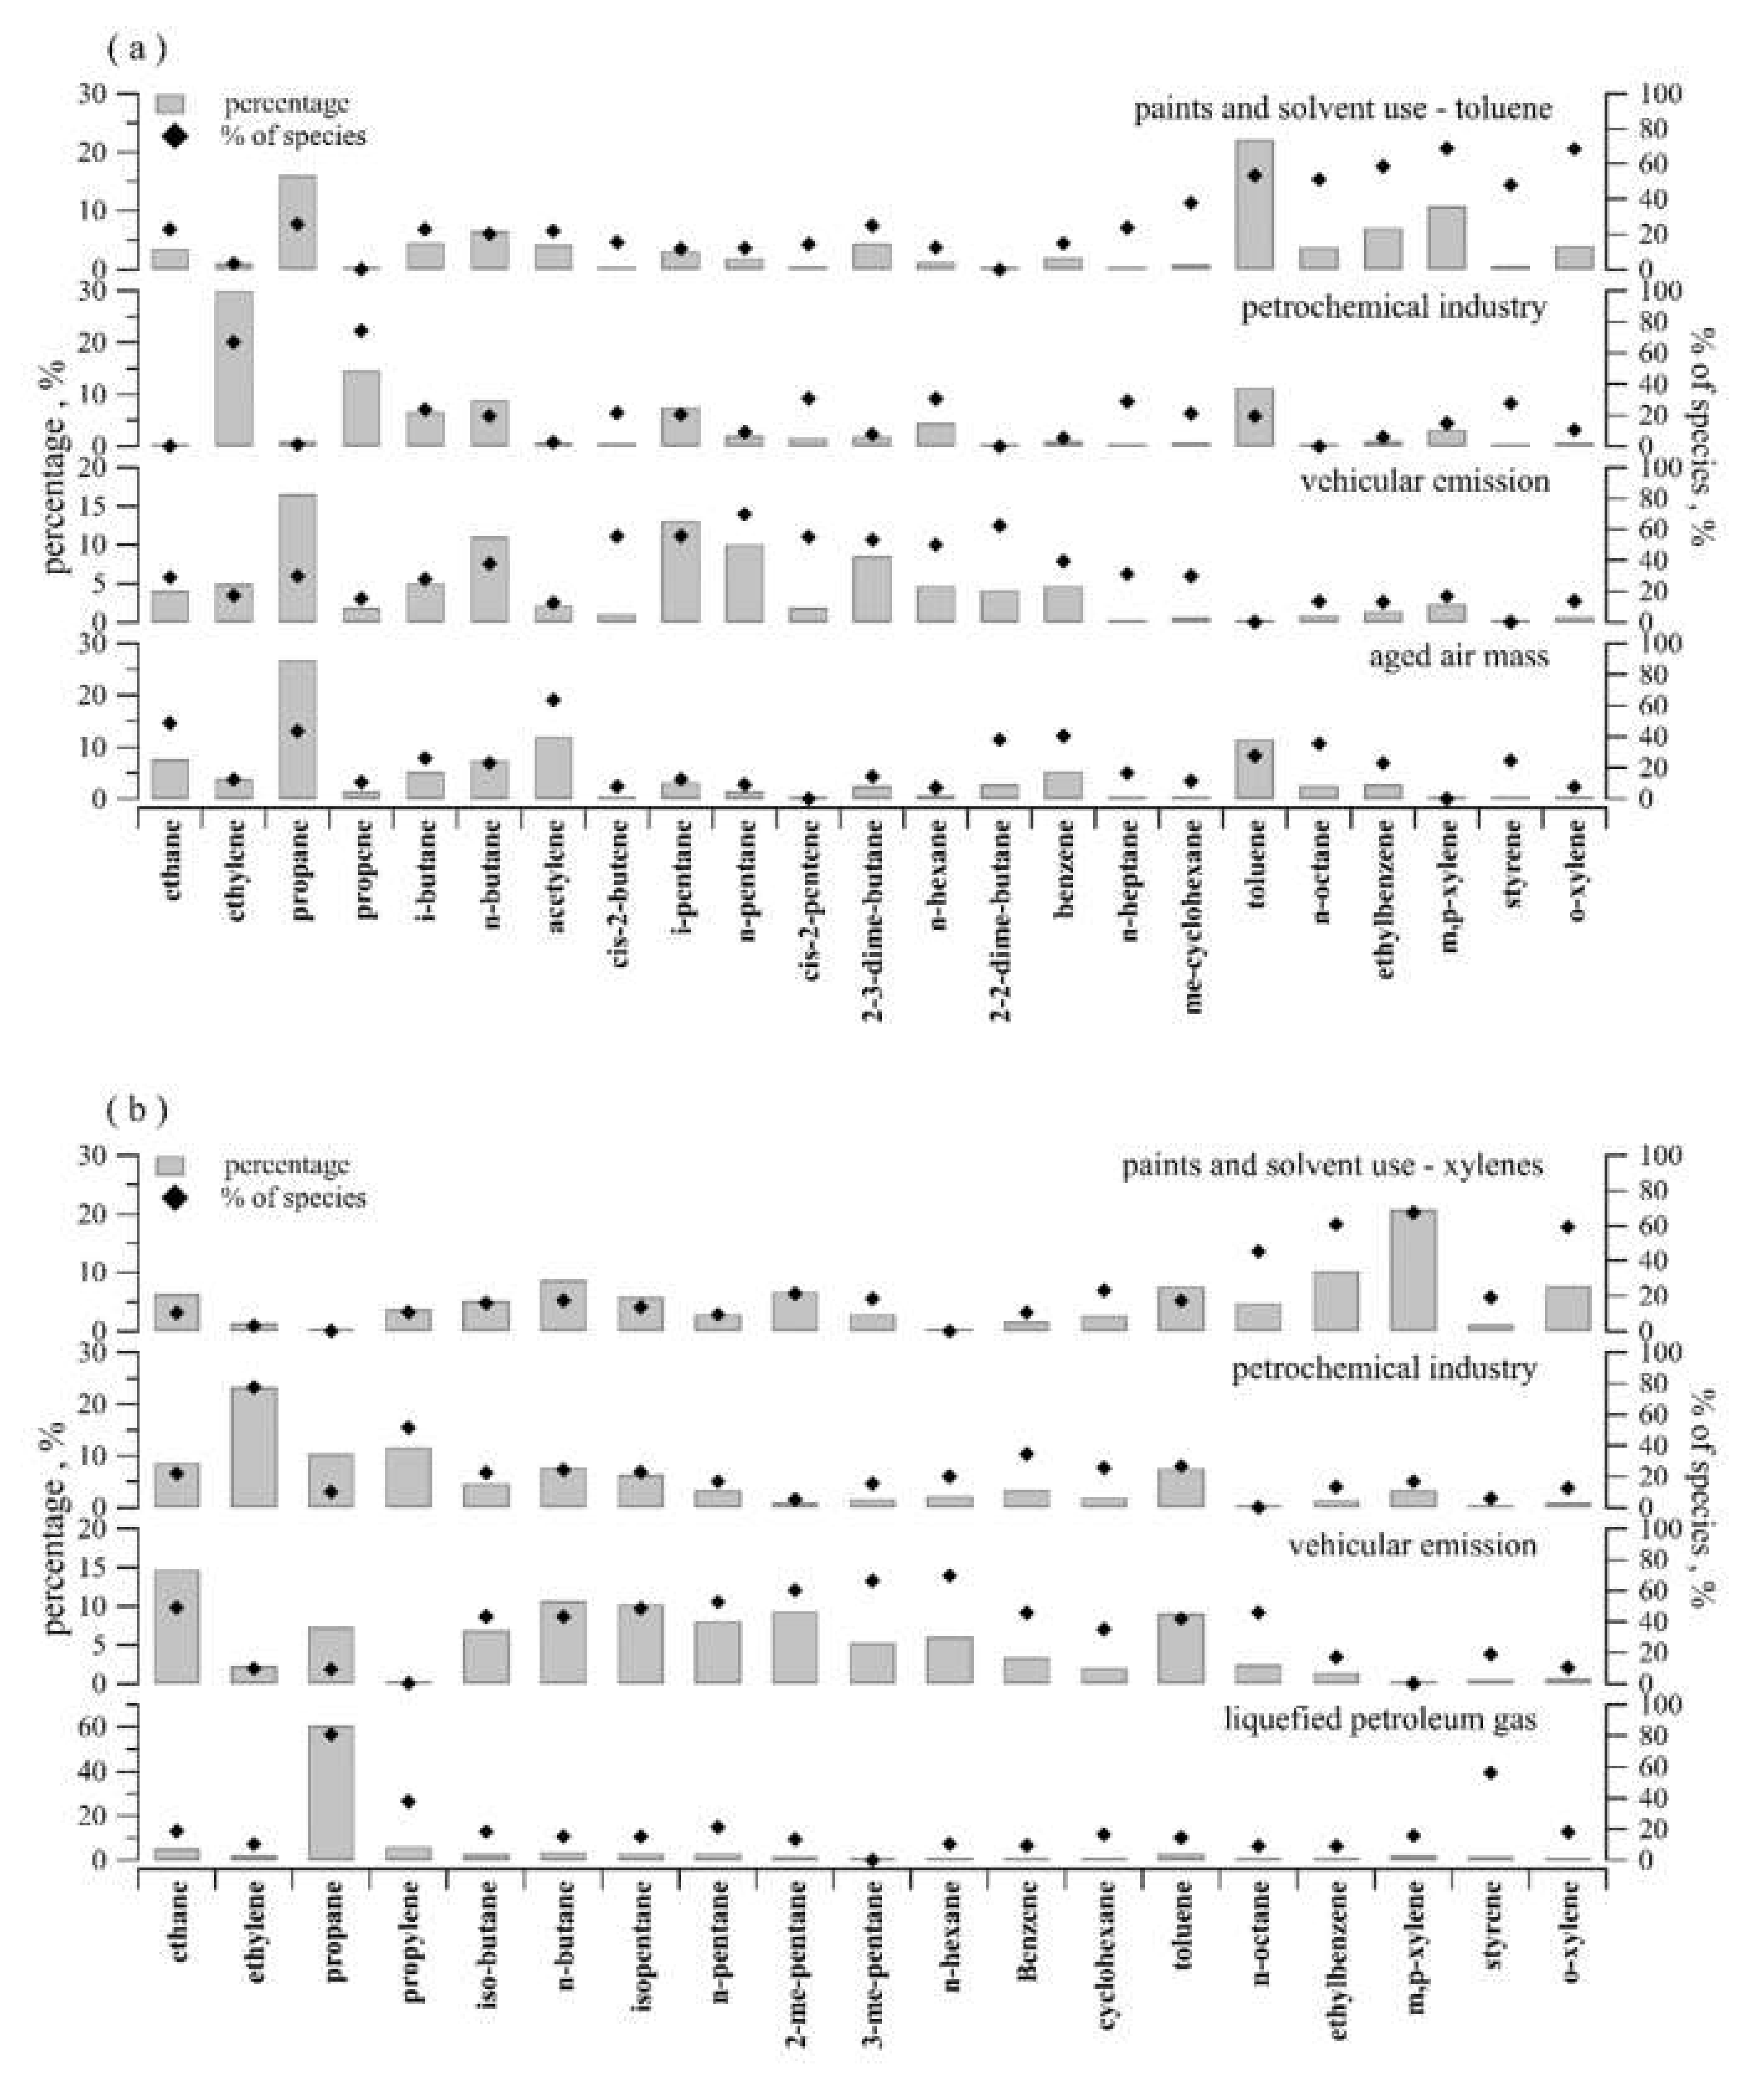
3.3.1. Source Apportionment of NMHCs by the PMF Model
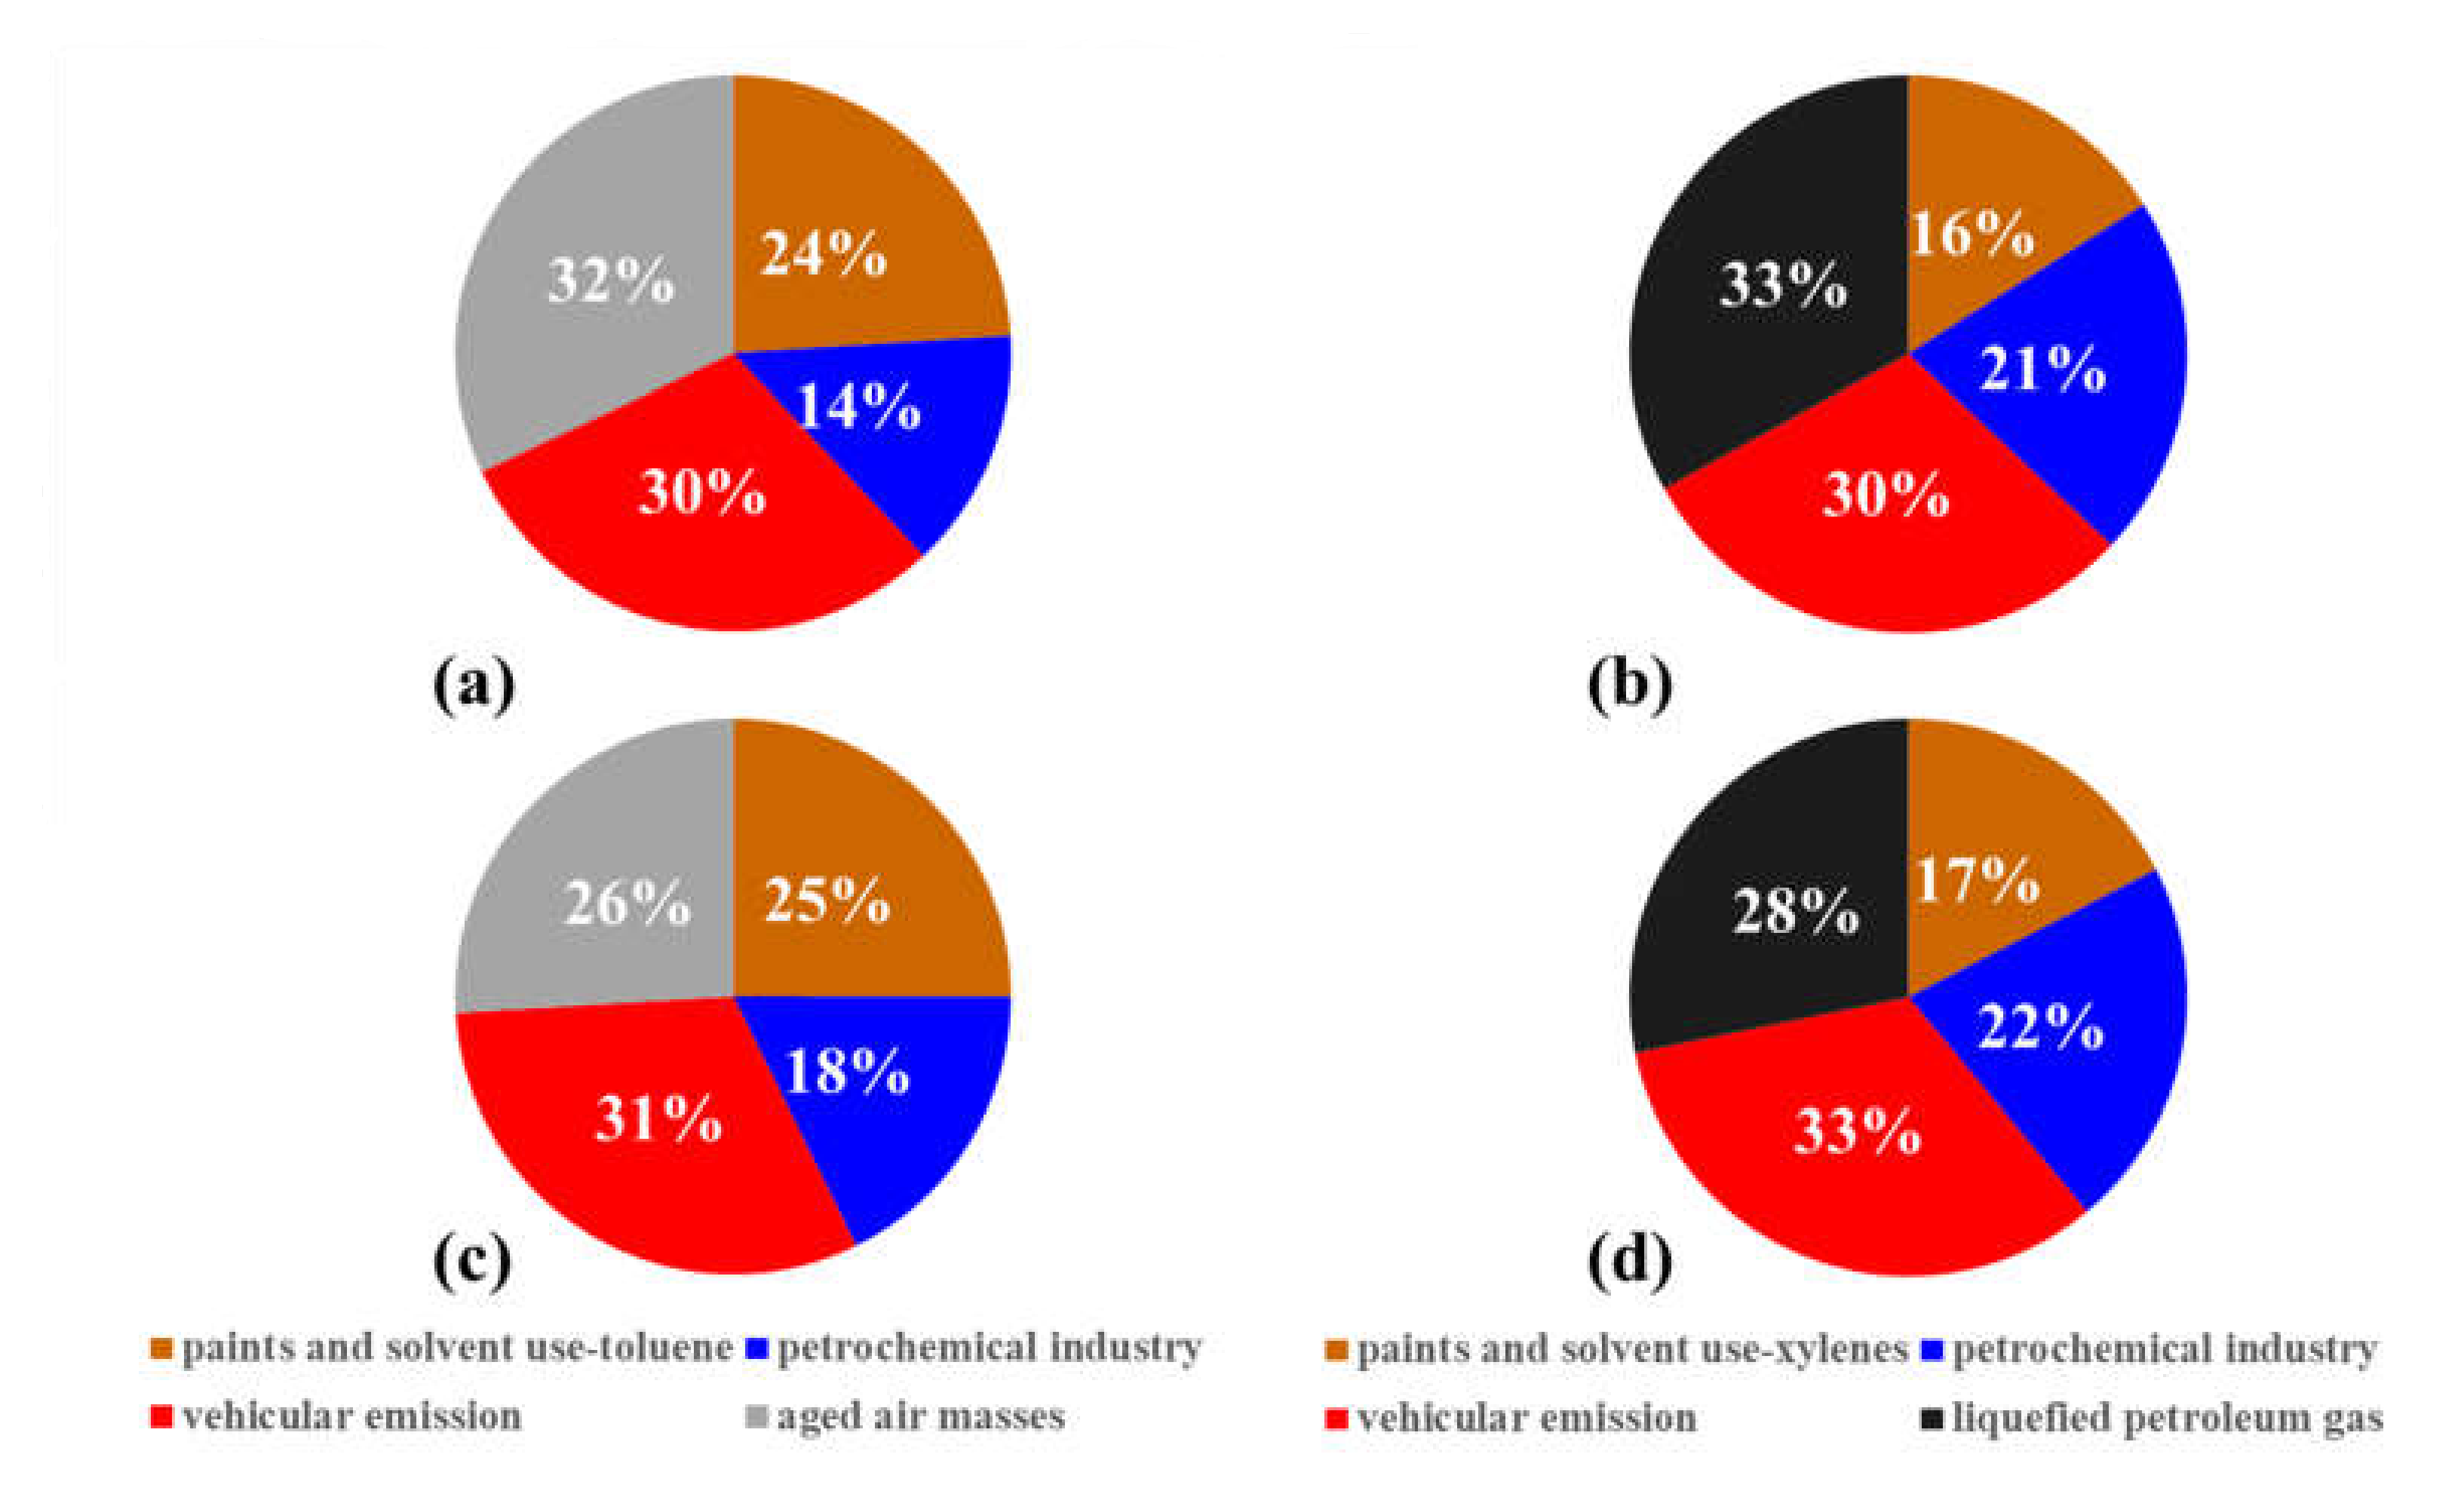
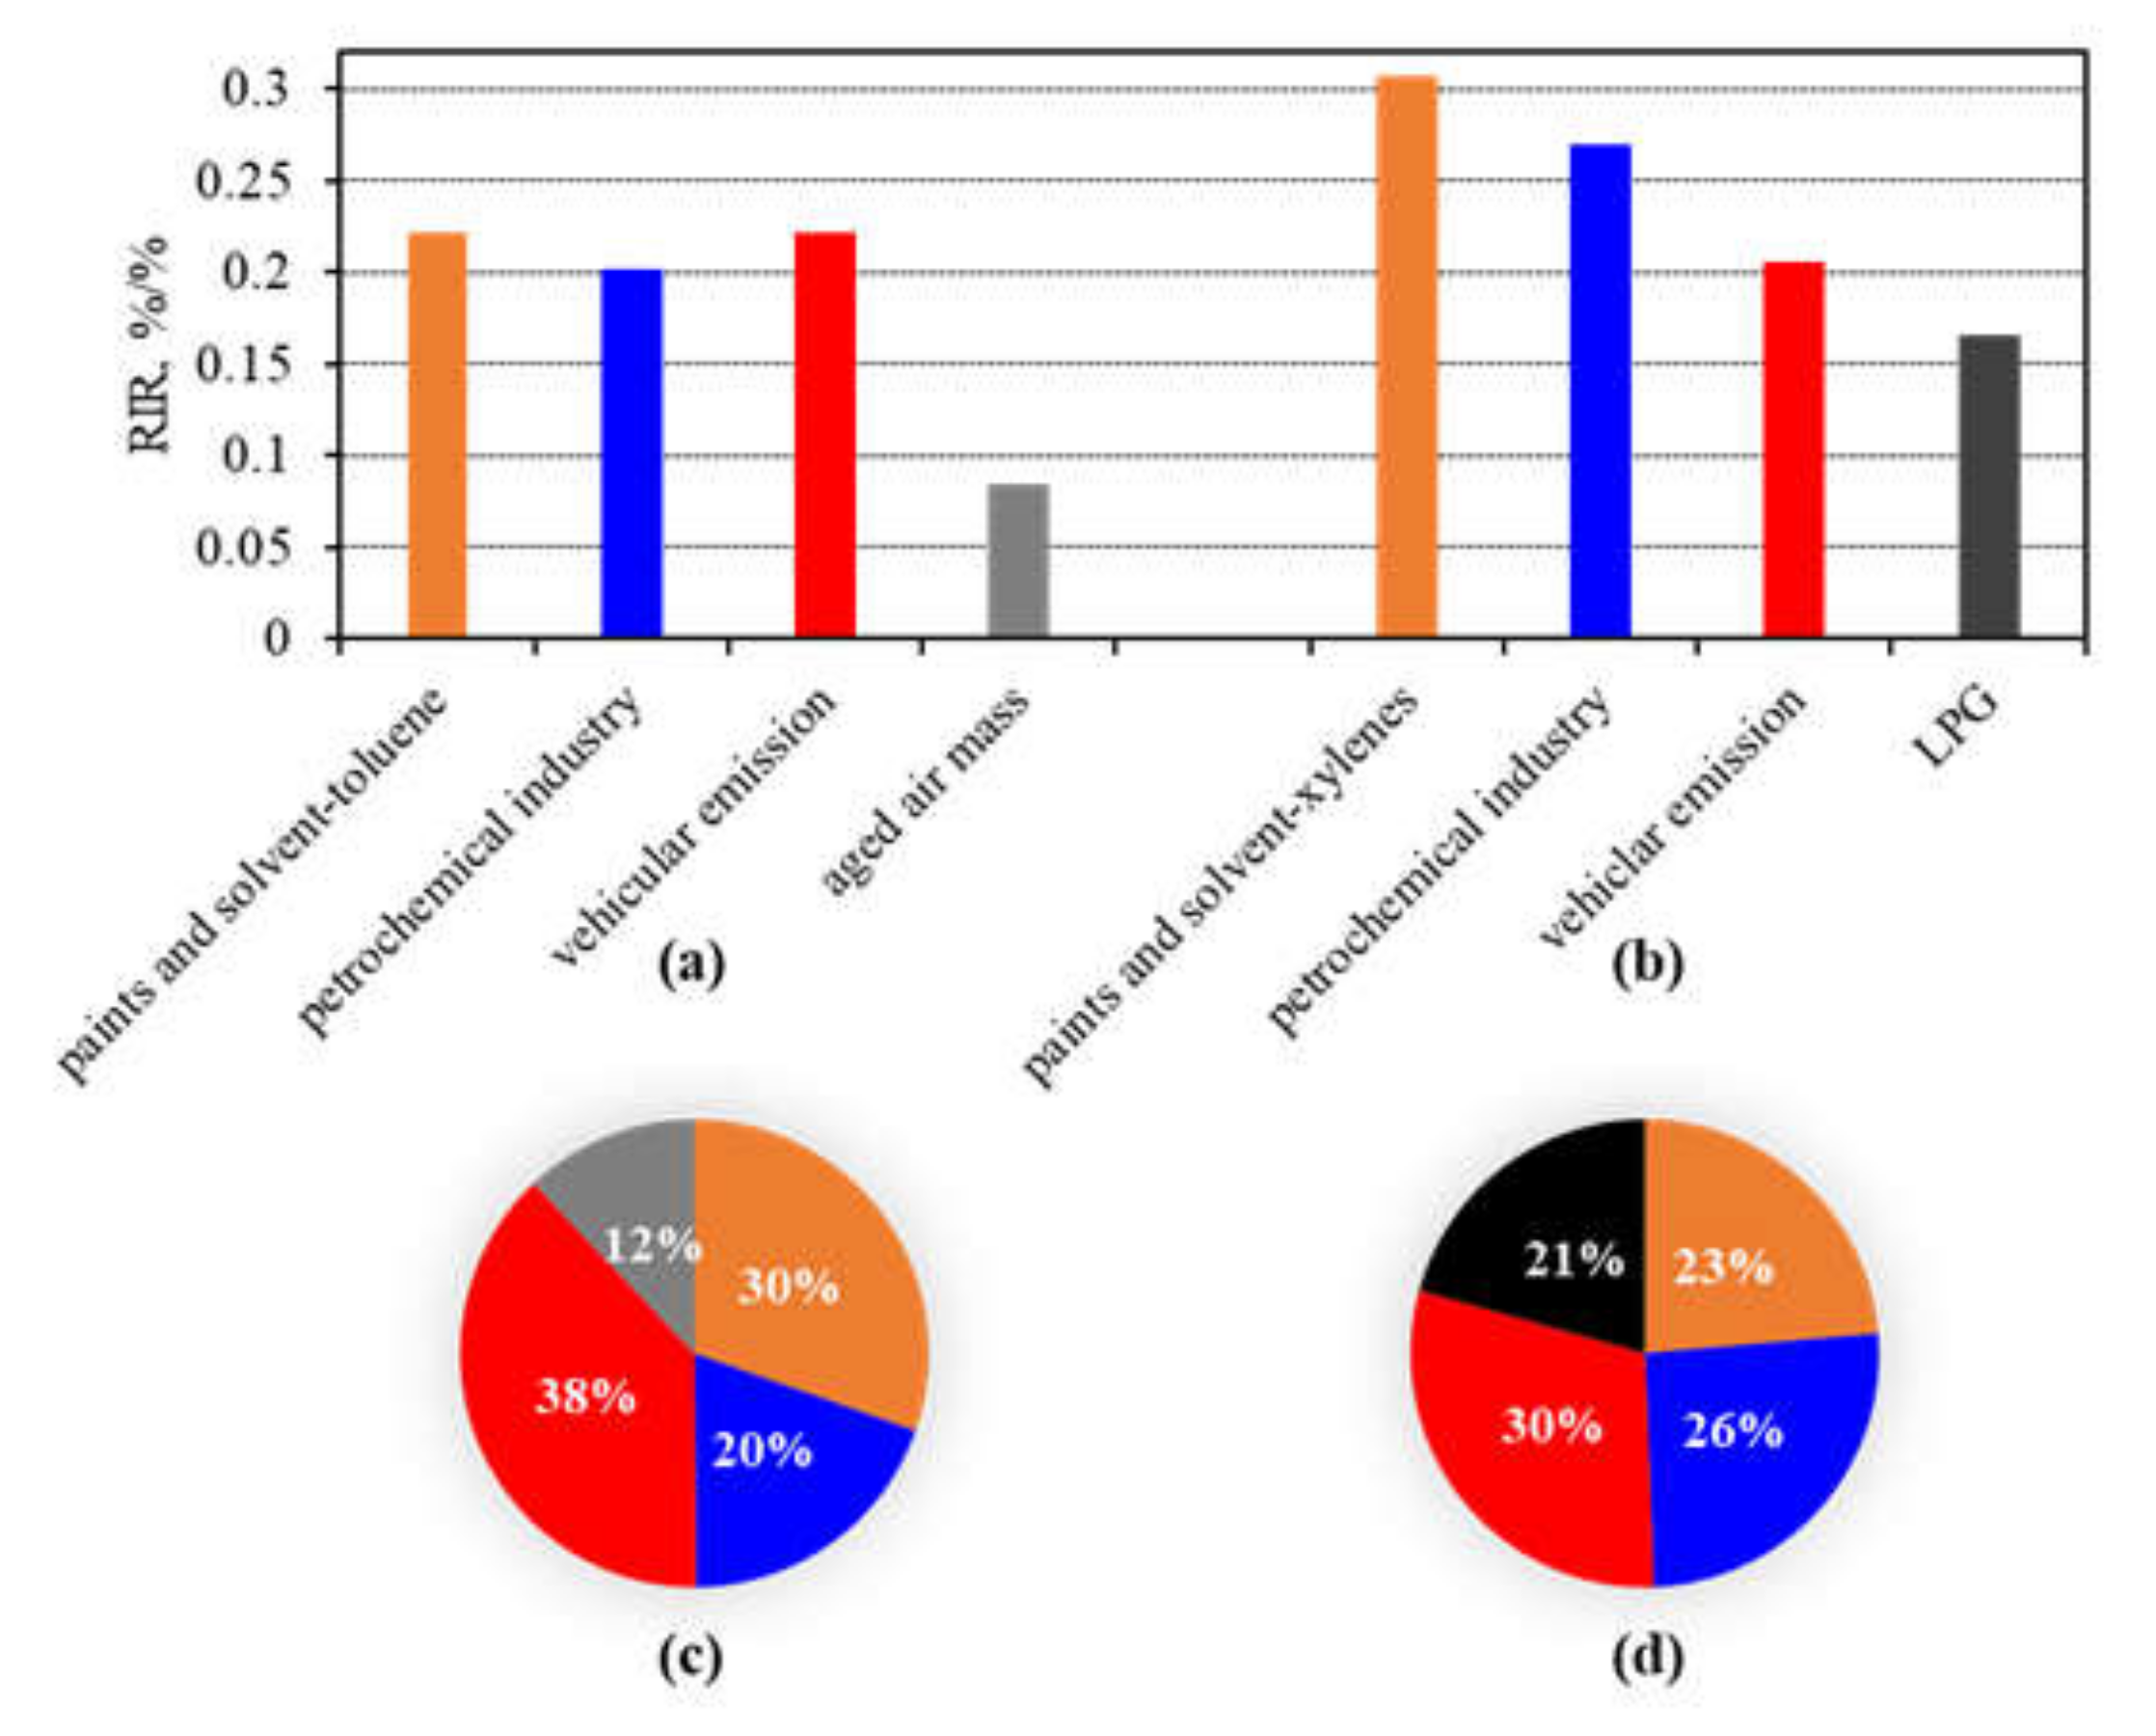
3.3.2. Contributions of Anthropogenic NMHCs Sources in O3 Formation
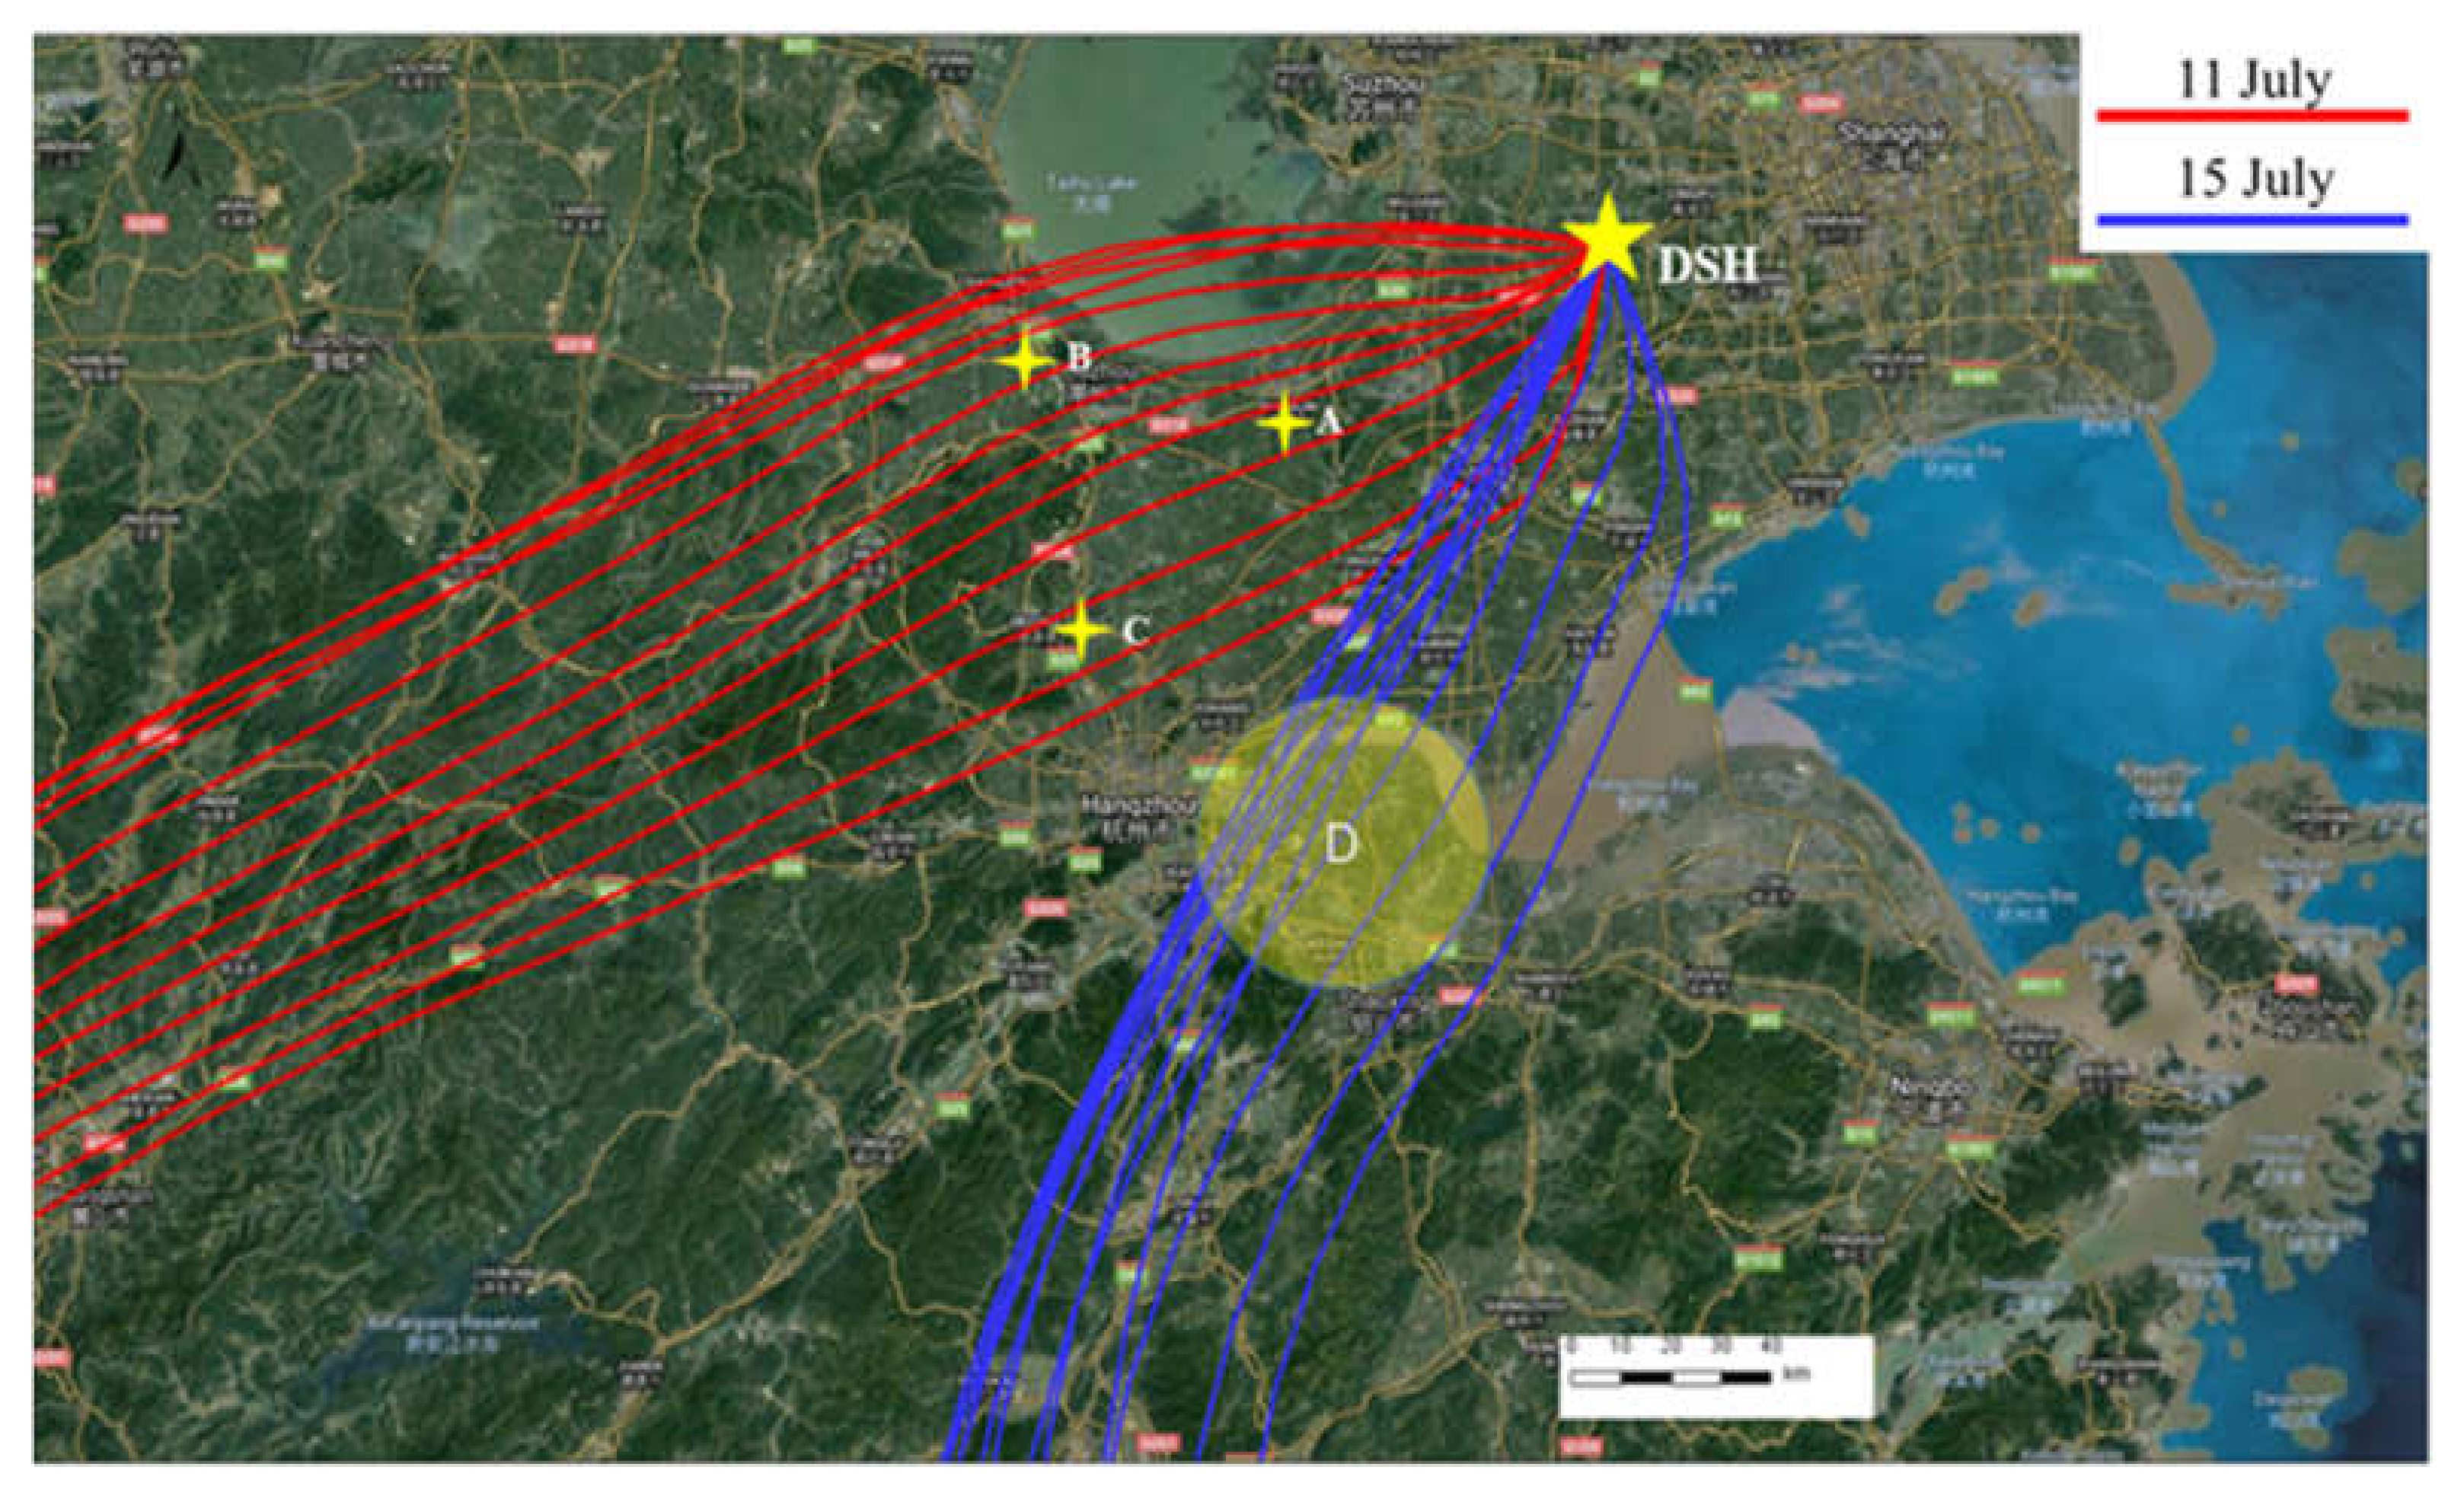
3.4. Case Study: Influence of Transport on O3 Sensitivity
4. Conclusions
Supplementary Materials
Author Contributions
Funding
Acknowledgments
Conflicts of Interest
References
- The China Environment Report 2017. Available online: http://datacenter.mee.gov.cn (accessed on 31 May 2018).
- Li, K.; Jacob, D.J.; Liao, H.; Shen, L.; Zhang, Q.; Bates, K.H. Anthropogenic drivers of 2013-2017 trends in summer surface ozone in China. Proc. Natl. Acad. Sci. USA 2018, 116, 422–427. [Google Scholar] [CrossRef] [PubMed]
- Wang, T.; Xue, L.; Brimblecombe, P.; Lam, Y.F.; Li, L.; Zhang, L. Ozone pollution in China: A review of concentrations, meteorological influences, chemical precursors, and effects. Sci. Total Environ. 2017, 575, 1582–1596. [Google Scholar] [CrossRef] [PubMed]
- Sillman, S. Some theoretical results concerning O3-NOx-VOC chemistry and NOx-VOC indicators. J. Geophys. Res. Atmos. 2002, 107, ACH-26. [Google Scholar] [CrossRef]
- Ibarra-Berastegi, G.; Elías, A.; Agirre, E.; Uria, J. Short-term, real-time forecasting of hourly ozone, NO 2 and NO levels by means of multiple linear regression modelling. Environ. Sci. Pollut. Res. 2001, 8, 250. [Google Scholar] [CrossRef]
- Li, L.; Chen, C.H.; Huang, C.; Huang, H.Y.; Zhang, G.F.; Wang, Y.J.; Wang, H.L.; Lou, S.R.; Qiao, L.P.; Zhou, M.; et al. Process analysis of regional ozone formation over the Yangtze River Delta, China using the Community Multi-scale Air Quality modeling system. Atmos. Chem. Phys. 2012, 12, 10971–10987. [Google Scholar] [CrossRef]
- He, Z.; Wang, X.; Ling, Z.; Zhao, J.; Guo, H.; Shao, M.; Wang, Z. Contributions of different anthropogenic volatile organic compound sources to ozone formation at a receptor site in the Pearl River Delta region and its policy implications. Atmos. Chem. Phys. 2019, 19, 8801–8816. [Google Scholar] [CrossRef]
- Wang, M.; Shao, M.; Chen, W.; Yuan, B.; Lu, S.; Zhang, Q.; Zeng, L.; Wang, Q. A temporally and spatially resolved validation of emission inventories by measurements of ambient volatile organic compounds in Beijing, China. Atmos. Chem. Phys. 2014, 14, 5871–5891. [Google Scholar] [CrossRef]
- Liu, Z.; Wang, Y.; Vrekoussis, M.; Richter, A.; Wittrock, F.; Burrows, J.P.; Shao, M.; Chang, C.C.; Liu, S.C.; Wang, H.L.; et al. Exploring the missing source of glyoxal (CHOCHO) over China. Geophy. Res. Lett. 2012, 39. [Google Scholar] [CrossRef]
- Xu, Z.; Huang, X.; Nie, W.; Chi, X.; Xu, Z.; Zheng, L.; Sun, P.; Ding, A. Influence of synoptic condition and holiday effects on VOCs and ozone production in the Yangtze River Delta region, China. Atmos. Environ. 2017, 168, 112–124. [Google Scholar] [CrossRef]
- Tan, Z.; Lu, K.; Dong, H.; Hu, M.; Li, X.; Liu, Y.; Lu, S.; Shao, M.; Su, R.; Wang, H.; et al. Explicit diagnosis of the local ozone production rate and the ozone-NOx-VOC sensitivities. Sci. Bull. 2018, 63, 1067–1076. [Google Scholar] [CrossRef]
- Liu, Y.; Shao, M.; Fu, L.; Lu, S.; Zeng, L.; Tang, D. Source profiles of volatile organic compounds (VOCs) measured in China: Part I. Atmos. Environ. 2008, 42, 6247–6260. [Google Scholar] [CrossRef]
- Tang, W.; Zhao, C.; Geng, F.; Peng, L.; Zhou, G.; Gao, W.; Xu, J.; Tie, X. Study of ozone “weekend effect” in Shanghai. Sci. China Ser. D Earth Sci. 2008, 51, 1354–1360. [Google Scholar] [CrossRef]
- Ran, L.; Zhao, C.; Geng, F.; Tie, X.; Tang, X.; Peng, L.; Zhou, G.; Yu, Q.; Xu, J.; Guenther, A. Ozone photochemical production in urban Shanghai, China: Analysis based on ground level observations. J. Geophys. Res. Atmos. 2009, 114. [Google Scholar] [CrossRef]
- Tan, Z.; Lu, K.; Jiang, M.; Su, R.; Wang, H.; Lou, S.; Fu, Q.; Zhai, C.; Tan, Q.; Yue, D.; et al. Daytime atmospheric oxidation capacity in four Chinese megacities during the photochemically polluted season: A case study based on box model simulation. Atmos. Chem. Phys. 2019, 19, 3493–3513. [Google Scholar] [CrossRef]
- Wang, H.L.; Chen, C.H.; Wang, Q.; Huang, C.; Su, L.Y.; Huang, H.Y.; Lou, S.R.; Zhou, M.; Li, L.; Qiao, L.P.; et al. Chemical loss of volatile organic compounds and its impact on the source analysis through a two-year continuous measurement. Atmos. Environ. 2013, 80, 488–498. [Google Scholar] [CrossRef]
- Cai, C.J.; Geng, F.H.; Tie, X.X.; Yu, Q.O.; An, J.L. Characteristics and source apportionment of VOCs measured in Shanghai, China. Atmos. Environ. 2010, 44, 5005–5014. [Google Scholar] [CrossRef]
- Song, M.; Liu, X.; Tan, Q.; Feng, M.; Qu, Y.; An, J.; Zhang, Y.J.E.P. Characteristics and formation mechanism of persistent extreme haze pollution events in Chengdu, southwestern China. Environ. Pollut. 2019, 251, 1–12. [Google Scholar] [CrossRef] [PubMed]
- Paatero, P.; Tapper, U. Positive matrix factorization: A non-negative factor model with optimal utilization of error estimates of data values. Environmetrics 1994, 5, 111–126. [Google Scholar] [CrossRef]
- Paatero, P. Least Squares Formulation of Robust Non-Negative Factor Analysis. Chemom. Intell. Lab. Syst. Chemom. Intell. Lab. Syst. 1997, 37, 23–35. [Google Scholar] [CrossRef]
- Cardelino, C.A.; Chameides, W.L. An Observation-Based Model for Analyzing Ozone Precursor Relationships in the Urban Atmosphere. J. Air Waste Manag. Assoc. 1995, 45, 161–180. [Google Scholar] [CrossRef]
- Chan, C.Y.; Chan, L.Y. Effect of meteorology and air pollutant transport on ozone episodes at a subtropical coastal Asian city, Hong Kong. J. Geophys. Res. Atmos. 2000, 105, 20707–20724. [Google Scholar] [CrossRef]
- Nair, P.R.; Chand, D.; Lal, S. Temporal variations in surface ozone at Thumba (8.6 N, 77 E)-a tropical coastal site in India. Atmos. Environ. 2002, 36, 603–610. [Google Scholar] [CrossRef]
- Lu, K.D.; Rohrer, F.; Holland, F.; Fuchs, H.; Bohn, B.; Brauers, T.; Chang, C.C.; Häseler, R.; Hu, M.; Kita, K.; et al. Observation and modelling of OH and HO2 concentrations in the Pearl River Delta 2006: A missing OH source in a VOC rich atmosphere. Atmos. Chem. Phys. 2012, 12, 1541–1569. [Google Scholar] [CrossRef]
- Lu, K.D.; Hofzumahaus, A.; Holland, F.; Bohn, B.; Brauers, T.; Fuchs, H.; Hu, M.; Häseler, R.; Kita, K.; Kondo, Y. Missing OH source in a suburban environment near Beijing: Observed and modelled OH and HO2 concentrations in summer 2006. Atmos. Chem. Phys. 2013, 13, 1057–1080. [Google Scholar] [CrossRef]
- Wang, Y.; Guo, H.; Zou, S.; Lyu, X.; Ling, Z.; Cheng, H.; Zeren, Y. Surface O3 photochemistry over the South China Sea: Application of a near-explicit chemical mechanism box model. Environ. Pollut. 2018, 234, 155–166. [Google Scholar] [CrossRef] [PubMed]
- Tan, Z.; Fuchs, H.; Lu, K.; Hofzumahaus, A.; Bohn, B.; Broch, S.; Dong, H.; Gomm, S.; Häseler, R.; He, L.; et al. Radical chemistry at a rural site (Wangdu) in the North China Plain: Observation and model calculations of OH, HO2 and RO2 radicals. Atmos. Chem. Phys. 2017, 17, 663–690. [Google Scholar] [CrossRef]
- Nan, J.; Wang, S.; Guo, Y.; Xiang, Y.; Zhou, B. Study on the daytime OH radical and implication for its relationship with fine particles over megacity of Shanghai, China. Atmos. Environ. 2017, 154, 167–178. [Google Scholar] [CrossRef]
- Atkinson, R.; Baulch, D.L.; Cox, R.A.; Crowley, J.N.; Hampson, R.F.; Hynes, R.G.; Jenkin, M.E.; Rossi, M.J.; Troe, J.; Wallington, T.J. Evaluated kinetic and photochemical data for atmospheric chemistry: Volume IV-gas phase reactions of organic halogen species. Atmos. Chem. Phys. 2008, 8, 4141–4496. [Google Scholar] [CrossRef]
- Parrish, D.D.; Stohl, A.; Forster, C.; Atlas, E.L.; Blake, D.R.; Goldan, P.D.; Kuster, W.C.; de Gouw, J.A. Effects of mixing on evolution of hydrocarbon ratios in the troposphere. J. Geophys. Res. Atmos. 2007, 112. [Google Scholar] [CrossRef]
- Tie, X.; Geng, F.; Guenther, A.; Cao, J.; Greenberg, J.; Zhang, R.; Apel, E.; Li, G.; Weinheimer, A.; Chen, J.; et al. Megacity impacts on regional ozone formation: Observations and WRF-Chem modeling for the MIRAGE-Shanghai field campaign. Atmos. Chem. Phys. 2013, 13, 5655–5669. [Google Scholar] [CrossRef]
- Geng, F.; Tie, X.; Xu, J.; Zhou, G.; Peng, L.; Gao, W.; Tang, X.; Zhao, C. Characterizations of ozone, NOx, and VOCs measured in Shanghai, China. Atmos. Environ. 2008, 42, 6873–6883. [Google Scholar] [CrossRef]
- Ran, L.; Zhao, C.S.; Xu, W.Y.; Han, M.; Lu, X.Q.; Han, S.Q.; Lin, W.L.; Xu, X.B.; Gao, W.; Yu, Q. Ozone production in summer in the megacities of Tianjin and Shanghai, China: A comparative study. Atmos. Chem. Phys. 2012, 12, 7531–7542. [Google Scholar] [CrossRef]
- Li, L.; Chen, C.; Huang, C.; Huang, H.; Zhang, G.; Wang, Y.; Chen, M.; Wang, H.; Chen, Y.; Streets, D.G.; et al. Ozone sensitivity analysis with the MM5-CMAQ modeling system for Shanghai. J. Environ. Sci. 2011, 23, 1150–1157. [Google Scholar] [CrossRef]
- Tie, X.; Geng, F.; Peng, L.; Gao, W.; Zhao, C. Measurement and modeling of O3 variability in Shanghai, China: Application of the WRF-Chem model. Atmos. Environ. 2009, 43, 4289–4302. [Google Scholar] [CrossRef]
- Xue, L.; Wang, T.; Gao, J.; Ding, A.; Zhou, X.; Blake, D.; Wang, X.; Saunders, S.; Fan, S.; Zuo, H.; et al. Ground-level ozone in four Chinese cities: Precursors, regional transport and heterogeneous processes. Atmos. Chem. Phys. 2014, 14, 13175–13188. [Google Scholar] [CrossRef]
- Zheng, C.; Shen, J.; Zhang, Y.; Huang, W.; Zhu, X.; Wu, X.; Chen, L.; Xiang, G.; Cen, K. Quantitative assessment of industrial VOC emissions in China: Historical trend, spatial distribution, uncertainties, and projection. Atmos. Environ. 2017, 150, 116–125. [Google Scholar] [CrossRef]
- Gao, W.; Tie, X.; Xu, J.; Huang, R.; Mao, X.; Zhou, G.; Chang, L. Long-term trend of O3 in a mega City (Shanghai), China: Characteristics, causes, and interactions with precursors. Sci. Total Environ. 2017, 603, 425–433. [Google Scholar] [CrossRef]
- Bernard, A.; Frédéric, C.; Sophie, L. Contribution of HONO sources to the NOx/HOx/O3 chemistry in the polluted boundary layer. Atmos. Environ. 2003, 37, 487–498. [Google Scholar]
- Elshorbany, Y.F.; Steil, B.; Brühl, C.; Lelieveld, J. Impact of HONO on global atmospheric chemistry calculated with an empirical parameterization in the EMAC model. Atmos. Chem. Phys. 2012, 12, 9977–10000. [Google Scholar] [CrossRef]
- Yuan, B.; Shao, M.; Lu, S.H.; Wang, B. Source profiles of volatile organic compounds associated with solvent use in Beijing, China. Atmos. Environ. 2010, 44, 1919–1926. [Google Scholar] [CrossRef]
- Zheng, J.; Yu, Y.; Mo, Z.; Zhang, Z.; Wang, X.; Yin, S.; Peng, K.; Yang, Y.; Feng, X.; Cai, H. Industrial sector-based volatile organic compound (VOC) source profiles measured in manufacturing facilities in the Pearl River Delta, China. Sci. Total Environ. 2013, 456, 127–136. [Google Scholar] [CrossRef] [PubMed]
- Mo, Z.; Shao, M.; Lu, S.; Qu, H.; Zhou, M.; Sun, J.; Gou, B. Process-specific emission characteristics of volatile organic compounds (VOCs) from petrochemical facilities in the Yangtze River Delta, China. Sci. Total Environ. 2015, 533, 422–431. [Google Scholar] [CrossRef] [PubMed]
- Mo, Z.W.; Shao, M.; Lu, S.H. Compilation of a source profile database for hydrocarbon and OVOC emissions in China. Atmos. Environ. 2016, 143, 209–217. [Google Scholar] [CrossRef]
- Hao, H.; Liu, Z.; Zhao, F.; Li, W. Natural gas as vehicle fuel in China: A review. Renew. Sustain. Energy Rev. 2016, 62, 521–533. [Google Scholar] [CrossRef]
- Katzenstein, A.S.; Doezema, L.A.; Simpson, I.J.; Blake, D.R.; Rowland, F.S. Extensive regional atmospheric hydrocarbon pollution in the southwestern United States. Proc. Natl. Acad. Sci. USA 2003, 100, 11975–11979. [Google Scholar] [CrossRef] [PubMed]
- Blake, D.R.; Rowland, F.S. Urban leakage of liquefied petroleum gas and its impact on Mexico City air quality. Science 1995, 269, 953–956. [Google Scholar] [CrossRef]
- Praplan, A.P.; Pfannerstill, E.Y.; Williams, J.; Hellén, H. OH reactivity of the urban air in Helsinki, Finland, during winter. Atmos. Environ. 2017, 169, 150–161. [Google Scholar] [CrossRef]
- Wang, Y.Q. An Open Source Software Suite for Multi-Dimensional Meteorological Data Computation and Visualisation. J. Open Res. Softw. 2019, 7, 21. [Google Scholar] [CrossRef]
- Huang, C.; Chen, C.H.; Li, L.; Cheng, Z.; Wang, H.L.; Huang, H.Y.; Chen, Y.R. Emission inventory of anthropogenic air pollutants and VOC species in the Yangtze River Delta region, China. Atmos. Chem. Phys. 2011, 11, 4105–4120. [Google Scholar] [CrossRef]
- Fu, X.; Wang, S.; Zhao, B.; Xing, J.; Cheng, Z.; Liu, H.; Hao, J. Emission inventory of primary pollutants and chemical speciation in 2010 for the Yangtze River Delta region, China. Atmos. Environ. 2013, 70, 39–50. [Google Scholar] [CrossRef]


| Land-Use Function | Time | Method | O3 Formation Regime | Reference |
|---|---|---|---|---|
| Urban | January 2006–May 2007 | OBM | VOC-limited | Geng et al., 2008 [32] |
| 15 June 2006–14 June 2007 | VOC/NOx ratio | VOC-limited | Ran et al., 2009 [14] | |
| 20 July–30 July 2007 | EBM | VOC-limited | Li et al., 2011 [34] | |
| 2 August–11 August 2007 | EBM | VOC-limited | Tie et al., 2009 [35] | |
| July–August 2009 | OBM | VOC-limited | Ran et al., 2012 [33] | |
| November–December 2009 | VOC/NOx ratio | VOC-limited | Tang et al., 2008 [13] | |
| 5 August–31 August 2010 | EBM | VOC-limited | Li et al., 2012 [6] | |
| 21 August–02 Sep 2016 | OBM | VOC-limited | Tan et al., 2019 [15] | |
| 11 July–26 July 2017 | OBM | VOC-limited | This study | |
| Suburban | 4 May–01 June 2005 | OBM | VOC-limited | Xue et al., 2014 [36] |
| 20 July–30 July 2007 | EBM | NOx-limited | Li et al., 2011 [34] | |
| 5 August–31 August 2010 | EBM | NOx-limited | Li et al., 2012 [6] | |
| 11 July–26 July 2017 | OBM | Transition regime | This study |
© 2020 by the authors. Licensee MDPI, Basel, Switzerland. This article is an open access article distributed under the terms and conditions of the Creative Commons Attribution (CC BY) license (http://creativecommons.org/licenses/by/4.0/).
Share and Cite
Lin, H.; Wang, M.; Duan, Y.; Fu, Q.; Ji, W.; Cui, H.; Jin, D.; Lin, Y.; Hu, K. O3 Sensitivity and Contributions of Different NMHC Sources in O3 Formation at Urban and Suburban Sites in Shanghai. Atmosphere 2020, 11, 295. https://doi.org/10.3390/atmos11030295
Lin H, Wang M, Duan Y, Fu Q, Ji W, Cui H, Jin D, Lin Y, Hu K. O3 Sensitivity and Contributions of Different NMHC Sources in O3 Formation at Urban and Suburban Sites in Shanghai. Atmosphere. 2020; 11(3):295. https://doi.org/10.3390/atmos11030295
Chicago/Turabian StyleLin, Haotian, Ming Wang, Yusen Duan, Qingyan Fu, Wenhao Ji, Huxiong Cui, Dan Jin, Yanfen Lin, and Kun Hu. 2020. "O3 Sensitivity and Contributions of Different NMHC Sources in O3 Formation at Urban and Suburban Sites in Shanghai" Atmosphere 11, no. 3: 295. https://doi.org/10.3390/atmos11030295
APA StyleLin, H., Wang, M., Duan, Y., Fu, Q., Ji, W., Cui, H., Jin, D., Lin, Y., & Hu, K. (2020). O3 Sensitivity and Contributions of Different NMHC Sources in O3 Formation at Urban and Suburban Sites in Shanghai. Atmosphere, 11(3), 295. https://doi.org/10.3390/atmos11030295