Characteristics of Air Pollution and Their Relationship with Meteorological Parameters: Northern Versus Southern Cities of China

 ,
,  ,
, 
Abstract
1. Introduction
2. Methods
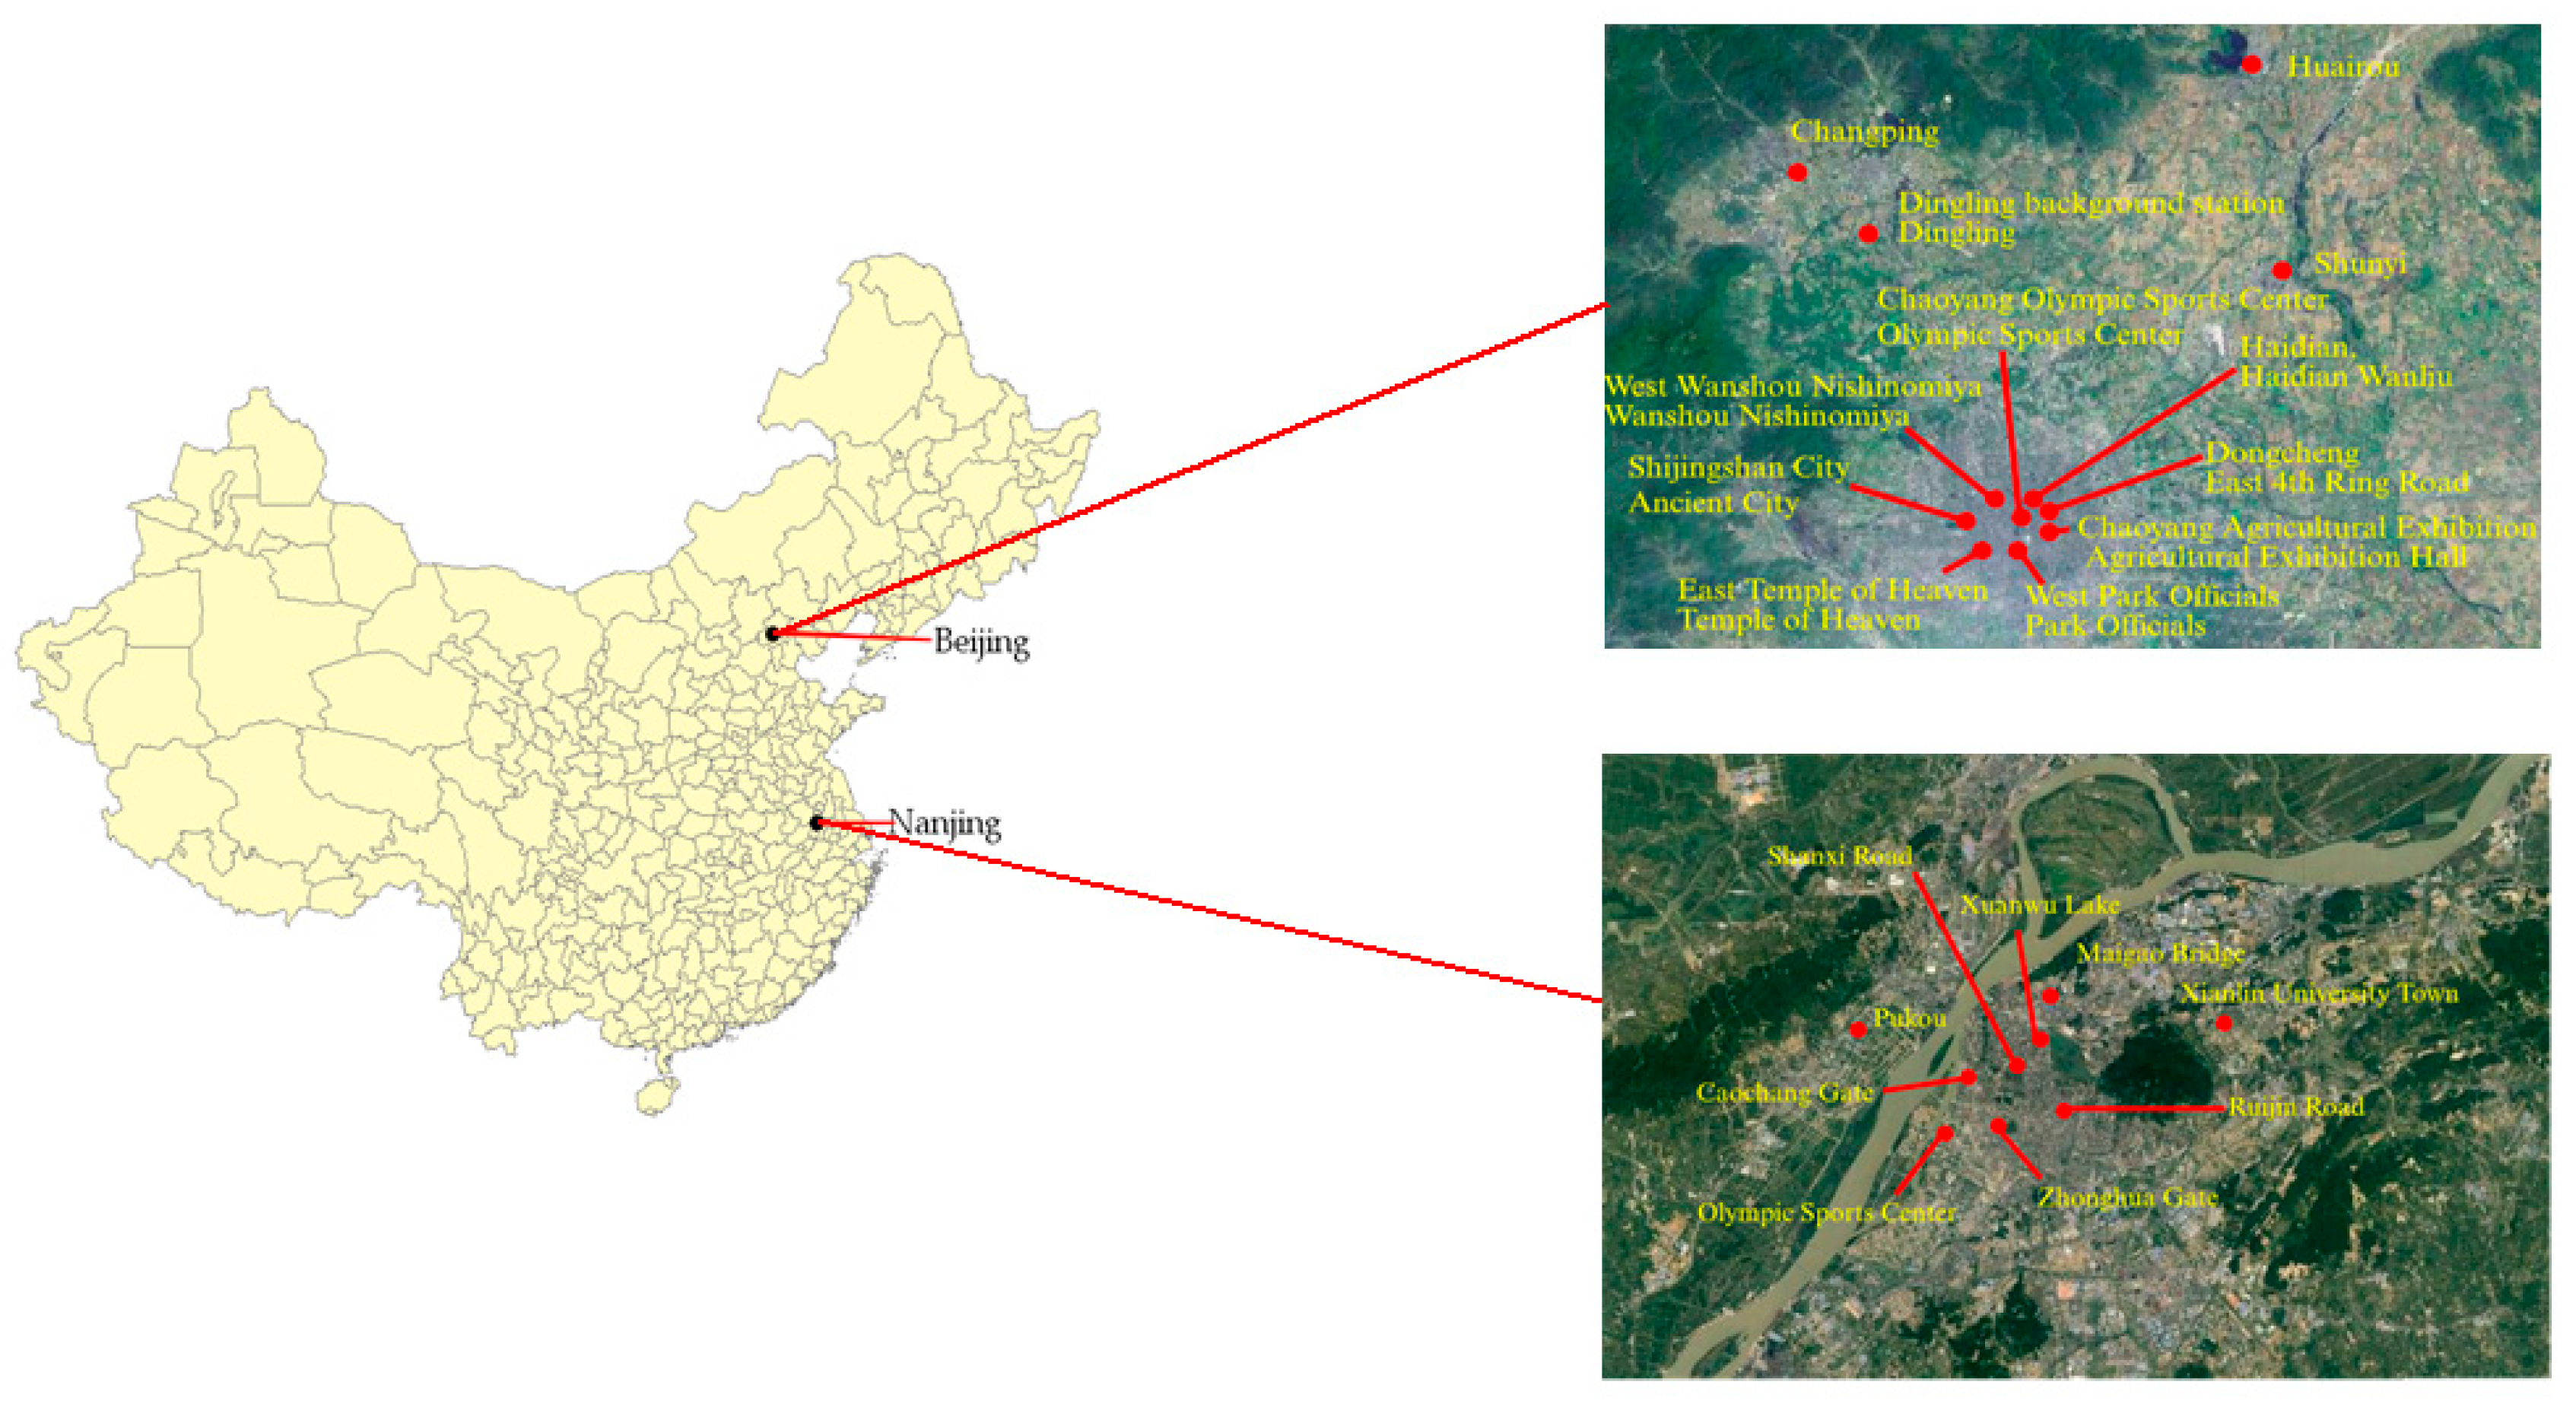
2.1. Study Cities
2.2. Data
3. Results and Discussion
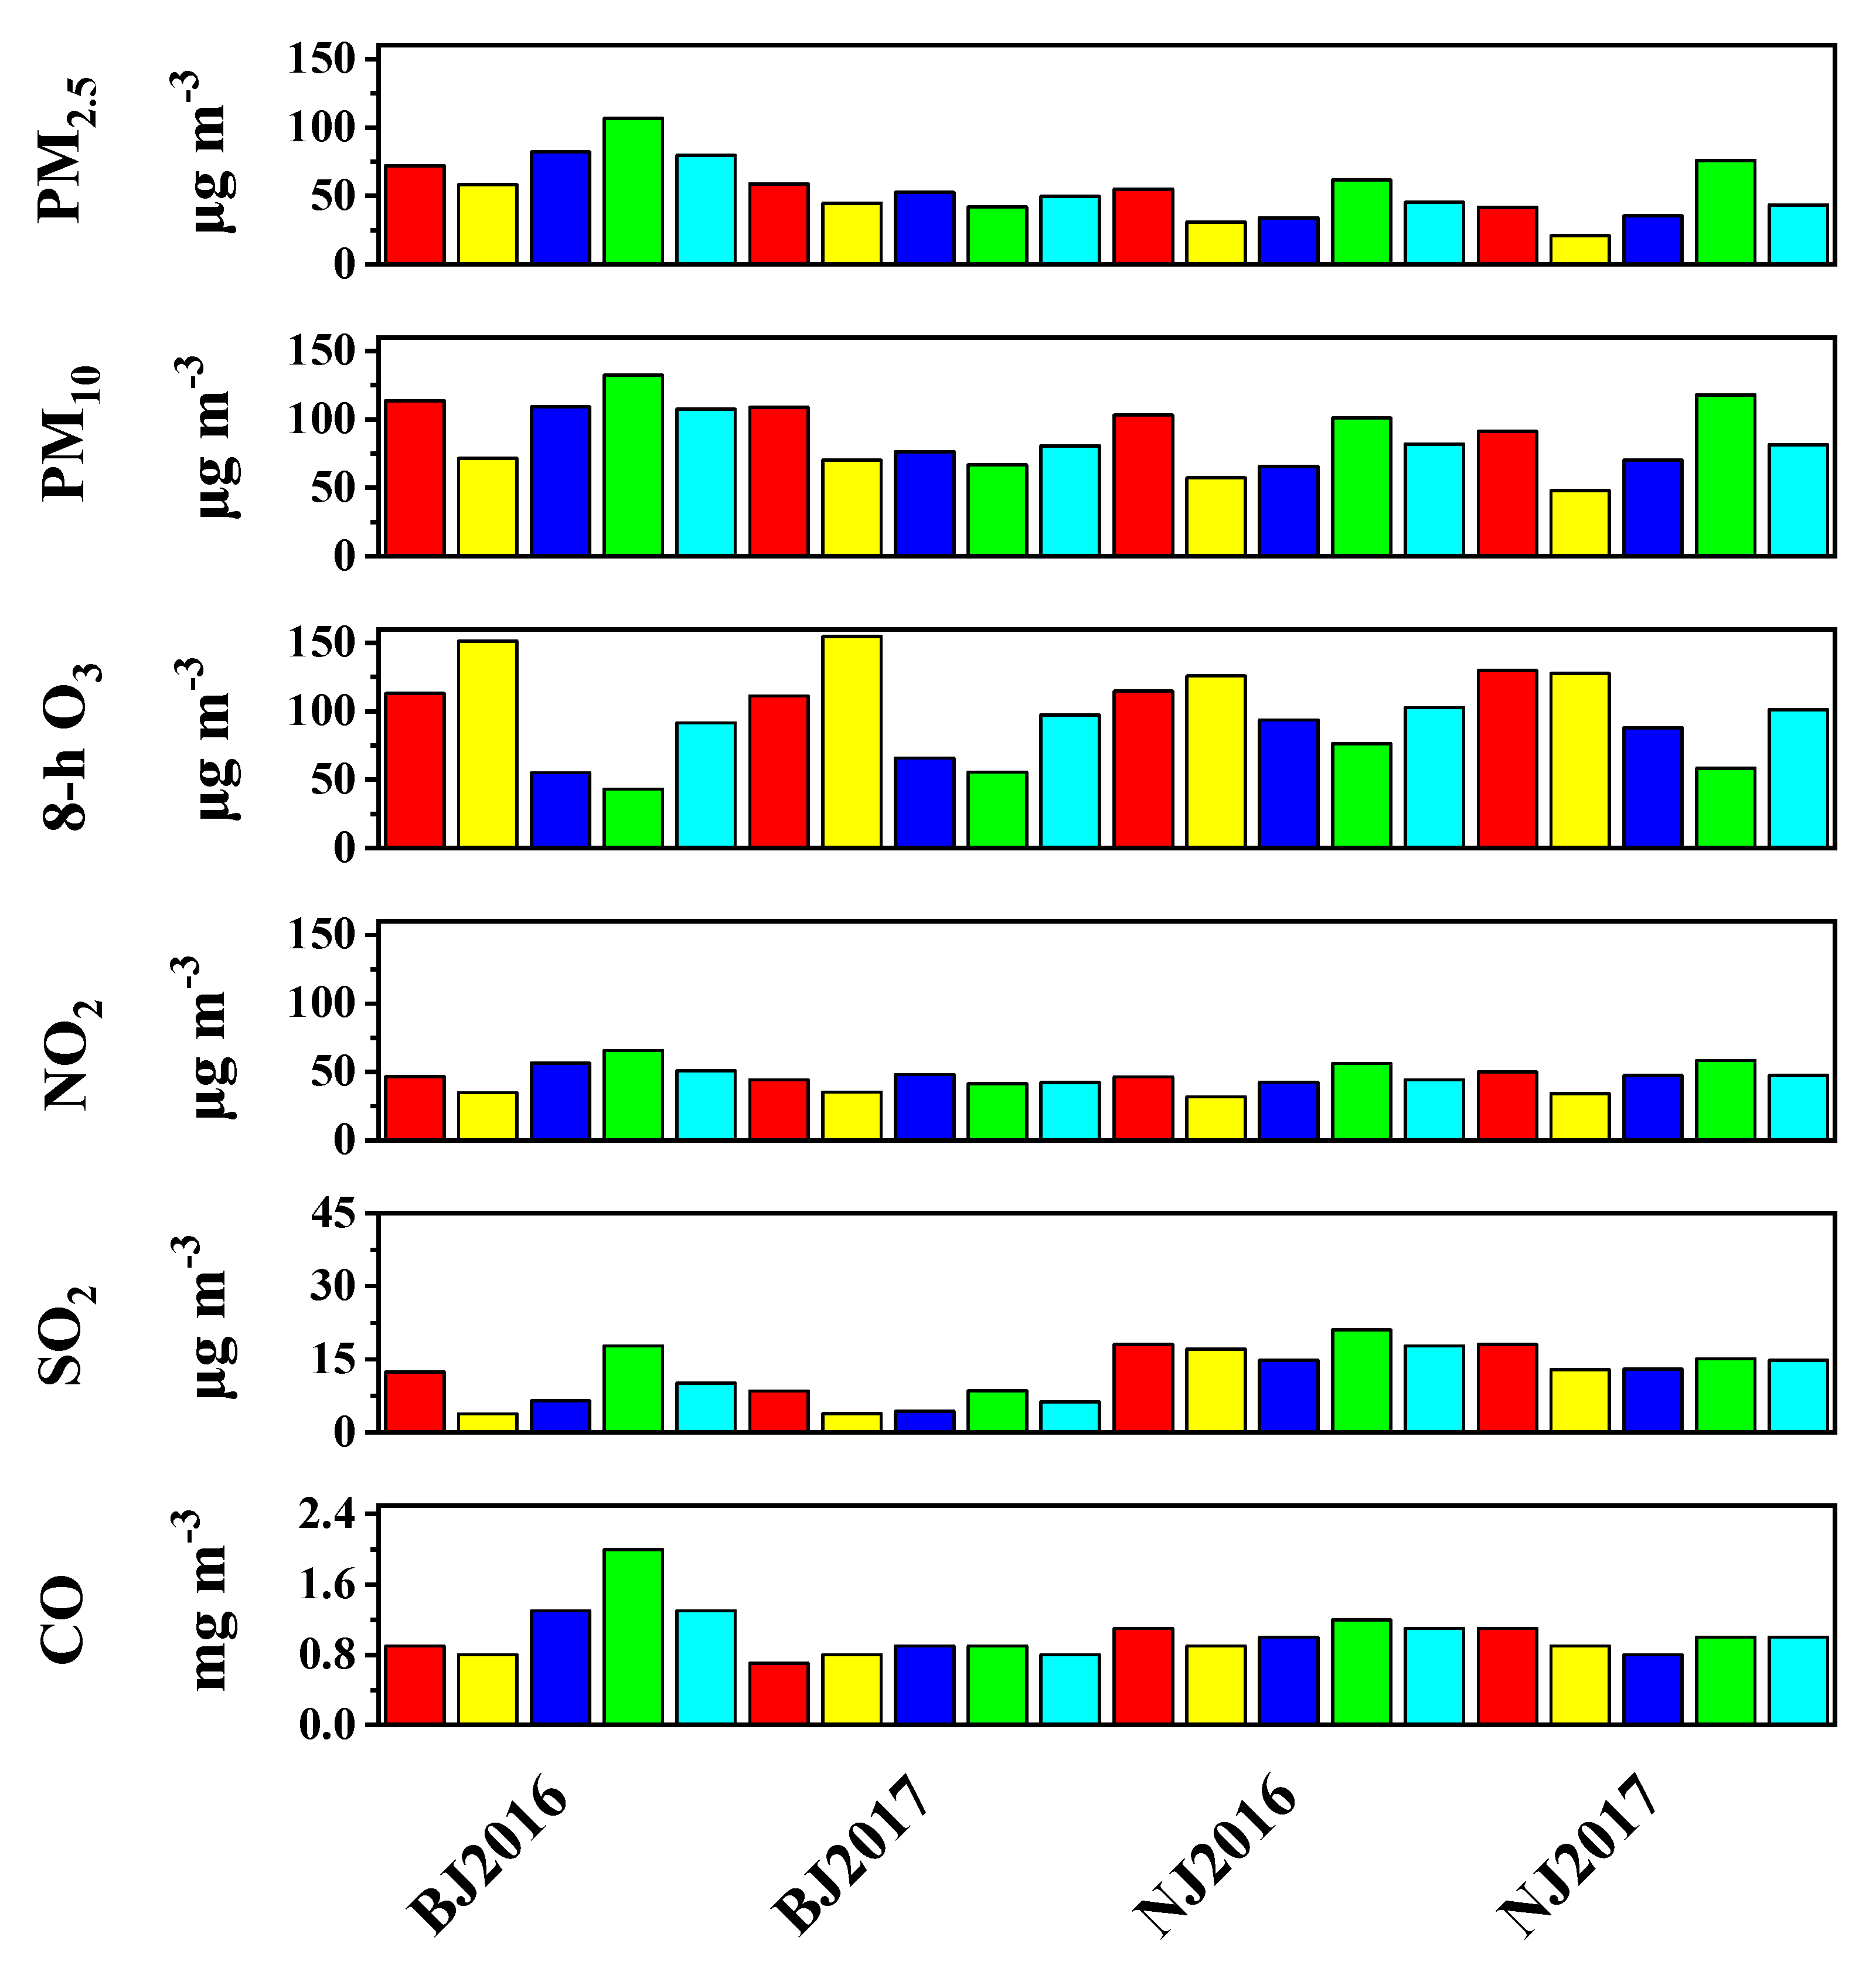
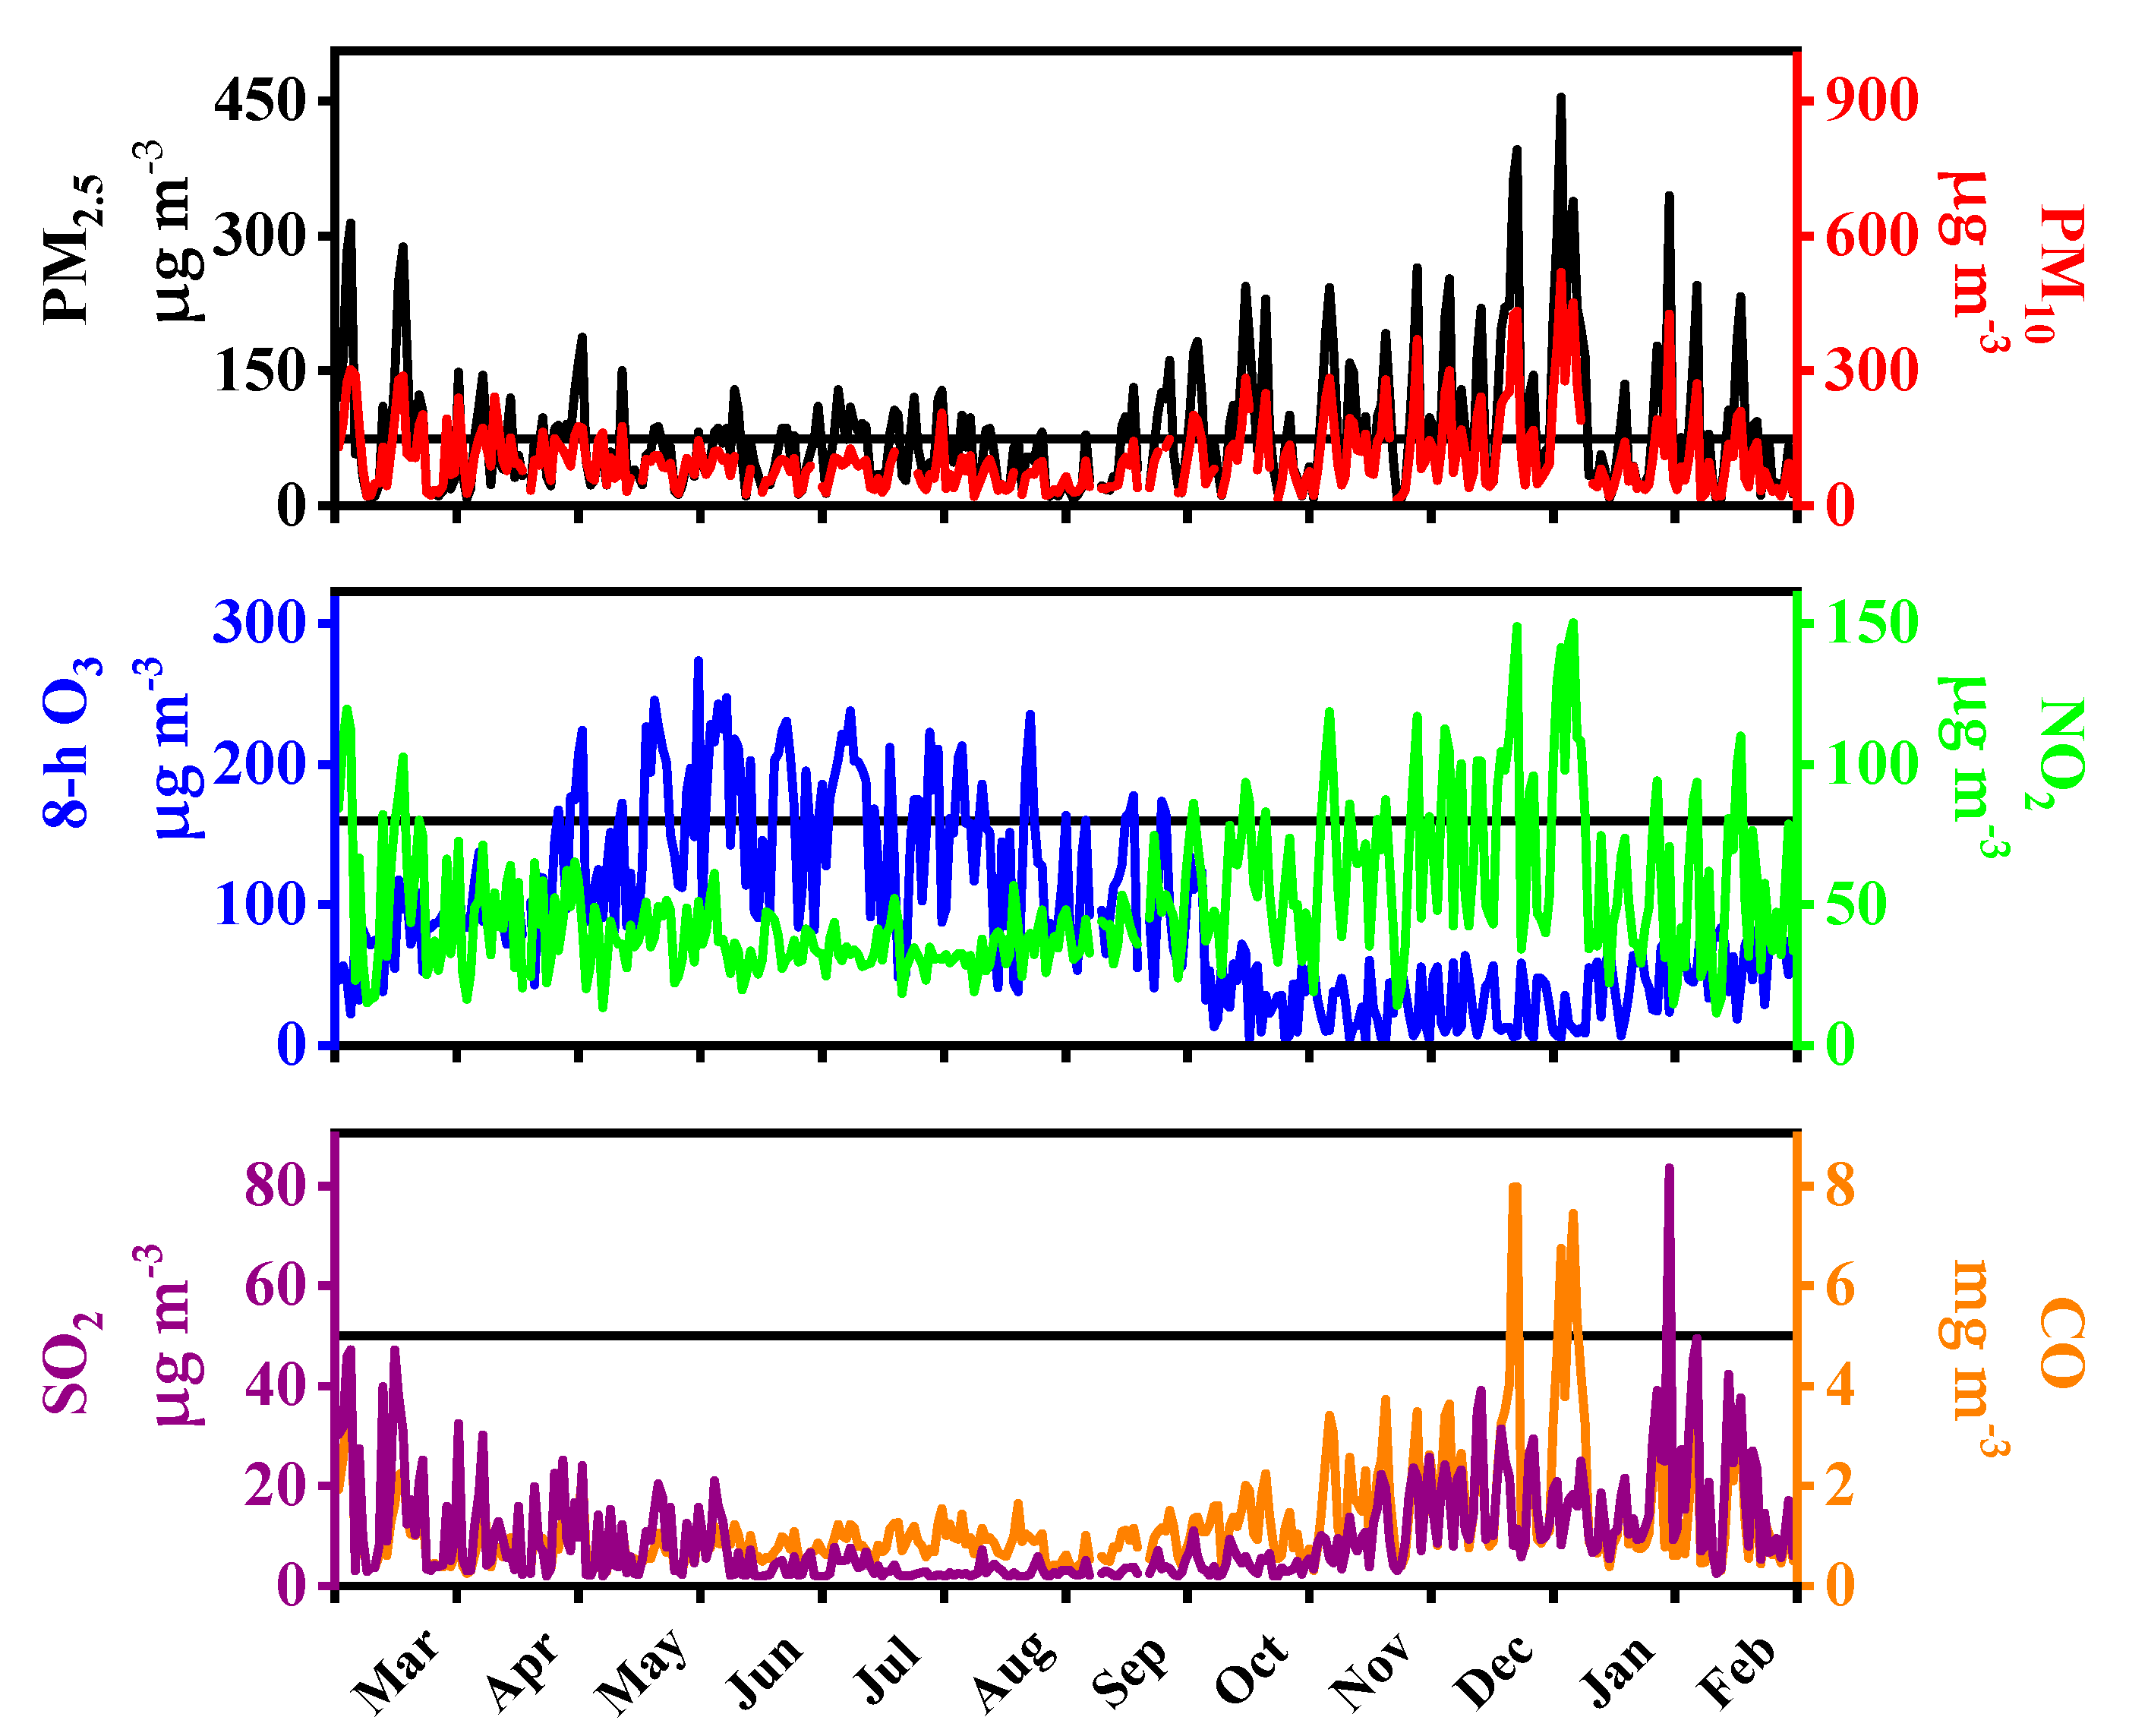
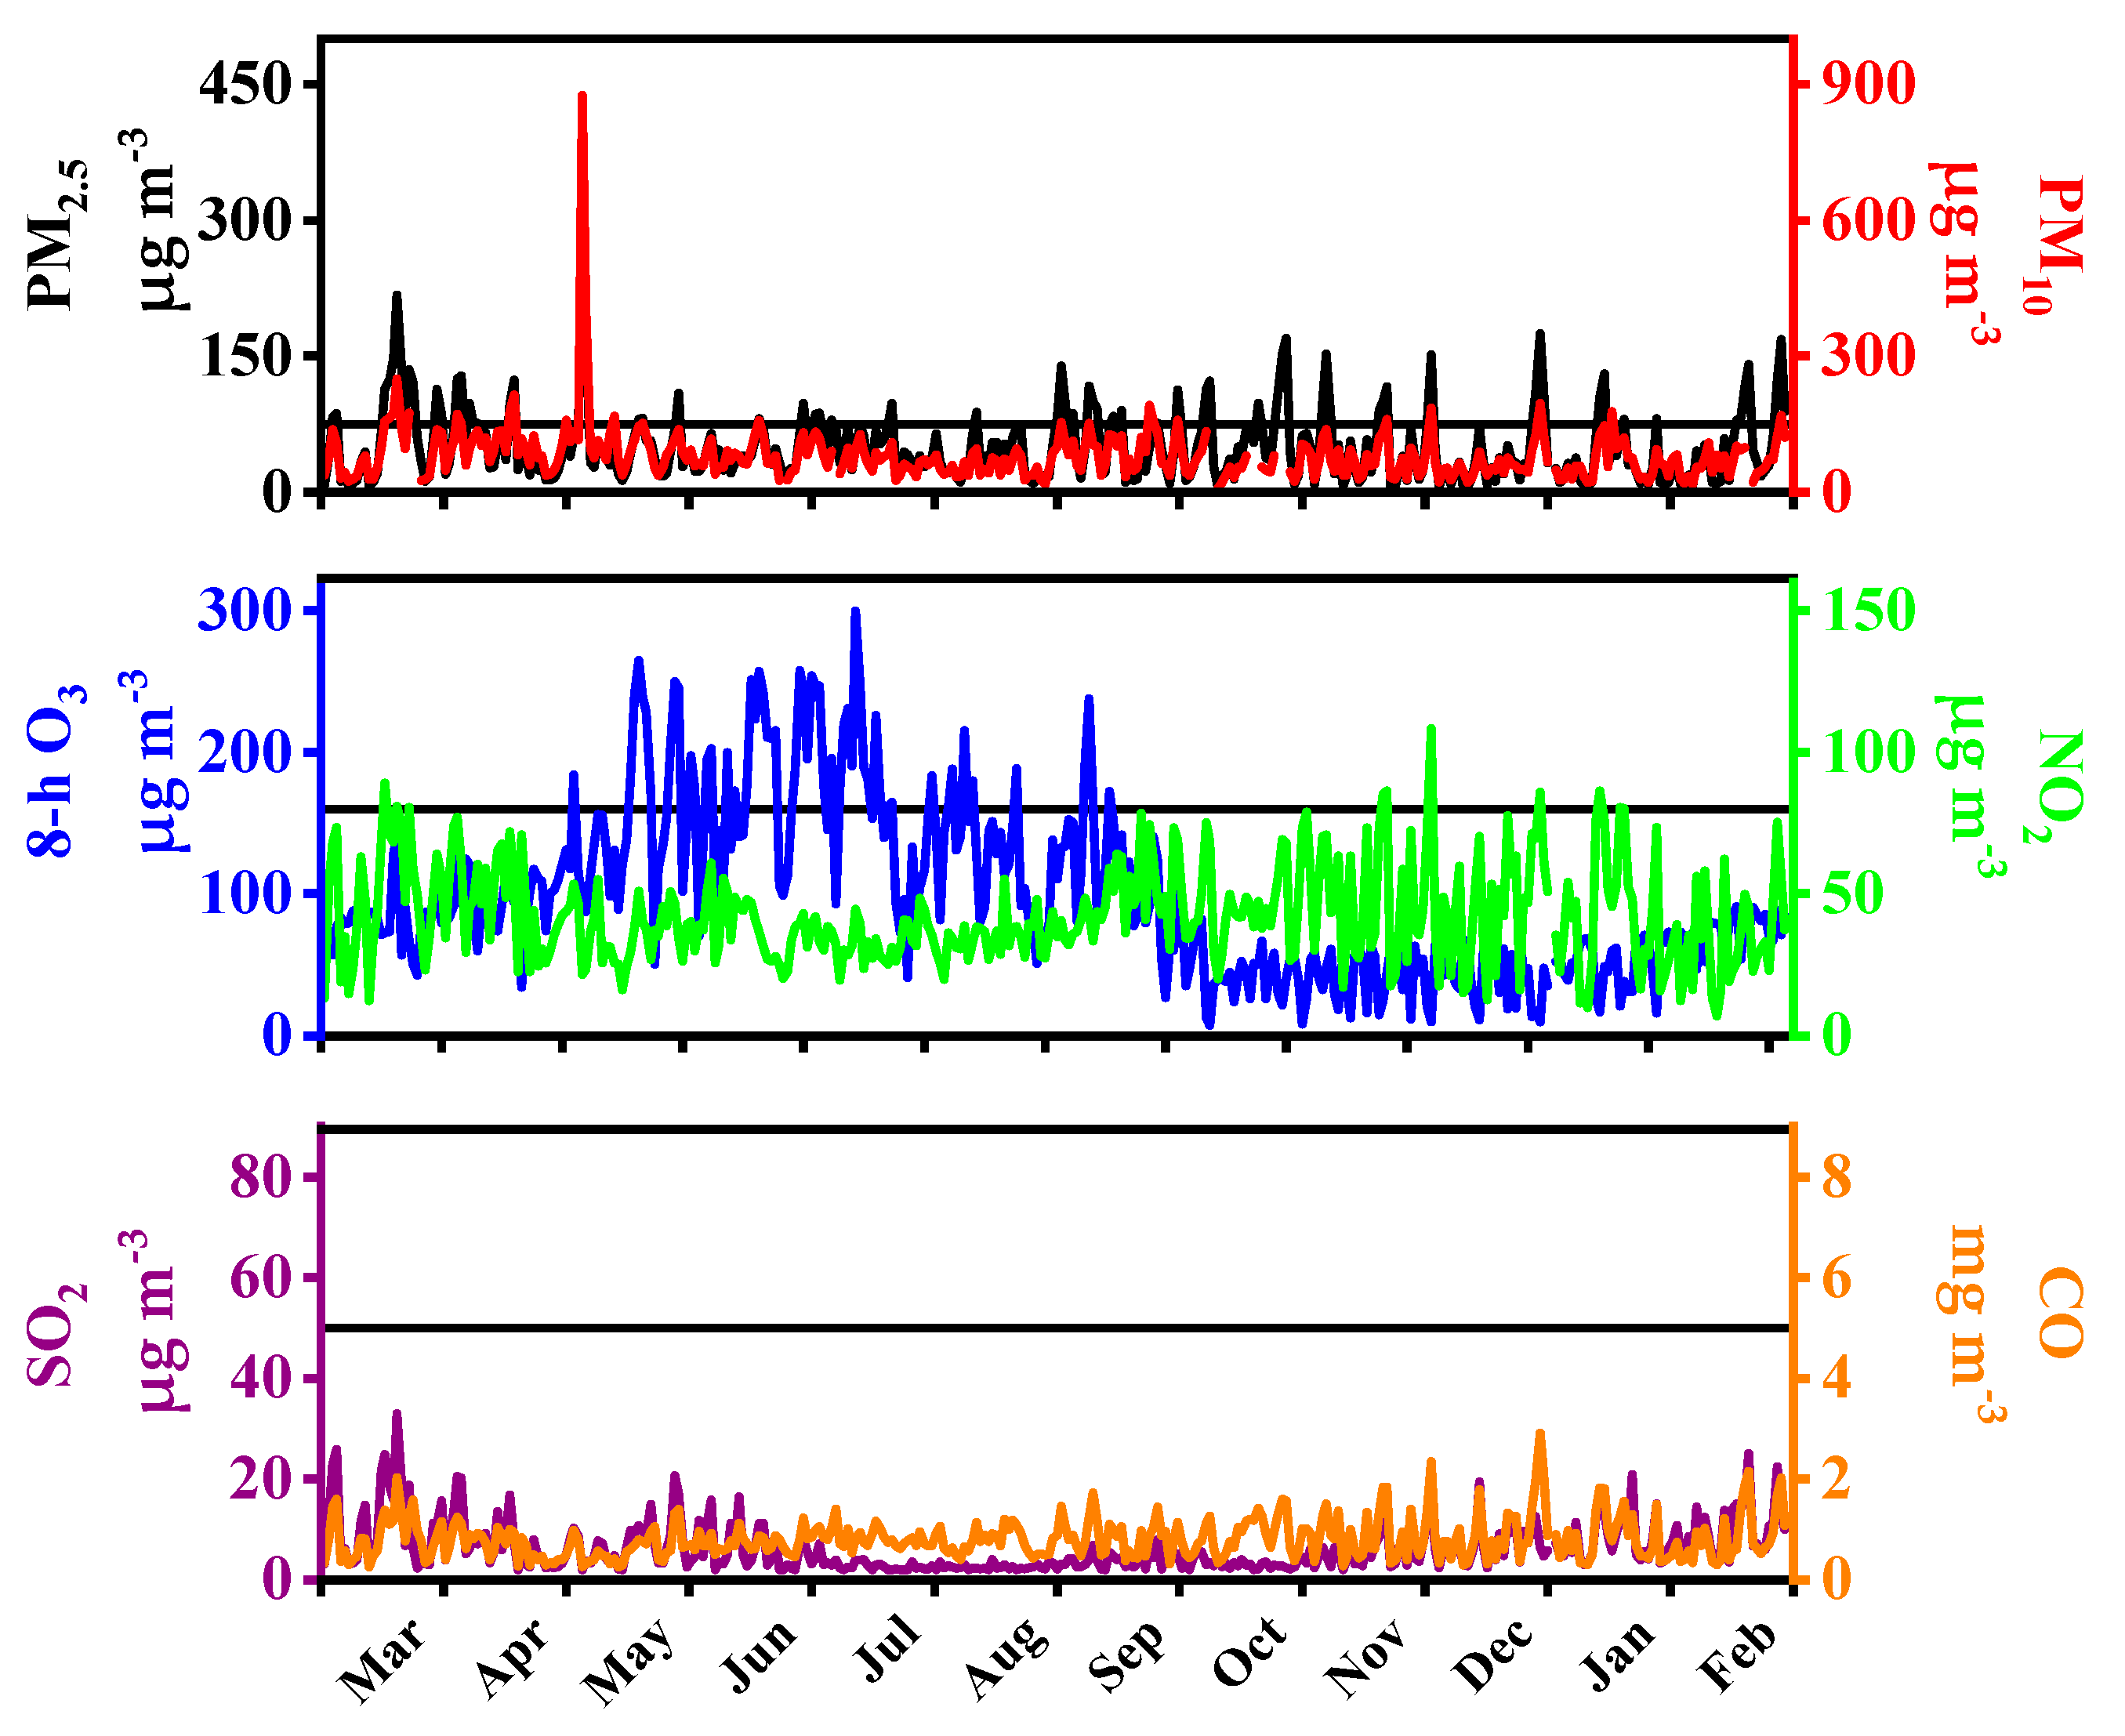
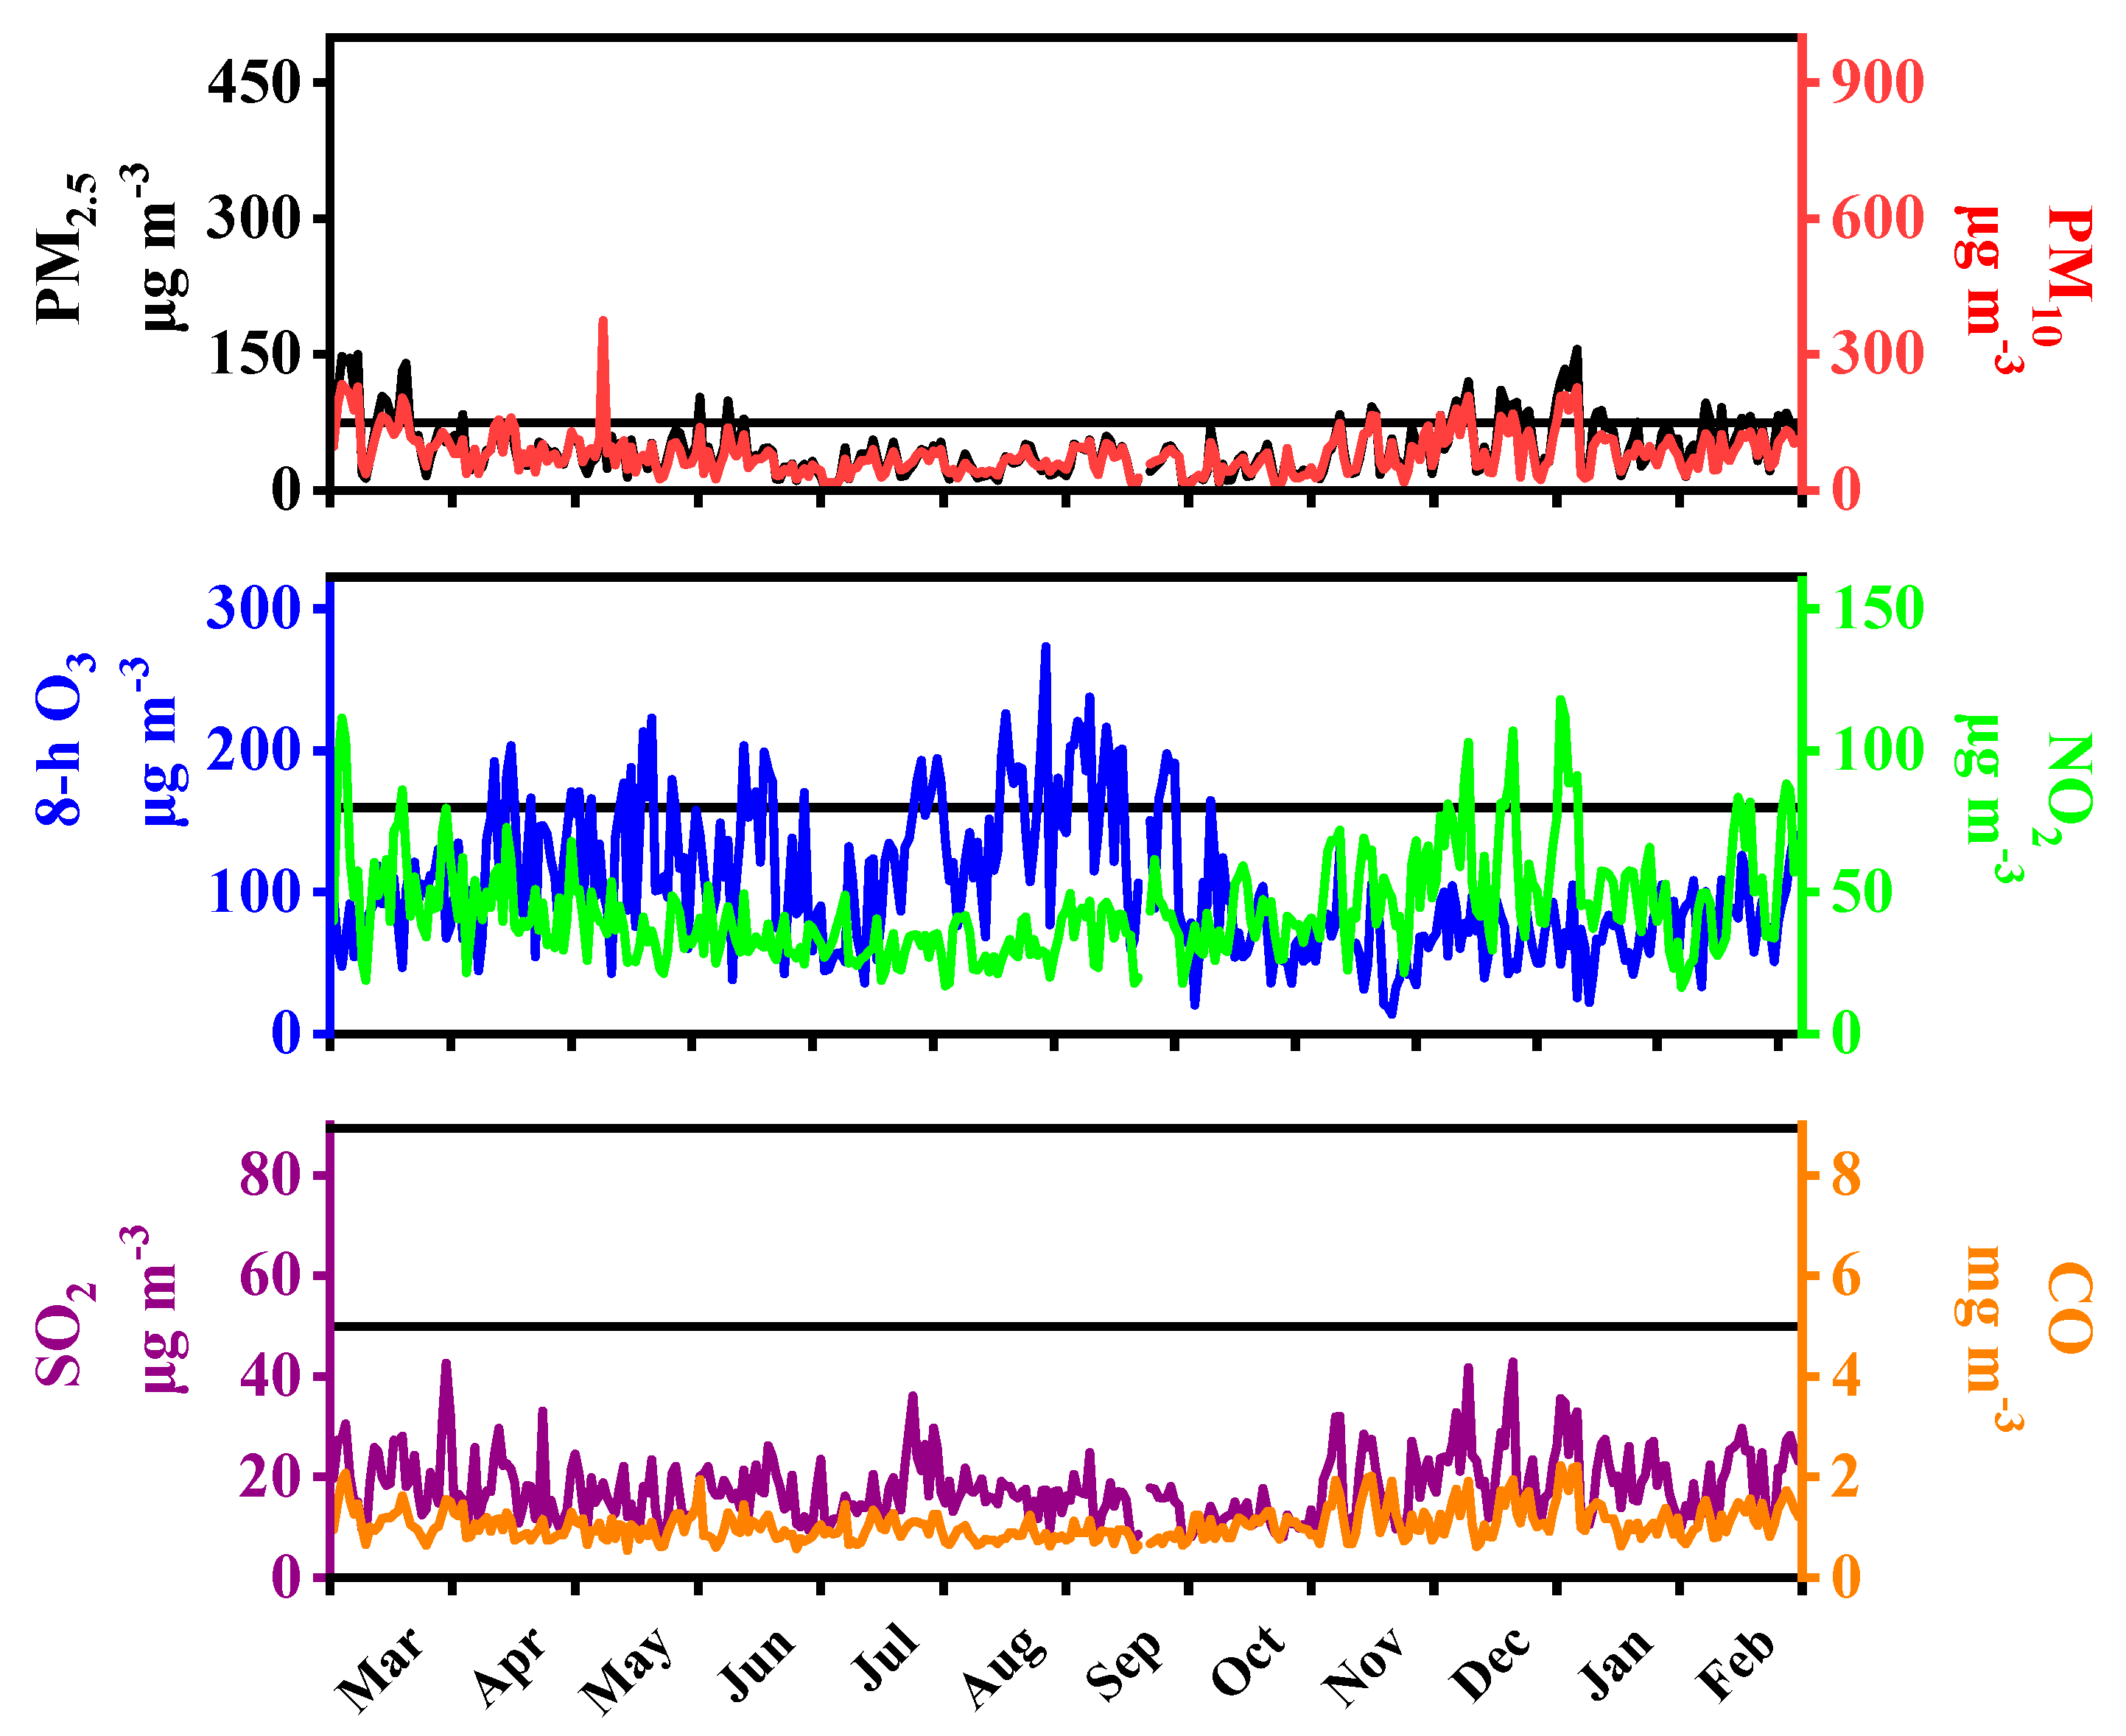
3.1. Data Overview
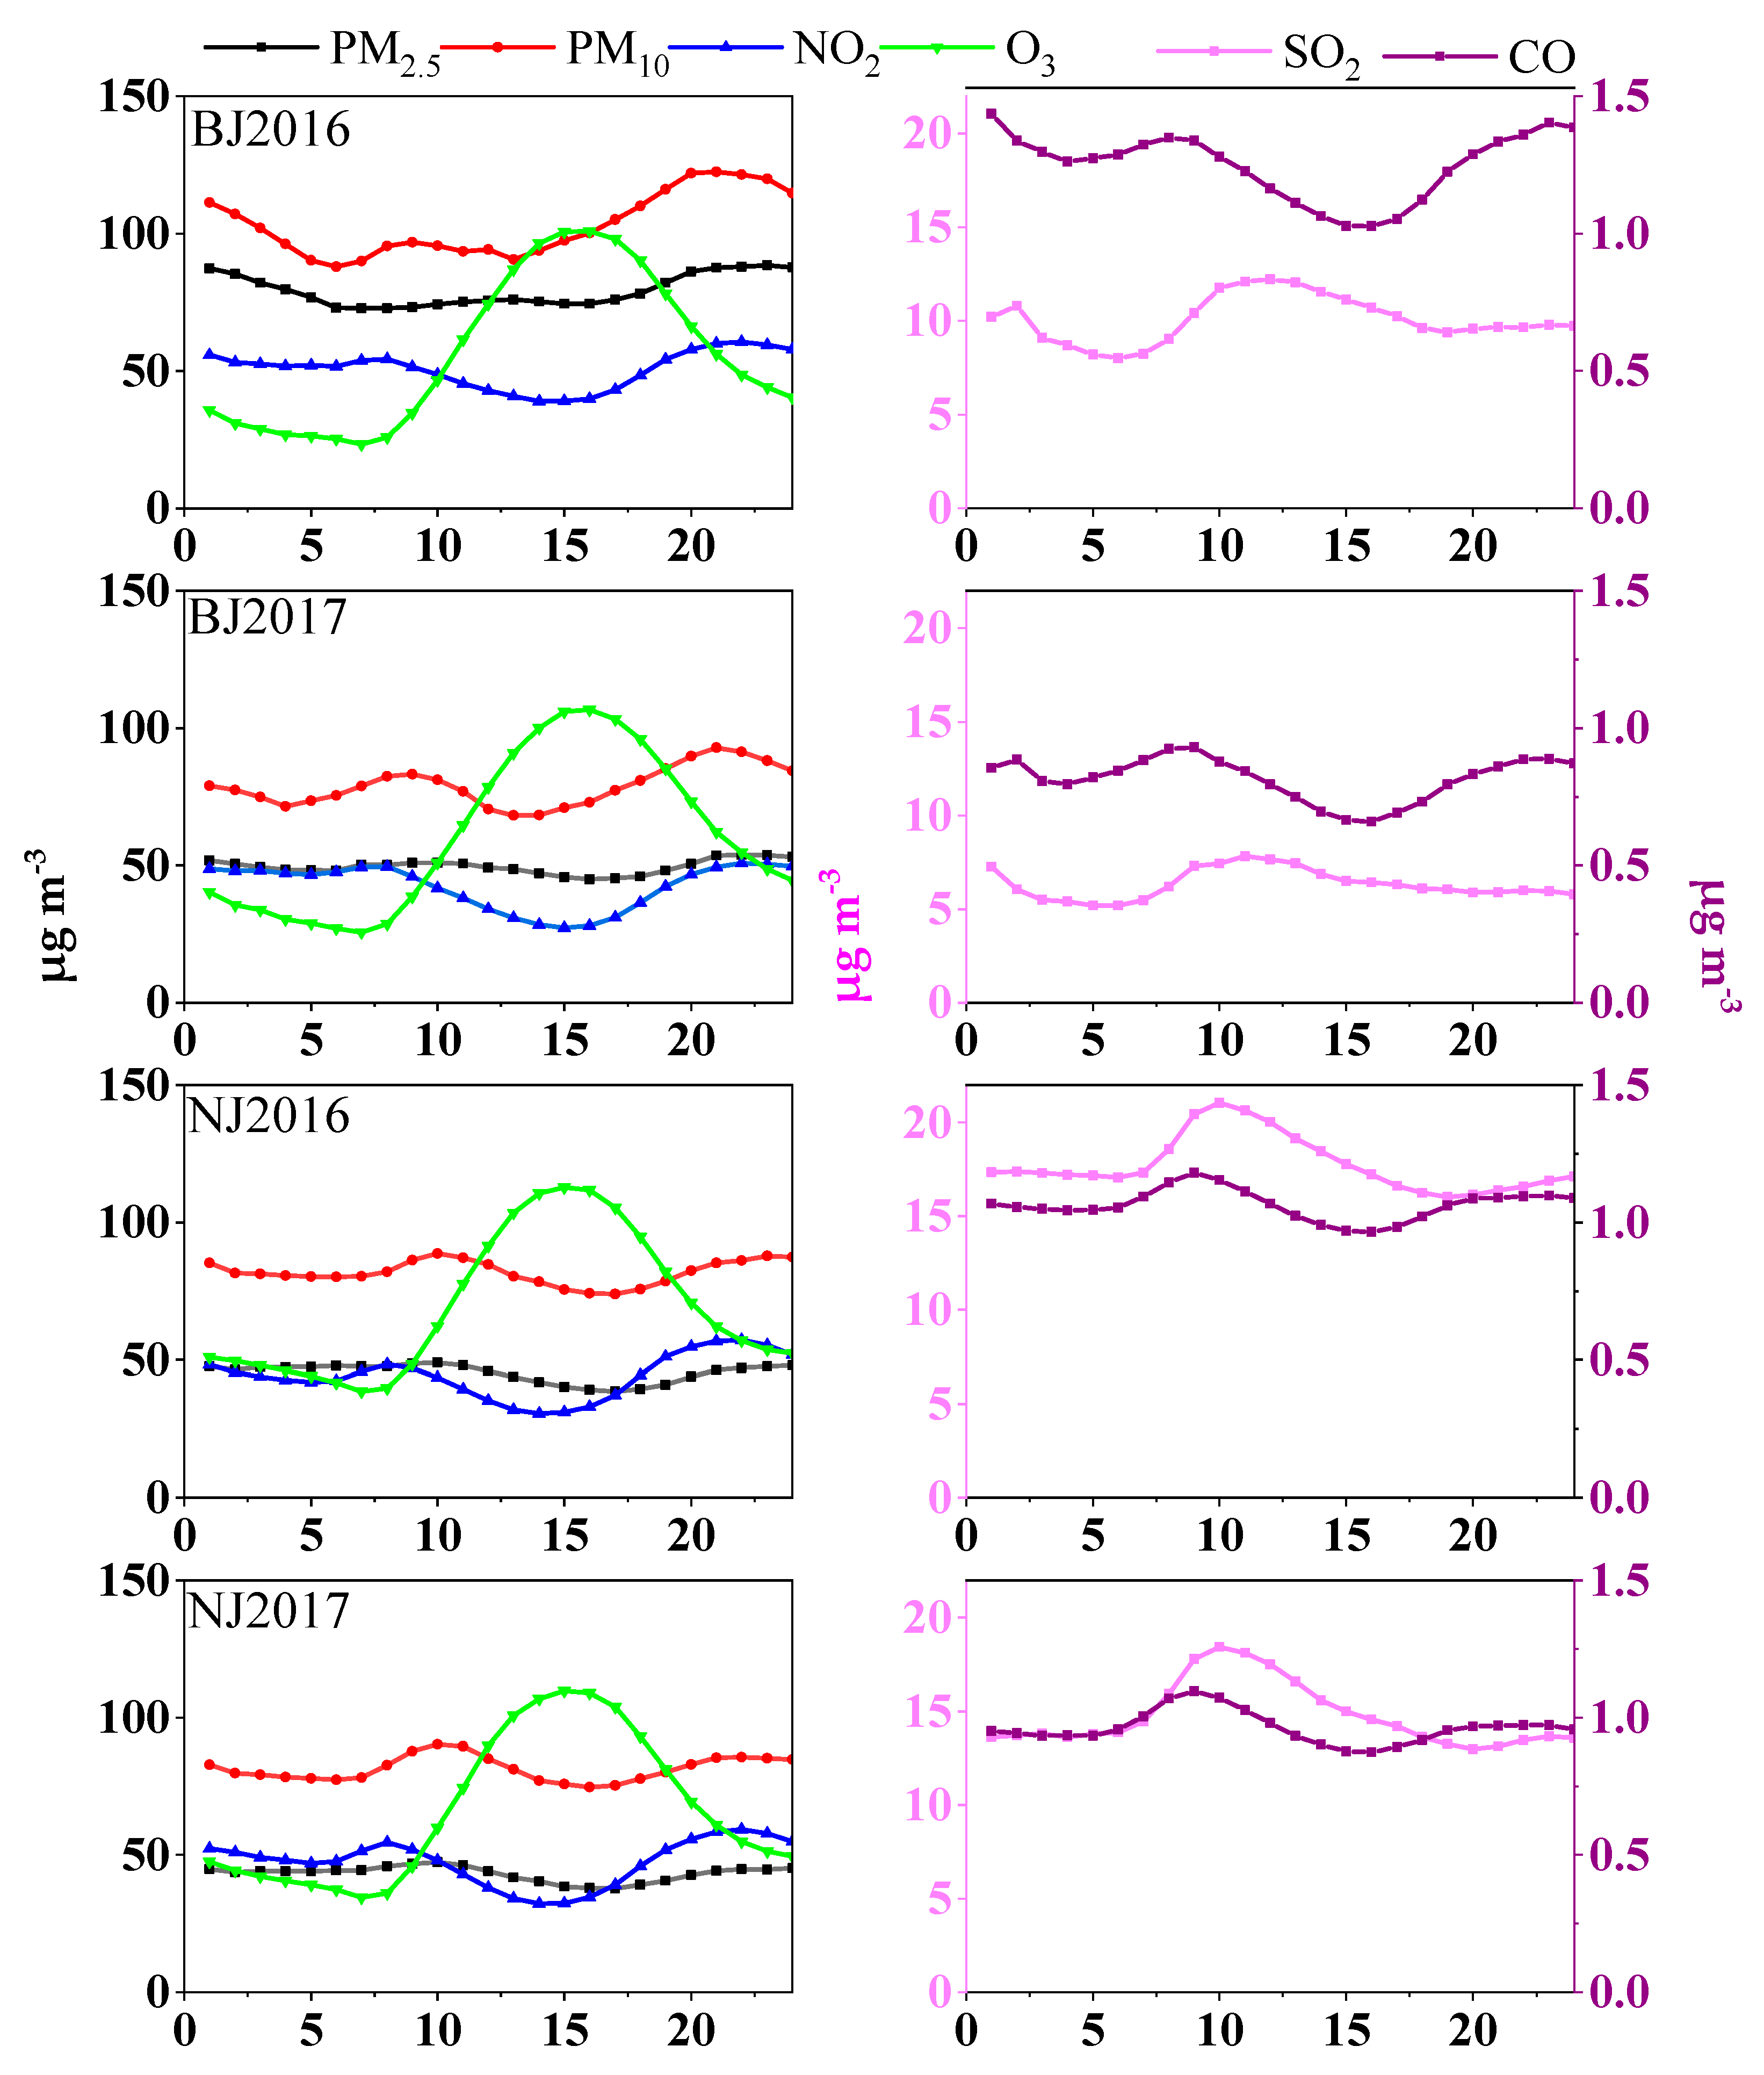
3.2. Hourly Variations of Pollutants in Two Cities
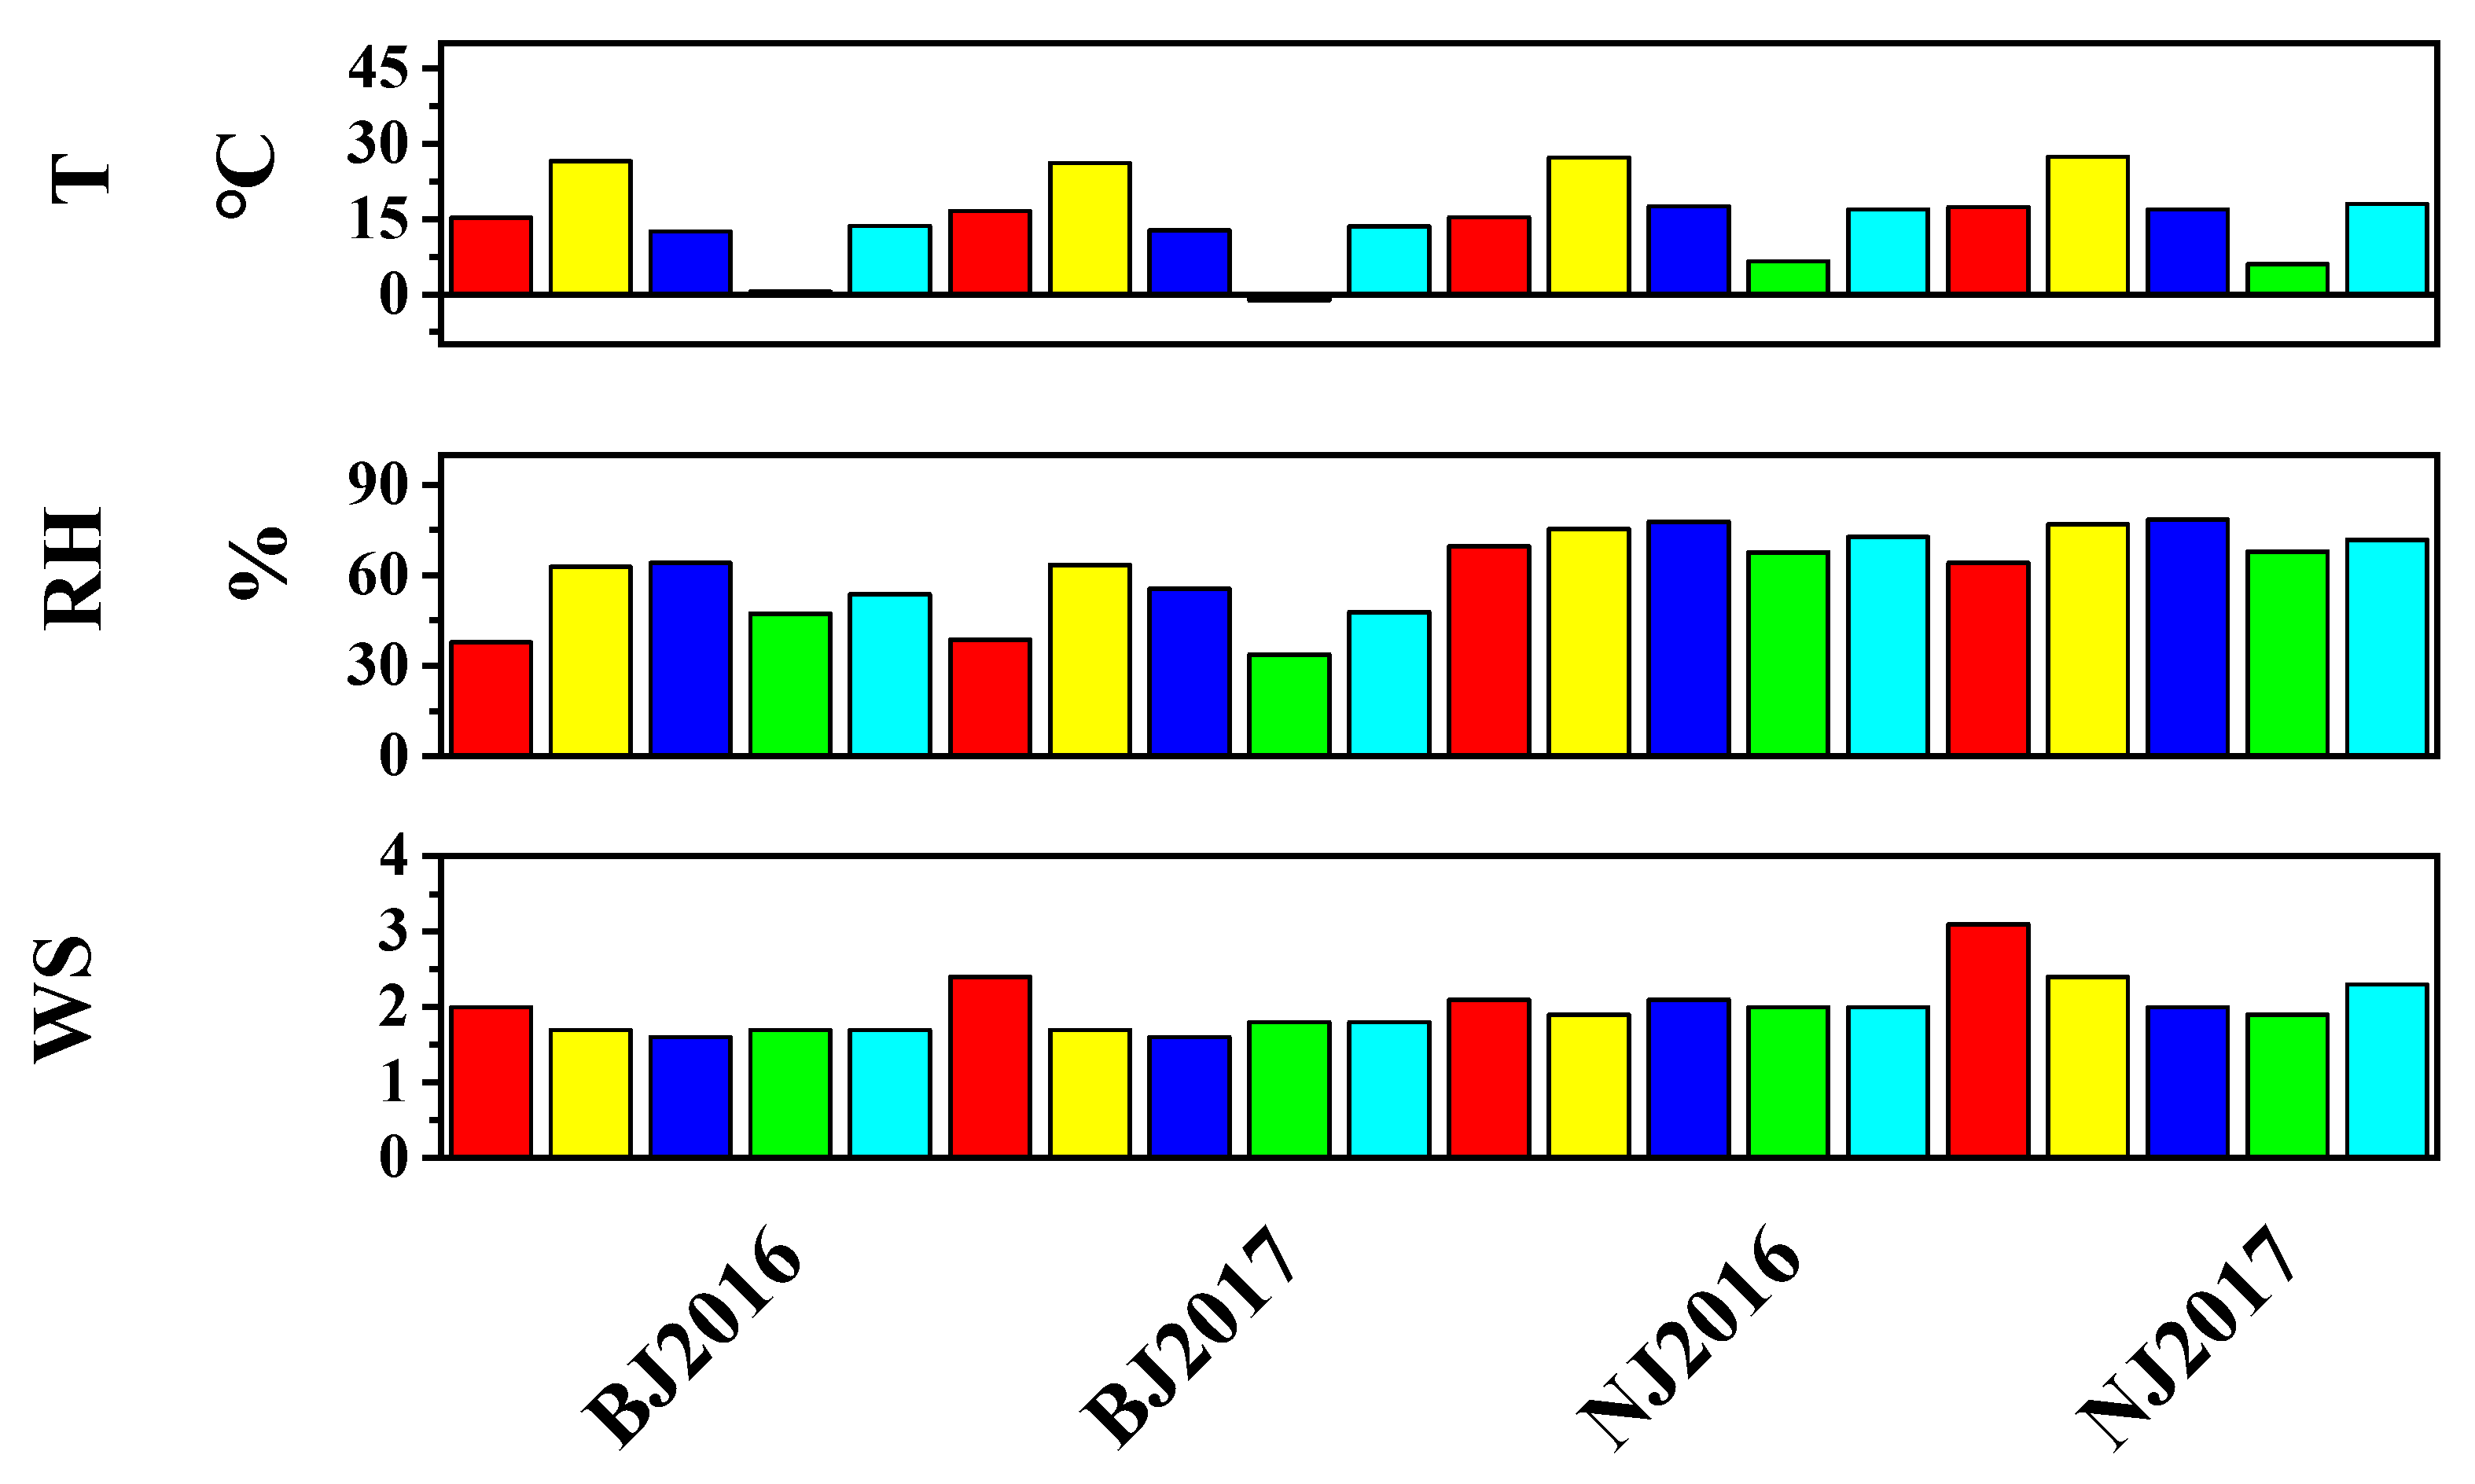
3.3. Seasonal Variations of Air Pollutants and Meteorological Parameters
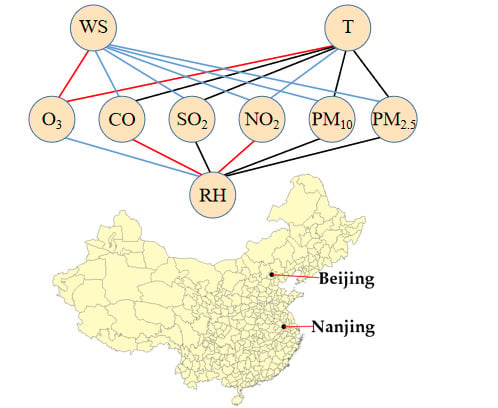
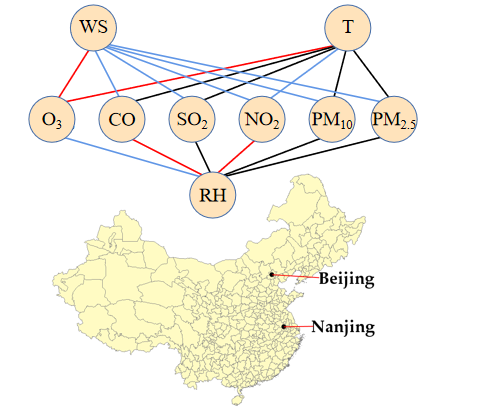
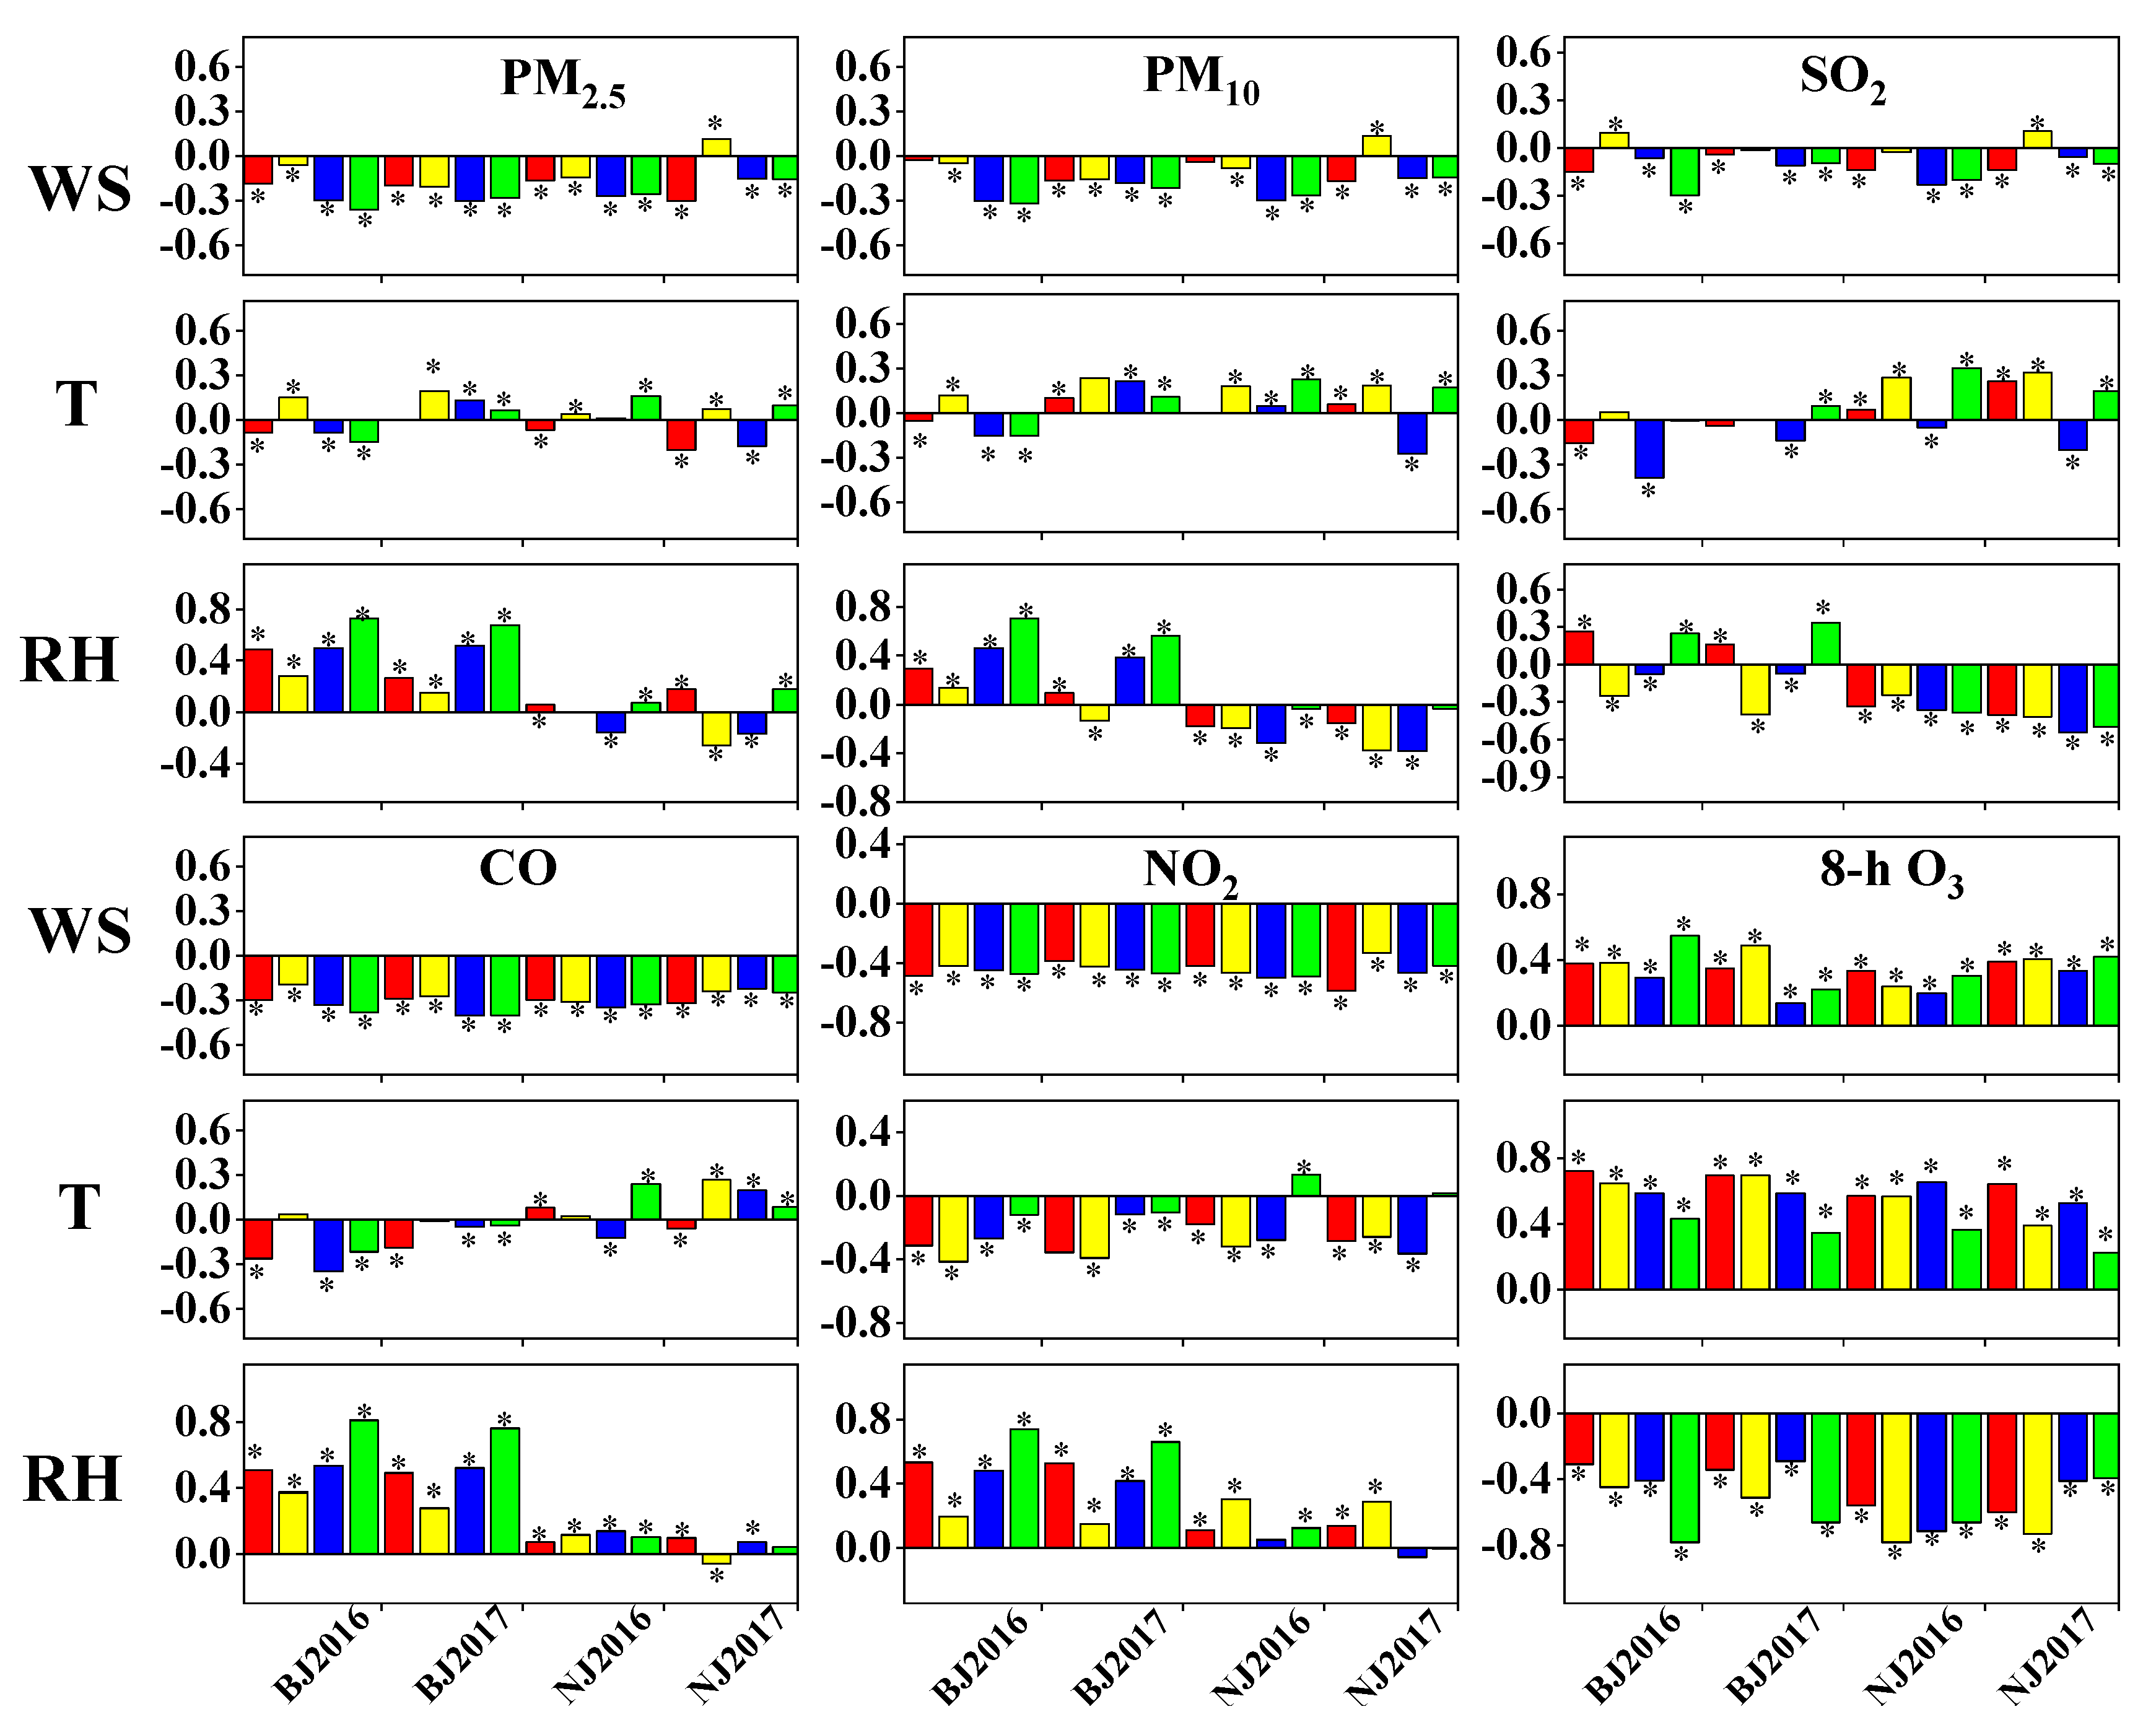
3.4. Correlation between Air Pollutants and Meteorological Factors
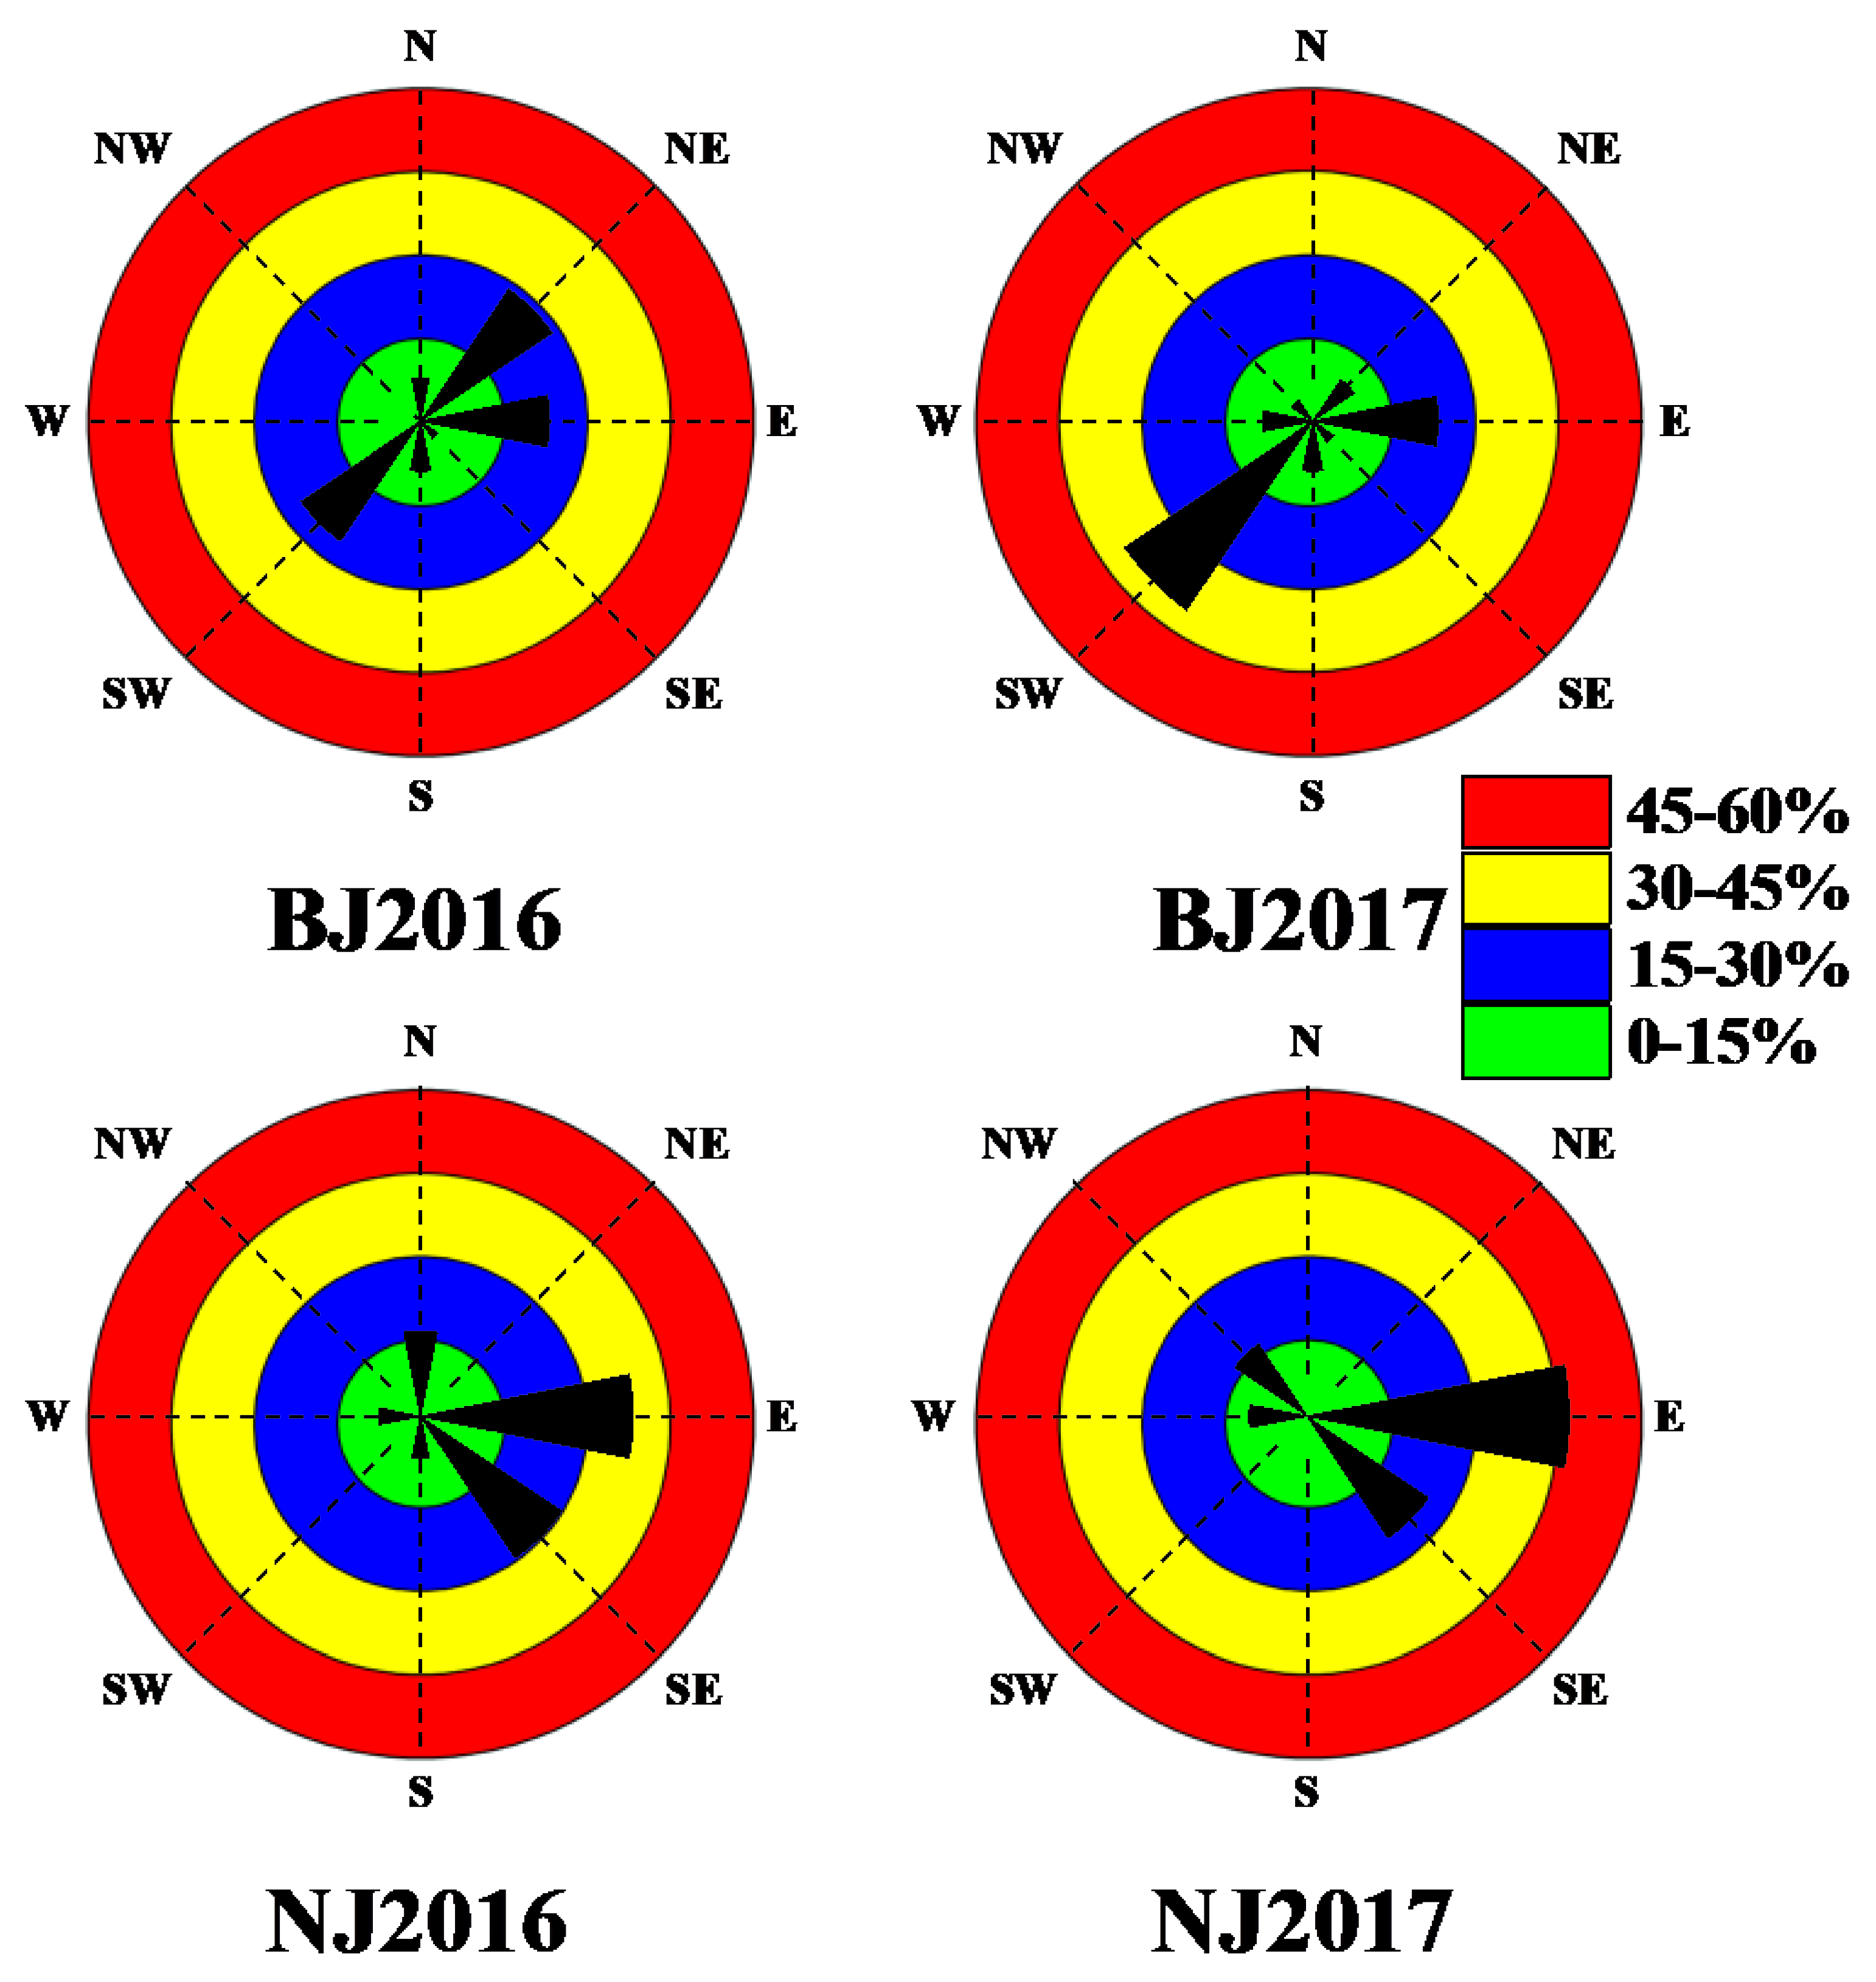
3.5. Contribution of Wind Directions to Heavily Polluted Days
4. Conclusions
Author Contributions
Funding
Conflicts of Interest
References
- Lyu, W.; Li, Y.; Guan, D.; Zhao, H.; Zhang, Q.; Liu, Z. Driving forces of Chinese primary air pollution emissions: An index decomposition analysis. J. Clean. Prod. 2016, 133, 136–144. [Google Scholar] [CrossRef]
- Hao, Y.; Peng, H.; Temulun, T.; Liu, L.-Q.; Mao, J.; Lu, Z.-N.; Chen, H. How harmful is air pollution to economic development? New evidence from PM2.5 concentrations of Chinese cities. J. Clean. Prod. 2018, 172, 743–757. [Google Scholar] [CrossRef]
- Song, C.; Wu, L.; Xie, Y.; He, J.; Chen, X.; Wang, T.; Lin, Y.; Jin, T.; Wang, A.; Liu, Y.; et al. Air pollution in China: Status and spatiotemporal variations. Environ. Pollut. 2017, 227, 334–347. [Google Scholar] [CrossRef] [PubMed]
- Lu, F.; Zhou, L.; Xu, Y.; Zheng, T.; Guo, Y.; Wellenius, G.A.; Bassig, B.A.; Chen, X.; Wang, H.; Zheng, X. Short-term effects of air pollution on daily mortality and years of life lost in Nanjing, China. Sci. Total Environ. 2015, 536, 123–129. [Google Scholar] [CrossRef] [PubMed]
- Maji, K.J.; Dikshit, A.K.; Arora, M.; Deshpande, A. Estimating premature mortality attributable to PM2.5 exposure and benefit of air pollution control policies in China for 2020. Sci. Total Environ. 2018, 612, 683–693. [Google Scholar] [CrossRef] [PubMed]
- Rohde, R.A.; Muller, R.A. Air Pollution in China: Mapping of Concentrations and Sources. PLoS. ONE 2015, 10, e0135749. [Google Scholar] [CrossRef] [PubMed]
- Kan, H.D. Environment and Health in China: Challenges and Opportunities. Environ. Health Perspect. 2009, 117, A530. [Google Scholar] [CrossRef]
- Silver, B.; Reddington, C.L.; Arnold, S.R.; Spracklen, D.V. Substantial changes in air pollution across China during 2015–2017. Environ Res. Lett. 2018, 13. [Google Scholar] [CrossRef]
- Wang, X.-C.; Klemeš, J.J.; Dong, X.; Fan, W.; Xu, Z.; Wang, Y.; Varbanov, P.; Reviews, S.E. Air pollution terrain nexus: A review considering energy generation and consumption. Renew. Sust. Energ. Rev. 2019, 105, 71–85. [Google Scholar] [CrossRef]
- Zhang, H.; Cheng, S.; Yao, S.; Wang, X.; Zhang, J. Multiple perspectives for modeling regional PM2.5 transport across cities in the Beijing–Tianjin–Hebei region during haze episodes. Atmos. Environ. 2019, 212, 22–35. [Google Scholar] [CrossRef]
- Ma, Y.; He, W.; Zhao, H.; Zhao, J.; Wu, X.; Wu, W.; Li, X.; Yin, C. Influence of Low Impact Development practices on urban diffuse pollutant transport process at catchment scale. J. Clean. Prod. 2019, 213, 357–364. [Google Scholar] [CrossRef]
- Zhong, Q.; Ma, J.; Shen, G.; Shen, H.; Zhu, X.; Yun, X.; Meng, W.; Cheng, H.; Liu, J.; Li, B.; et al. Distinguishing Emission-Associated Ambient Air PM2.5 Concentrations and Meteorological Factor-Induced Fluctuations. Environ. Sci. Technol. 2018, 52, 10416–10425. [Google Scholar] [CrossRef] [PubMed]
- Liu, X.; Nie, D.; Zhang, K.; Wang, Z.; Li, X.; Shi, Z.; Wang, Y.; Huang, L.; Chen, M.; Ge, X.; et al. Evaluation of particulate matter deposition in the human respiratory tract during winter in Nanjing using size and chemically resolved ambient measurements. Air Qual. Atmos. Health 2019, 12, 529–538. [Google Scholar] [CrossRef]
- Meng, C.; Cheng, T.; Gu, X.; Shi, S.; Wang, W.; Wu, Y.; Bao, F. Contribution of meteorological factors to particulate pollution during winters in Beijing. Sci. Total Environ. 2019, 656, 977–985. [Google Scholar] [CrossRef]
- Li, X.; Song, H.; Zhai, S.; Lu, S.; Kong, Y.; Xia, H.; Zhao, H. Particulate matter pollution in Chinese cities: Areal-temporal variations and their relationships with meteorological conditions (2015–2017). Environ. Pollut. 2019, 246, 11–18. [Google Scholar] [CrossRef]
- Li, R.; Wang, Z.; Cui, L.; Fu, H.; Zhang, L.; Kong, L.; Chen, W.; Chen, J. Air pollution characteristics in China during 2015-2016: Spatiotemporal variations and key meteorological factors. Sci. Total Environ. 2019, 648, 902–915. [Google Scholar] [CrossRef]
- He, J.; Gong, S.; Yu, Y.; Yu, L.; Wu, L.; Mao, H.; Song, C.; Zhao, S.; Liu, H.; Li, X.; et al. Air pollution characteristics and their relation to meteorological conditions during 2014–2015 in major Chinese cities. Environ. Pollut. 2017, 223, 484–496. [Google Scholar] [CrossRef]
- Liao, H.; Chang, W.; Yang, Y. Climatic effects of air pollutants over china: A review. Adv. Atmos. Sci. 2015, 32, 115–139. [Google Scholar] [CrossRef]
- Li, B.; Zhang, J.; Zhao, Y.; Yuan, S.; Zhao, Q.; Shen, G.; Wu, H. Seasonal variation of urban carbonaceous aerosols in a typical city Nanjing in Yangtze River Delta, China. Atmos. Environ. 2015, 106, 223–231. [Google Scholar] [CrossRef]
- Xiao, S.; Yu, X.; Zhu, B.; Kumar, K.R.; Li, M.; Li, L. Characterization and source apportionment of black carbon aerosol in the Nanjing Jiangbei New Area based on two years of measurements from Aethalometer. J. Aerosol Sci. 2020, 139. [Google Scholar] [CrossRef]
- Xu, G.; Jiao, L.; Yuan, M.; Dong, T.; Zhang, B.; Du, C. How does urban population density decline over time? An exponential model for Chinese cities with international comparisons. Landsc. Urban Plan. 2019, 183, 59–67. [Google Scholar] [CrossRef]
- Yan, H.; Wang, X.; Hao, P.; Dong, L. Study on the microclimatic characteristics and human comfort of park plant communities in summer. Procedia Environ. Sci. 2012, 13, 755–765. [Google Scholar] [CrossRef]
- Parungo, F.; Li, Z.; Li, X.; Yang, D.; Harris, J. Gobi dust storms and the Great Green Wall. Geophys. Res. Lett. 1994, 21, 999–1002. [Google Scholar] [CrossRef]
- Li, H.; Cheng, J.; Zhang, Q.; Zheng, B.; Zhang, Y.; Zheng, G.; He, K. Rapid transition in winter aerosol composition in Beijing from 2014 to 2017: Response to clean air actions. Atmos. Chem. Phys. 2019, 19, 11485–11499. [Google Scholar] [CrossRef]
- Zheng, B.; Tong, D.; Li, M.; Liu, F.; Hong, C.; Geng, G.; Li, H.; Li, X.; Peng, L.; Qi, J.; et al. Trends in China’s anthropogenic emissions since 2010 as the consequence of clean air actions. Atmos. Chem Phys. 2018, 18, 14095–14111. [Google Scholar] [CrossRef]
- Sha, T.; Ma, X.; Jia, H.; Tian, R.; Chang, Y.; Cao, F.; Zhang, Y. Aerosol chemical component: Simulations with WRF-Chem and comparison with observations in Nanjing. Atmos. Environ. 2019, 218. [Google Scholar] [CrossRef]
- Zhang, H.; Wang, Y.; Hu, J.; Ying, Q.; Hu, X.M. Relationships between meteorological parameters and criteria air pollutants in three megacities in China. Environ. Res. 2015, 140, 242–254. [Google Scholar] [CrossRef]
- Pan, L.; Xu, J.; Tie, X.; Mao, X.; Gao, W.; Chang, L. Long-term measurements of planetary boundary layer height and interactions with PM2.5 in Shanghai, China. Atmos. Pollut. Res. 2019, 10, 989–996. [Google Scholar] [CrossRef]
- Hu, W.; Hu, M.; Deng, Z.; Xiao, R.; Kondo, Y.; Takegawa, N.; Zhao, Y.; Guo, S.; Zhang, Y.J. The characteristics and origins of carbonaceous aerosol at a rural site of PRD in summer of 2006. Atmos. Chem. Phys. 2012, 12, 1811–1822. [Google Scholar] [CrossRef]
- Guo, H.; Wang, T.; Simpson, I.J.; Blake, D.R.; Yu, X.M.; Kwok, Y.H.; Li, Y.S. Source contributions to ambient VOCs and CO at a rural site in eastern China. Atmos. Environ. 2004, 38, 4551–4560. [Google Scholar] [CrossRef]
- Soltic, P.; Weilenmann, M. NO2/NO emissions of gasoline passenger cars and light-duty trucks with Euro-2 emission standard. Atmos. Environ. 2003, 37, 5207–5216. [Google Scholar] [CrossRef]
- Han, S.; Bian, H.; Feng, Y.; Liu, A.; Li, X.; Zeng, F.; Zhang, X. Analysis of the Relationship between O3, NO and NO2 in Tianjin, China. Aerosol Air Qual. Res. 2011, 11, 128–139. [Google Scholar] [CrossRef]
- Sillman, S. Some theoretical results concerning O3-NOx-VOC chemistry and NOx-VOC indicators. J. Geophys. Res. Atmos. 2002, 107. [Google Scholar] [CrossRef]
- Yoo, J.-M.; Lee, Y.-R.; Kim, D.; Jeong, M.-J.; Stockwell, W.R.; Kundu, P.K.; Oh, S.-M.; Shin, D.-B.; Lee, S.-J. New indices for wet scavenging of air pollutants (O3, CO, NO2, SO2, and PM10) by summertime rain. Atmos. Environ. 2014, 82, 226–237. [Google Scholar] [CrossRef]
- Sun, Y.; Liu, C.; Palm, M.; Vigouroux, C.; Notholt, J.; Hu, Q.; Jones, N.; Wang, W.; Su, W.; Zhang, W.; et al. Ozone seasonal evolution and photochemical production regime in the polluted troposphere in eastern China derived from high-resolution Fourier transform spectrometry (FTS) observations. Atmos. Chem. Phys. 2018, 18, 14569–14583. [Google Scholar] [CrossRef]
- Tao, M.; Chen, L.; Li, R.; Wang, L.; Wang, J.; Wang, Z.; Tang, G.; Tao, J. Spatial oscillation of the particle pollution in eastern China during winter: Implications for regional air quality and climate. Atmos. Environ. 2016, 144, 100–110. [Google Scholar] [CrossRef]
- Noble, C.A.; Mukerjee, S.; Gonzales, M.; Rodes, C.E.; Lawless, P.A.; Natarajan, S.; Myers, E.A.; Norris, G.A.; Smith, L.; Ière, M.; et al. Ozoeasurement of fine and ultrafine particulate matter, criteria pollutants and meteorological conditions in urban El Paso, Texas. Atmos. Environ. 2018, 37, 827–840. [Google Scholar] [CrossRef]
- Han, L.; Zhou, W.; Li, W.; Meshesha, D.T.; Li, L.; Zheng, M. Meteorological and urban landscape factors on severe air pollution in Beijing. J. Air Waste Manag. 2015, 65, 782–787. [Google Scholar] [CrossRef]
- Banta, R.M.; Senff, C.J.; Alvarez, R.J.; Langford, A.O.; Parrish, D.D.; Trainer, M.K.; Darby, L.S.; Michael Hardesty, R.; Lambeth, B.; Andrew Neuman, J. Dependence of daily peak O3 concentrations near Houston, Texas on environmental factors: Wind speed, temperature, and boundary-layer depth. Atmos. Environ. 2011, 45, 162–173. [Google Scholar] [CrossRef]
- Duo, B.; Cui, L.; Wang, Z.; Li, R.; Zhang, L.; Fu, H.; Chen, J.; Zhang, H.; Qiong, A. Observations of atmospheric pollutants at Lhasa during 2014-2015: Pollution status and the influence of meteorological factors. J. Environ. Sci. (China) 2018, 63, 28–42. [Google Scholar] [CrossRef]
- Yang, J.; Ji, Z.; Kang, S.; Zhang, Q.; Chen, X.; Lee, S.Y. Spatiotemporal variations of air pollutants in western China and their relationship to meteorological factors and emission sources. Environ. Pollut. 2019, 254, 112952. [Google Scholar] [CrossRef] [PubMed]
- Anderson, J.L.; Dixon, J.K.; Maginn, E.J.; Brennecke, J. Measurement of SO2 solubility in ionic liquids. J. Phys. Chem. B. 2006, 110, 15059–15062. [Google Scholar] [CrossRef] [PubMed]
- Tsai, W.; Altwicker, E.; Asman, W. Numerical simulation of wet scavenging of air pollutants. Atmos. Environ. Part A Gen. Top. 1990, 24, 2485–2498. [Google Scholar] [CrossRef]
- Leung, D.M.; Tai, A.P.K.; Mickley, L.J.; Moch, J.M.; Donkelaar, A.; Shen, L.; Martin, R.V. Synoptic meteorological modes of variability for fine particulate matter (PM2.5) air quality in major metropolitan regions of China. Atmos. Chem. Phys. 2018, 18, 6733–6748. [Google Scholar] [CrossRef]
- Walcek, C.J. Cloud cover and its relationship to relative humidity during a springtime midlatitude cyclone. Mon. Weather Rev. 1994, 122, 1021–1035. [Google Scholar] [CrossRef]
- Brion, J.; Chakir, A.; Daumont, D.; Malicet, J.; Parisse, C. High-resolution laboratory absorption cross section of O3. Temperature effect. Chem. Phys. Lett. 1993, 213, 610–612. [Google Scholar] [CrossRef]
- Chen, X.; Situ, S.; Zhang, Q.; Wang, X.; Sha, C.; Zhouc, L.; Wu, L.; Wu, L.; Ye, L.; Li, C. The synergetic control of NO2 and O3 concentrations in a manufacturing city of southern China. Atmos. Environ. 2019, 201, 402–416. [Google Scholar] [CrossRef]
- Wagner, E.J.E.M. Impacts on air pollution in urban areas. Environ. Manag. 1994, 18, 759–765. [Google Scholar] [CrossRef]
- Ma, Q.; Wu, Y.; Zhang, D.; Wang, X.; Xia, Y.; Liu, X.; Tian, P.; Han, Z.; Xia, X.; Wang, Y.; et al. Roles of regional transport and heterogeneous reactions in the PM2.5 increase during winter haze episodes in Beijing. Sci. Total Environ. 2017, 599–600, 246–253. [Google Scholar] [CrossRef]
- Zhang, L.; Guo, X.; Zhao, T.; Gong, S.; Xu, X.; Li, Y.; Luo, L.; Gui, K.; Wang, H.; Zheng, Y.; et al. A modelling study of the terrain effects on haze pollution in the Sichuan Basin. Atmos. Environ. 2019, 196, 77–85. [Google Scholar] [CrossRef]


© 2020 by the authors. Licensee MDPI, Basel, Switzerland. This article is an open access article distributed under the terms and conditions of the Creative Commons Attribution (CC BY) license (http://creativecommons.org/licenses/by/4.0/).
Share and Cite
Zhou, H.; Yu, Y.; Gu, X.; Wu, Y.; Wang, M.; Yue, H.; Gao, J.; Lei, R.; Ge, X. Characteristics of Air Pollution and Their Relationship with Meteorological Parameters: Northern Versus Southern Cities of China. Atmosphere 2020, 11, 253. https://doi.org/10.3390/atmos11030253
Zhou H, Yu Y, Gu X, Wu Y, Wang M, Yue H, Gao J, Lei R, Ge X. Characteristics of Air Pollution and Their Relationship with Meteorological Parameters: Northern Versus Southern Cities of China. Atmosphere. 2020; 11(3):253. https://doi.org/10.3390/atmos11030253
Chicago/Turabian StyleZhou, Haitao, Yueming Yu, Xuan Gu, Yun Wu, Mei Wang, Hao Yue, Jiale Gao, Ruoyuan Lei, and Xinlei Ge. 2020. "Characteristics of Air Pollution and Their Relationship with Meteorological Parameters: Northern Versus Southern Cities of China" Atmosphere 11, no. 3: 253. https://doi.org/10.3390/atmos11030253
APA StyleZhou, H., Yu, Y., Gu, X., Wu, Y., Wang, M., Yue, H., Gao, J., Lei, R., & Ge, X. (2020). Characteristics of Air Pollution and Their Relationship with Meteorological Parameters: Northern Versus Southern Cities of China. Atmosphere, 11(3), 253. https://doi.org/10.3390/atmos11030253