A Random Forest Approach to Estimate Daily Particulate Matter, Nitrogen Dioxide, and Ozone at Fine Spatial Resolution in Sweden


 , ,
, ,
Abstract
1. Introduction
2. Data and Methodology
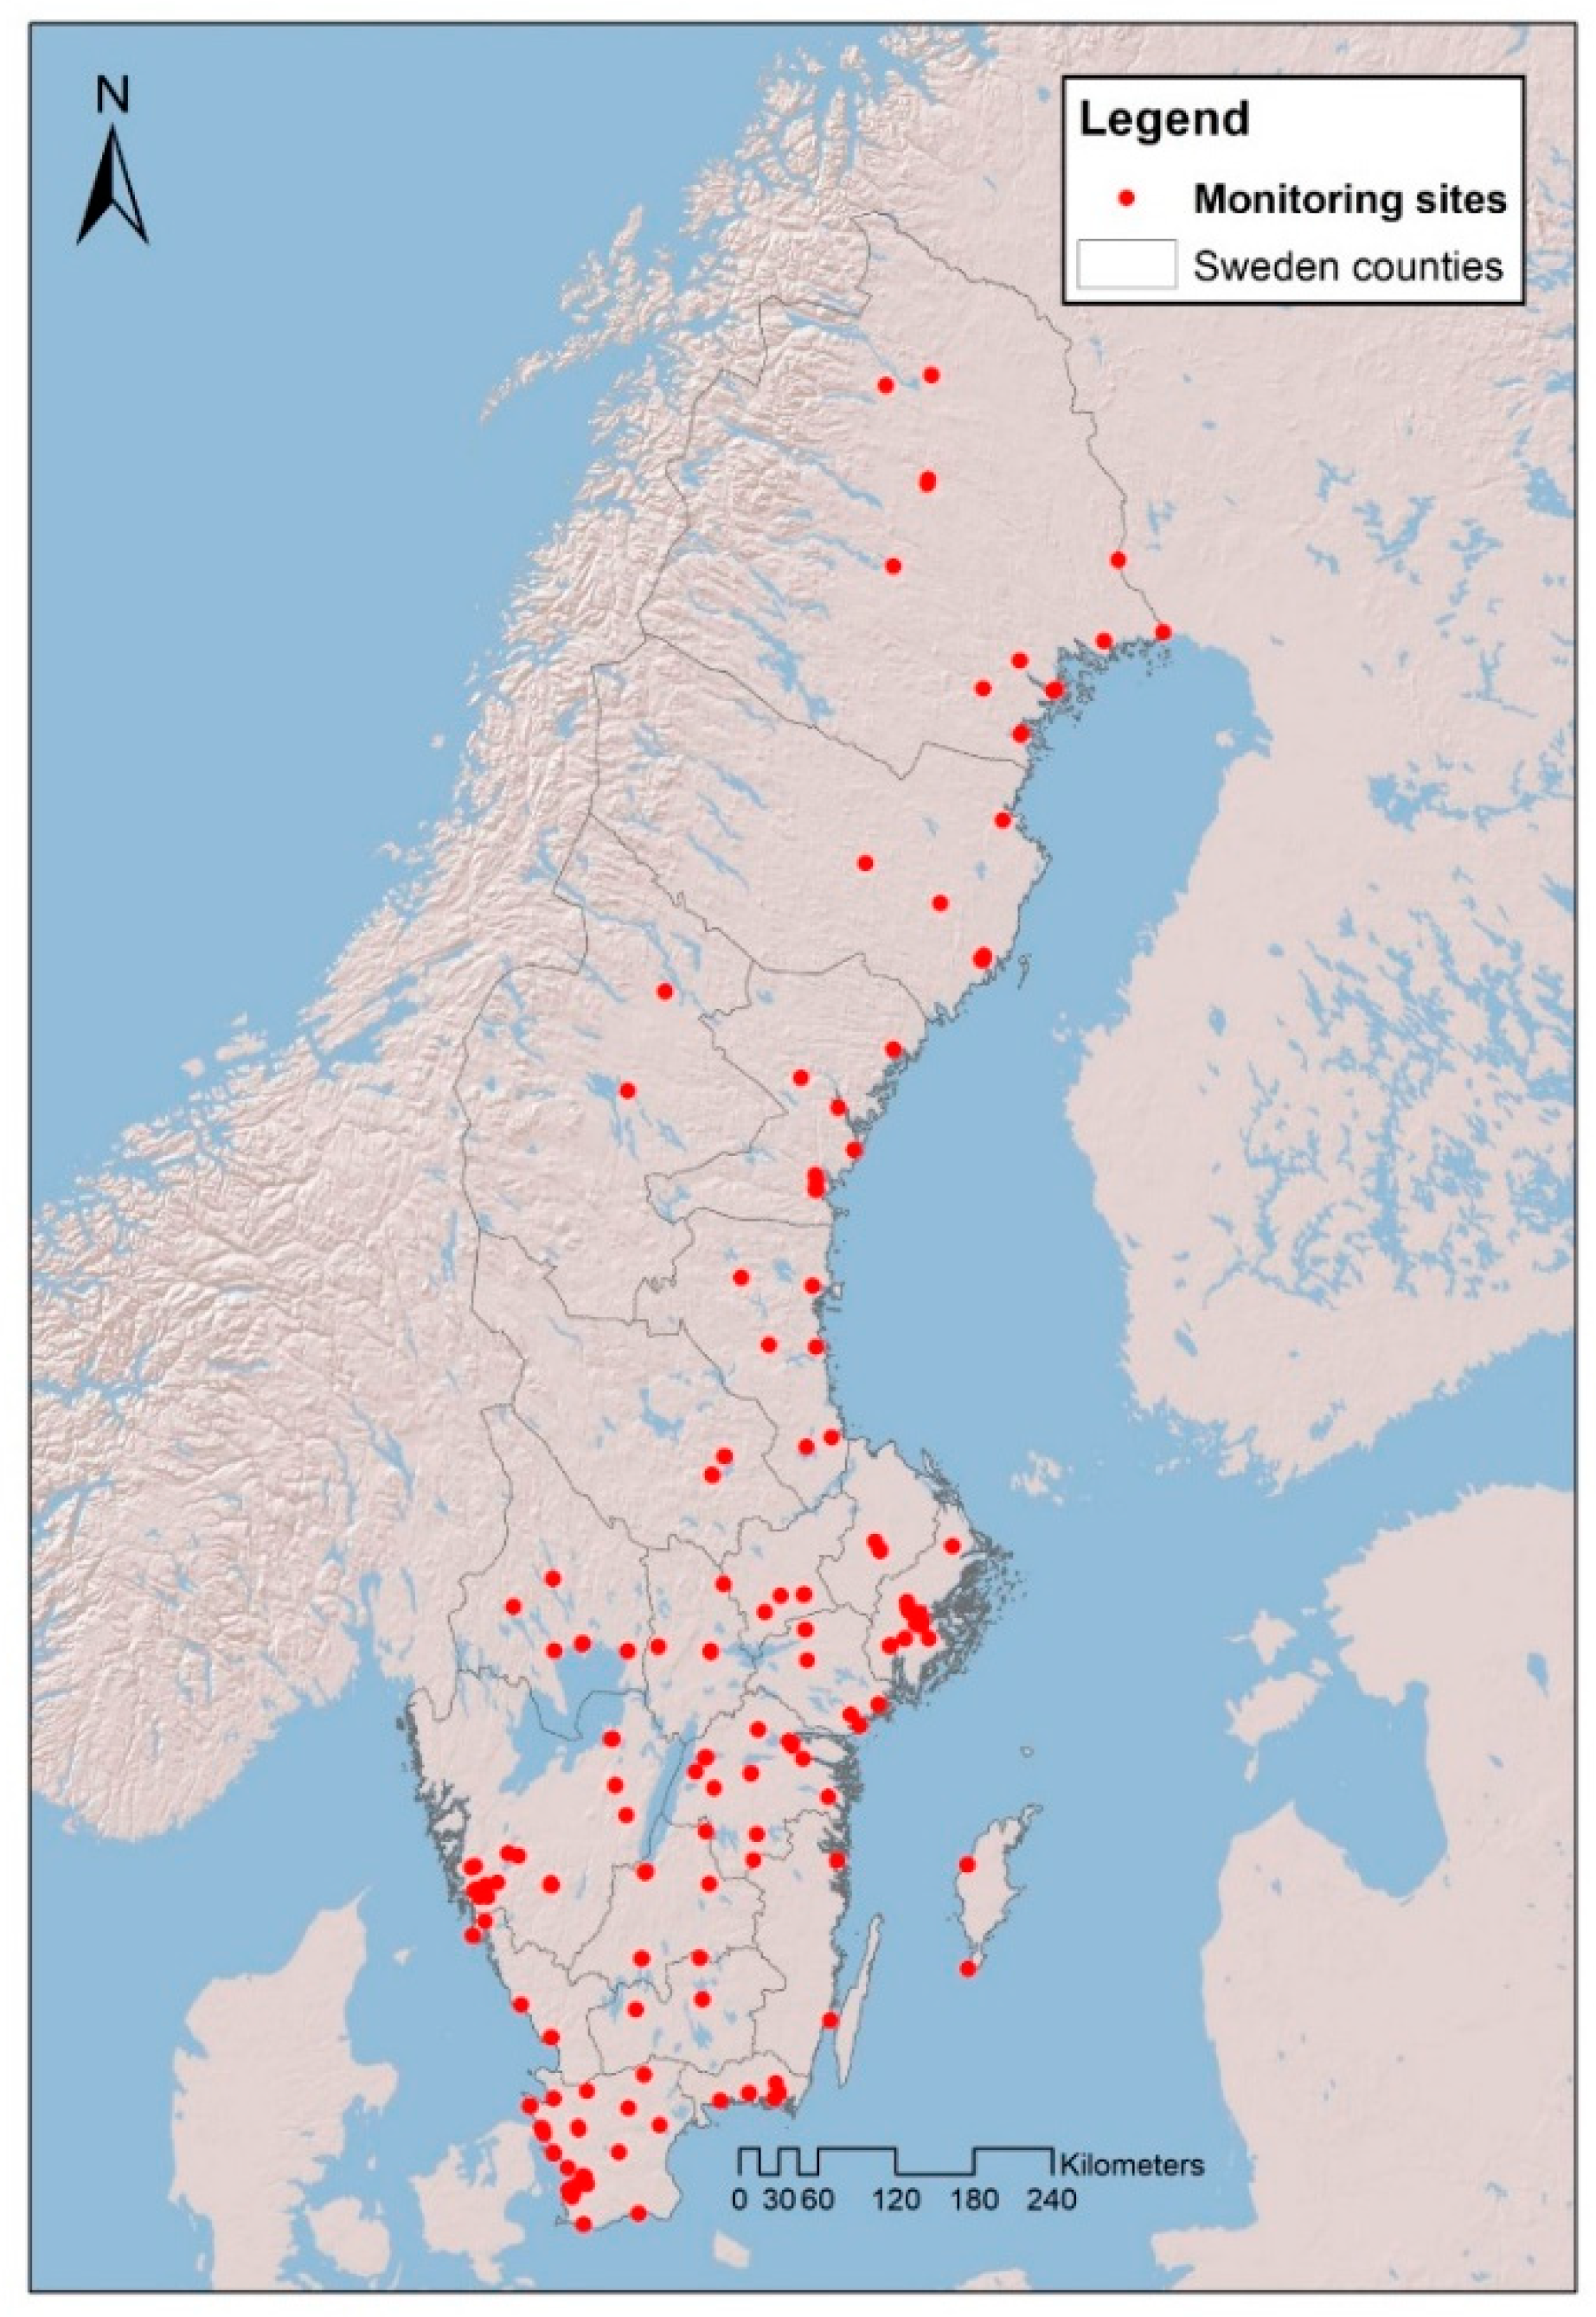
2.1. Study Region
2.2. Air Pollution Data
2.3. Spatiotemporal Predictor Variables
2.4. Spatial Predictor Variables
2.5. Statistical Models
3. Results and Discussion
3.1. Monitored Data
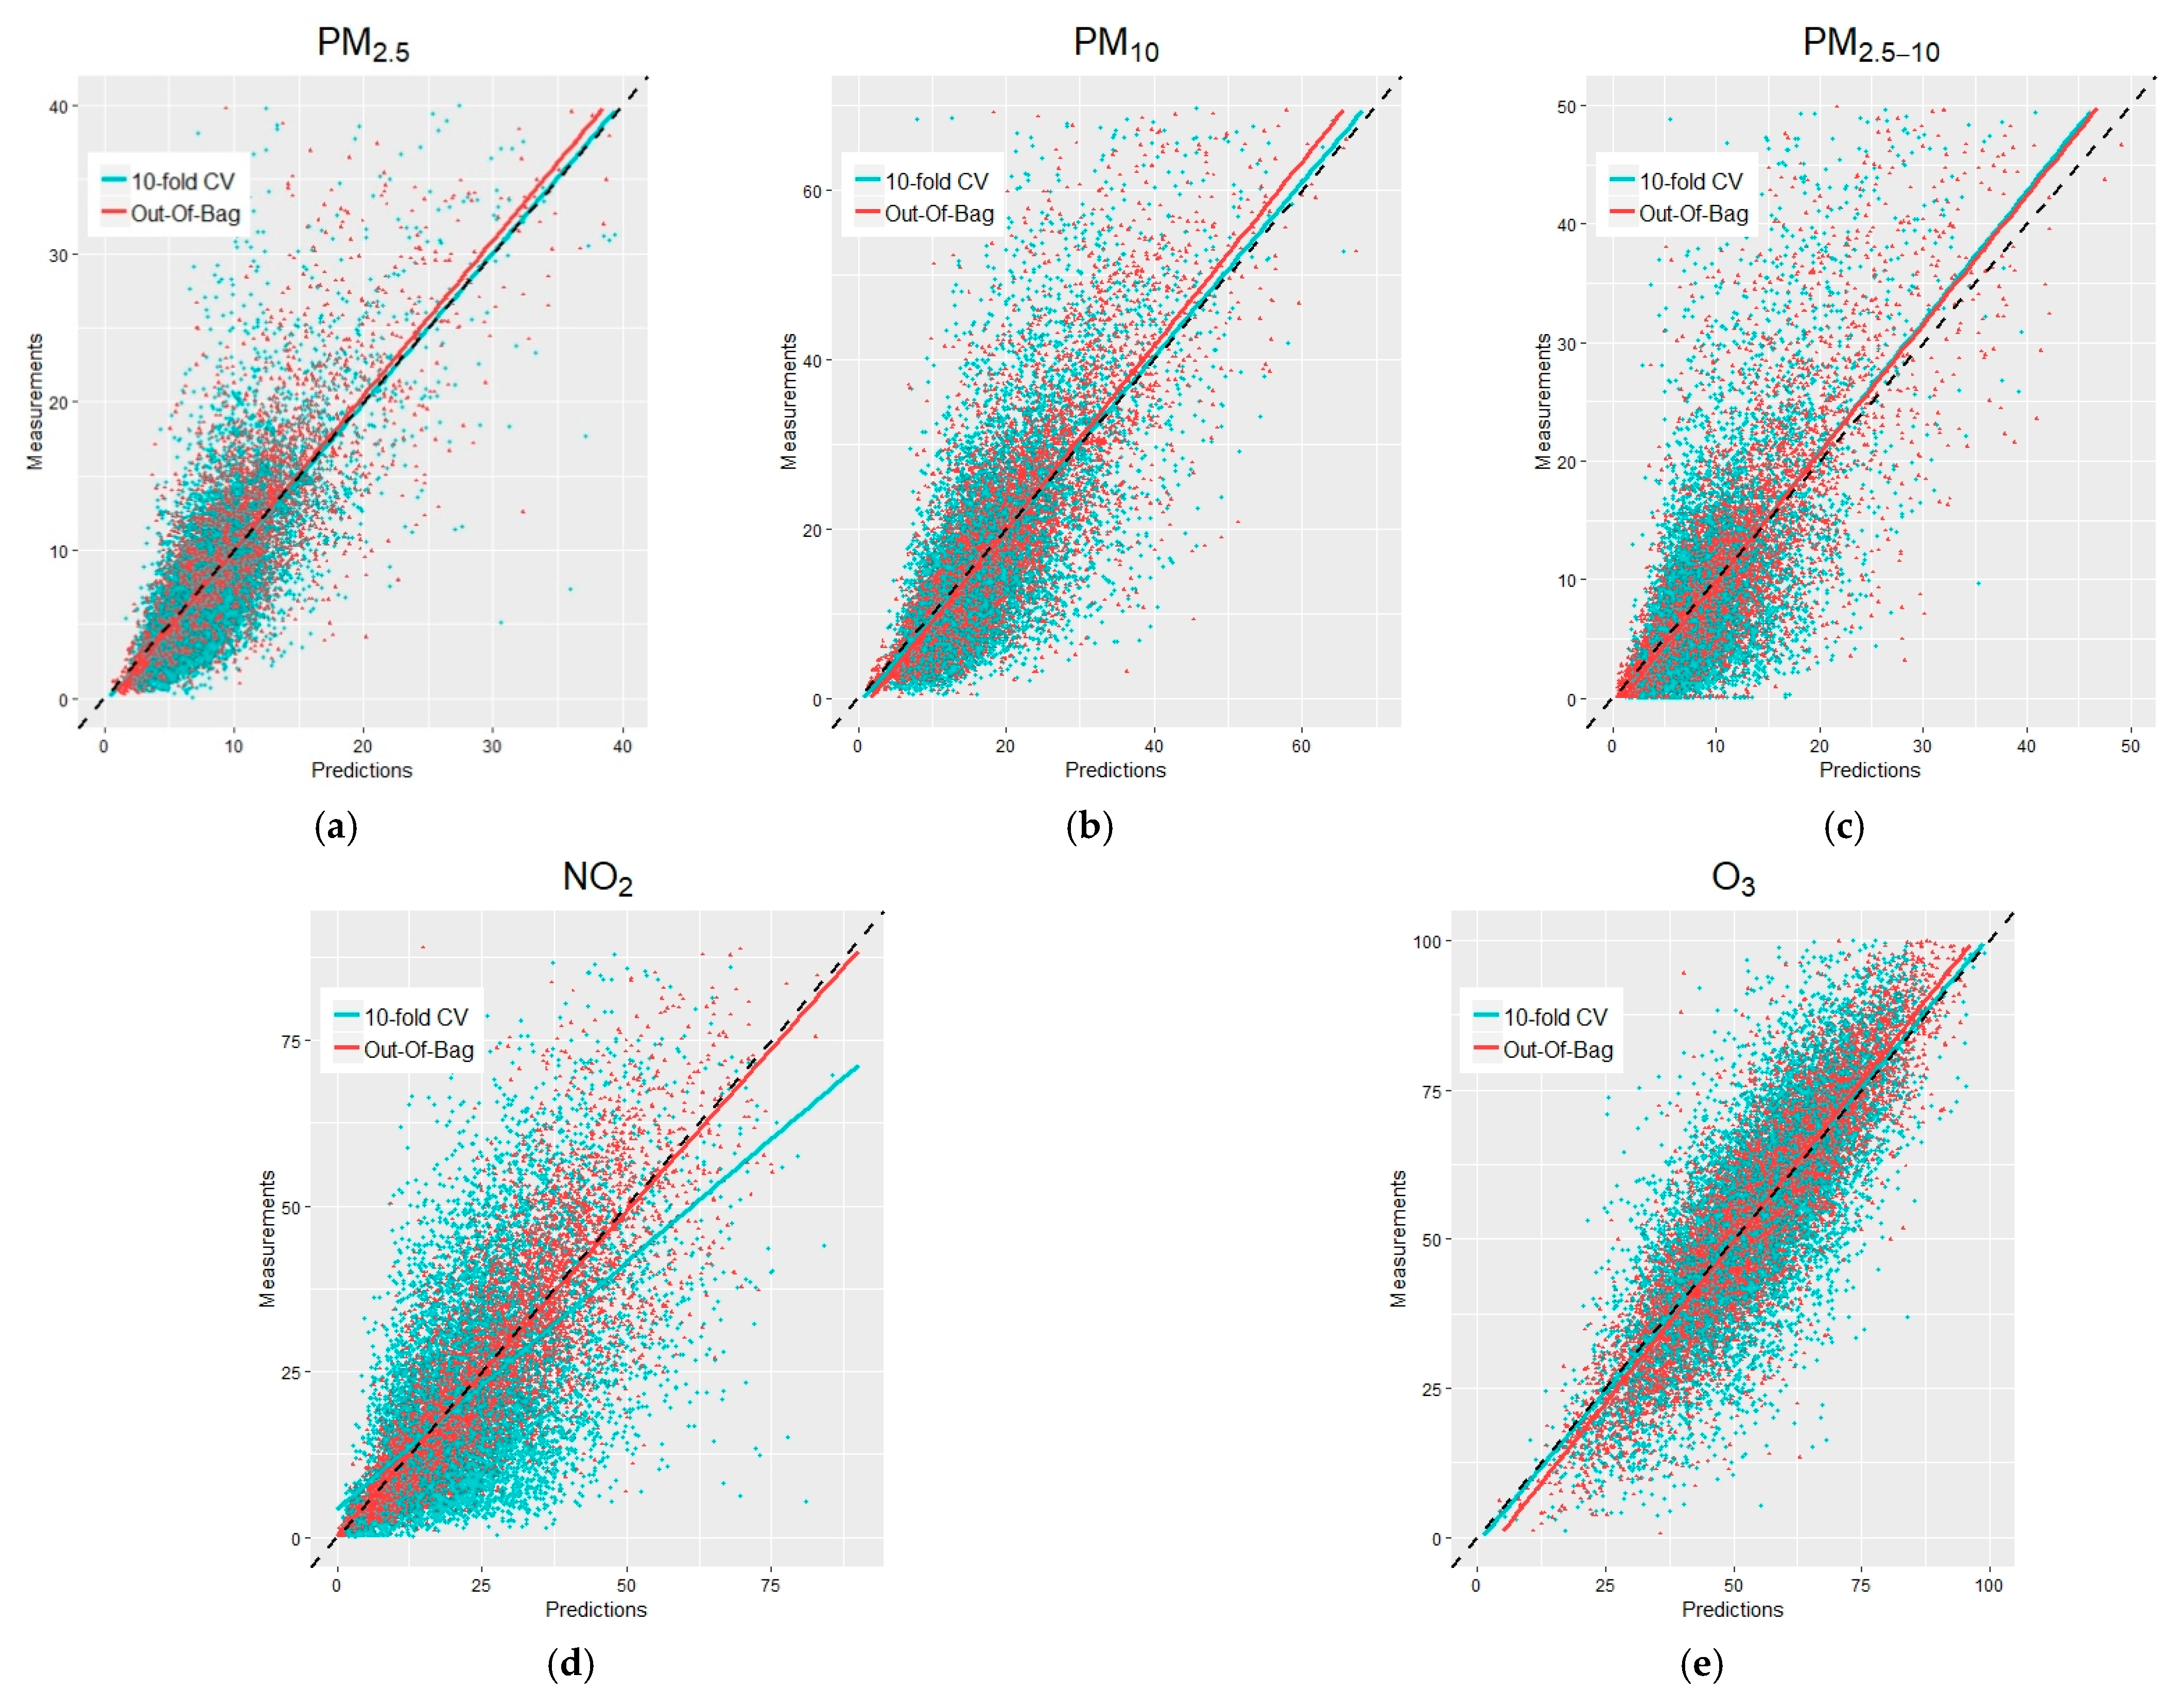
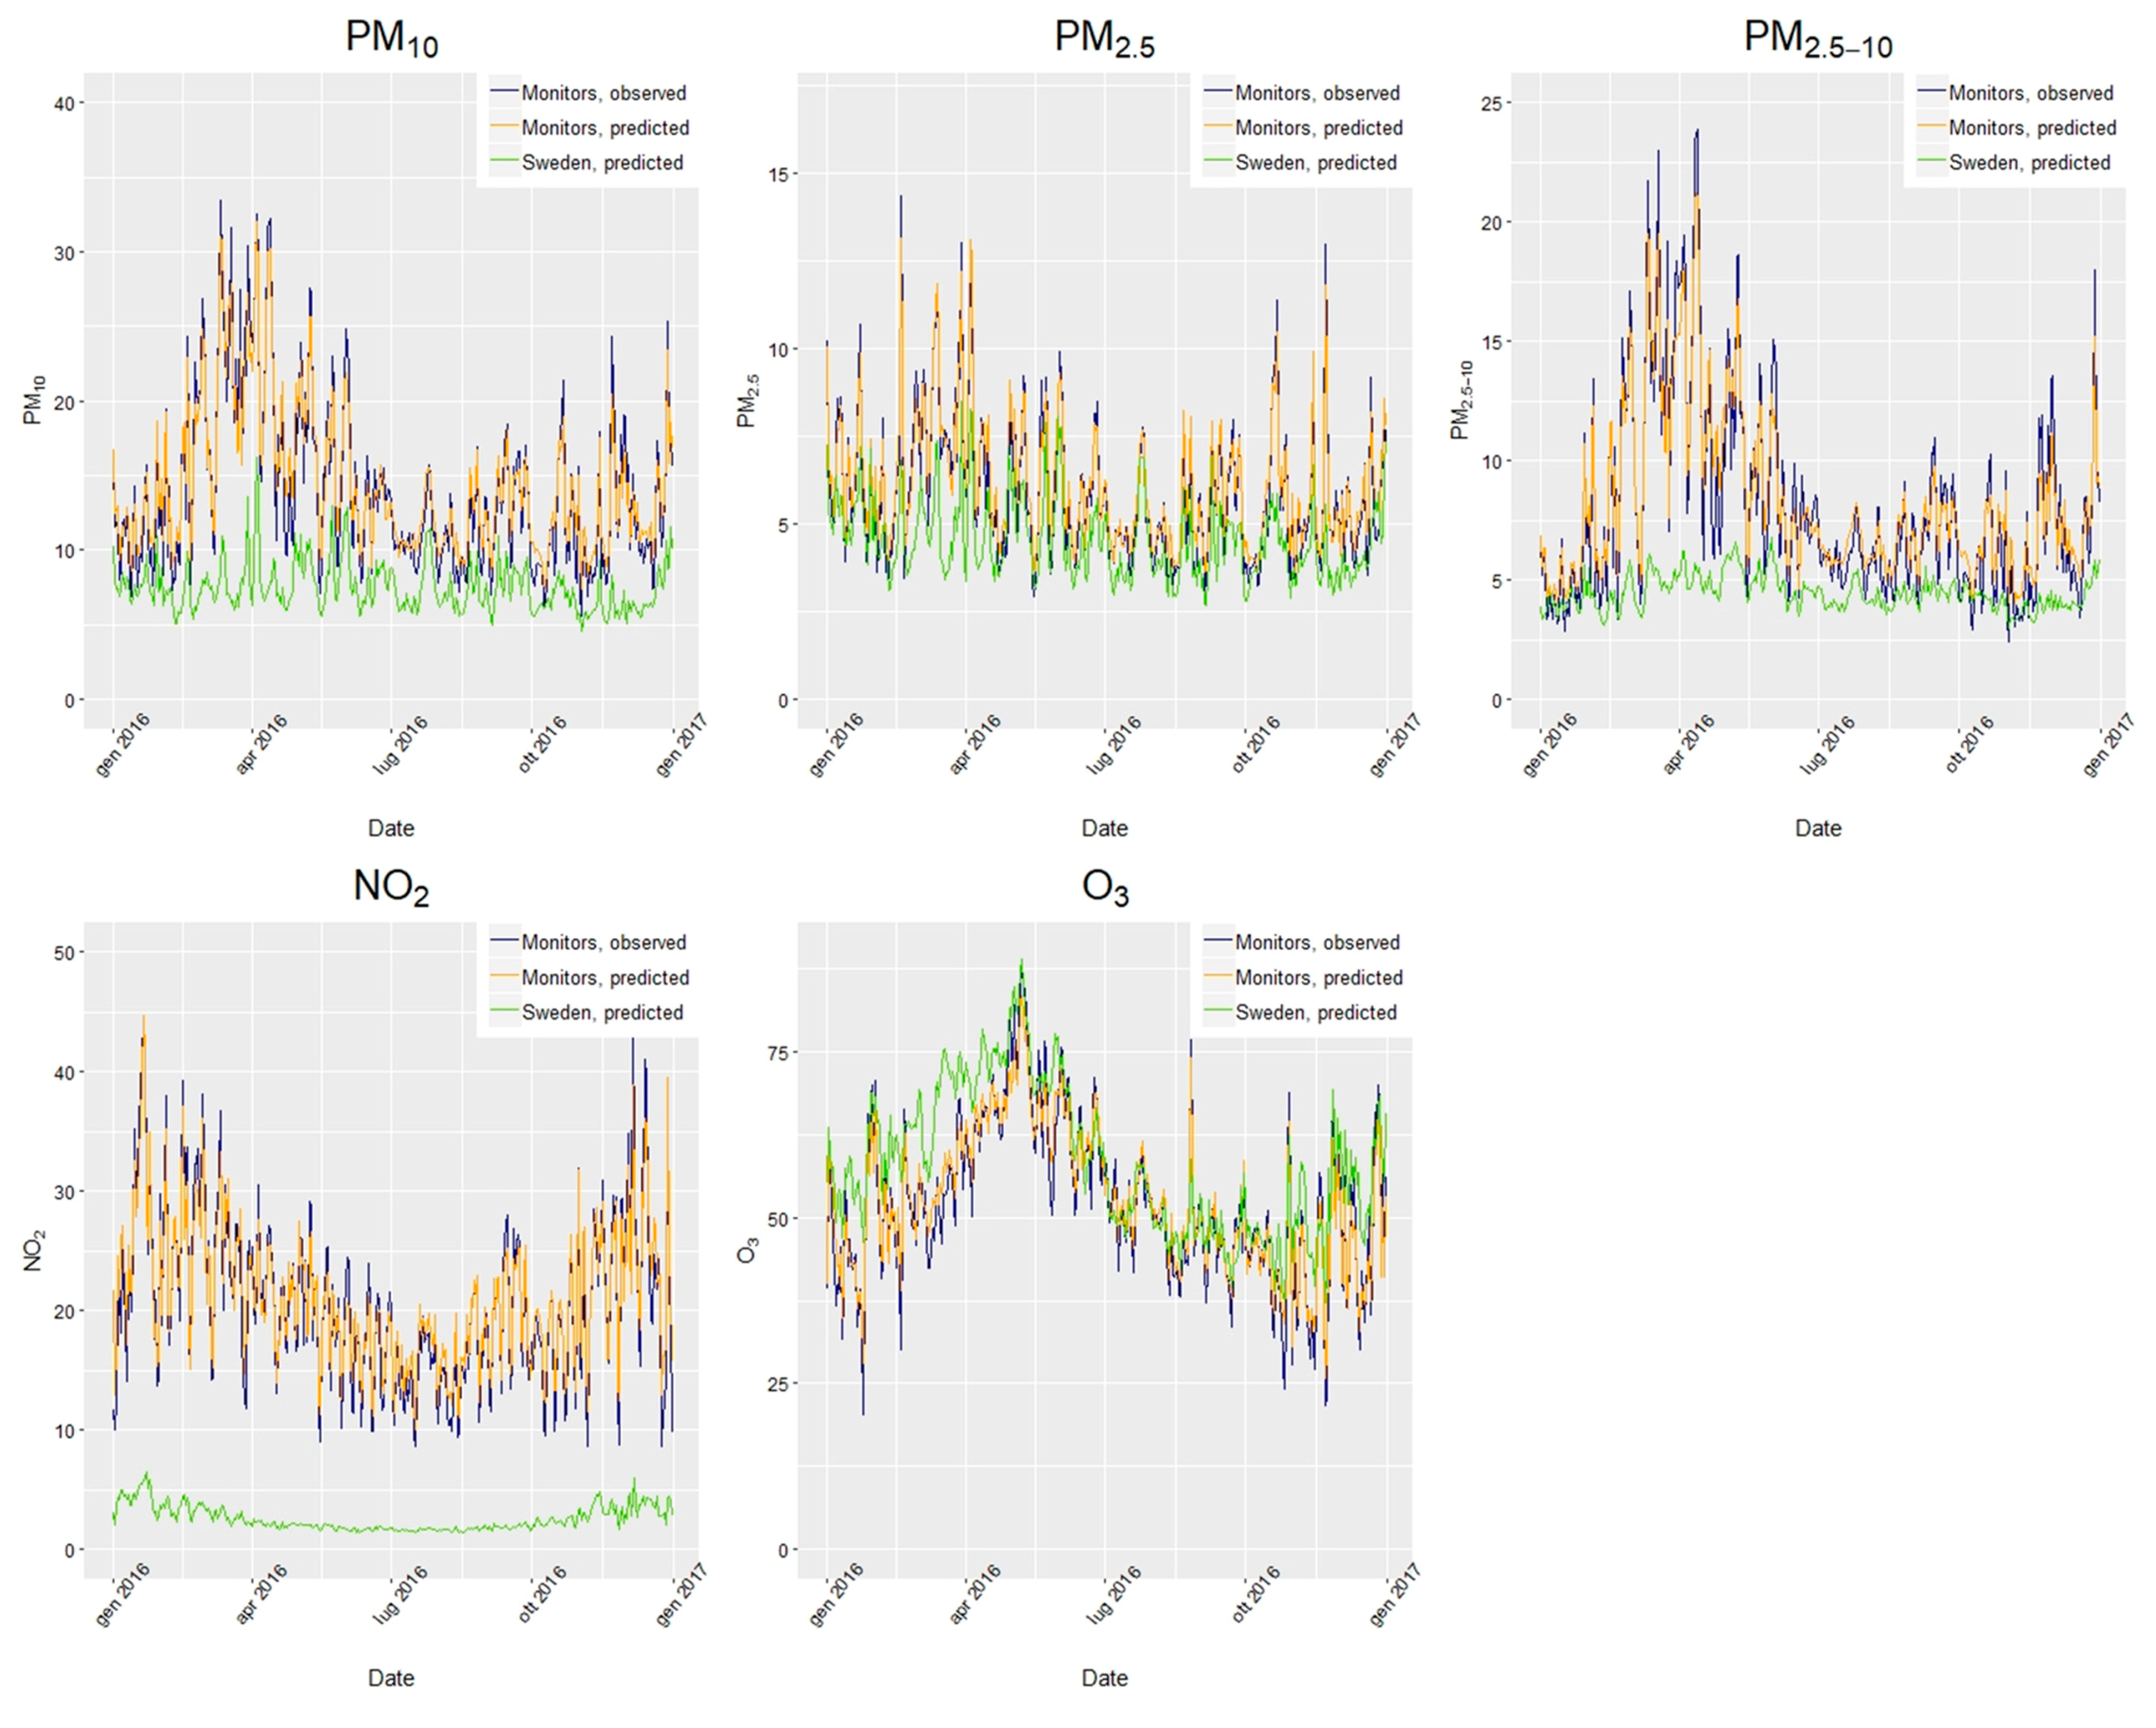
3.2. Stages 1 and 2
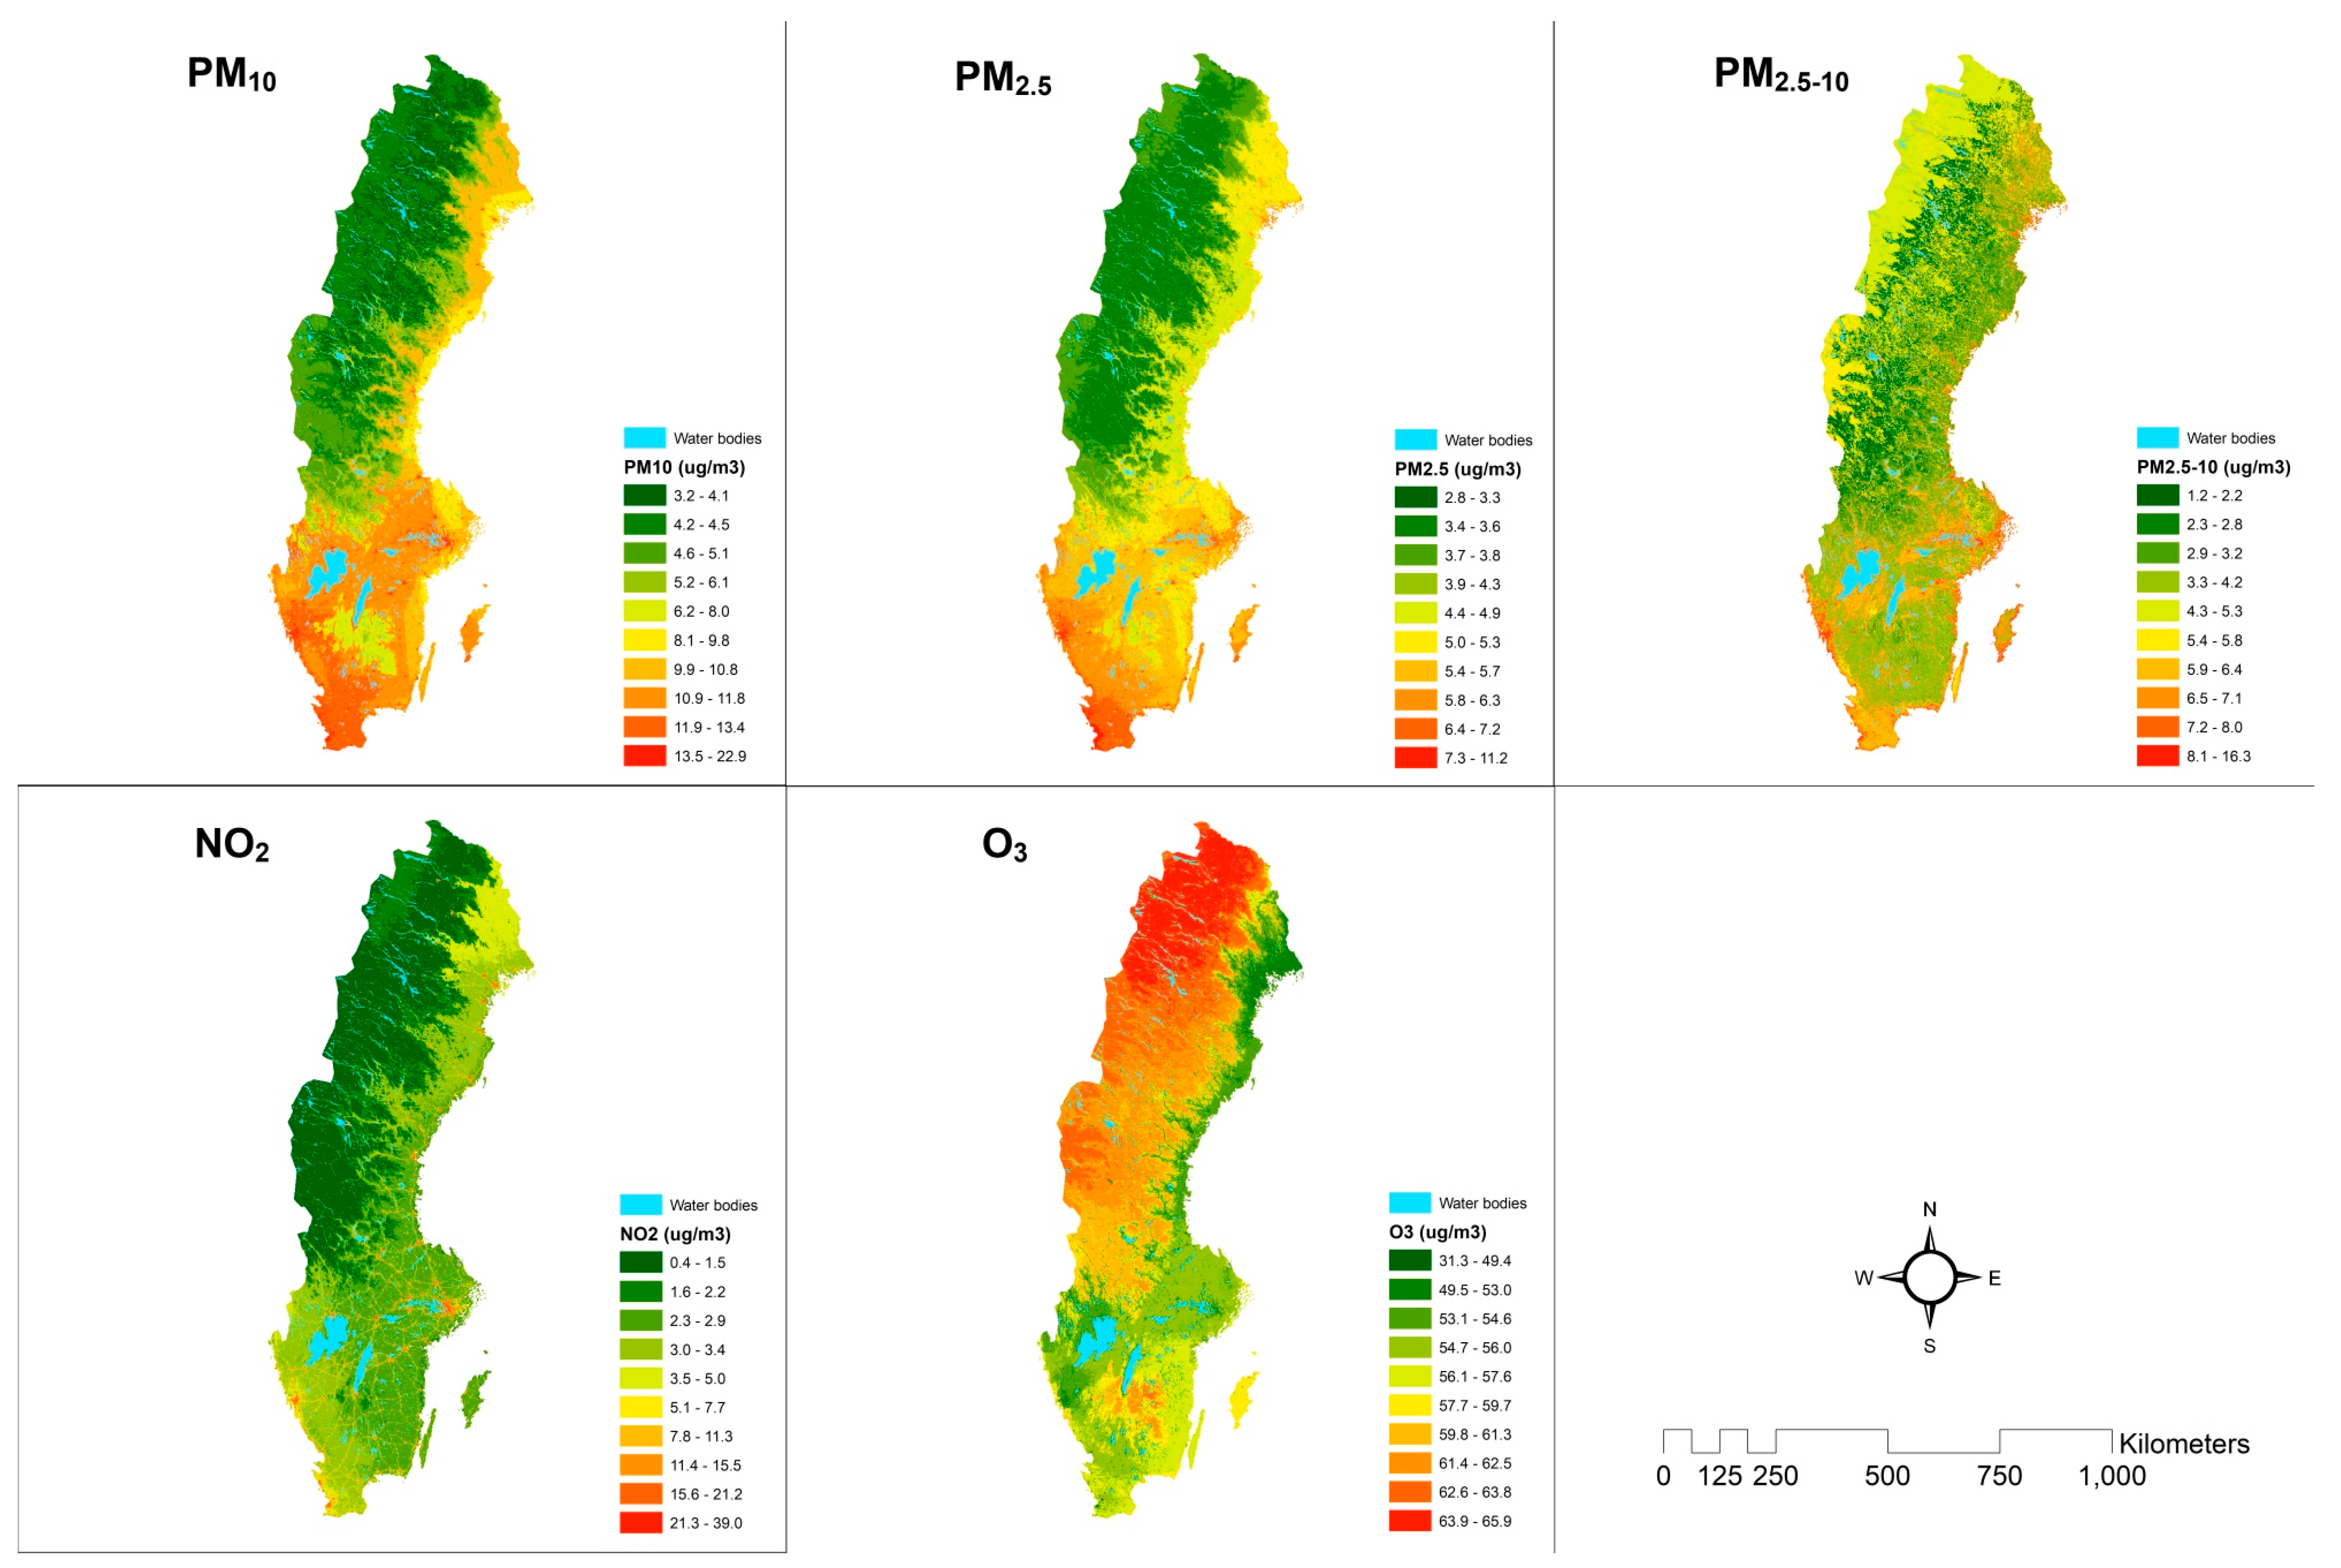
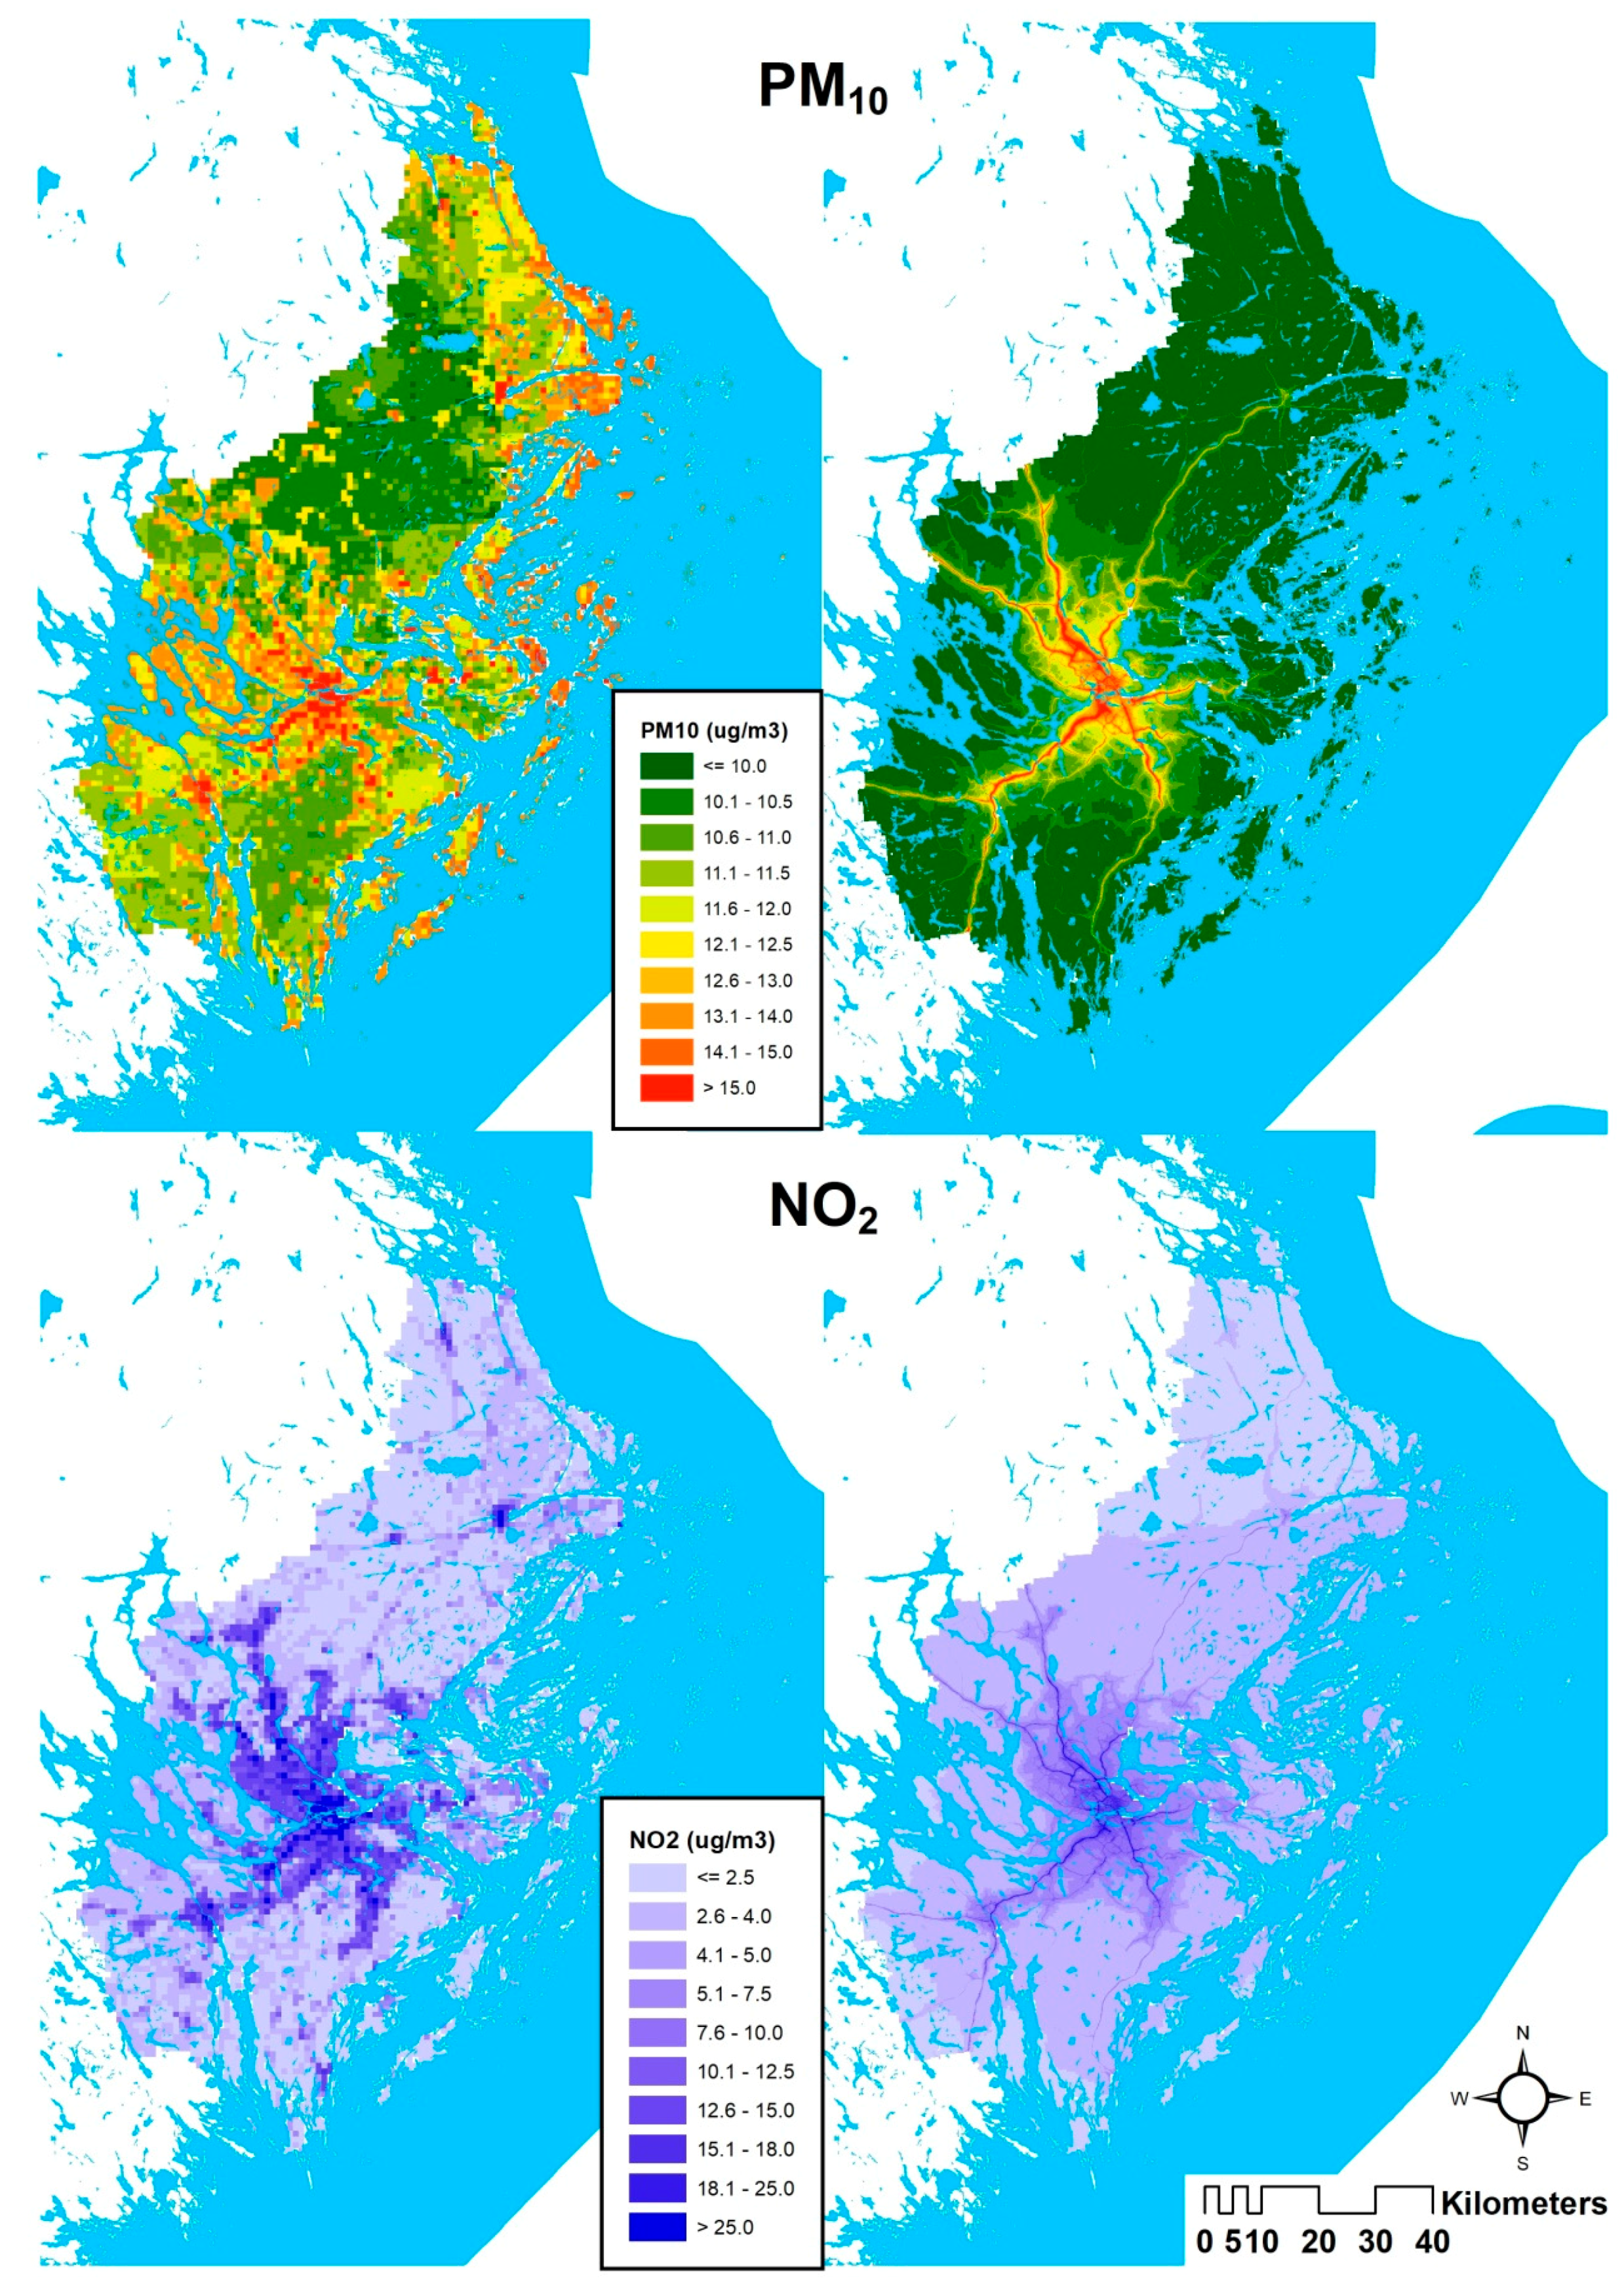
3.3. PM Results
3.4. NO2 Results
3.5. O3 Results
3.6. Comparison with Local Dispersion Models in Stockholm
3.7. Comparison with Previous Studies
3.8. Strengths and Limitations
4. Conclusions
Supplementary Materials
Author Contributions
Funding
Conflicts of Interest
References
- Prüss-Ustün, A.; Wolf, J.; Corvalán, C.; Bos, R.; Neira, M. Preventing Disease through Healthy Environments: A Global Assessment of the Burden of Disease from Environmental Risks; World Health Organization: Geneva, Switzerland, 2016. [Google Scholar]
- Katsouyanni, K.; Touloumi, G.; Spix, C.; Schwartz, J.; Balducci, F.; Medina, S.; Rossi, G.; Wojtyniak, B.; Sunyer, J.; Bacharova, L.; et al. Short-term effects of ambient sulphur dioxide and particulate matter on mortality in 12 European cities: Results from time series data from the APHEA project. Air pollution and health: A European approach. BMJ 1997, 314, 1658–1663. [Google Scholar] [CrossRef] [PubMed]
- Samet, J.M.; Dominici, F.; Curriero, F.C.; Coursac, I.; Zeger, S.L. Fine particulate air pollution and mortality in 20 U.S. cities, 1987–1994. NEJM 2000, 343, 1742–1749. [Google Scholar] [CrossRef] [PubMed]
- Liu, C.; Chen, R.; Sera, F.; Vicedo-Cabrera, A.M.; Guo, Y.; Tong, S.; Coelho, M.S.Z.S.; Saldiva, P.H.N.; Lavigne, E.; Matus, P.; et al. Ambient particulate air pollution and daily mortality in 652 cities. NEJM 2019, 381, 705–715. [Google Scholar] [CrossRef] [PubMed]
- Hoek, G.; Krishnan, R.M.; Beelen, R.; Peters, A.; Ostro, B.; Brunekreef, B.; Kaufman, J.D. Long-term air pollution exposure and cardio- respiratory mortality: A review. Environ. Health 2013, 12, 43. [Google Scholar] [CrossRef] [PubMed]
- Pope, C.A., 3rd; Dockery, D.W. Health effects of fine particulate air pollution: Lines that connect. J. Air Waste Manag. Assoc. 2006, 56, 709–742. [Google Scholar] [CrossRef] [PubMed]
- Atkinson, R.W.; Kang, S.; Anderson, H.R.; Mills, I.C.; Walton, H.A. Epidemiological time series studies of PM2.5 and daily mortality and hospital admissions: A systematic review and meta-analysis. Thorax 2014, 69, 660–665. [Google Scholar] [CrossRef]
- Bravo, M.; Ebisu, K.; Dominici, F.; Wang, Y.; Peng, R.D.; Bell, M. Airborne Fine Particles and Risk of Hospital Admissions for Understudied Populations: Effects by Urbanicity and Short-Term Cumulative Exposures in 708 U.S. Counties. Environ. Health Perspect. 2016, 125, 594–601. [Google Scholar] [CrossRef]
- Matz, C.J.; Stieb, D.M.; Brion, O. Urban-rural differences in daily time-activity patterns, occupational activity, and housing characteristics. Environ. Health 2015, 14, 88. [Google Scholar] [CrossRef]
- Faustini, A.; Rapp, R.; Forastiere, F. Nitrogen dioxide and mortality: Review and meta-analysis of long-term studies. Eur. Respir. J. 2014, 44, 744–753. [Google Scholar] [CrossRef]
- Mills, I.C.; Atkinson, R.W.; Kang, S.; Walton, H.; Anderson, H.R. Quantitative systematic review of the associations between short-term exposure to nitrogen dioxide and mortality and hospital admissions. BMJ Open 2015, 5, e006946. [Google Scholar] [CrossRef]
- De Hoogh, K.; Korek, M.; Vienneau, D.; Keuken, M.; Kukkonen, J.; Nieuwenhuijsen, M.J.; Badaloni, C.; Beelen, R.; Bolignano, A.; Cesaroni, G.; et al. Comparing land use regression and dispersion modelling to assess residential exposure to ambient air pollution for epidemiological studies. Environ. Int. 2014, 73, 382–392. [Google Scholar] [CrossRef] [PubMed]
- Gryparis, A.; Forsberg, B.; Katsouyanni, K.; Analitis, A.; Touloumi, G.; Schwartz, J.; Samoli, E.; Medina, S.; Anderson, H.R.; Niciu, E.M.; et al. Acute effects of ozone on mortality from the “air pollution and health: A European approach” project. Am. J. Respir. Crit. Care Med. 2004, 170, 1080–1087. [Google Scholar] [CrossRef] [PubMed]
- Stafoggia, M.; Faustini, A.; Berti, G.; Accetta, G.; Bisanti, L.; Cernigliaro, A.; Galassi, C.; Mallone, S.; Pacelli, B.; Perucci, C.; et al. Susceptibility Factors to Ozone-Related Mortality-A Population-Based Case-Crossover Analysis. Am. J. Respir. Crit. Care Med. 2010, 182, 376–384. [Google Scholar] [CrossRef] [PubMed]
- Bell, M.L.; McDermott, A.; Zeger, S.L.; Samet, J.M.; Dominici, F. Ozone and short-term mortality in 95 US urban communities, 1987–2000. JAMA 2004, 292, 2372–2378. [Google Scholar] [CrossRef]
- Yin, P.; Chen, R.; Wang, L.; Meng, X.; Liu, C.; Niu, Y.; Lin, Z.; Liu, Y.; Liu, J.; Qi, J.; et al. Ambient ozone pollution and daily mortality: A nationwide study in 272 Chinese Cities. Environ. Health Perspect. 2017, 125, 117006. [Google Scholar] [CrossRef]
- Atkinson, R.W.; Butland, B.K.; Dimitroulopoulou, C.; Heal, M.R.; Stedman, J.R.; Carslaw, N.; Jarvis, D.; Heaviside, C.; Vardoulakis, S.; Walton, H. Long-term exposure to ambient ozone and mortality: A quantitative systematic review and meta-analysis of evidence from cohort studies. BMJ Open 2016, 6, e009493. [Google Scholar] [CrossRef]
- IPCC. Global Warming of 1.5°C. An IPCC Special Report on the Impacts of Global Warming of 1.5°C above Pre-Industrial Levels and Related Global Greenhouse Gas Emission Pathways, in the Context of Strengthening the Global Response to the Threat of Climate Change, Sustainable Development, and Efforts to Eradicate Poverty; Masson-Delmotte, V., Zhai, P., Pörtner, H.O., Roberts, D., Skea, J., Shukla, P.R., Pirani, A., Moufouma-Okia, W., Péan, C., Pidcock, R., et al., Eds.; 9 Intergovernmental Panel on Climate Change, 2019. (In Press). Available online: https://www.ipcc.ch/site/assets/uploads/sites/2/2019/06/SR15_Full_Report_High_Res.pdf (accessed on 28 February 2020).
- Di, Q.; Rowland, S.; Koutrakis, P.; Schwartz, J. A hybrid model for spatially and temporally resolved ozone exposures in the continental United States. J Air Waste Manag. Assoc. 2017, 67, 39–52. [Google Scholar] [CrossRef]
- Stafoggia, M.; Bellander, T.; Bucci, S.; Davoli, M.; De Hoogh, K.; De’ Donato, F.; Gariazzo, C.; Lyapustin, A.; Michelozzi, P.; Renzi, M.; et al. Estimation of daily PM10 and PM2.5 concentrations in Italy, 2013–2015, using a spatiotemporal land-use random-forest model. Environ. Int. 2019, 124, 170–179. [Google Scholar] [CrossRef]
- EMEP. Available online: https://www.emep.int/ (accessed on 28 November 2019).
- Lyapustin, A.; Martonchik, J.; Wang, Y.; Laszlo, I.; Korkin, S. Multiangle implementation of atmospheric correction (MAIAC): 1. Radiative transfer basis and look-up tables. J. Geophys. Res. Atmos. 2011, 116, D03210. [Google Scholar] [CrossRef]
- Lyapustin, A.; Wang, Y.; Laszlo, I.; Kahn, R.; Korkin, S.; Remer, L.; Levy, R.; Reid, J.S. Multiangle implementation of atmospheric correction (MAIAC): 2. Aerosol algorithm. J. Geophys. Res. Atmos. 2011, 116, D03211. [Google Scholar] [CrossRef]
- Stafoggia, M.; Schwartz, J.; Badaloni, C.; Bellander, T.; Alessandrini, E.; Cattani, G.; de’ Donato, F.; Gaeta, A.; Leone, G.; Lyapustin, A.; et al. Estimation of daily PM10 concentrations in Italy (2006–2012) using finely resolved satellite data, land use variables and meteorology. Environ. Int. 2017, 99, 234–244. [Google Scholar] [CrossRef] [PubMed]
- MACC-II Collaborative Group. Final Report MACC-II: Monitoring Atmospheric Composition and Climate—Interim Implementation. 2014. Available online: https://atmosphere.copernicus.eu/sites/default/files/repository/MACCII_FinalReport_0.pdf (accessed on 28 November 2019).
- Dee, D.P.; Uppala, S.M.; Simmons, A.J.; Berrisford, P.; Poli, P.; Kobayashi, S.; Andrae, U.; Balmaseda, M.A.; Balsamo, G.; Bauer, P.; et al. The ERA-interim reanalysis: Configuration and performance of the data assimilation system. Q. J. R. Meteorol. Soc. 2011, 137, 553–597. [Google Scholar] [CrossRef]
- Elvidge, C.D.; Baugh, K.; Zhizhin, M.; Chi Hsu, F.; Ghosg, T. VIIRS night-time lights. Int. J. Remote Sens. 2017, 38, 5860–5879. [Google Scholar] [CrossRef]
- EEA (European Environmental Agency). Corine Land Cover Technical Guide—Addendum 2000; Technical Report No. 40EEA; EEA: Copenhagen, Denmark, 2013. [Google Scholar]
- De Hoogh, K.; Gulliver, J.; Donkelaar, A.V.; Martin, R.V.; Marshall, J.D.; Bechle, M.J.; Cesaroni, G.; Pradas, M.C.; Dedele, A.; Eeftens, M.; et al. Development of West-European PM2.5 and NO2 land use regression models incorporating satellite-derived and chemical transport modelling data. Environ. Res. 2016, 151, 1–10. [Google Scholar] [CrossRef] [PubMed]
- Vienneau, D.; De Hoogh, K.; Bechle, M.J.; Beelen, R.; Van Donkelaar, A.; Martin, R.V.; Millet, D.B.; Hoek, G.; Marshall, J.D. Western European land use regression incorporating satellite- and ground-based measurements of NO2 and PM10. Environ. Sci. Technol. 2013, 47, 13555–13564. [Google Scholar] [CrossRef]
- Breiman, L. Random forests. Mach. Learn. 2001, 45, 5–32. [Google Scholar] [CrossRef]
- Liaw, A.; Wiener, M. Classification and regression by random forest. R News 2002, 2, 18–22. [Google Scholar]
- Segersson, D.; Eneroth, K.; Gidhagen, L.; Johansson, C.; Omstedt, G.; Nylén, A.E.; Forsberg, B. Health Impact of PM10, PM2.5 and Black Carbon Exposure Due to Different Source Sectors in Stockholm, Gothenburg and Umea, Sweden. Int. J. Environ. Res. Public Health 2017, 14, 742. [Google Scholar] [CrossRef]
- Ljungman, P.L.S.; Andersson, N.; Stockfelt, L.; Andersson, E.M.; Nilsson Sommar, J.; Eneroth, K.; Gidhagen, L.; Johansson, C.; Lager, A.; Leander, K.; et al. Long-term exposure to particulate air pollution, black carbon, and their source components in relation to ischemic heart disease and stroke. Environ. Health Perspect. 2019, 127, 107012. [Google Scholar] [CrossRef]
- Nyberg, F.; Gustavsson, P.; Järup, L.; Bellander, T.; Berglind, N.; Jakobsson, R.; Pershagen, G. Urban air pollution and lung cancer in Stockholm. Epidemiology 2000, 11, 487–495. [Google Scholar] [CrossRef]
- Rosenlund, M.; Berglind, N.; Hallqvist, J.; Jonsson, T.; Pershagen, G.; Bellander, T. Long-term exposure to urban air pollution and myocardial infarction. Epidemiology 2006, 17, 383–390. [Google Scholar] [CrossRef]
- Johansson, C.; Burman, L.; Forsberg, B. The effects of congestions tax on air quality and health. Atmos. Environ. 2009, 43, 4843–4854. [Google Scholar] [CrossRef]
- Johansson, C.; Löverheim, B.; Schantz, P.; Wahlgren, L.; Almström, P.; Markstedt, A.; Strömgren, M.; Forsberg, B.; Nilsson Sommar, J. Impacts on air pollution and health by changing commuting from car to bicycle. Sci. Total Environ. 2017, 584–585, 55–63. [Google Scholar] [CrossRef]
- Wang, J.; Christopher, S.A. Intercomparison between satellite-derived aerosol optical thickness and PM2.5 mass: Implications for air quality studies. Geophys. Res. Lett. 2003, 30, 4.1–4.4. [Google Scholar] [CrossRef]
- Engel-Cox, J.A.; Holloman, C.H.; Coutant, B.W.; Hoff, R.M. Qualitative and quantitative evaluation of MODIS satellite sensor data for regional and urban scale air quality. Atmos. Environ. 2004, 38, 2495–2509. [Google Scholar] [CrossRef]
- Koelemeijer, R.; Homan, C.; Matthijsen, J. Comparison of spatial and temporal variations of aerosol optical thickness and particulate matter over Europe. Atmos. Environ. 2006, 40, 5304–5315. [Google Scholar] [CrossRef]
- Kloog, I.; Koutrakis, P.; Coull, B.A.; Lee, H.J.; Schwartz, J. Assessing temporally and spatially resolved PM2.5 exposures for epidemiological studies using satellite aerosol optical depth measurements. Atmos. Environ. 2011, 45, 6267–6275. [Google Scholar] [CrossRef]
- Kloog, I.; Chudnovsky, A.A.; Just, A.C.; Nordio, F.; Koutrakis, P.; Coull, B.A.; Lyapustin, A.; Wang, Y.; Schwartz, J. A new hybrid spatio-temporal model for estimating daily multi-year PM 2.5 concentrations across northeastern USA using high resolution aerosol optical depth data. Atmos. Environ. 2014, 95, 581–590. [Google Scholar] [CrossRef]
- Kloog, I.; Sorek-Hamer, M.; Lyapustin, A.; Coull, B.; Wang, Y.; Just, A.C.; Schwartz, J.; Broday, D.M. Estimating daily PM2. 5 and PM10 across the complex geoclimate region of Israel using MAIAC satellite-based AOD data. Atmos. Environ. 2015, 122, 409–416. [Google Scholar] [CrossRef] [PubMed]
- de Hoogh, K.; Héritier, H.; Stafoggia, M.; Künzli, N.; Kloog, I. Modelling daily PM2.5 concentrations at high spatio-temporal resolution across Switzerland. Environ. Pollut. 2018, 233, 1147–1154. [Google Scholar] [CrossRef] [PubMed]
- Chen, Z.H.; Zhang, T.H.; Zhang, R.; Zhu, Z.M.; Yang, J.; Chen, P.Y.; Ou, C.Q.; Guo, Y. Extreme gradient boosting model to estimate PM2.5 concentrations with missing-filled satellite data in China. Atmos. Environ. 2019, 202, 180–189. [Google Scholar] [CrossRef]
- Di, Q.; Kloog, I.; Koutrakis, P.; Lyapustin, A.; Wang, Y.; Schwartz, J. Assessing PM2.5 exposures with high spatiotemporal resolution across the continental United States. Environ. Sci. Technol. 2016, 50, 4712–4721. [Google Scholar] [CrossRef]
- Di, Q.; Amini, H.; Shi, L.; Kloog, I.; Silvern, S.; Kelly, J.; Benjamin Sabath, M.; Choirat, C.; Koutrakis, P.; Lyapustin, A.; et al. An ensemble-based model of PM2.5 concentration across the contiguous United States with high spatiotemporal resolution. Environ. Int. 2019, 130, 104909. [Google Scholar] [CrossRef]
- Shtein, A.; Kloog, I.; Schwartz, J.; Silibello, C.; Michelozzi, P.; Gariazzo, C.; Viegi, G.; Forastiere, F.; Karnieli, A.; Just, A.C.; et al. Estimating daily PM2.5 and PM10 over Italy using an ensemble model. Environ. Sci. Technol. 2019. [Google Scholar] [CrossRef]
- De Hoogh, K.; Saucy, A.; Shtein, A.; Schwartz, J.; West, E.A.; Strassmann, A.; Puhan, M.; Röösli, M.; Stafoggia, M.; Kloog, I. Predicting fine-scale daily NO2 for 2005–2016 incorporating OMI satellite data across Switzerland. Environ. Sci. Technol. 2019, 53, 10279–10287. [Google Scholar] [CrossRef]
- Gidhagen, L.; Omstedt, G.; Pershagen, G.; Willers, S.; Bellander, T. High-resolution modeling of residential outdoor particulate levels in Sweden. J. Expo. Sci. Environ. Epidemiol. 2013, 23, 306–314. [Google Scholar] [CrossRef]
- Korek, M.; Johansson, C.; Svensson, N.; Lind, T.; Beelen, R.; Hoek, G.; Pershagen, G.; Bellander, T. Can dispersion modeling of air pollution be improved by land-use regression? An example from Stockholm, Sweden. J. Expo. Sci. Environ. Epidemiol. 2017, 27, 575–581. [Google Scholar] [CrossRef]


| Year | PM10 | PM2.5 | NO2 | O3 | ||||||||
|---|---|---|---|---|---|---|---|---|---|---|---|---|
| No. of Stations | Median | 25th–75th Percentiles | No. of Stations | Median | 25th–75th Percentiles | No. of Stations | Median | 25th–75th Percentiles | No. of Stations | Median | 25th–75th Percentiles | |
| 2005 | 61 | 15.6 | 9.9–24.2 | 7 | 10.3 | 7.8–14.4 | 60 | 15.4 | 7.9–27.2 | 23 | 56.9 | 43.6–70.4 |
| 2006 | 72 | 16.8 | 11.1–25.4 | 17 | 10.5 | 7.4–15.1 | 67 | 17.2 | 8.7–29.9 | 29 | 58.9 | 45.4–71.5 |
| 2007 | 64 | 15.6 | 10.1–24.0 | 18 | 8.1 | 5.6–11.3 | 55 | 15.2 | 7.9–27.9 | 29 | 55.1 | 43.7–66.5 |
| 2008 | 58 | 15.3 | 9.7–23.1 | 17 | 7.9 | 5.3–11.3 | 60 | 16.3 | 8.4–28.3 | 24 | 54.6 | 41.3–68.0 |
| 2009 | 54 | 14.3 | 9.2–21.3 | 25 | 6.2 | 4.0–9.5 | 58 | 16.5 | 8.7–28.2 | 26 | 53.9 | 42.1–65.8 |
| 2010 | 61 | 13.4 | 8.6–20.2 | 24 | 6.0 | 3.8–9.5 | 58 | 19.1 | 8.8–33.2 | 26 | 55.6 | 43.0–66.9 |
| 2011 | 59 | 15.0 | 9.6–23.2 | 25 | 6.0 | 3.7–9.9 | 58 | 18.1 | 8.3–31.0 | 27 | 57.0 | 43.2–70.2 |
| 2012 | 60 | 12.7 | 8.4–19.4 | 24 | 5.0 | 3.1–8.1 | 60 | 18.1 | 9.0–30.0 | 22 | 51.7 | 39.3–64.8 |
| 2013 | 66 | 13.4 | 8.5–20.4 | 21 | 5.0 | 3.1–7.6 | 58 | 18.3 | 9.6–31.2 | 30 | 55.3 | 43.8–67.9 |
| 2014 | 63 | 13.7 | 8.7–20.8 | 28 | 5.8 | 3.6–9.1 | 50 | 17.2 | 8.8–28.9 | 30 | 54.2 | 42.0–65.2 |
| 2015 | 55 | 12.0 | 8.0–18.1 | 27 | 4.7 | 3.1–7.0 | 45 | 16.6 | 7.8–29.0 | 30 | 55.9 | 44.7–66.0 |
| 2016 | 62 | 11.4 | 7.4–17.6 | 29 | 4.5 | 2.8–7.1 | 53 | 17.5 | 8.6–29.5 | 30 | 52.4 | 40.7–63.6 |
| 2005–2016 | 172 | 13.9 | 8.9–21.3 | 59 | 6.0 | 3.7–9.5 | 141 | 17.1 | 8.5–29.6 | 45 | 55.1 | 42.7–67.2 |
| Predictor | PM10 | PM2.5 | PM2.5-10 | NO2 | O3 | |||||
|---|---|---|---|---|---|---|---|---|---|---|
| ρ | Importance (Rank) | ρ | Importance (Rank) | ρ | Importance (Rank) | ρ | Importance (Rank) | ρ | Importance (Rank) | |
| Spatiotemporal | ||||||||||
| AOD | 0.05 | 14 | 0.13 | 15 | −0.01 | 13 | −0.05 | - | 0.15 | - |
| atmospheric composition var. | 0.35 | 1 | 0.44 | 1 | 0.21 | 4 | 0.12 | 12 | 0.35 | 3 |
| PBL (at midnight) | −0.14 | 8 | −0.14 | 13 | −0.10 | 9 | −0.21 | 6 | 0.09 | 2 |
| PBL (at midday) | 0.06 | 11 | −0.08 | 4 | 0.14 | 10 | −0.13 | 4 | 0.35 | 1 |
| wind U component | −0.02 | 15 | −0.09 | 7 | 0.03 | 15 | −0.02 | 7 | 0.05 | 5 |
| wind V component | 0.09 | 9 | 0.16 | 2 | 0.03 | 14 | 0.00 | 8 | −0.01 | 7 |
| air temperature | 0.02 | 17 | −0.01 | 14 | 0.04 | 17 | −0.13 | 16 | 0.12 | 4 |
| dew point temperature | −0.04 | 16 | −0.01 | 11 | −0.06 | 11 | −0.13 | 13 | −0.02 | 10 |
| cloud coverage | −0.17 | 3 | −0.04 | 9 | −0.20 | 2 | −0.06 | 18 | −0.21 | 13 |
| barometric pressure | 0.18 | 4 | 0.18 | 3 | 0.14 | 7 | 0.10 | 20 | −0.02 | 16 |
| snow albedo | 0.00 | 19 | 0.01 | 18 | −0.02 | 16 | −0.11 | - | −0.06 | - |
| NDVI | −0.13 | 10 | -0.11 | 8 | −0.12 | 5 | −0.31 | 15 | 0.07 | 11 |
| Spatial | ||||||||||
| resident population | 0.17 | 5 | −0.01 | - | 0.24 | 1 | 0.34 | 3 | −0.15 | 12 |
| ISA | 0.17 | 2 | 0.16 | 6 | 0.14 | 3 | 0.27 | 5 | −0.16 | - |
| LAN | 0.08 | 13 | −0.02 | 12 | 0.13 | 8 | 0.27 | 1 | −0.11 | 14 |
| elevation | −0.18 | 7 | −0.16 | 5 | −0.15 | 12 | −0.23 | 9 | 0.14 | 8 |
| all roads length | 0.17 | 6 | 0.10 | 10 | 0.18 | 6 | 0.44 | 2 | −0.16 | 15 |
| major roads length | 0.04 | - | 0.03 | - | 0.04 | - | 0.17 | 14 | −0.07 | - |
| % arable land | −0.05 | - | 0.01 | - | −0.07 | - | −0.14 | - | 0.01 | - |
| % deciduous | −0.04 | - | 0.01 | - | −0.07 | - | −0.18 | - | 0.05 | - |
| % evergreen | −0.17 | - | −0.12 | - | −0.16 | 21 | −0.29 | - | 0.15 | - |
| % forest | −0.09 | - | −0.08 | - | −0.08 | - | −0.17 | - | 0.06 | - |
| % industry | 0.02 | - | 0.02 | 17 | 0.01 | 19 | −0.03 | 17 | −0.01 | - |
| % pasture | 0.04 | - | 0.04 | - | 0.03 | - | −0.15 | - | 0.04 | - |
| % shrub | −0.12 | - | −0.11 | - | −0.09 | - | −0.19 | - | 0.05 | - |
| % urban area | 0.12 | 18 | 0.07 | 16 | 0.13 | 20 | 0.32 | 11 | −0.18 | 6 |
| % urban green | −0.10 | - | −0.09 | - | −0.09 | 18 | -0.15 | 19 | −0.03 | - |
| % water | 0.08 | 20 | 0.00 | - | 0.13 | 22 | 0.18 | 10 | −0.13 | 9 |
© 2020 by the authors. Licensee MDPI, Basel, Switzerland. This article is an open access article distributed under the terms and conditions of the Creative Commons Attribution (CC BY) license (http://creativecommons.org/licenses/by/4.0/).
Share and Cite
Stafoggia, M.; Johansson, C.; Glantz, P.; Renzi, M.; Shtein, A.; de Hoogh, K.; Kloog, I.; Davoli, M.; Michelozzi, P.; Bellander, T. A Random Forest Approach to Estimate Daily Particulate Matter, Nitrogen Dioxide, and Ozone at Fine Spatial Resolution in Sweden. Atmosphere 2020, 11, 239. https://doi.org/10.3390/atmos11030239
Stafoggia M, Johansson C, Glantz P, Renzi M, Shtein A, de Hoogh K, Kloog I, Davoli M, Michelozzi P, Bellander T. A Random Forest Approach to Estimate Daily Particulate Matter, Nitrogen Dioxide, and Ozone at Fine Spatial Resolution in Sweden. Atmosphere. 2020; 11(3):239. https://doi.org/10.3390/atmos11030239
Chicago/Turabian StyleStafoggia, Massimo, Christer Johansson, Paul Glantz, Matteo Renzi, Alexandra Shtein, Kees de Hoogh, Itai Kloog, Marina Davoli, Paola Michelozzi, and Tom Bellander. 2020. "A Random Forest Approach to Estimate Daily Particulate Matter, Nitrogen Dioxide, and Ozone at Fine Spatial Resolution in Sweden" Atmosphere 11, no. 3: 239. https://doi.org/10.3390/atmos11030239
APA StyleStafoggia, M., Johansson, C., Glantz, P., Renzi, M., Shtein, A., de Hoogh, K., Kloog, I., Davoli, M., Michelozzi, P., & Bellander, T. (2020). A Random Forest Approach to Estimate Daily Particulate Matter, Nitrogen Dioxide, and Ozone at Fine Spatial Resolution in Sweden. Atmosphere, 11(3), 239. https://doi.org/10.3390/atmos11030239