Regulated and Non-Regulated Emissions from Euro 6 Diesel, Gasoline and CNG Vehicles under Real-World Driving Conditions


Abstract
1. Introduction
2. Experiments
3. Results and Discussion
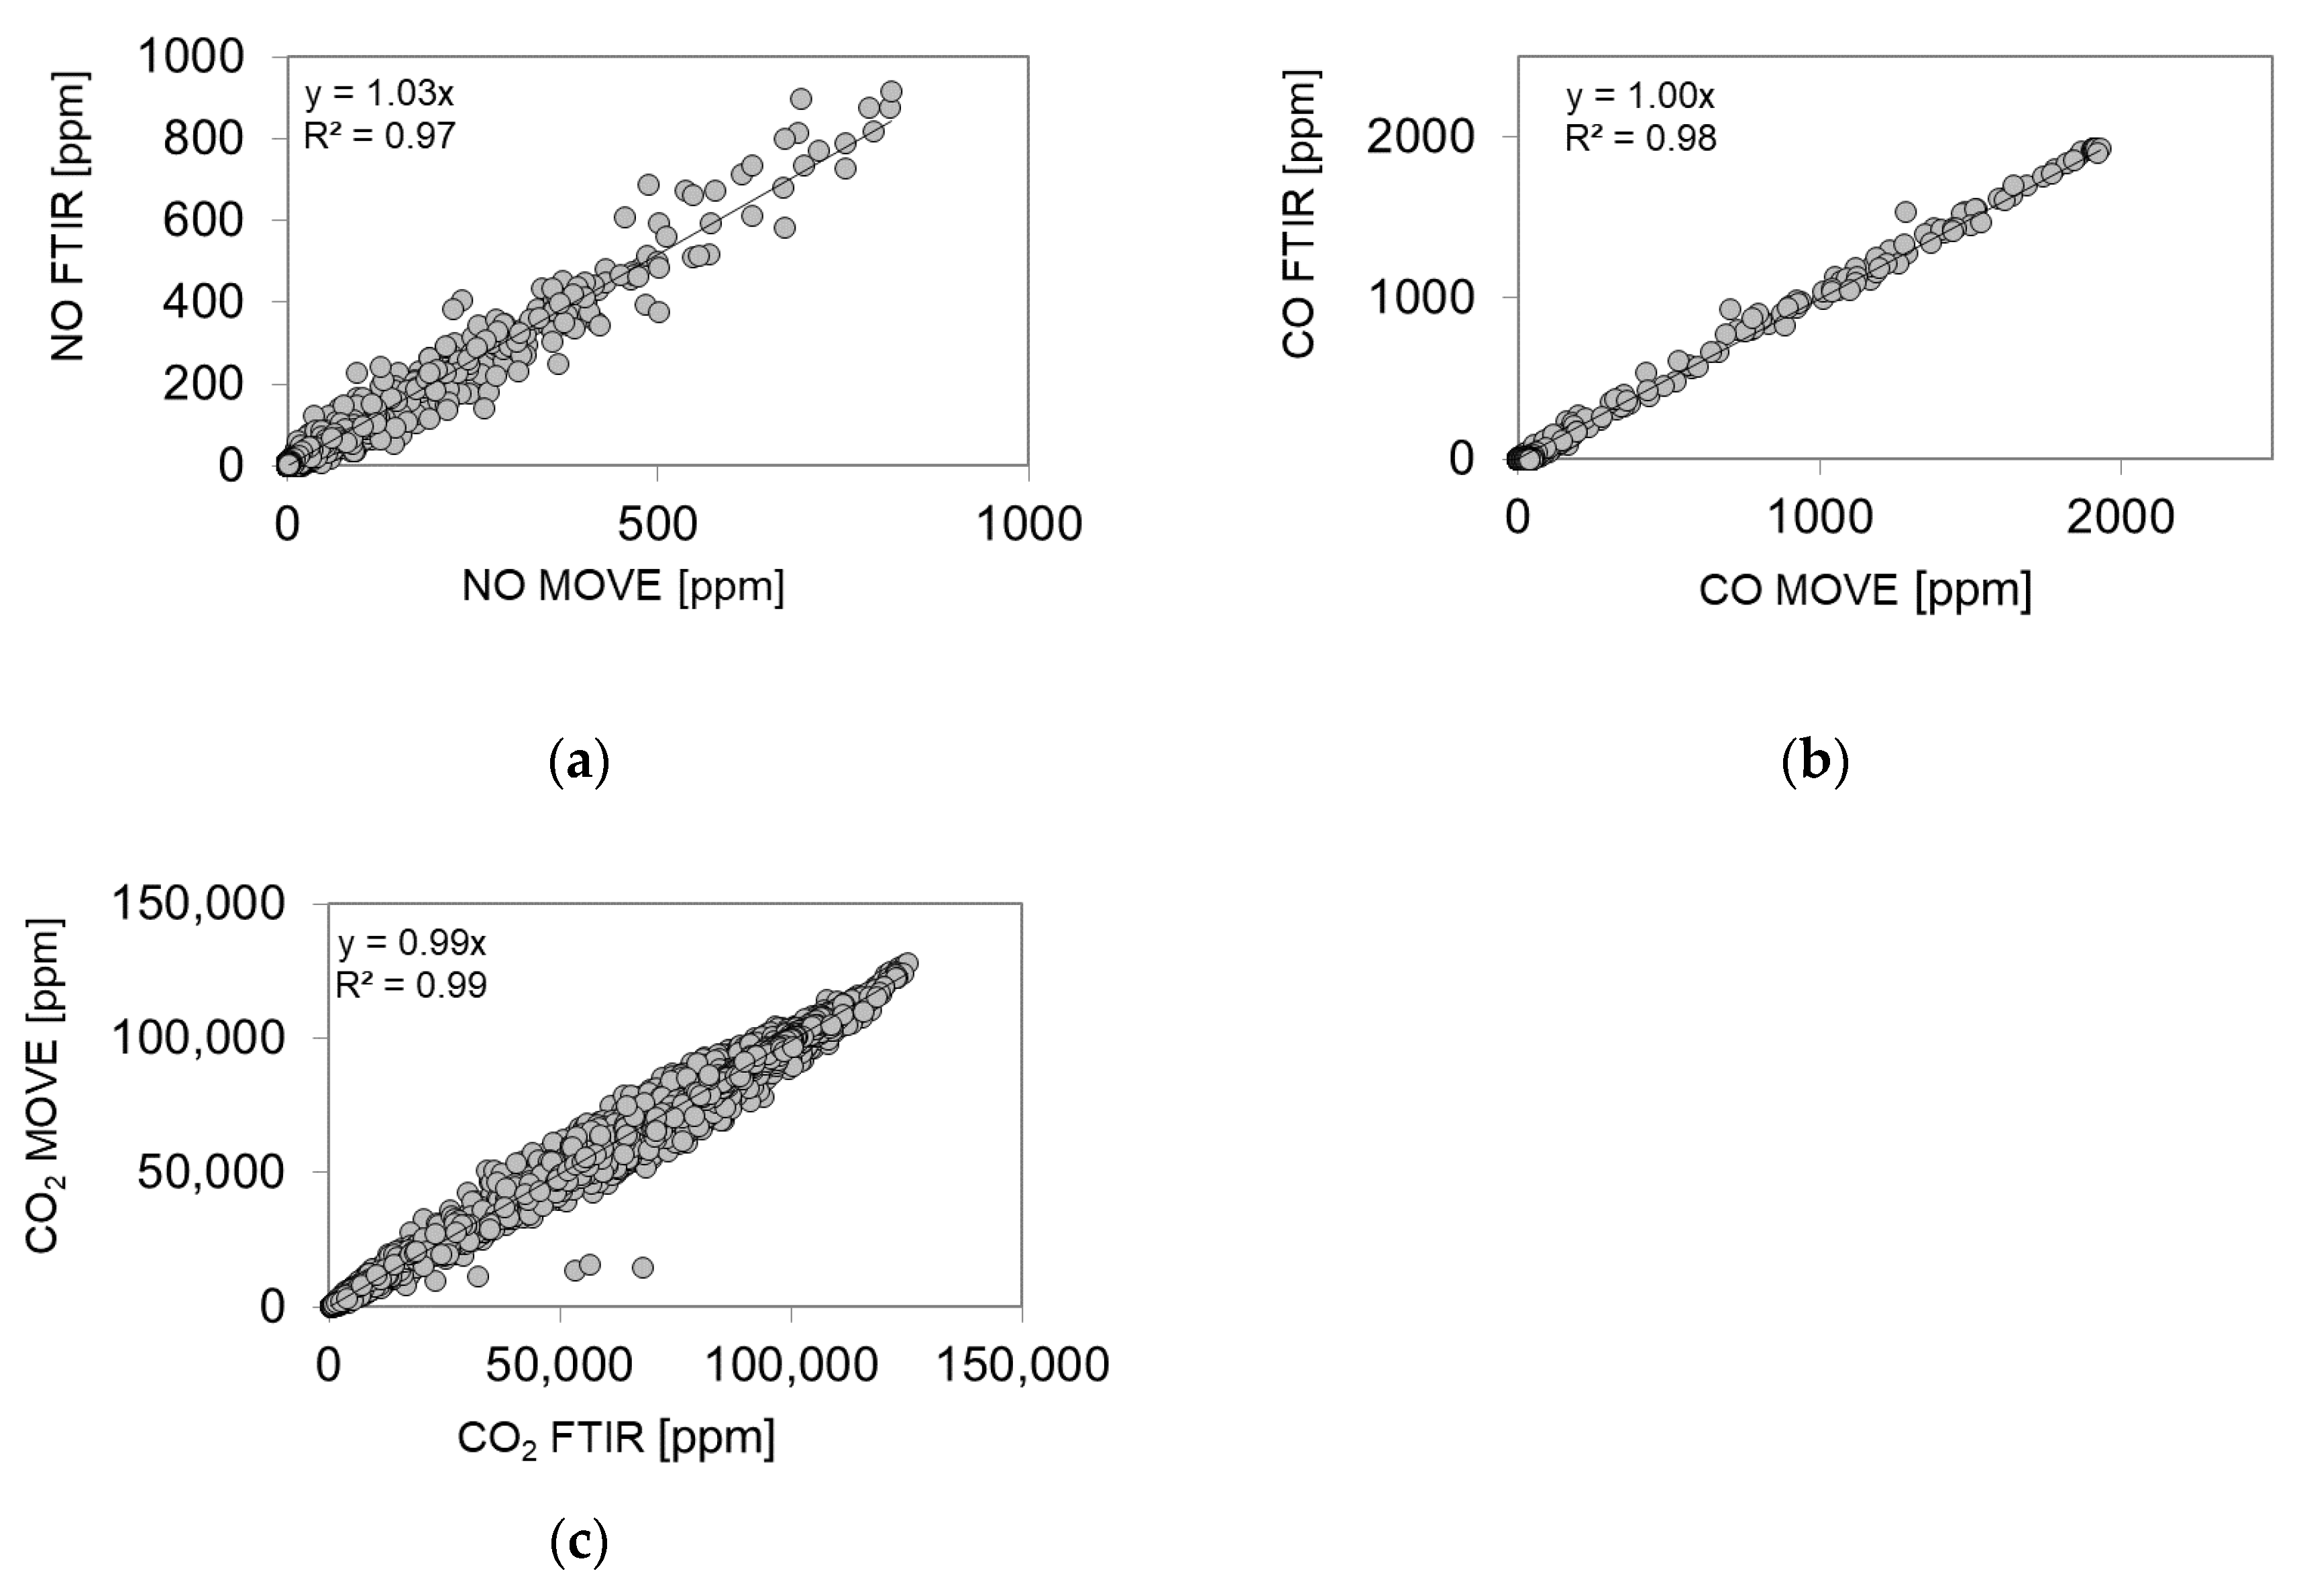
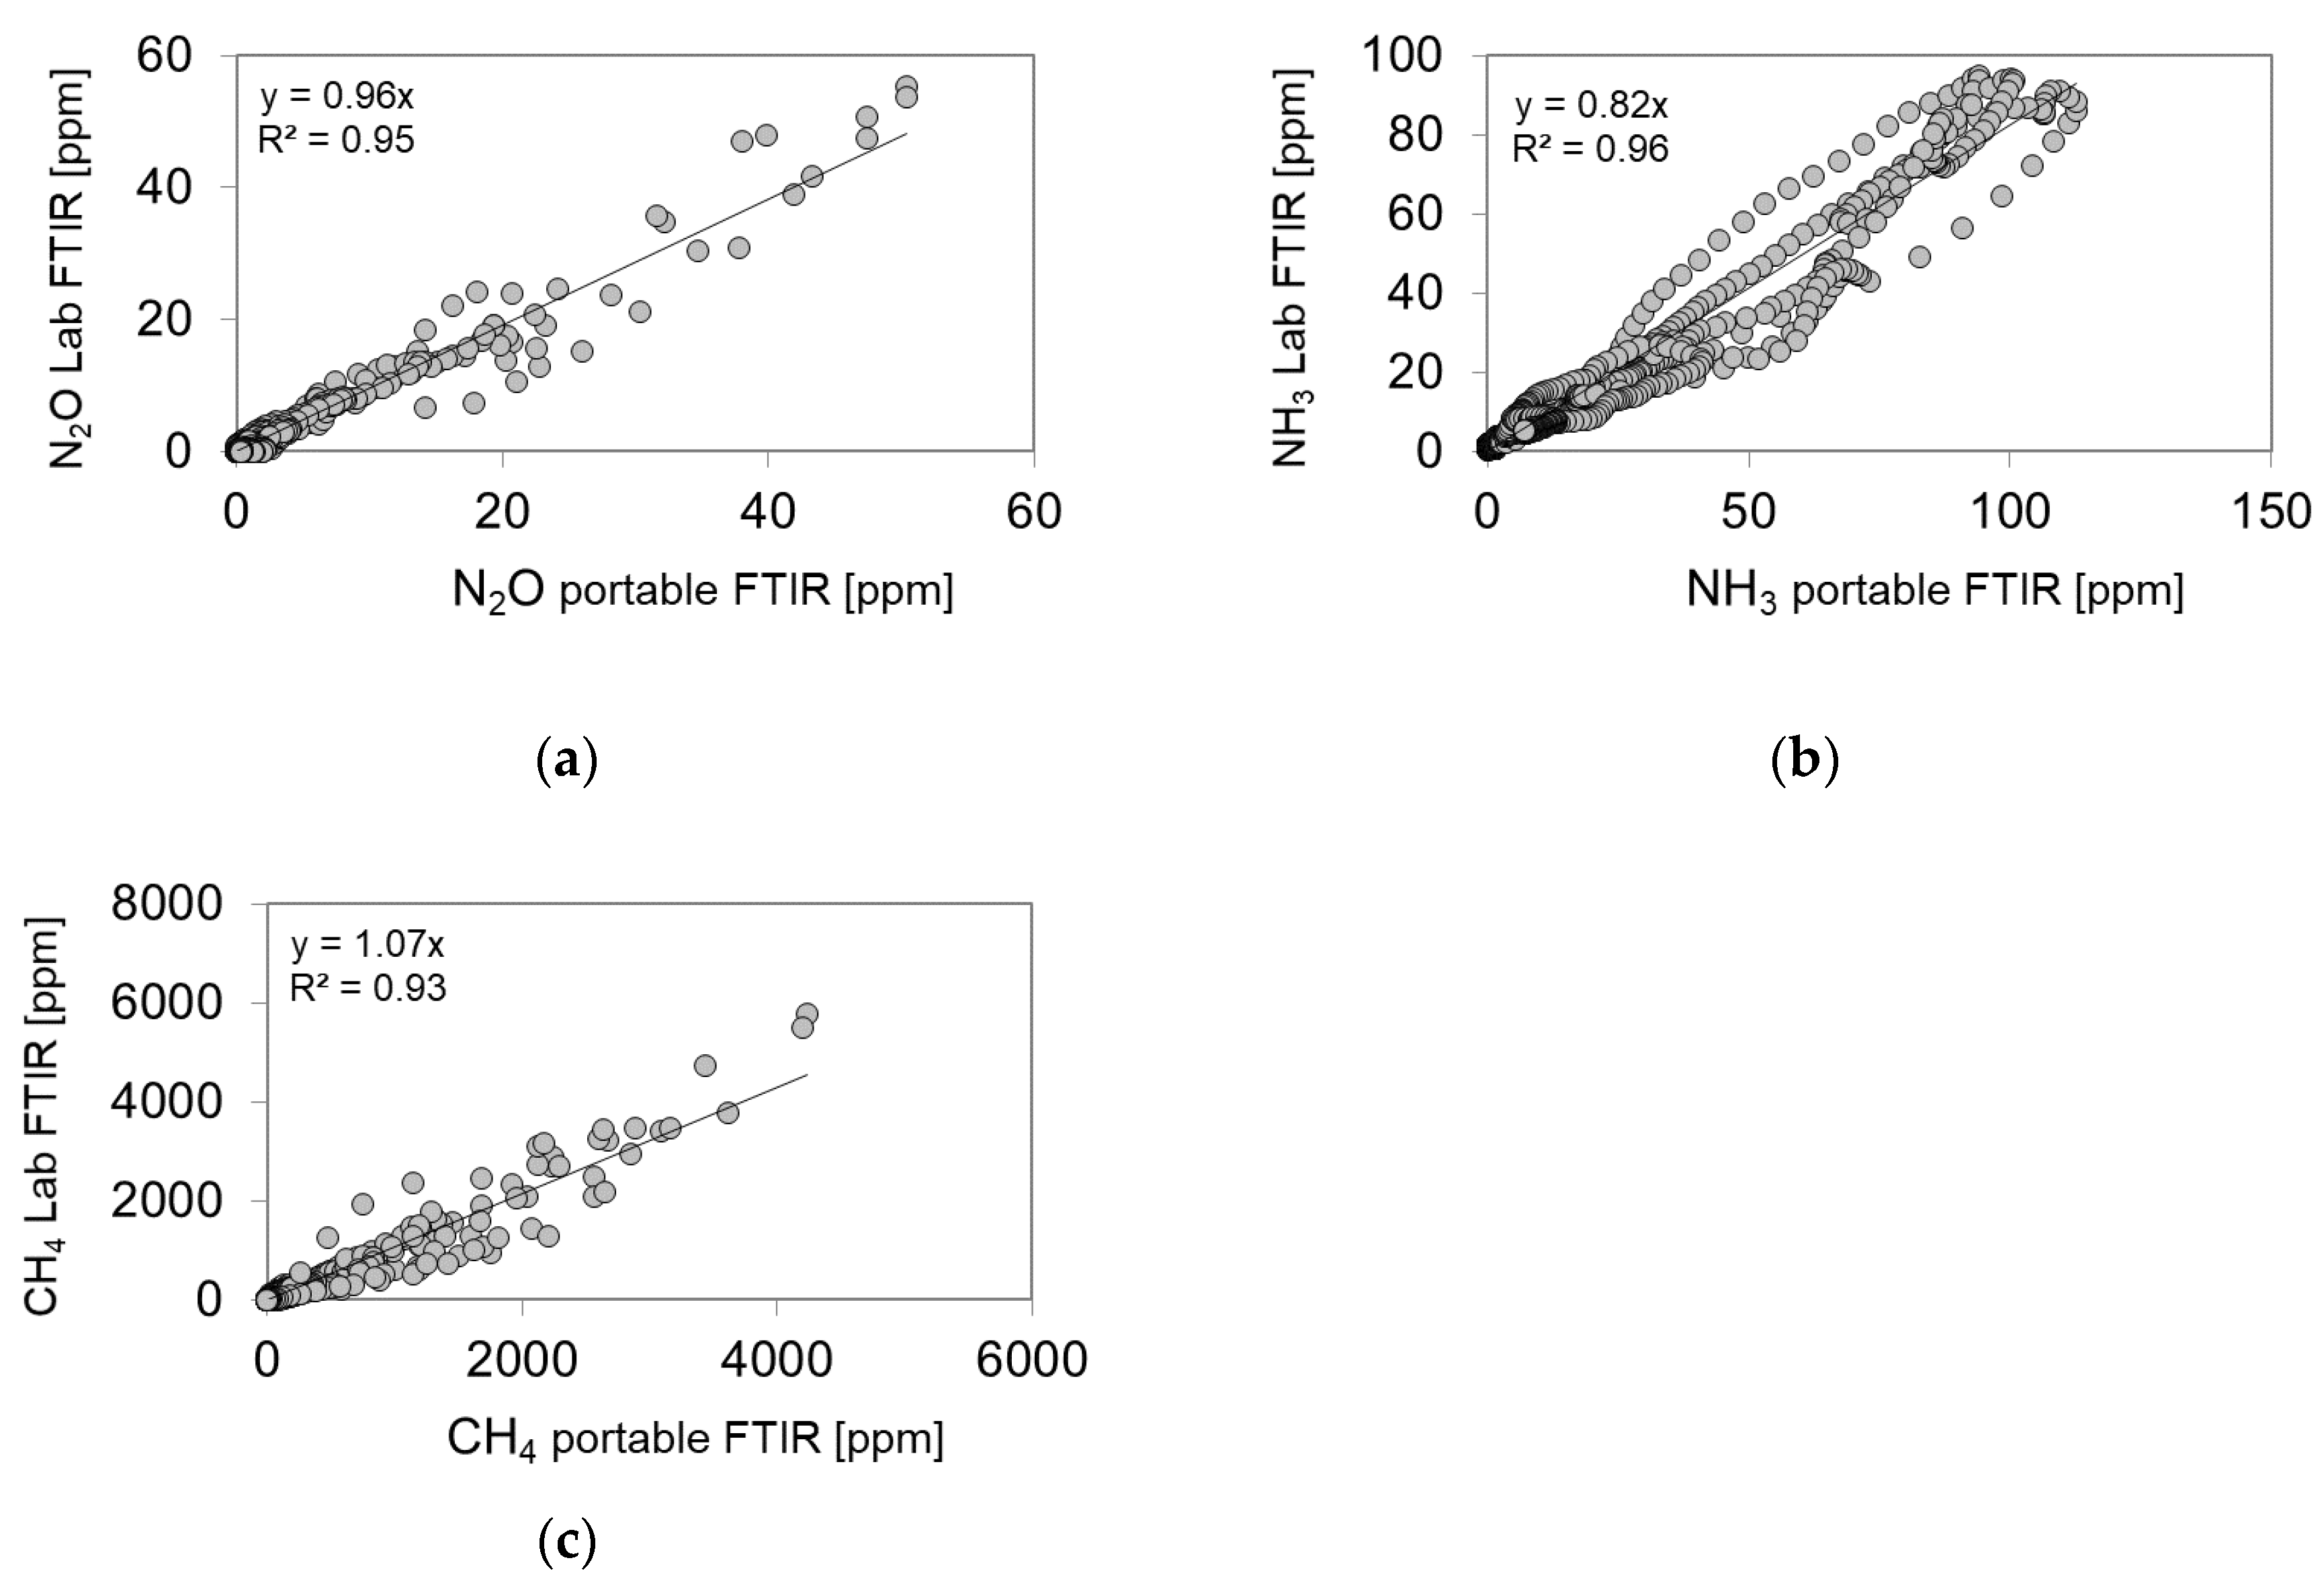
3.1. Evaluation of the Measurements of the Portable FTIR
3.2. Emissions during On-Road Testing
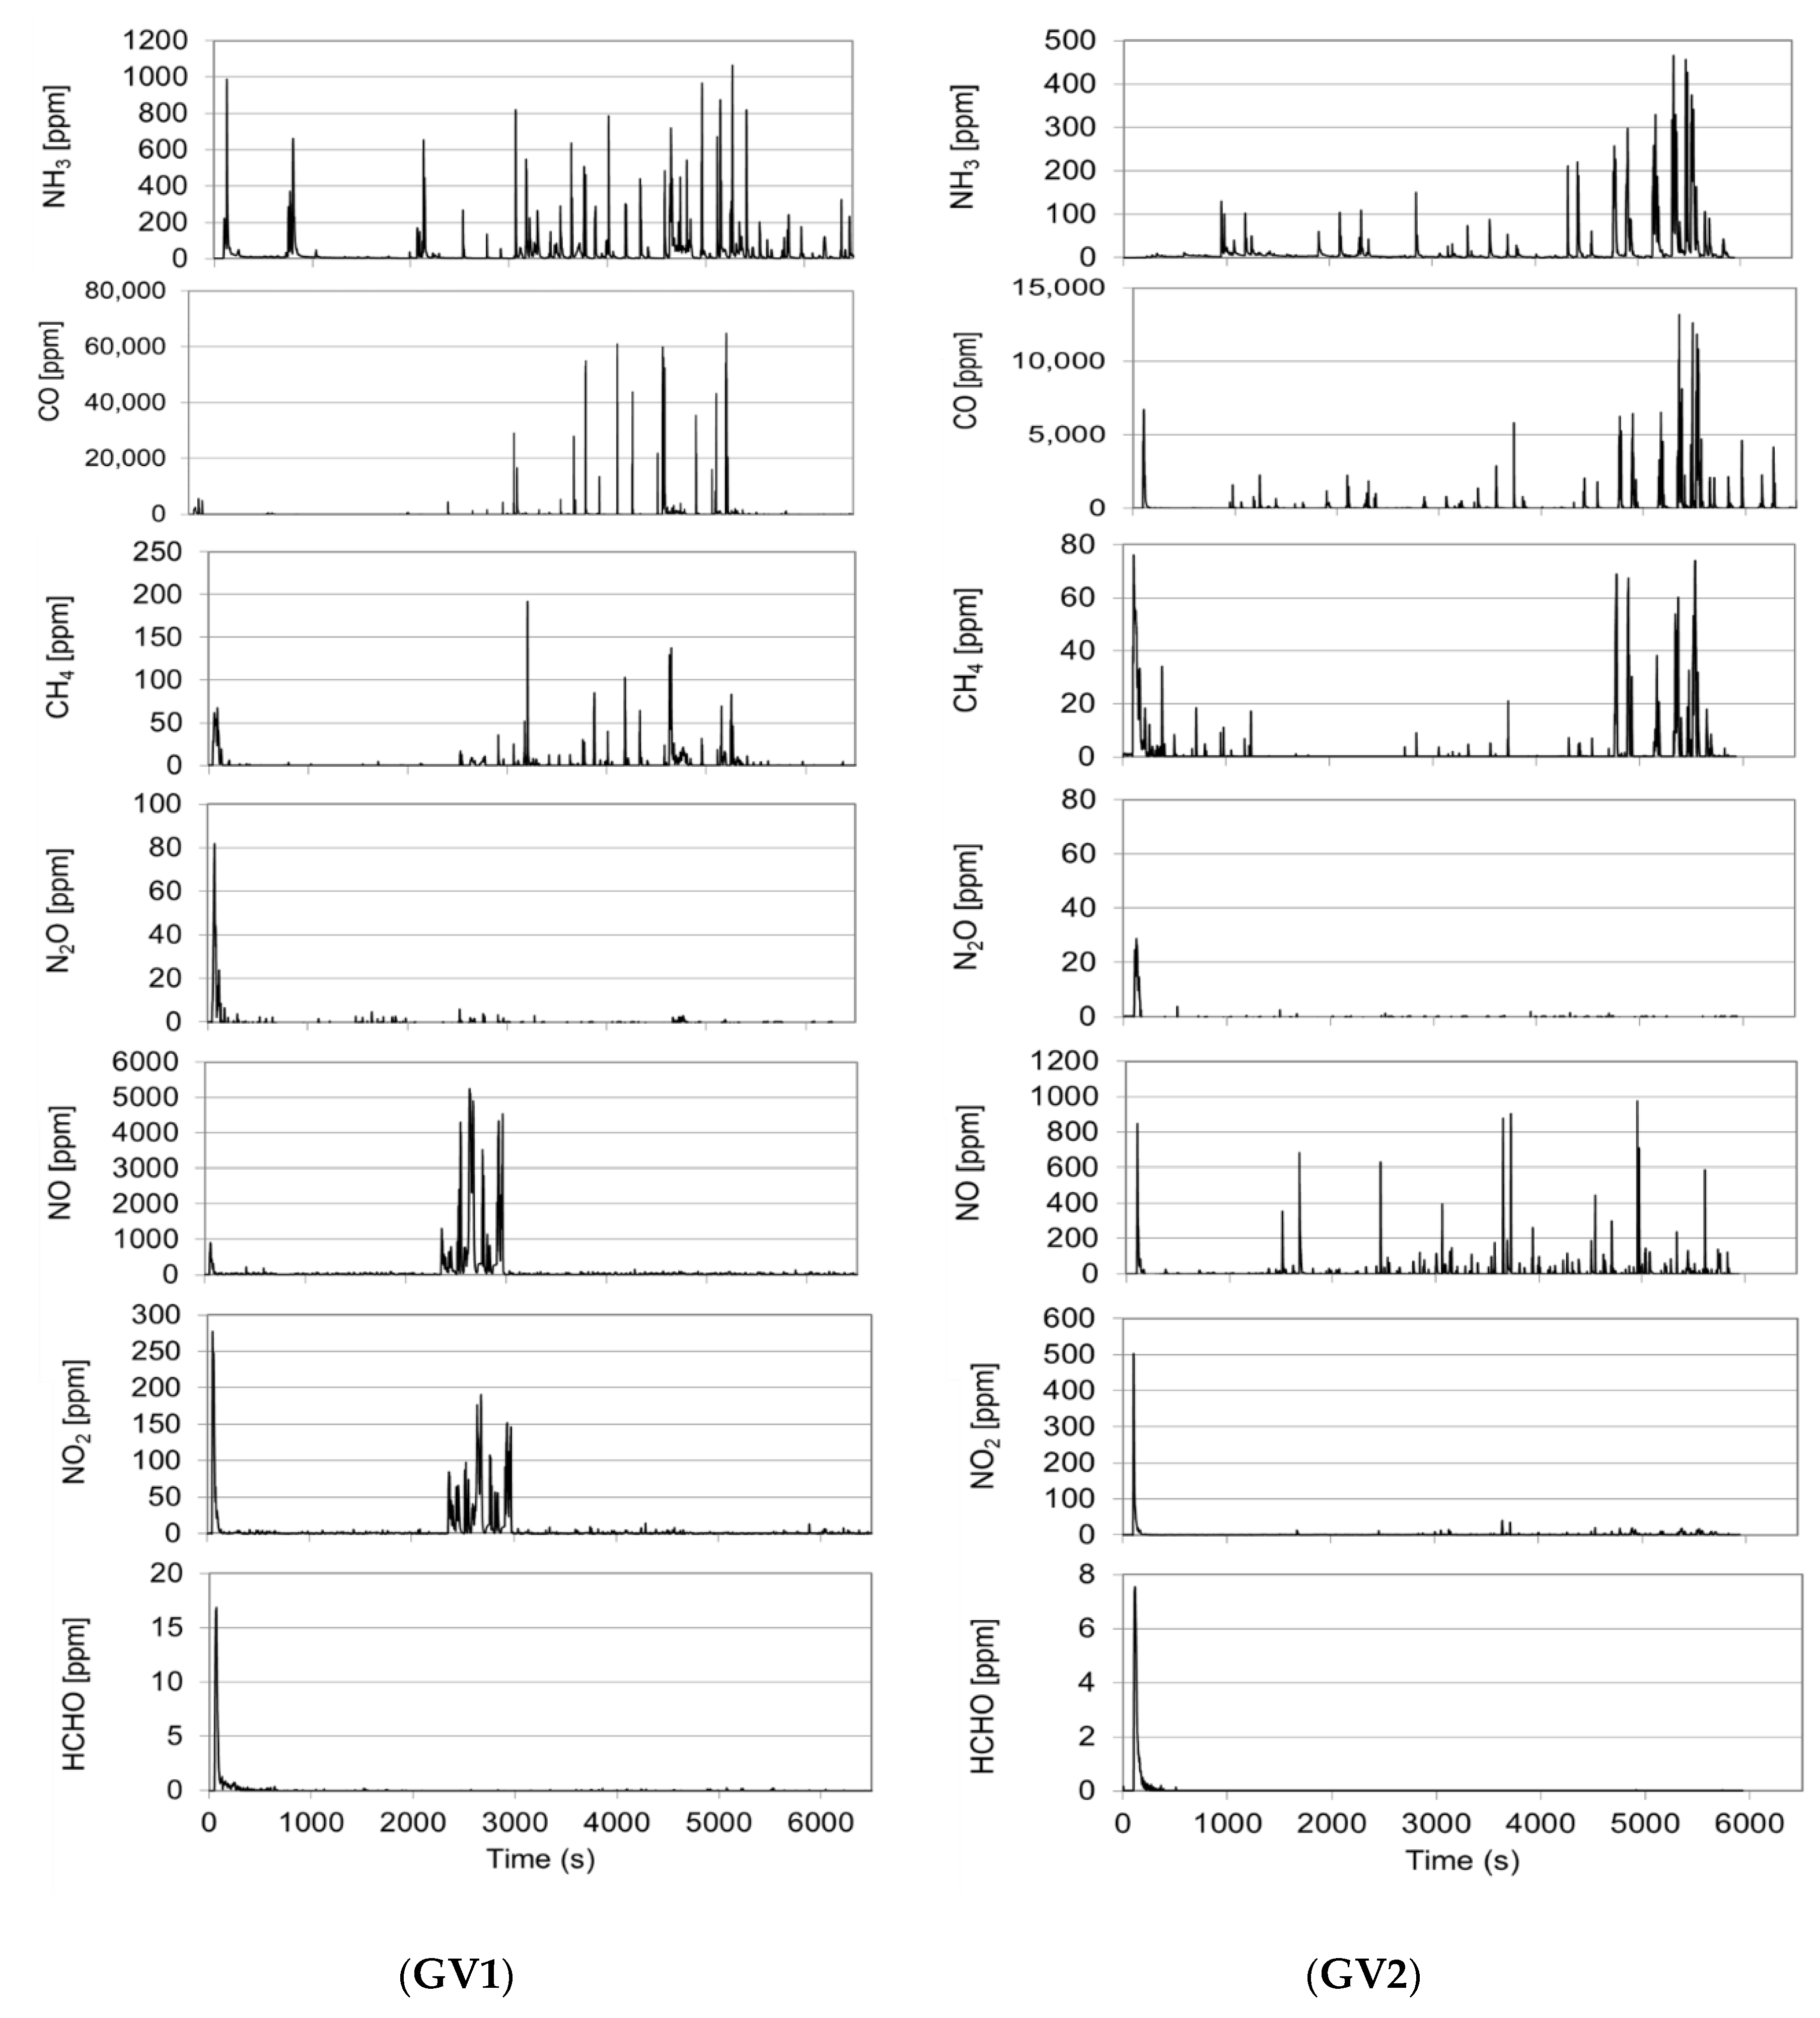
3.2.1. On-Road Emissions from the Gasoline Vehicles
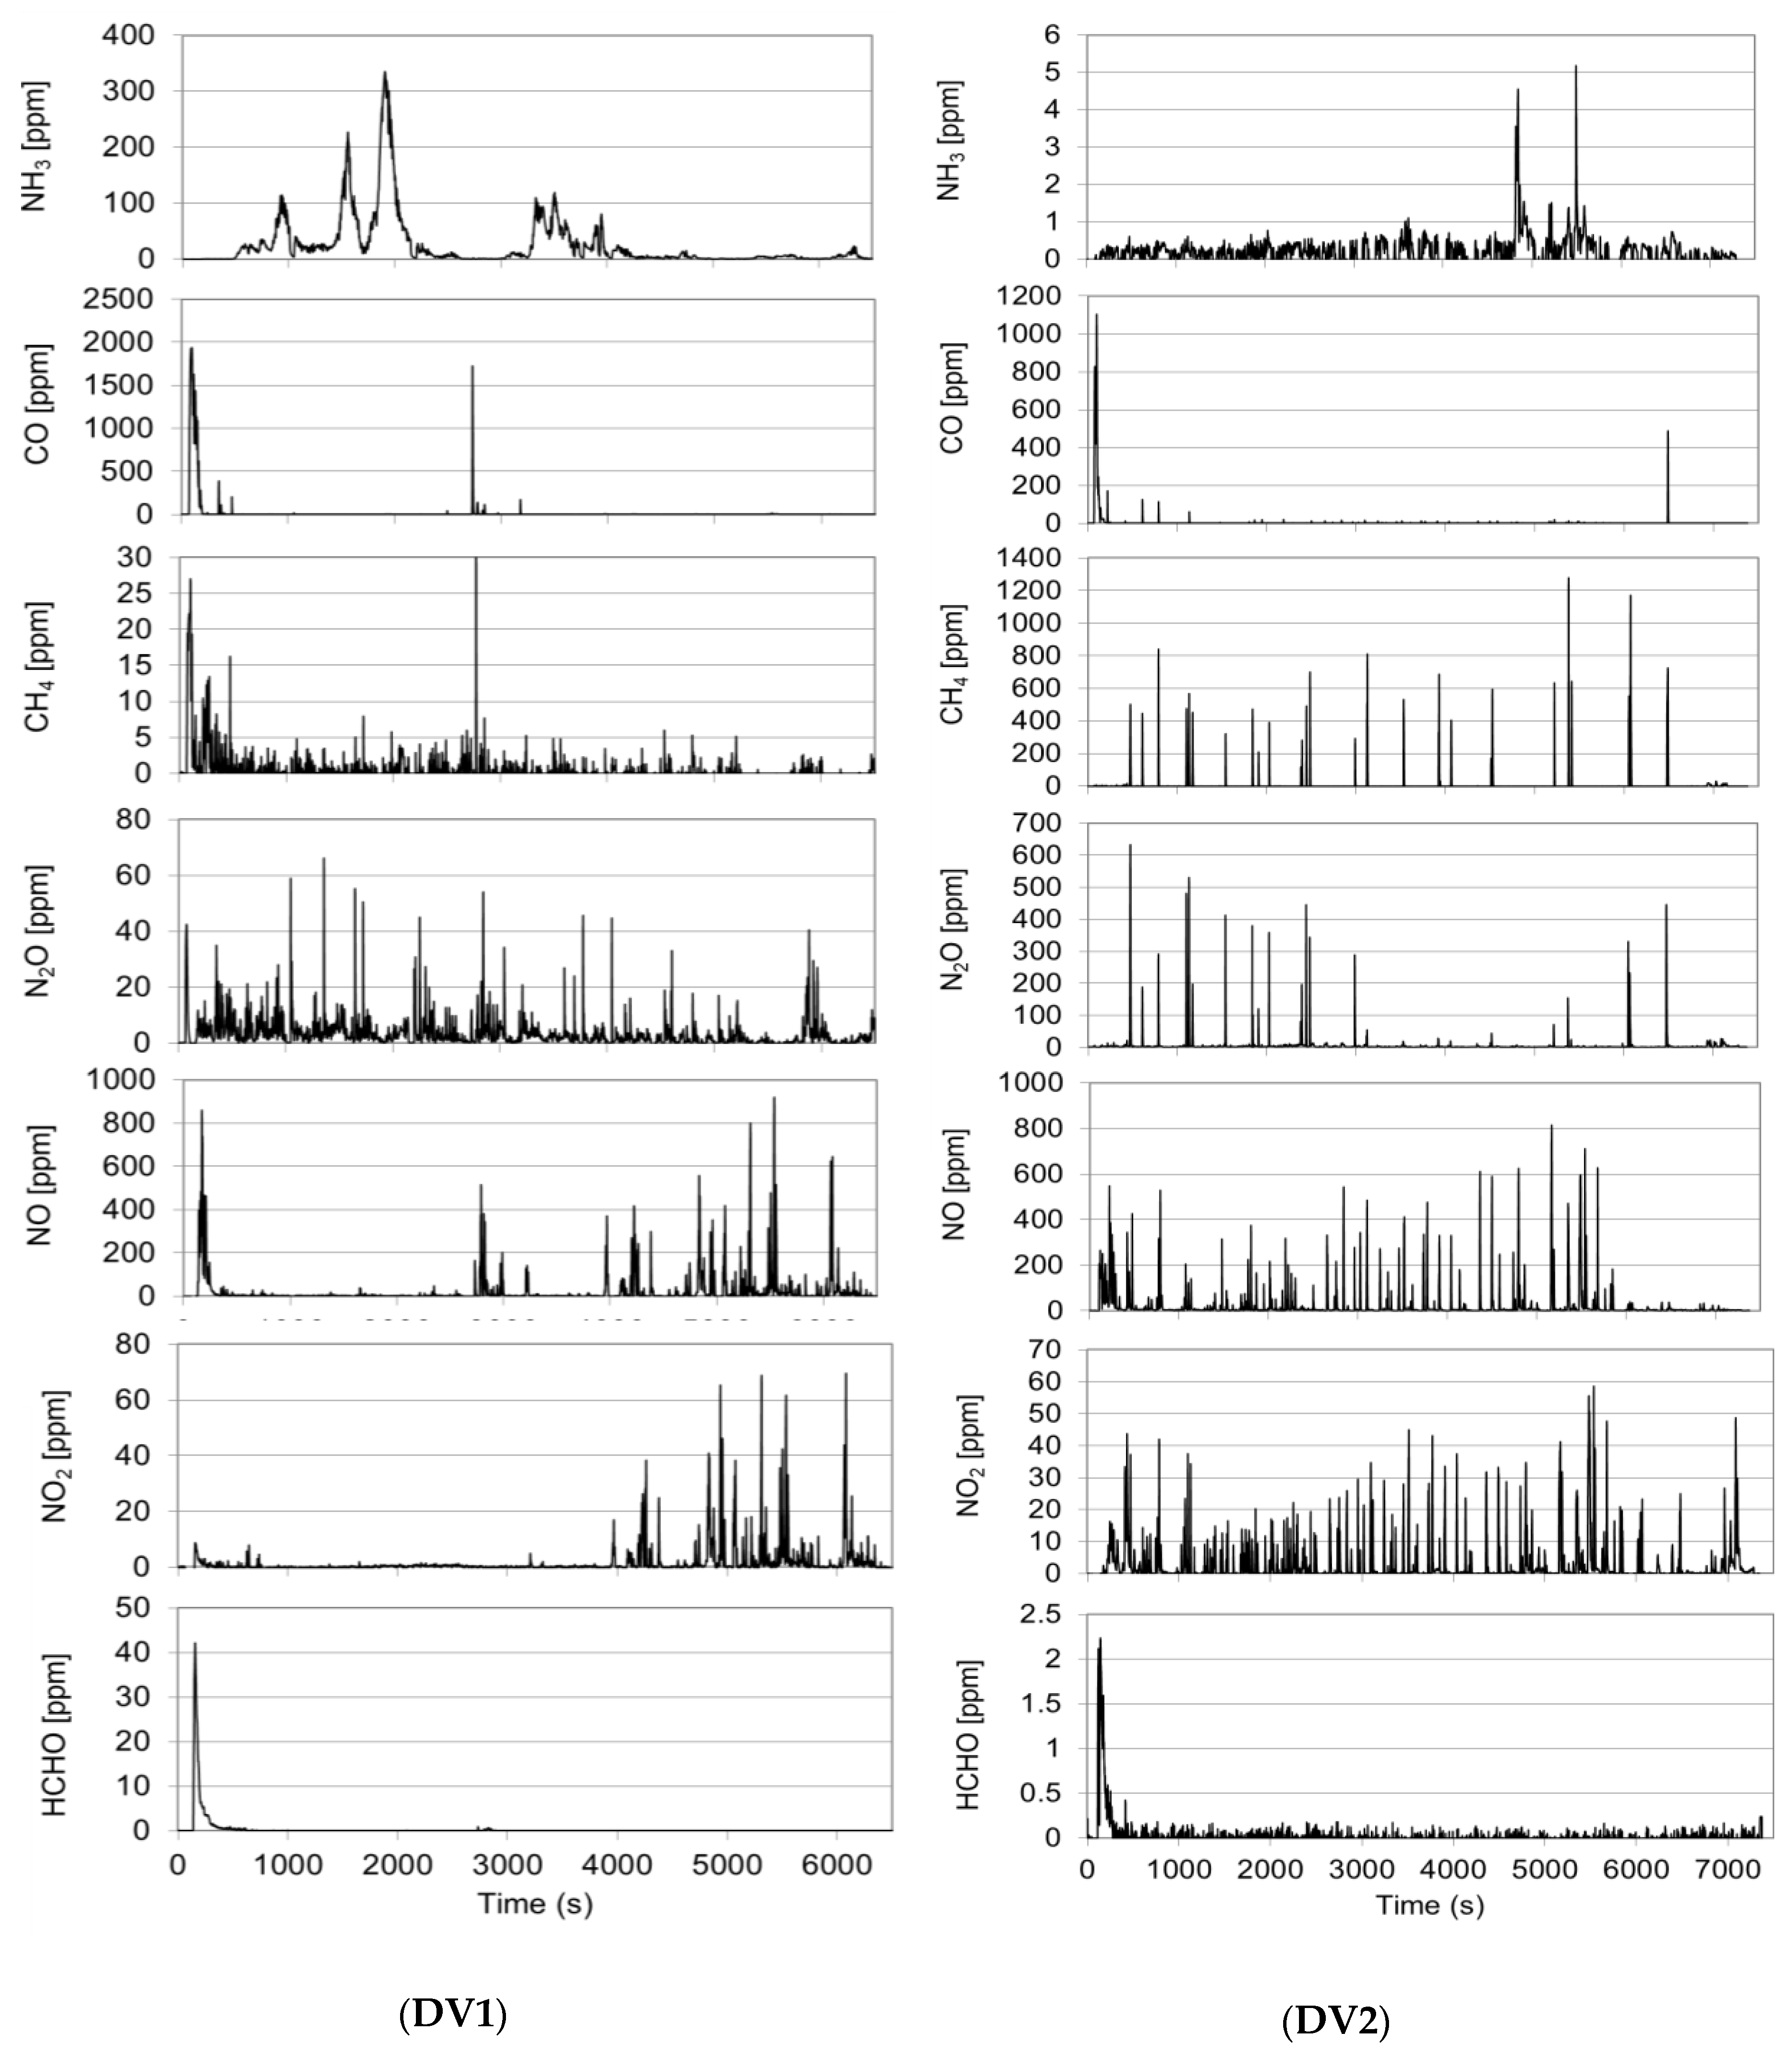
3.2.2. On-Road Emissions from the Diesel Vehicles
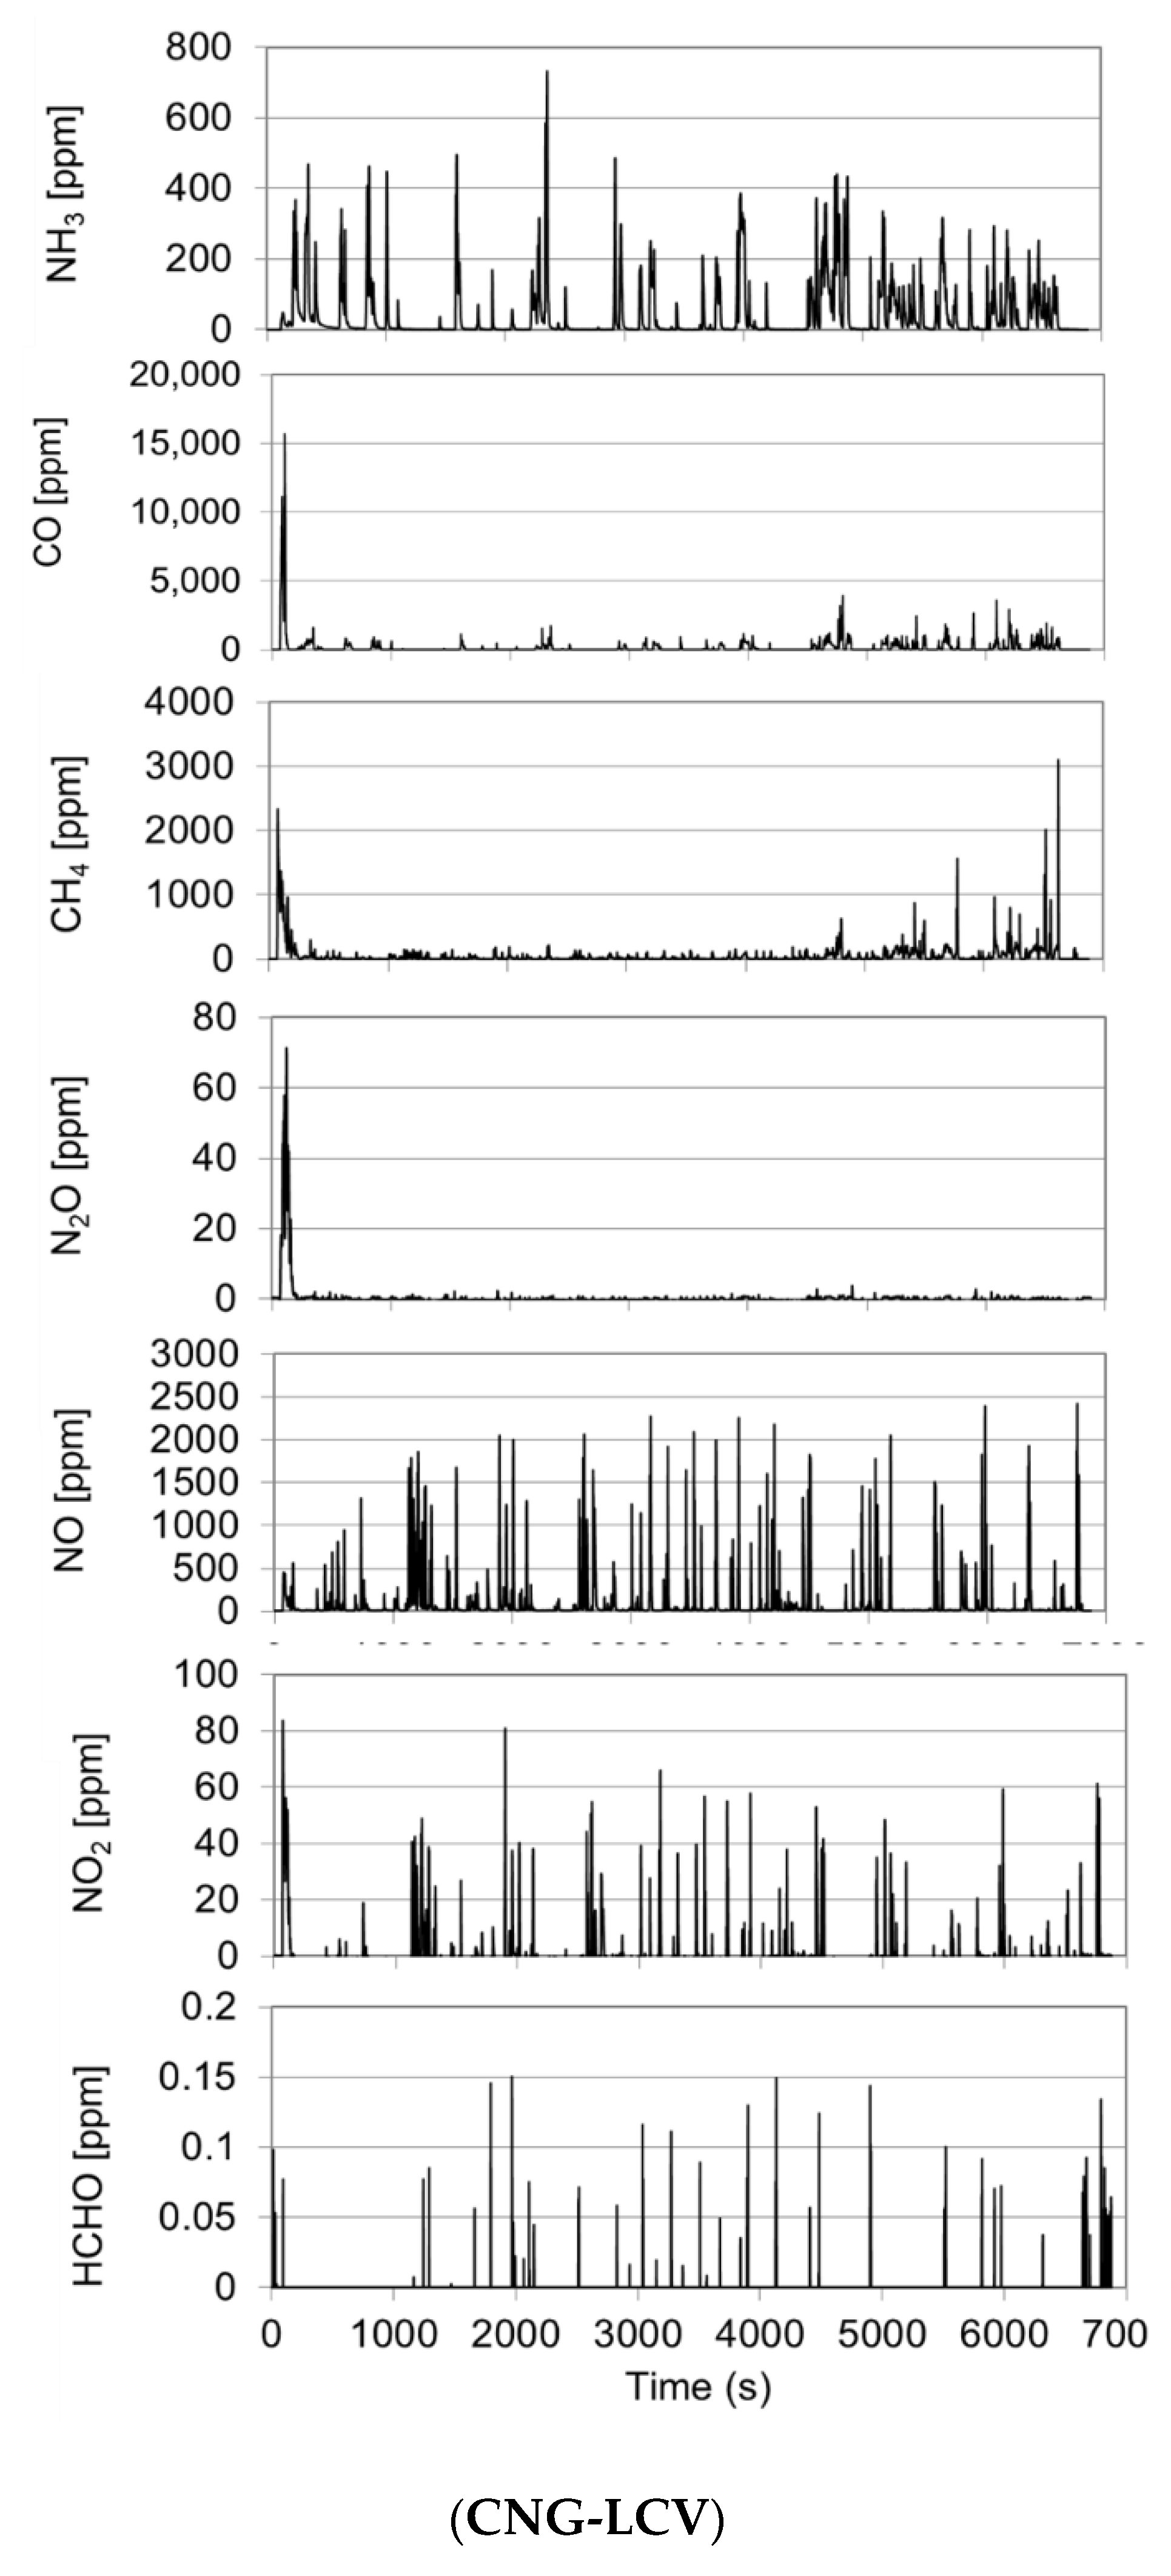
3.2.3. On-Road Emissions from the CNG Light-Commercial Vehicle
4. Conclusions
Supplementary Materials
Author Contributions
Acknowledgments
Conflicts of Interest
Disclaimer
References
- European Environmental Agency. EEA Report No 12/2018 Air Quality in Europe—2018 Report; European Environmental Agency: Copenhagen, Denmark, 2018; ISBN 978-92-9213-989-6. ISSN 1977-8449. [Google Scholar] [CrossRef]
- Kim, B.M.; Teffera, S.; Zeldin, M.D. Characterization of PM2.5 and PM10 in the South Coast Air Basin of Southern California: Part 1-Spatial Variations. J. Air Waste Manag. Assoc. 2000, 50, 2034–2044. [Google Scholar] [CrossRef]
- Phan, N.-T.; Kim, K.-H.; Shon, Z.-H.; Jeon, E.-C.; Jung, K.; Kim, N.-J. Analysis of ammonia variation in the urban atmosphere. Atmos. Environ. 2013, 65, 177–185. [Google Scholar] [CrossRef]
- Guan, B.; Zhan, R.; Lin, H.; Huang, Z. Review of state of the art technologies of selective catalytic reduction of NOx from diesel engine exhaust. Appl. Therm. Eng. 2014, 66, 395–414. [Google Scholar] [CrossRef]
- Ko, J.; Myung, C.-L.; Park, S. Impacts of ambient temperature, DPF regeneration, and traffic congestion on NOx emissions from a Euro 6-compliant diesel vehicle equipped with an LNT under real-world driving conditions. Atmos. Environ. 2018, 200, 1–14. [Google Scholar] [CrossRef]
- Suarez-Bertoa, R.; Zardini, A.A.; Astorga, C. Ammonia exhaust emissions from spark ignition vehicles over the New European Driving Cycle. Atmos. Environ. 2014, 97, 43–53. [Google Scholar] [CrossRef]
- Suarez-Bertoa, R.; Astorga, C. Isocyanic acid and ammonia in vehicle emissions. Transp. Res. Part D 2016, 49, 259–270. [Google Scholar] [CrossRef]
- Wallington, T.J.; Wiesen, P. N2O emissions from global transportation. Atmos. Environ. 2014, 94, 258–263. [Google Scholar] [CrossRef]
- Ravishankara, A.R.; Daniel, J.S.; Portmann, R.W. Nitrous Oxide (N2O): The Dominant Ozone-Depleting Substance Emitted in the 21st Century. Science 2009, 326, 123–125. [Google Scholar] [CrossRef] [PubMed]
- Finlayson-Pitts, B.J.; Pitts, J.N. Chemistry of the Upper and Lower Atmosphere; Elsevier: New York, NY, USA, 1999. [Google Scholar]
- Behera, S.N.; Sharma, M. Investigating the potential role of ammonia in ion chemistry of fine particulate matter formation for an urban environment. Sci. Total Environ. 2010, 408, 3569–3575. [Google Scholar] [CrossRef] [PubMed]
- Sillanpää, M.; Hillamo, R.; Saarikoski, S.; Frey, A.; Pennanen, A.; Makkonen, U.; Spolnik, Z.; Van Grieken, R.; Braniš, M.; Brunekreef, B.; et al. Chemical composition and mass closure of particulate matter at six urban sites in Europe. Atmos. Environ. 2006, 40, 212–223. [Google Scholar] [CrossRef]
- Pinder, R.W.; Adams, P.J.; Pandis, S.N. Ammonia Emission Controls as a Cost-Effective Strategy for Reducing Atmospheric Particulate Matter in the Eastern United States. Environ. Sci. Technol. 2007, 41, 380–386. [Google Scholar] [CrossRef] [PubMed]
- Paulot, F.; Jacob, D.J. Hidden Cost of U.S. Agricultural Exports: Particulate Matter from Ammonia Emissions. Environ. Sci. Technol. 2014, 48, 903–908. [Google Scholar] [CrossRef] [PubMed]
- Shindell, D.T.; Faluvegi, G.; Koch, D.M.; Schmidt, G.A.; Unger, N.; Bauer, S.E. Improved Attribution of Climate Forcing to Emissions. Science 2009, 326, 716–718. [Google Scholar] [CrossRef] [PubMed]
- IPCC. Intergovernmental Panel on Climate Change; Cambridge University Press: Cambridge, UK, 2013. [Google Scholar]
- Sutton, M.A.; Erisman, J.W.; Dentener, F.; Möller, D. Ammonia in the environment: From ancient times to the present. Environ. Pollut. 2008, 156, 583–604. [Google Scholar] [CrossRef] [PubMed]
- Bouwman, A.F.; Lee, D.S.; Asman Asman, W.A.H.; Dentener, F.J.; Van Der Hoek, K.W.; Olivier, J.G.J. A global high-resolution emission inventory for ammonia. Glob. Biogeochem. Cycles 1997, 11, 561–587. [Google Scholar] [CrossRef]
- Erisman, J.W.; Grennfelt, P.; Sutton, M. The European perspective on nitrogen emission and deposition. Environ. Int. 2003, 29, 311–325. [Google Scholar] [CrossRef]
- Kirkby, J.; Curtius, J.; Almeida, J.; Dunne, E.; Duplissy, J.; Ehrhart, S.; Franchin, A.; Gagne, S.; Ickes, L.; Kurten, A.; et al. Role of sulphuric acid, ammonia and galactic cosmic rays in atmospheric aerosol nucleation. Nature 2011, 476, 429–433. [Google Scholar] [CrossRef]
- Fenn, M.; Bytnerowicz, A.; Schilling, S.; Vallano, D.; Zavaleta, E.; Weiss, S.; Morozumi, C.; Geiser, L.; Hanks, K. On-road emissions of ammonia: An underappreciated source of atmospheric nitrogen deposition. Sci. Total Environ. 2018, 625, 909–919. [Google Scholar] [CrossRef]
- Sun, K.; Tao, L.; Miller, D.; Pan, D.; Golston, L.; Zondlo, M.; Griffin, R.; Wallace, H.; Leong, Y.; Yang, M.; et al. Vehicle Emissions as an Important Urban Ammonia Source in the United States and China. Environ. Sci. Technol. 2017, 51, 2472–2481. [Google Scholar] [CrossRef]
- Osada, K.; Saito, S.; Tsurumaru, H.; Hoshi, J. Vehicular exhaust contributions to high NH3 and PM2.5 concentrations during winter in Tokyo, Japan. Atmos. Environ. 2019, 206, 218–224. [Google Scholar] [CrossRef]
- Dabek-Zlotorzynska, E.; Celo, V.; Ding, L.; Herod, D.; Jeong, C.; Evans, G.; Hilker, N. Characteristics and sources of PM2.5 and reactive gases near roadways in two metropolitan areas in Canada. Atmos. Environ. 2019, 218, 116980. [Google Scholar] [CrossRef]
- Elser, M.; El-Haddad, I.; Maasikmets, M.; Bozzetti, C.; Wolf, R.; Ciarelli, G.; Slowik, J.; Richter, R.; Teinemaa, E.; Hüglin, C.; et al. High contributions of vehicular emissions to ammonia in three European cities derived from mobile measurements. Atmos. Environ. 2018, 175, 210–220. [Google Scholar] [CrossRef]
- U.S. 40 CFR § 86.1811-17—Exhaust Emission Standards for Light-Duty Vehicles, Light-Duty Trucks and Medium-Duty Passenger Vehicles. Available online: https://www.govinfo.gov/content/pkg/CFR-2014-title40-vol19/pdf/CFR-2014-title40-vol19-sec86-1811-17.pdf (accessed on 12 February 2020).
- Bishop, G.A.; Stedman, D.H. Reactive Nitrogen Species Emission Trends in Three Light-/Medium-Duty United States Fleets. Environ. Sci. Technol. 2015, 49, 11234–11240. [Google Scholar] [CrossRef] [PubMed]
- Link, M.F.; Kim, J.; Park, G.; Lee, T.; Park, T.; Babar, Z.B.; Sung, K.; Kim, P.; Kang, S.; Kim, J.S.; et al. Elevated production of NH4NO3 from the photochemical processing of vehicle exhaust: Implications for air quality in the Seoul Metropolitan Region. Atmos. Environ. 2017, 156, 95–101. [Google Scholar] [CrossRef]
- Suarez-Bertoa, R.; Astorga, C. Unregulated emissions from light-duty hybrid electric vehicles. Atmos. Environ. 2016, 136, 134–143. [Google Scholar] [CrossRef]
- Suarez-Bertoa, R.; Pavlovic, J.; Trentadue, G.; Otura-Garcia, M.; Tansini, A.; Ciuffo, B.; Astorga, C. Effect of low ambient temperature on emissions and electric range of plug-in hybrid electric vehicles. ACS Omega 2019, 4, 3159–3168. [Google Scholar] [CrossRef]
- Suarez-Bertoa, R.; Mendoza-Villafuerte, P.; Riccobono, F.; Vojtisek, M.; Pechout, M.; Perujo, A.; Astorga, C. On-road measurement of NH3 emissions from gasoline and diesel passenger cars during real world driving conditions. Atmos. Environ. 2017, 166, 488–497. [Google Scholar] [CrossRef]
- Suarez-Bertoa, R.; Astorga, C. Impact of cold temperature on Euro 6 passenger car emissions. Environ. Pollut. 2018, 234, 318–329. [Google Scholar] [CrossRef]
- Suarez-Bertoa, R.; Mendoza-Villafuerte, P.; Bonnel, P.; Lilova, V.; Hill, L.; Perujo, A.; Astorga, C. On-road measurement of NH3 and N2O emissions from a Euro V heavy-duty vehicle. Atmos. Environ. 2016, 139, 167–175. [Google Scholar] [CrossRef]
- Mendoza-Villafuerte, P.; Suarez-Bertoa, R.; Giechaskiel, B.; Riccobono, F.; Bulgheroni, C.; Astorga, C.; Perujo, A. NOx, NH3, N2O and PN real driving emissions from a Euro VI heavy-duty vehicle. Impact of regulatory on-road test conditions on emissions. Sci. Total Environ. 2017, 609, 546–555. [Google Scholar] [CrossRef]
- Vojtíšek-Lom, M.; Beránek, V.; Klír, V.; Jindra, P.; Pechout, M.; Voříšek, T. On-road and laboratory emissions of NO, NO2, NH3, N2O and CH4 from late-model EU light utility vehicles: Comparison of diesel and CNG. Sci. Total Environ. 2018, 616–617, 774–784. [Google Scholar] [CrossRef] [PubMed]
- European Commission. Commission regulation (EU) 2017/1151 of 1 June 2017 supplementing Regulation (EC) No 715/2007 of the European Parliament and of the Council on type-approval of motor vehicles with respect to emissions from light passenger and commercial vehicles (Euro 5 and Euro 6) and on access to vehicle repair and maintenance information, amending Directive 2007/46/EC of the European Parliament and of the Council, Commission Regulation (EC) No 692/2008 and Commission Regulation (EU) No 1230/2012 and repealing Commission Regulation (EC) No 692/2008. Off. J. Eur. Union 2017, 175, 1–643. [Google Scholar]
- UNECE. Regultaion 83 Concerning the Adoption of Uniform Technical Prescriptions for Wheeled Vehicles, Equipment and Parts which can be Fitted and/or be Used on Wheeled Vehicles and the Conditions for Reciprocal Recognition of Approvals Granted on the Basis of these Prescriptions (2013). Available online: https://www.unece.org/fileadmin/DAM/trans/main/wp29/wp29regs/R083r5e.pdf (accessed on 13 February 2020).
- Clairotte, M.; Valverde, V.; Bonnel, P.; Giechaskiel, B.; Carriero, M.; Otura, M.; Fontaras, G.; Pavlovic, J.; Martini, G.; Krasenbrink, A.; et al. Joint Research Centre 2017 Light-Duty Vehicles Emissions Testing—Contribution to the EU Market Surveillance: Testing Protocols and Vehicle Emissions Performance; EUR 29302 EN; Publications Office of the European Union: Luxembourg, 2018; ISBN 978-92-79-90600-8. [Google Scholar] [CrossRef]
- Valverde, V.; Clairotte, M.; Bonnel, P.; Giechaskiel, B.; Carriero, M.; Otura, M.; Gruening, C.; Fontaras, G.; Pavlovic, J.; Martini, G.; et al. Joint Research Centre 2018 Light-Duty Vehicles Emissions Testing—Contribution to the EU Market Surveillance: Testing Protocols and Vehicle Emissions Performance EUR29897 EN; Publications Office of the European Union: Luxembourg, 2019; ISBN 978-92-76-12333-0. [Google Scholar] [CrossRef]
- European Commission. Commission Regulation (EU) 2018/1832 of 5 November 2018 amending Directive 2007/46/EC of the European Parliament and of the Council, Commission Regulation (EC) No 692/2008 and Commission Regulation (EU) 2017/1151 for the purpose of improving the emission type approval tests and procedures for light passenger and commercial vehicles, including those for in-service conformity and real-driving emissions and introducing devices for monitoring the consumption of fuel and electric energy. Off. J. Eur. Union 2018, 301, 1–314. [Google Scholar]
- Suarez-Bertoa, R.; Lähde, T.; Pavlovic, J.; Valverde, V.; Clairotte, M.; Giechaskiel, B. Laboratory and On-Road Evaluation of a GPF-Equipped Gasoline Vehicle. Catalysts 2019, 9, 678. [Google Scholar] [CrossRef]
- Graham, L.; Belisle, S.; Rieger, P. Nitrous oxide emissions from light duty vehicles. Atmos. Environ. 2009, 43, 2031–2044. [Google Scholar] [CrossRef]
- Schuetzle, D.; Siegl, W.O.; Jensen, T.E.; Dearth, M.A.; Kaiser, E.W.; Gorse, R.; Kreucher, W.; Kulik, E. The relationship between gasoline composition and vehicle hydrocarbon emissions: A review of current studies and future research needs. Environ. Health Perspect. 1994, 102, 3–12. [Google Scholar] [CrossRef]
- Rodriguez, F.; Dornoff, J. Beyond NOx: Emissions of Unregulated Pollutants from a Modern Gasoline Car; The International Council on Clean Transportation (ICCT): Berlin, Germany, 2019. [Google Scholar]
- Suarez-Bertoa, R.; Zardini, A.A.; Lilova Meyer, D.; Nakatani, S.; Hibel, F.; Ewers, J.; Clairotte, M.; Hill, L.A.; Astorga, C. Intercomparison of real-time tailpipe ammonia measurements from vehicles tested over the new world-harmonized light-duty vehicle test cycle (WLTC). Environ. Sci. Pollut. Res. 2015, 22, 7450–7460. [Google Scholar] [CrossRef]
- Suarez-Bertoa, R.; Clairotte, M.; Arlitt, B.; Nakatani, S.; Hill, L.; Winkler, K.; Kaarsberg, C.; Knauf, T.; Zijlmans, R.; Boertien, H.; et al. Intercomparison of ethanol, formaldehyde and acetaldehyde measurements from a flex-fuel vehicle exhaust during the WLTC. Fuel 2017, 203, 330–340. [Google Scholar] [CrossRef]
- Simonen, P.; Kalliokoski, J.; Karjalainen, P.; Rönkkö, T.; Timonen, H.; Saarikoski, S.; Aurela, M.; Bloss, M.; Triantafyllopoulos, G.; Kontses, A.; et al. Characterization of laboratory and real driving emissions of individual Euro 6 light-duty vehicles—Fresh particles and secondary aerosol formation. Environ. Pollut. 2019, 255, 113175. [Google Scholar] [CrossRef]
- Wang, X.; Ge, Y.; Gong, H.; Yang, Z.; Tan, J.; Hao, L.; Su, S. Ammonia emissions from China-6 compliant gasoline vehicles tested over the WLTC. Atmos. Environ. 2019, 199, 136–142. [Google Scholar] [CrossRef]
- Vieira-Filho, M.S.; Ito, D.T.; Pedrotti, J.J.; Coelho LH, G.; Fornaro, A. Gas-phase ammonia and water-soluble ions in particulate matter analysis in an urban vehicular tunnel. Environ. Sci. Pollut. Res. 2016, 23, 19876–19886. [Google Scholar] [CrossRef] [PubMed]
- Whittington, B.I.; Jiang, C.J.; Trimm, D.L. Vehicle exhaust catalysis: I. The relative importance of catalytic oxidation, steam reforming and water-gas shift reactions. Catal. Today 1995, 26, 41–45. [Google Scholar] [CrossRef]
- Livingston, C.; Rieger, P.; Winer, A. Ammonia emissions from a representative in-use fleet of light and medium-duty vehicles in the California South Coast Air Basin. Atmos. Environ. 2009, 43, 3326–3333. [Google Scholar] [CrossRef]
- Suarez-Bertoa, R.; Valverde-Morales, V.; Clairotte, M.; Pavlovic, J.; Giechaskiel, B.; Franco, V.; Kregar, Z.; Astorga-LLorens, C. On-road emissions of passenger cars beyond the boundary conditions of the real-driving emissions test. Environ. Res. 2019, 176, 108572. [Google Scholar] [CrossRef]
- Demuynck, J.; Favre, C.; Bosteels, D.; Hamje, H.; Andersson, J. Real-World Emissions Measurements of a Gasoline Direct Injection Vehicle without and with a Gasoline Particulate Filter; SAE: Warrendale, PA, USA, 2017; No. 2017-01-0985. [Google Scholar] [CrossRef]
- Kelly, N.A.; Groblicki, P.J. Real-world emissions from a modern production vehicle driven in Los Angeles. J. Air Waste Manag. Assoc. 1993, 43, 1351–1357. [Google Scholar] [CrossRef]
- Giechaskiel, B.; Suarez-Bertoa, R.; Lähde, T.; Clairotte, M.; Carriero, M.; Bonnel, P.; Maggiore, M. Emissions of a Euro 6b diesel passenger car retrofitted with a solid ammonia reduction system. Environ. Res. 2018, 166, 298–309. [Google Scholar] [CrossRef] [PubMed]
- Giechaskiel, B.; Suarez-Bertoa, R.; Lahde, T.; Clairotte, M.; Carriero, M.; Bonnel, P.; Maggiore, M. Evaluation of NOx emissions of a retrofitted Euro 5 passenger car for the Horizon prize “Engine retrofit”. Atmosphere 2019, 10, 4. [Google Scholar] [CrossRef]
- Valverde, V.; Mora, B.A.; Clairotte, M.; Pavlovic, J.; Suarez-Bertoa, R.; Giechaskiel, B.; Astorga-LLorens, C.; Fontaras, G. Emission factors derived from 13 Euro 6b light-duty vehicles based on laboratory and on-road measurements. Atmosphere 2019, 10, 243. [Google Scholar] [CrossRef]
- Suarez-Bertoa, R.; Kousoulidou, M.; Clairotte, M.; Giechaskiel, B.; Nuottimäki, J.; Sarjovaara, T.; Lonza, L. Impact of HVO blends on modern diesel passenger cars emissions during real world operation. Fuel 2019, 235, 1427–1435. [Google Scholar] [CrossRef]
- Rašić, D.; Rodman Oprešnik, S.; Seljak, T.; Vihar, R.; Baškovič, U.; Wechtersbach, T.; Katrašnik, T. RDE-based assessment of a factory bi-fuel CNG/gasoline light-duty vehicle. Atmos. Environ. 2017, 167, 523–541. [Google Scholar] [CrossRef]
- Jahirul, M.I.; Masjuki, H.H.; Saidur, R.; Kalam, M.A.; Jayed, M.H.; Wazed, M.A. Comparative engine performance and emission analysis of CNG and gasoline in a retrofitted car engine. Appl. Therm. Eng. 2010, 30, 2219–2226. [Google Scholar] [CrossRef]


| Code | Fuel | Injection | Emission Control System | Reg. Year | Euro Standard | Vehicle Class | Engine Displacement (cm3) | Power (kW) | Odometer (km) |
|---|---|---|---|---|---|---|---|---|---|
| GV1 | Gasoline | DI | TWC | 2017 | Euro 6c | M1 | 1498 | 96 | 11,163 |
| GV2 | Gasoline | DI | TWC + GPF | 2018 | Euro 6b | M1 | 1395 | 110 | 6192 |
| DV1 | Diesel | DI | EGR + DOC + DPF + SCR | 2018 | Euro 6d-TEMP | M1 | 1499 | 96 | 9656 |
| DV2 | Diesel | DI | EGR + DOC + DPF + LNT + SCR | 2018 | Euro 6d-TEMP | M1 | 1969 | 140 | 9192 |
| CNG-LCV | CNG | PFI | TWC | 2018 | Euro 6b | N1, Class 3 | 2999 | 100 | 1023 |
| Route-1 | Route-2 Dynamic | Route-3 | |
|---|---|---|---|
| Trip distance (km) | 94 | 79 | 104 |
| Average trip duration (min) | 112 | 94 | 114 |
| Average urban stop time (%) | 19 | 23 | 11 |
| Average Urban distance (km) | 37 | 31 | 41 |
| Average Rural distance (km) | 27 | 25 | 29 |
| Average Motorway distance (km) | 30 | 23 | 34 |
| Urban average Speed (km/h) | 29 | 29 | 34 |
| Average Urban 95th v*a (m2/s3) | 13 | 20 | 10 |
| Average Rural 95th v*a (m2/s3) | 17 | 29 | 15 |
| Average Motorway 95th v*a (m2/s3) | 21 | 29 | 13 |
| Cumulative positive gain (m/100 km) | 820 | 760 | 666 |
| Max trip altitude (m.a.s.l.) | 415 | 300 | 358 |
| GV1 Route-1 | GV1 Route-2 Dynamic | |||||||
| Comp. | Urban | Rural | MW | Comp. | Urban | Rural | MW | |
| NH3 | 49 | 38 | 27 | 85 | 48 | 32 | 48 | 68 |
| N2O | 0 | 0 | 0 | 0 | 0 | 0 | 0 | 0 |
| NO | 20 | 27 | 13 | 20 | 195 | 235 | 302 | 25 |
| NO2 | 4 | 9 | 1 | 0 | 10 | 16 | 12 | 0 |
| CO | 1522 | 957 | 582 | 3116 | 2666 | 1310 | 3261 | 3815 |
| CH4 | 2 | 1 | 0 | 5 | 4 | 1 | 4 | 7 |
| HCHO | 0 | 1 | 0 | 0 | 0 | 1 | 0 | 0 |
| GV2 Route-1 | GV2 Route-2 | |||||||
| Comp. | Urban | Rural | MW | Comp. | Urban | Rural | MW | |
| NH3 | 21 | 11 | 10 | 46 | 23 | 11 | 17 | 42 |
| N2O | 0 | 0 | 0 | 0 | 0 | 0 | 0 | 0 |
| NO | 25 | 47 | 9 | 14 | 13 | 18 | 3 | 17 |
| NO2 | 5 | 6 | 1 | 7 | 1 | 2 | 0 | 0 |
| CO | 533 | 159 | 217 | 1383 | 521 | 155 | 252 | 1183 |
| CH4 | 2 | 0 | 0 | 7 | 2 | 0 | 0 | 7 |
| HCHO | 0 | 0 | 0 | 0 | 0 | 0 | 0 | 0 |
| DV1 Route-1 | DV1 Route-2 Dynamic | |||||||
| Comp. | Urban | Rural | MW | Comp. | Urban | Rural | MW | |
| NH3 | 17 | 32 | 13 | 3 | 2 | 3 | 1 | 2 |
| N2O | 5 | 11 | 3 | 1 | 4 | 6 | 2 | 2 |
| NO | 84 | 63 | 66 | 126 | 308 | 218 | 274 | 467 |
| NO2 | 6 | 3 | 6 | 12 | 19 | 11 | 13 | 36 |
| CO | 13 | 30 | 0 | 2 | 10 | 13 | 4 | 12 |
| CH4 | 0 | 0 | 0 | 0 | 0 | 1 | 0 | 0 |
| HCHO | 0 | 0 | 0 | 0 | 0 | 0 | 0 | 0 |
| DV2 Route-1 | DV2 Route-2 Dynamic | |||||||
| Comp. | Urban | Rural | MW | Comp. | Urban | Rural | MW | |
| NH3 | 1 | 0 | 0 | 1 | 0 | 0 | 0 | 1 |
| N2O | 27 | 40 | 31 | 13 | 19 | 30 | 20 | 9 |
| NO | 82 | 79 | 43 | 120 | 286 | 272 | 275 | 310 |
| NO2 | 13 | 9 | 10 | 18 | 40 | 35 | 36 | 48 |
| CO | 0 | 5 | 0 | 0 | 0 | 0 | 0 | 0 |
| CH4 | 21 | 27 | 21 | 15 | 8 | 8 | 10 | 7 |
| HCHO | 0 | 0 | 0 | 0 | 0 | 0 | 0 | 0 |
| CNG-LCV Route-3 | CNG-LCV Route-2 Dynamic | |||||||
|---|---|---|---|---|---|---|---|---|
| Comp. | Urban | Rural | MW | Comp. | Urban | Rural | MW | |
| NH3 | 66 | 46 | 90 | 71 | 62 | 38 | 75 | 82 |
| N2O | 1 | 3 | 0 | 0 | 0 | 1 | 0 | 0 |
| NO | 405 | 799 | 172 | 50 | 372 | 720 | 244 | 37 |
| NO2 | 19 | 28 | 12 | 11 | 14 | 24 | 9 | 6 |
| CO | 418 | 327 | 369 | 601 | 399 | 202 | 344 | 698 |
| CH4 | 75 | 76 | 21 | 126 | 72 | 55 | 31 | 127 |
| HCHO | 0 | 0 | 0 | 0 | 0 | 0 | 0 | 0 |
© 2020 by the authors. Licensee MDPI, Basel, Switzerland. This article is an open access article distributed under the terms and conditions of the Creative Commons Attribution (CC BY) license (http://creativecommons.org/licenses/by/4.0/).
Share and Cite
Suarez-Bertoa, R.; Pechout, M.; Vojtíšek, M.; Astorga, C. Regulated and Non-Regulated Emissions from Euro 6 Diesel, Gasoline and CNG Vehicles under Real-World Driving Conditions. Atmosphere 2020, 11, 204. https://doi.org/10.3390/atmos11020204
Suarez-Bertoa R, Pechout M, Vojtíšek M, Astorga C. Regulated and Non-Regulated Emissions from Euro 6 Diesel, Gasoline and CNG Vehicles under Real-World Driving Conditions. Atmosphere. 2020; 11(2):204. https://doi.org/10.3390/atmos11020204
Chicago/Turabian StyleSuarez-Bertoa, Ricardo, Martin Pechout, Michal Vojtíšek, and Covadonga Astorga. 2020. "Regulated and Non-Regulated Emissions from Euro 6 Diesel, Gasoline and CNG Vehicles under Real-World Driving Conditions" Atmosphere 11, no. 2: 204. https://doi.org/10.3390/atmos11020204
APA StyleSuarez-Bertoa, R., Pechout, M., Vojtíšek, M., & Astorga, C. (2020). Regulated and Non-Regulated Emissions from Euro 6 Diesel, Gasoline and CNG Vehicles under Real-World Driving Conditions. Atmosphere, 11(2), 204. https://doi.org/10.3390/atmos11020204