Article

Aqueous-Phase Production of Secondary Organic Aerosols from Oxidation of Dibenzothiophene (DBT)

1
Jiangsu Key Laboratory of Atmospheric Environment Monitoring and Pollution Control, Collaborative Innovation Center of Atmospheric Environment and Equipment Technology, School of Environmental Sciences and Engineering, Nanjing University of Information Science and Technology, Nanjing 210044, China
2
College of Chemistry and Environmental Engineering, Jiangsu University of Technology, Changzhou 213001, China
*
Author to whom correspondence should be addressed.
Atmosphere 2020, 11(2), 151; https://doi.org/10.3390/atmos11020151
Submission received: 13 January 2020 / Revised: 25 January 2020 / Accepted: 29 January 2020 / Published: 30 January 2020
(This article belongs to the Special Issue Atmospheric Aqueous-Phase Chemistry)

Abstract

:
Intermediate-volatility organic compounds (IVOCs) have been recognized as an important contributor to the secondary organic aerosol (SOA) formation via gas-phase reactions. However, it is unclear whether or not IVOCs-SOA can be produced in the aqueous phase. This work investigated aqueous oxidation of one model compound of IVOCs, dibenzothiophene (DBT). Results show that DBT can be degraded by both hydroxyl radical and the triplet excited states of organic light chromophores (3C*). Aqueous dark oxidation of DBT was also possible. SOA yields of 32% and 15% were found for hydroxyl radical (OH)-mediated photo-oxidation and dark oxidation, respectively. A continuous and significant increase of oxidation degree of SOA was observed during OH photo-oxidation, but not during the dark oxidation. Factor analyses revealed that there was a persistent production of highly oxygenated compounds from the less oxygenated species. OH-initiated photochemical reactions can also produce species with a relatively large light-absorbing ability, while such photo-enhancement due to direct light irradiation and 3C*-initiated oxidation could occur, but is much less important. In the future, studies on the second-order rate constants, molecular characterization of the oxidation products from this and other IVOCs precursors are needed to better understand the role of this reaction pathway in SOA budget, air quality and climate change.

1. Introduction

Secondary organic species or aerosols (SOA) are important yet highly complicated constituents of atmospheric particles, and their formation mechanism is much less clear compared to their inorganic companions [1,2]. Traditionally, SOA is thought to be generated mostly via gas-phase oxidation reactions, but in recent decades, it is well established that SOA can also be produced in atmospheric aqueous phases (e.g., fog and cloud droplets, aqueous aerosols) effectively [3,4]. This SOA from aqueous-phase reactions, termed as “aqSOA”, may contribute as much mass as the gas-phase reactions [3]. On the other hand, intermediate-volatility organic compounds (IVOCs) with effective saturation concentrations (C*) in the range of 103–106 μg m−3 [5] are proved to be an important group of precursors of SOA. These species have been observed in vehicle [6,7], ship [8], aircraft emissions [9], as well as biogenic emissions [10]. Most studies regarding SOA formation from IVOCs, however, focus on the gas-phase reactions and production yields [11,12,13], while the possibility and importance of IVOCs-aqSOA remain unclear. This is largely due to that IVOCs may have low water solubility or Henry’s law coefficient, making it an unlikely effective aqSOA precursor in a theoretical view. Nevertheless, some phenolic carbonyls [14] or polycyclic aromatic hydrocarbon (PAH) compounds [15], which actually belong to the IVOCs category, are found to be effective in producing aqSOA. Very recently, our group also shows that 4-ethylphenol (with a C* in the high-end of IVOCs) [16], naphthoquinone and phenanthrene (both with C* values in the low-end of IVOCs) [17] all have significant aqSOA yields. These findings call more investigations on a wider coverage of IVOCs species to understand its role in the SOA budget.
In this work, we chose dibenzothiophene (DBT) as one example compound to investigate the possible role of aqueous processing on IVOCs. DBT is one of the PAH compounds, and has been detected in ambient air [10]. DBT is also linked with crude oil and petroleum from which it is removed before further use [18,19], as well as wood-burning [20]. In some cases, DBT is of interest in monitoring marine biota, water and sediments [21]. DBT has a vapor pressure of 2.05 × 10⁻⁴ mm Hg [22] and a C* of ~2.2 × 10³ μg m−3, falling into the low-end of IVOCs. The goal of this work is to study the degradation of DBT, production yields, chemical and optical properties of SOA derived from aqueous oxidation of DBT, highlighting the probability of IVOCs-aqSOA formation and providing parameters likely useful for atmospheric model simulations.

2. Experiments

2.1. Aqueous Oxidation Experiments

In this work, we investigated aqueous oxidation of DBT (99%, Shanghai Macklin) with two types of oxidants. One is hydroxyl radical (OH), introduced by the photolysis of hydrogen peroxide (H2O2, 30%, Sinopharm Chemical Reagent). Another oxidant is organic triplet excited state (3C*), which is a specific oxidant that only exists in condensed phases and is generated via light absorption by organic chromophores [23]. In this work, we used 3,4-dimethoxybenzaldehyde (DMB) (99%, Sigma-Aldrich) as the photosensitizer to generate 3C*. The reaction solutions were 10 μM DBT with 300 μM H2O2 or with 15 μM DMB. A 10 μM amount is higher than the real concentration of DBT in ambient air, and the choice of this concentration is mainly due to the SP-AMS measurement limitations. DBT-aqSOA characterization would be heavily influenced by the background organic impurities in purified water if a lower concentration is used, while if we use a higher concentration, it may be not dissolved completely. A high H2O2 concentration was used to speed up the oxidation (in the order of hours), while a low concentration of DMB (relative to H2O2 concentration) was to make the degradation rate by 3C* comparable to that by OH. In addition, 10.0 mg L−1 ammonium sulfate was added into the reaction solution as an internal standard [24,25,26]. Sulfuric acid (96%, Sinopharm Chemical Reagent) was used to adjust the solution pH to ~5 (close to real values in fog and cloud waters [27]). The pH of the starting solution was checked with a pH meter before each experiment.
Oxidation experiments were conducted in a photo-reactor (BILON, Shanghai, China) equipped with a 1000 W Xe lamp as the light source [17]. The Xe lamp emits a broad UV−Vis light spectrum and those with wavelengths <290 nm were filtered out by Pyrex glass to mimic tropospheric sunlit conditions. Six 150 mL glass vials, each containing 100 mL of solution, were placed equidistantly around the lamp in a circular manner. The temperature of the reaction vessel was controlled at ~25 °C during measurements. The vials were well sealed; therefore, evaporation of precursor/product was expected to be negligible. The vials were wrapped in alumina foils and lights were turned off during dark aging experiments.

2.2. Kinetic Analysis

The concentration of DBT in each sampled solution during oxidation was immediately determined by using a high-performance liquid chromatograph (HPLC) (Waters, USA) with a UV–Vis detector (wavelength of 254 nm was selected) and a C18-WP column (4.6 × 250 mm, 5 μm). The mobile phase was a mixture of methanol and water (w/w, 9:1; isocratic method) with a flow rate of 1 mL/min. The decay of DBT typically obeys apparent pseudo-first-order kinetics, therefore follows the equation below:
( DBT ) t ( DBT ) 0 = exp ( k t )
Here, (DBT)0 and (DBT)tare the initial concentrations of DBT (time = 0) and that during oxidation (time = t). The rate constant (k) can be obtained by fitting the experimental data to Equation (1). Half-lifetimes of DBT oxidations (t1/2) under different scenarios can then be estimated.

2.3. Optical Analysis

Organic carbon (OC) contents of reacted solutions were determined by a total organic carbon (TOC) analyzer (TOC-LCPH, Shimadzu, Japan), and the light absorption spectra were then analyzed by an ultraviolet–visible (UV–Vis) spectrophotometer (8453, Agilent, USA). The light absorption can be converted into an absorption coefficient at a wavelength λ (Absλ) [28,29] according to Equation (2). Aλ refers to absorbance at wavelength λ, A700 is used to correct the baseline shift (average value of 695 nm–705 nm) and L is the optical path length of the quartz tube (1 cm). Furthermore, we calculated the mass absorption efficiency at 365 nm (MAE365, in m2 g−1 C), as an indicator of the light-absorbing ability of the organic species (“brown carbon” (BrC)) generated during aqueous oxidation. The calculation of MAE365 is described in Equation (3). Here, Cmass is the OC concentration measured by the TOC analyzer.
Abs λ = ( A λ A 700 ) · ln ( 10 ) L
MAE 365 = Abs 365 C mass

2.4. Chemical and Factor Analysis

Another series of OH-mediated experiments (as well as the dark control experiment) was conducted by connecting the photo-reactor with an Aerodyne soot particle aerosol mass spectrometer (SP-AMS) [30,31]. The SP-AMS enables us to monitor changes of aqSOA bulk composition in the form of 70 eV electron impact (EI) ionized mass spectrum, and concentration in near real-time (1.5 min time resolution in this work). Experimental setup, SP-AMS operation and data analysis were similar to those described previously in our work [17,32]. Briefly, the reaction vial was connected to a thin line to continuously deliver solution into a clean vial for SP-AMS measurements, and another line allowing the solution to flow back. The reacted solution was then nebulized by using an atomizer. The mist was dehumidified by a diffusion dryer, and the remaining particles were sent to the SP-AMS for analyses. The nebulization mimicked the evaporation of cloud/fog droplets in real atmosphere. Non-refractory species in the particles were evaporated at 600 °C, ionized by 70 eV EI and their mass spectra were recorded by the SP-AMS. The AMS data was processed by using the Igor-based software toolkit SQUIRREL (version 1.56D) and PIKA (version 1.15D).
The mass yields of aqSOA (YSOA) were estimated by using Equation (4) below:
Y SOA = ( aqOrg ) t , AMS ( aqOrg ) 0 , AMS ( Precursor ) reacted
Here, (aqOrg)t, AMS and (aqOrg)0, AMS refer to the concentrations of organic matter detected by AMS (converted to mg L−1 with reference to known sulfate concentration) at time t and time 0, respectively. (Precursor)reacted is the amount of consumed precursor, which can be estimated by the rate expressions determined in Section 2.2.
Moreover, we employed the positive matrix factorization (PMF) model [33] to deconvolve the mass spectral matrix of aqOrg measured by the SP-AMS. The PMF analyses aim to resolve a few factors that can reconstruct the observed time series and mass spectra of aqOrg. The resolved factor is a collection of species with similar properties rather than a single component. Here, ions with mass-to-charge ratio (m/z) up to 300 amu (atomic mass unit) were used for PMF analyses. Note the chemical resolution of SP-AMS is limited to identify ions with m/z >150, therefore we only fitted those with significant signal-to-noise (S/N) ratios. The directly measured organic data matrices, as well as the error matrices, were normalized by sulfate concentrations. The organic matrices were pre-processed according to the procedure listed by Zhang et al. [34,35], including downweight of “weak” values (0.2 < S/N < 2), removal of “bad” values (S/N < 0.2) and downweight of outliers (specific m/zs or time points that lead to large biases on PMF results). We explored the PMF solutions with different numbers of factors and by varying the fpeak from −1 to 1 with a step of 0.1 for 1 to 4 factors. No significant differences were found for the same solution at different fpeak values, we therefore chose the one at fpeak of 0. We finally chose a 3-factor solution to be the best one, and a 3-factor solution is actually common for a few prior PMF analyses on the chamber or aqueous-phase-derived SOA [14,18,36].

3. Results and Discussion

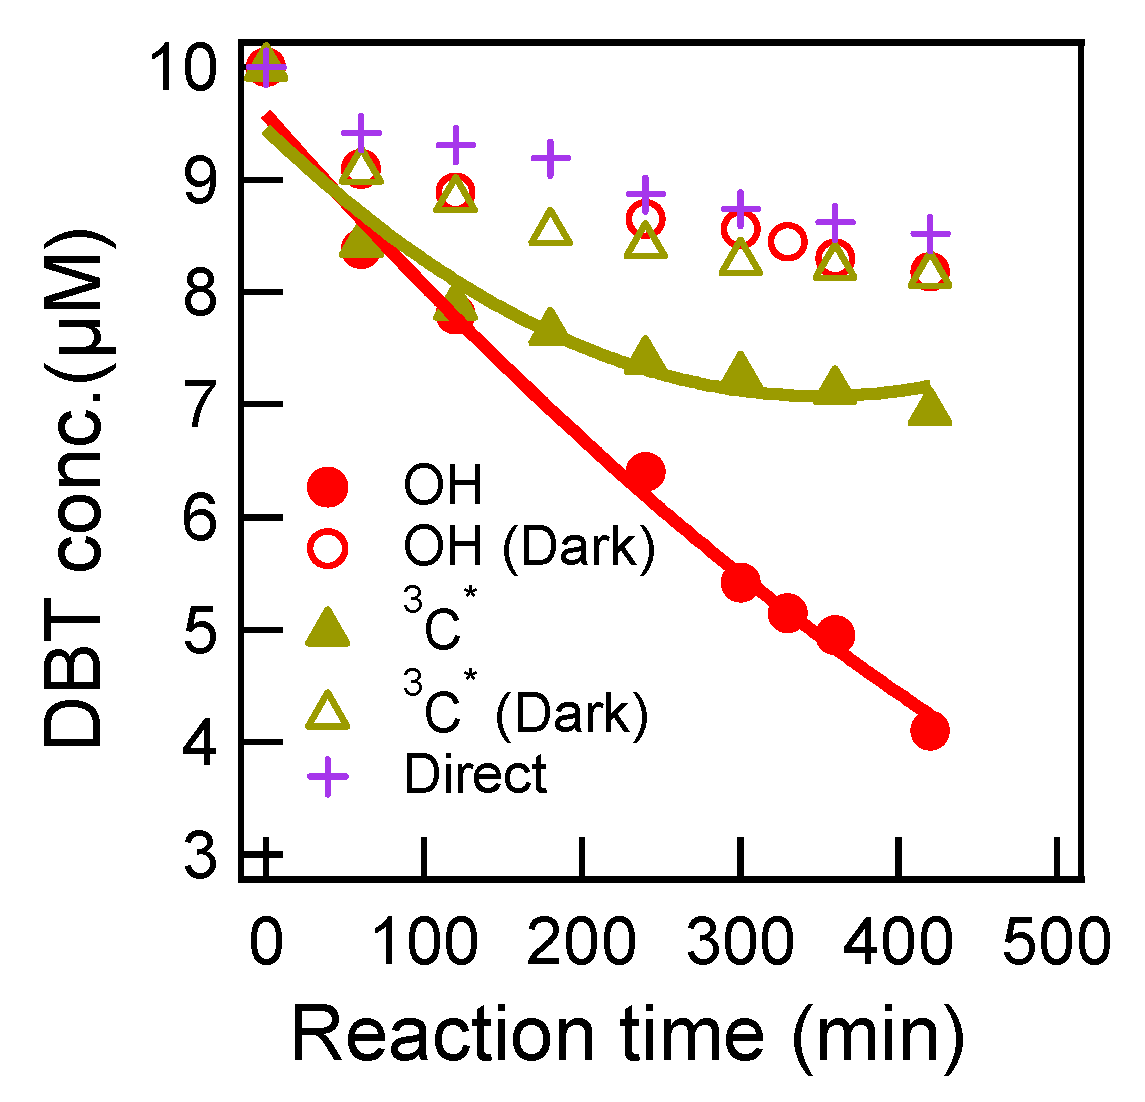
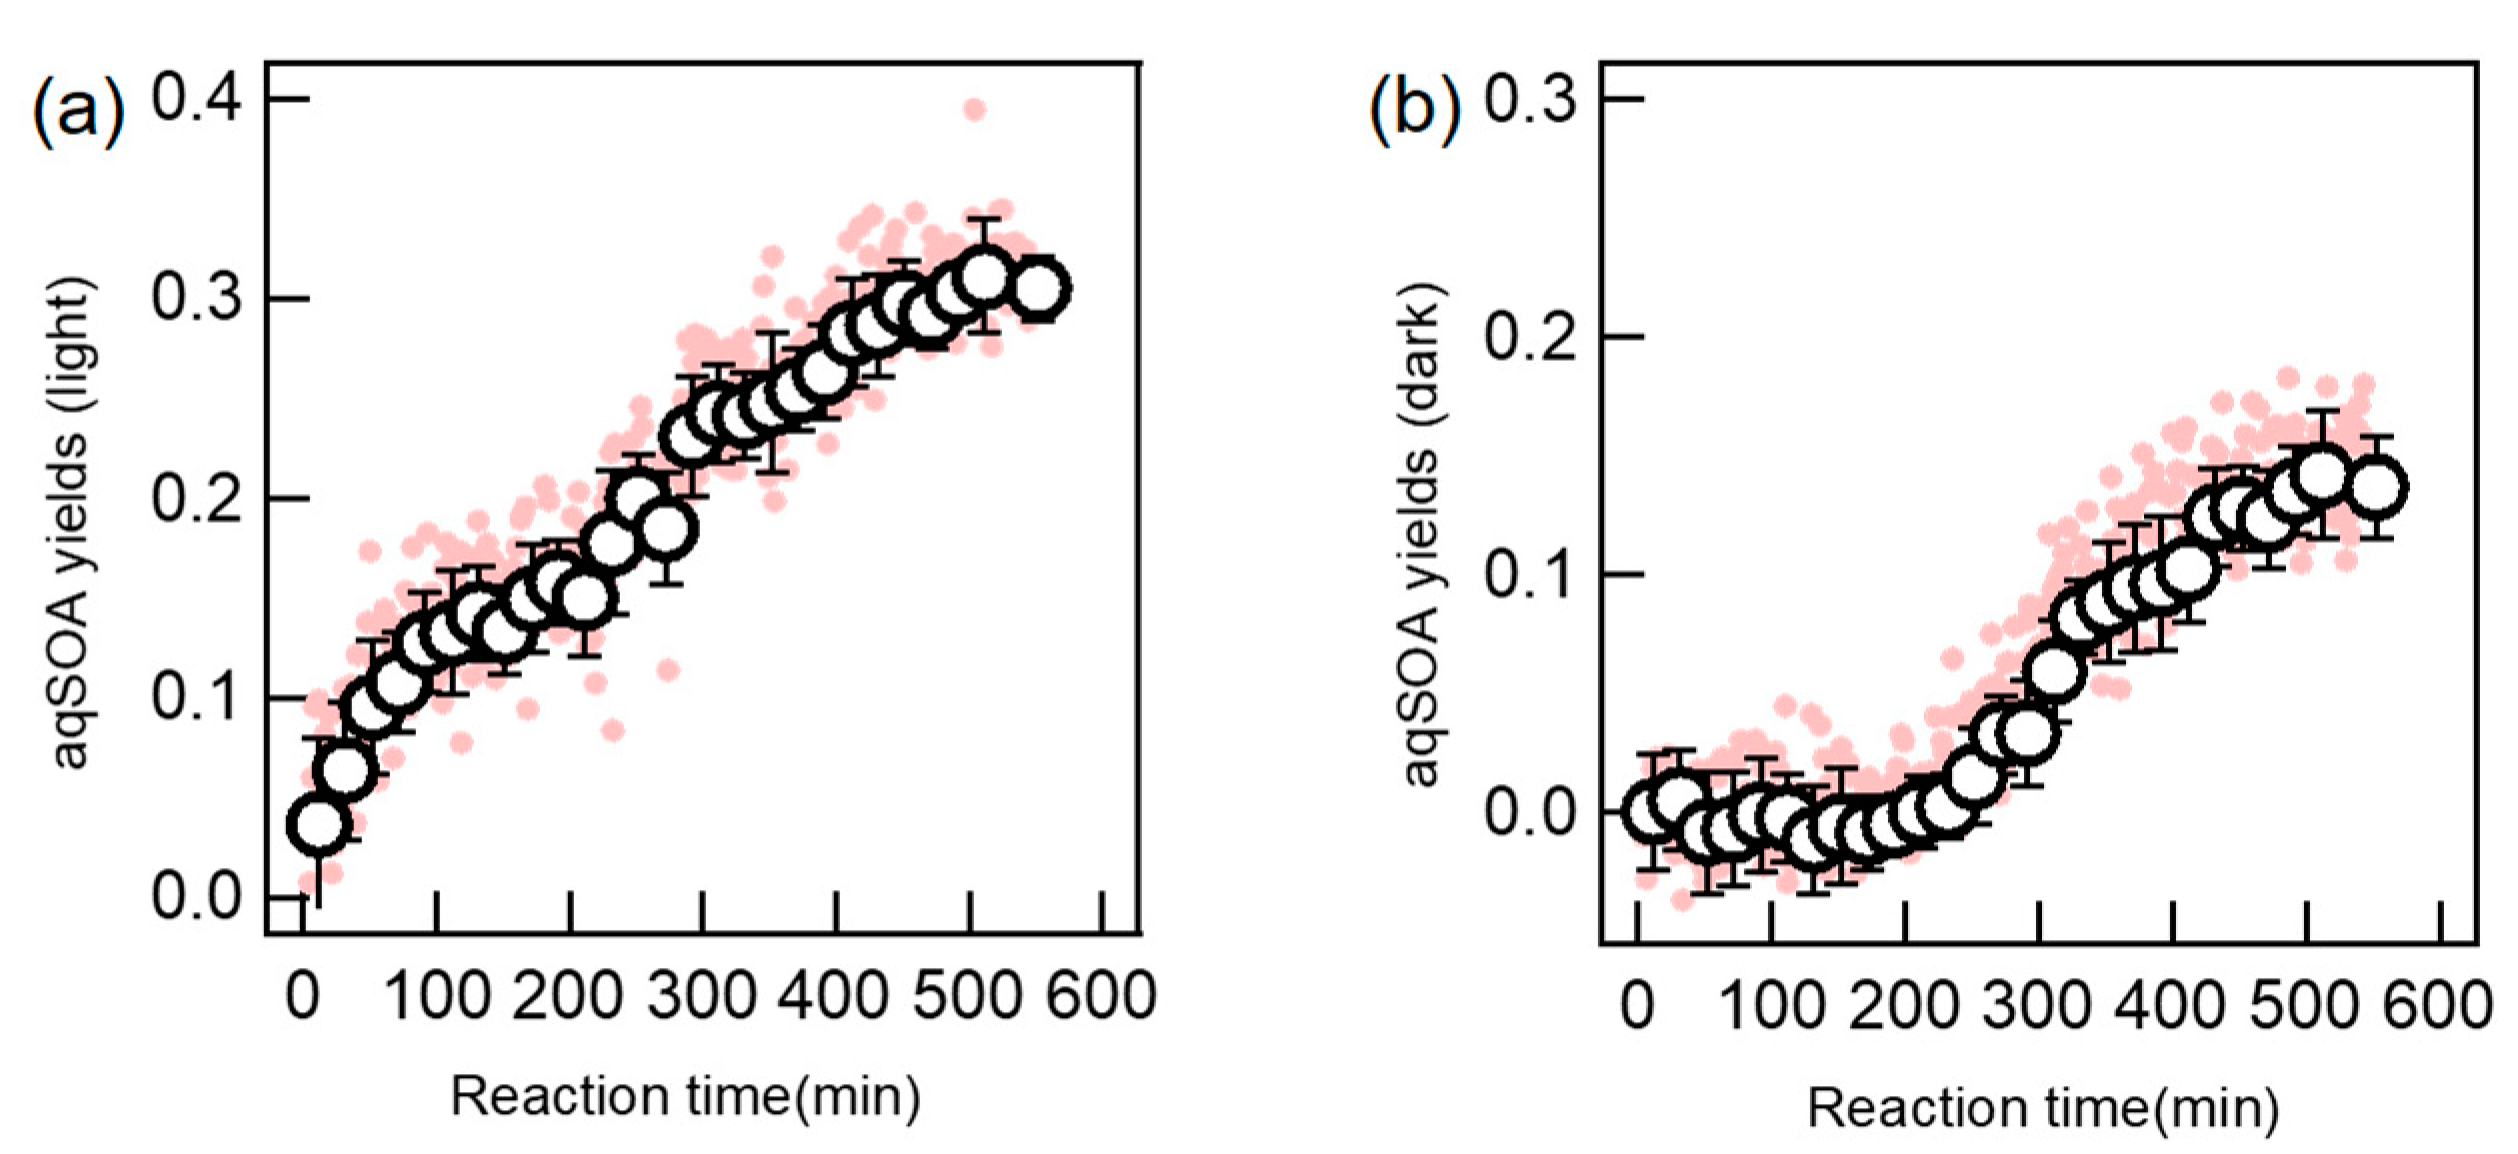
3.1. Precursor Degradation and Mass Yields of aqSOA

Concentrations of DBT during aqueous oxidations under different conditions are shown in Figure 1. Based on Figure 1, we calculated the pseudo-first-order rate constants (and uncertainties) and half-lives, as shown in Table 1. The OH-mediated photochemical degradation of DBT appeared to be the fastest, with a ~60% decay in 420 min, corresponding to a rate constant of 2.03*10−3 min−1 and a half-life of 342 min. Photo-oxidation by 3C* was also significant, but the rate was slower (~32% degradation in 420 min, with a rate constant of 2.03 × 10⁻³ min−1 and half-life of 668 min). However, this was due to that a much smaller concentration of 3C* source of DMB (15 μM) than OH source of H2O2 (300 μM) was used here. Direct oxidant-free photolysis was comparatively slow (~12% degradation in 420 min, with a rate constant of 0.433 × 10⁻³ min−1 and half-life of 1601 min). It is worthy to mention that aqueous oxidation of DBT could also occur under dark conditions. Two dark experiments had similar decay rates (0.532 × 10⁻³ min−1 with DMB, and 0.602 × 10⁻³ min−1 with H2O2), slightly quicker than the direct photolysis rate. Such dark reaction rates were close to those determined for another PAH compound phenanthrene under the same experimental conditions in our previous work [17]. Dark reactions might be caused by oxidation with dissolved O2. In the future, we will bubble the solution before dark aging experiments to remove potential oxidation by O2, and investigate again the dark reactions.
In Figure 2a, we present the aqSOA mass yields during photochemical oxidation of DBT by OH based on online SP-AMS measurements. The experiment lasted about 9 h, thus about two-thirds of the precursor was degraded according to the rate constant in Table 1. The mass yield was found to increase consistently during oxidation and reached ~32% till the end of illumination. It should be noted that the SP-AMS measured mass of organics at the starting point, namely (aqOrg)0, AMS in Equation (4), was significantly larger than zero. This was due to that the precursor DBT might not evaporate completely during nebulization, and some background organic impurities could remain in particle-phase as well. The initial organic mass was subtracted to calculate the aqSOA yield according to Equation (4) and it was ~20% at the precursor’s half-life. As a comparison, we also determined the corresponding aqSOA yields under dark experiment and showed the results in Figure 2b. It seemed that there was no observable increase during the first 250 min (note we prepared the solution and placed it into the reaction vessel as quickly as possible to avoid dark reactions before the test); however, the aqSOA yield increased to ~15% at the end of oxidation, when ~28% DBT was degraded based on the rate expression in Table 1. The measured yields under both light irradiation and dark conditions highlight the significance of SOA formed in aqueous phase from DBT.

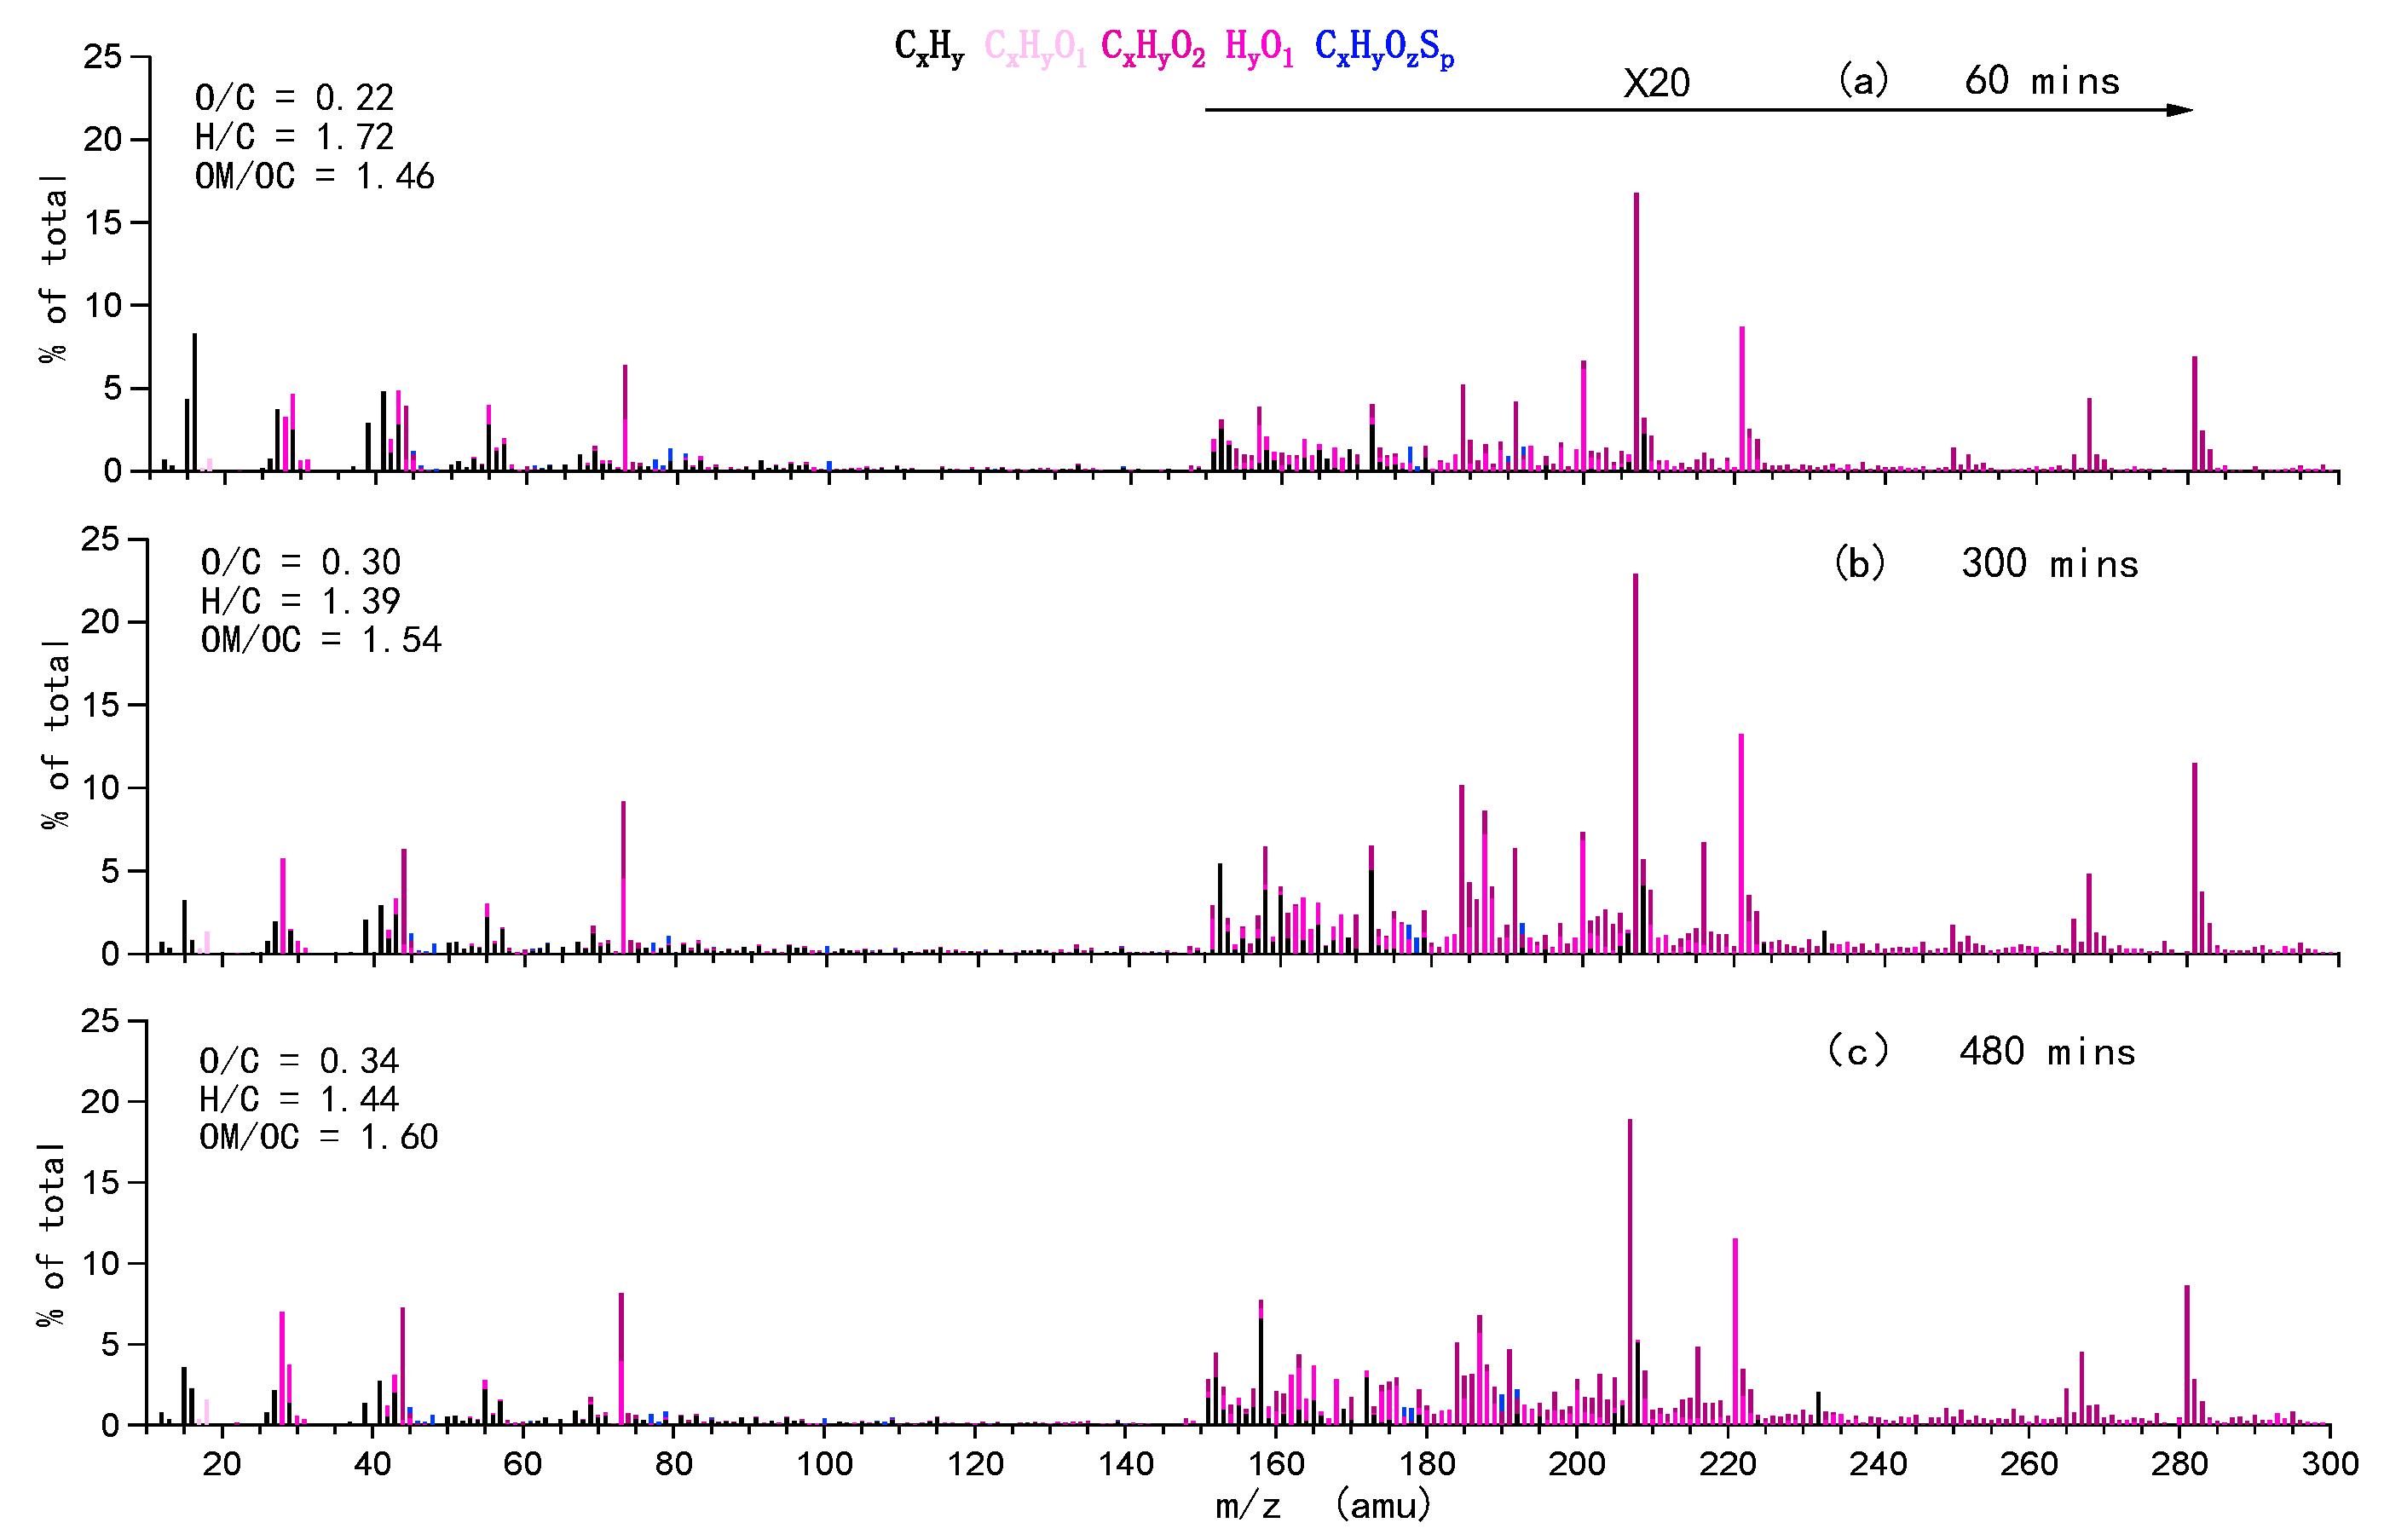
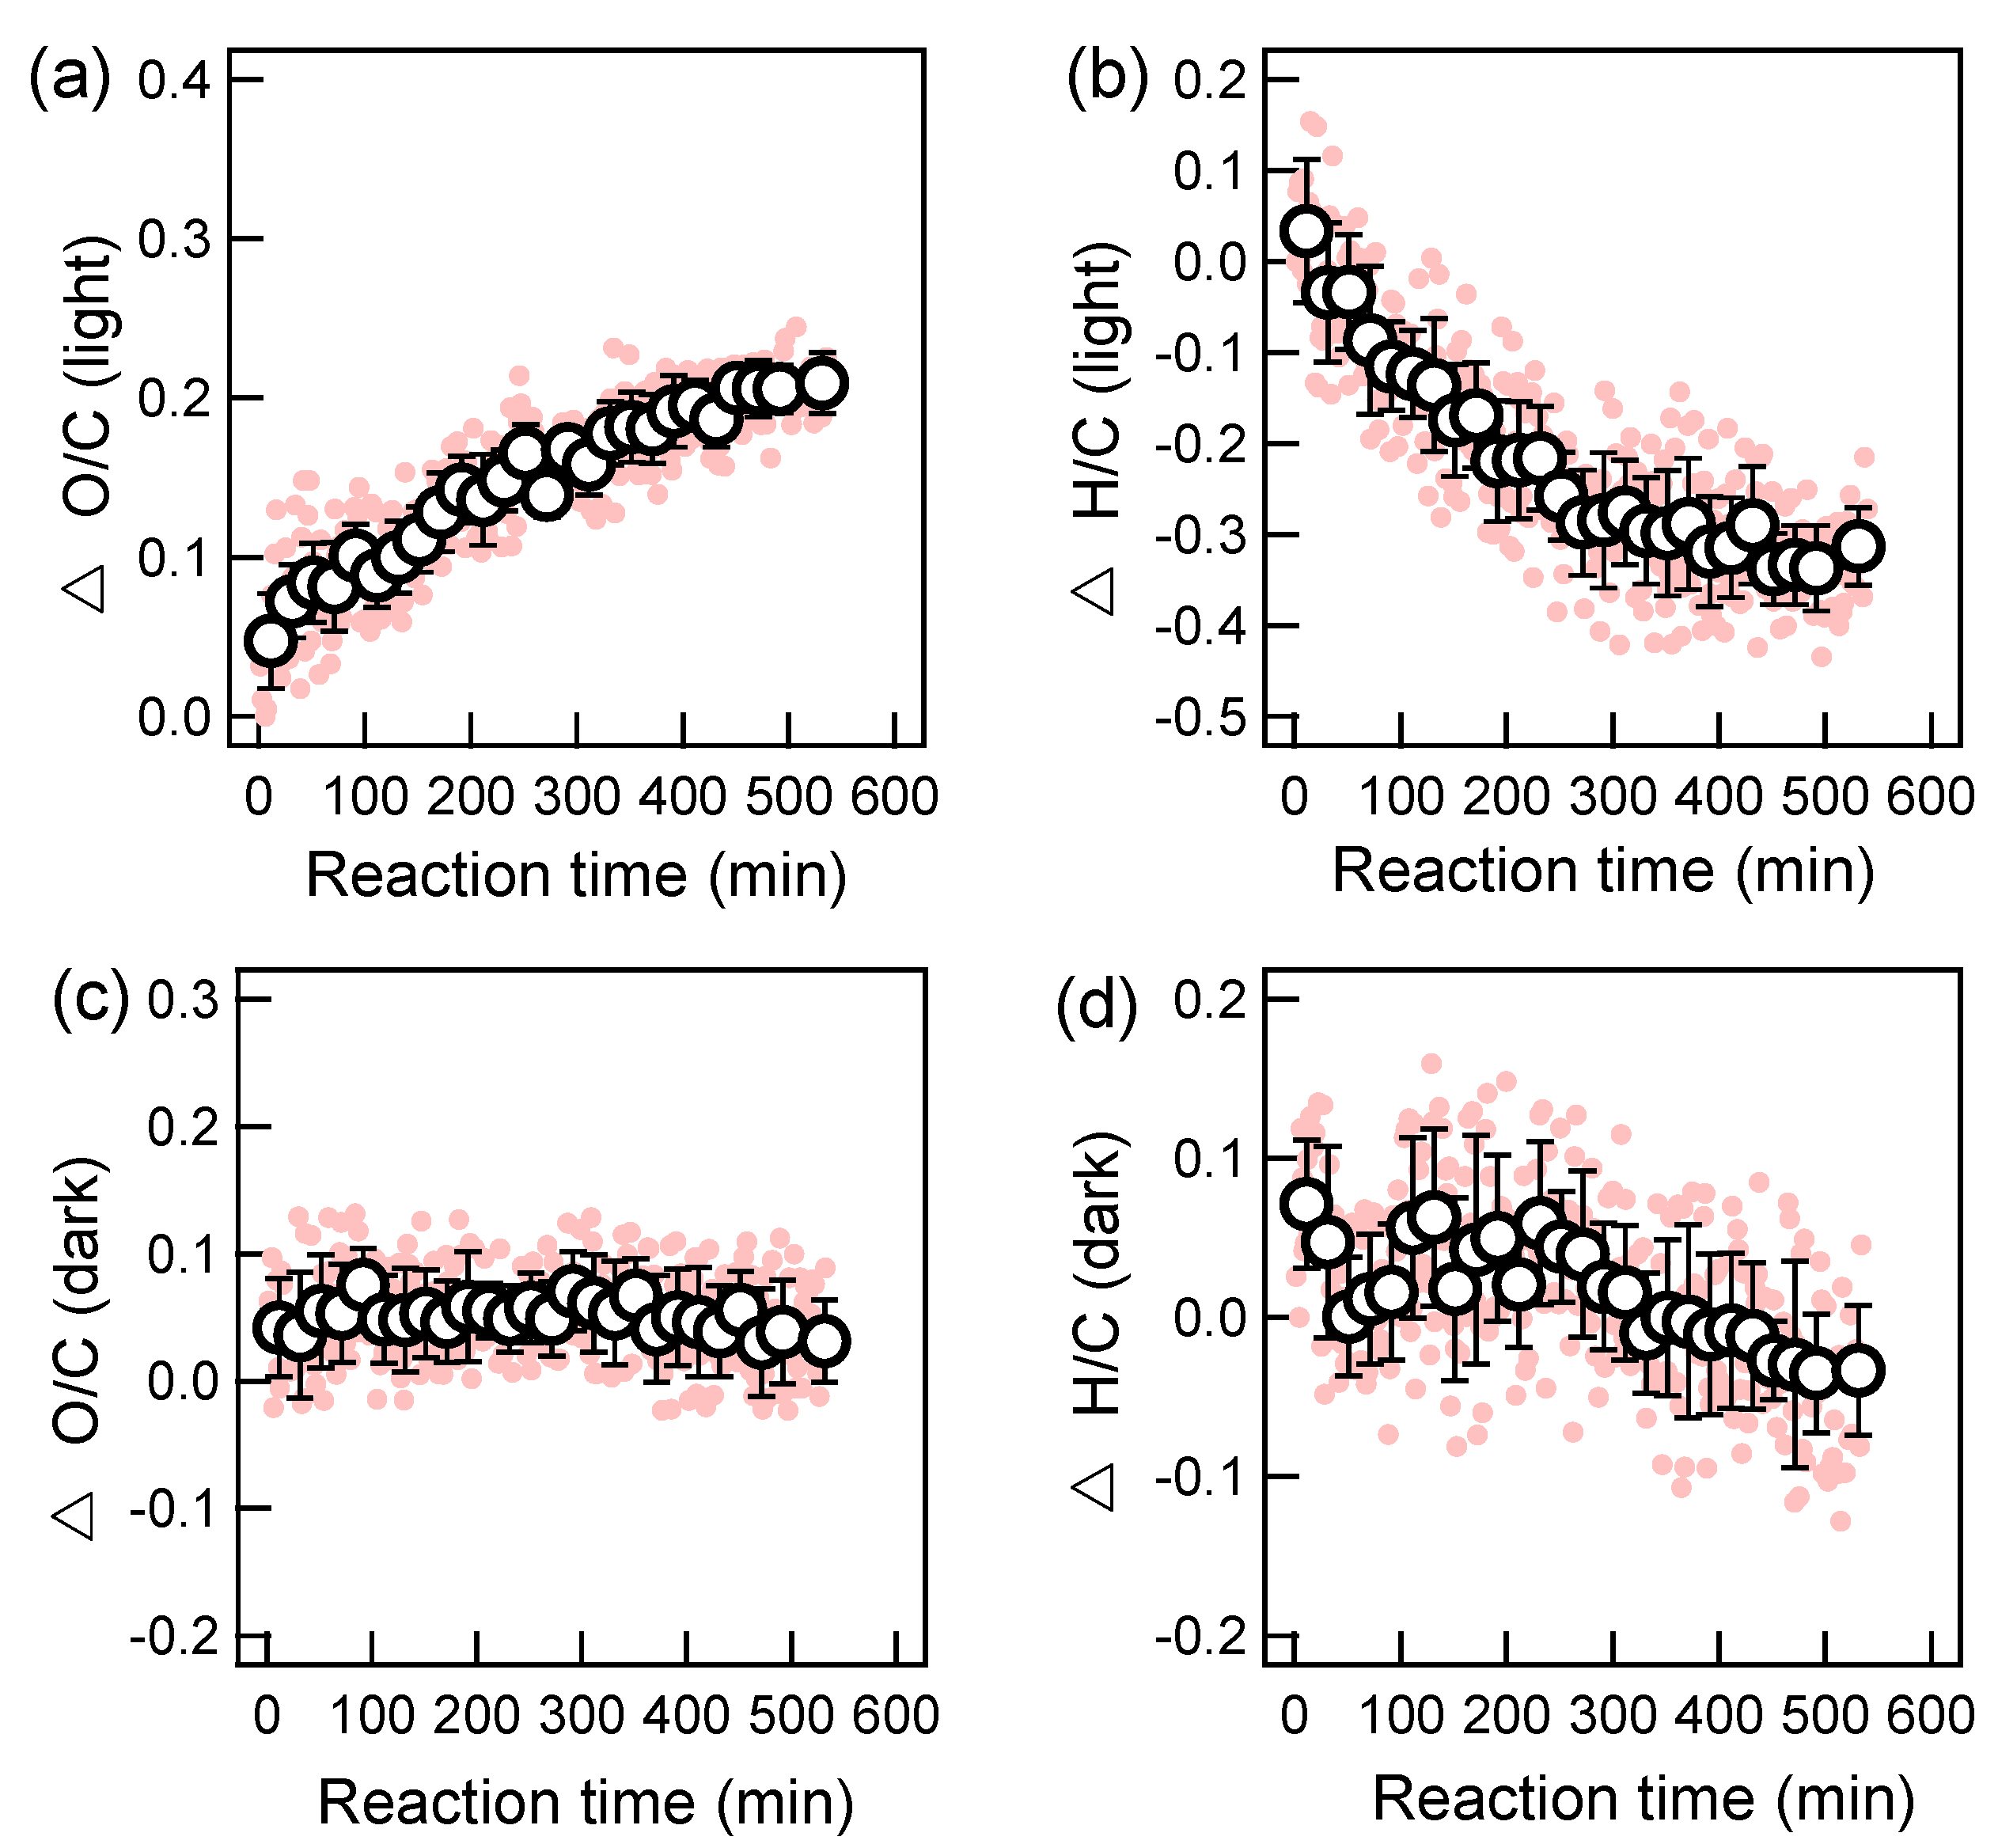
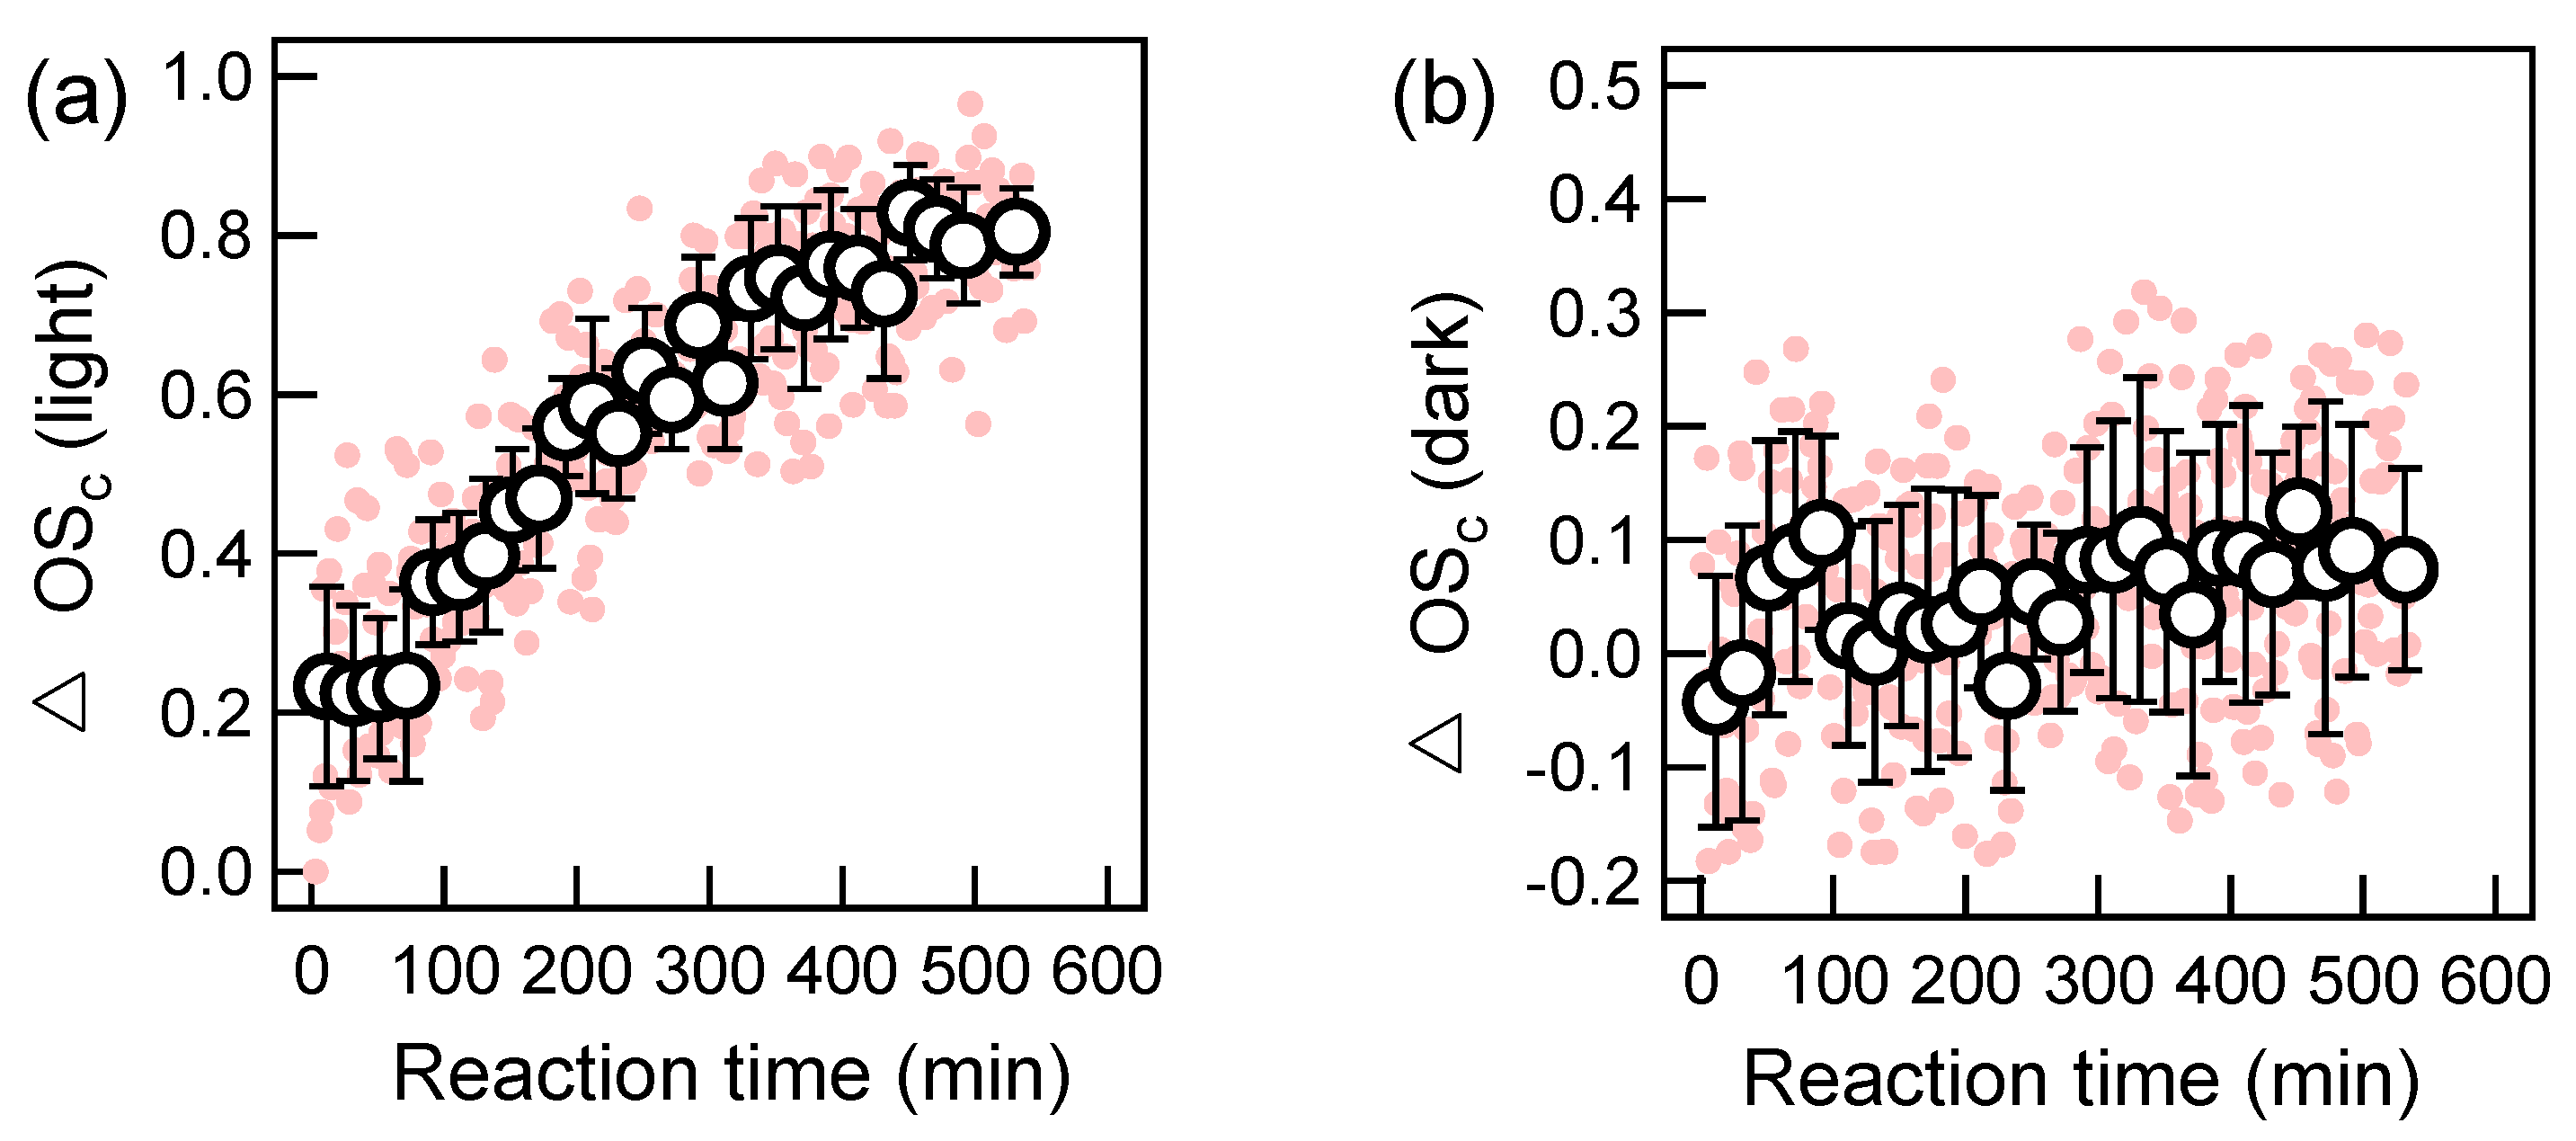
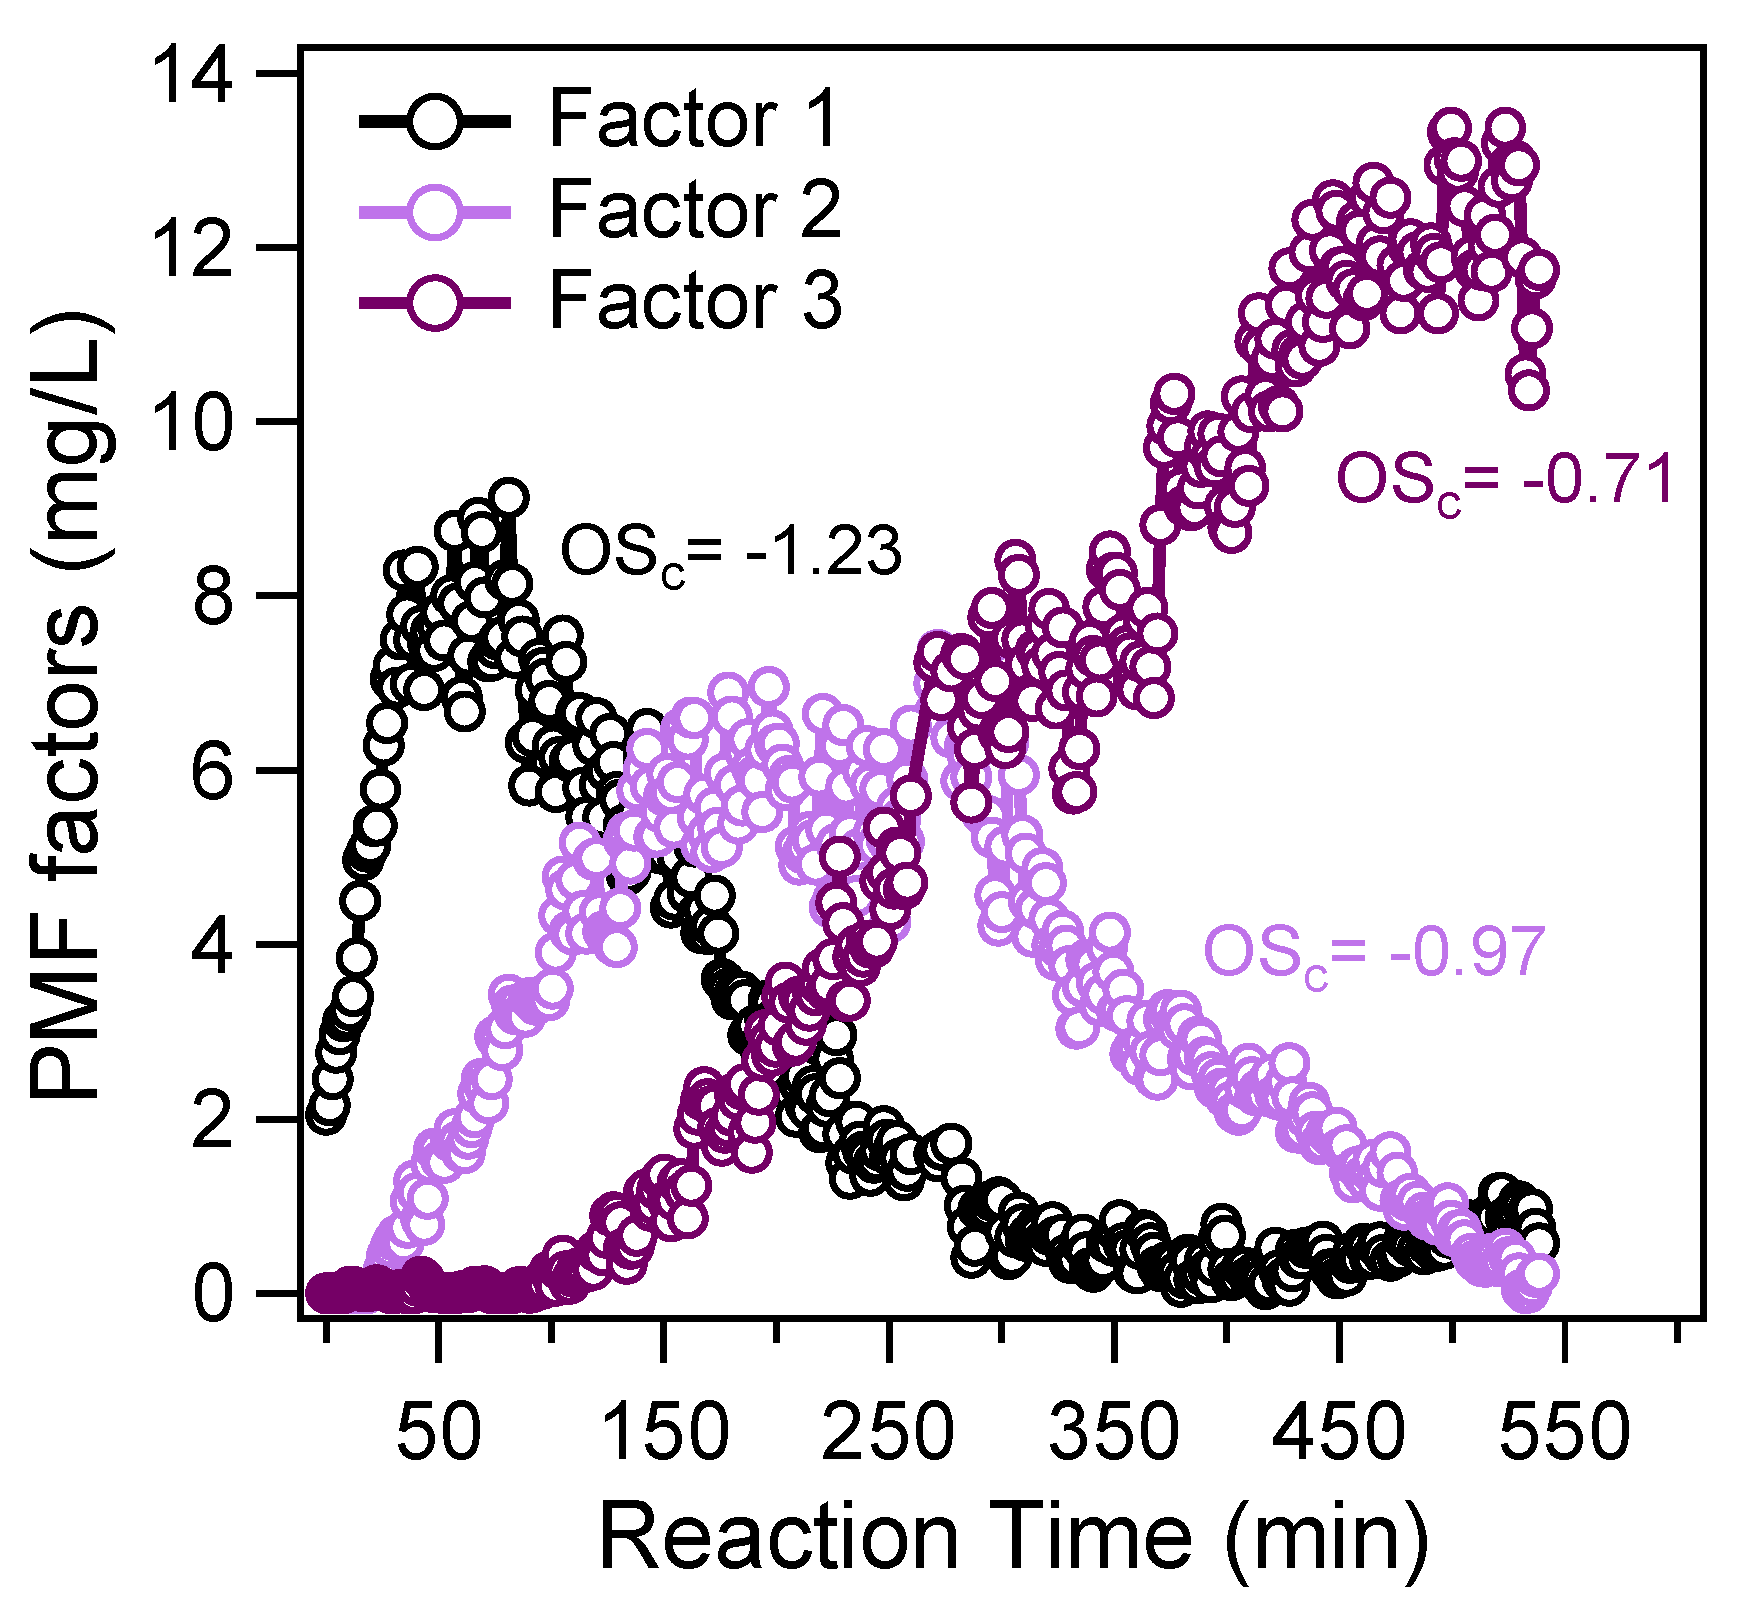
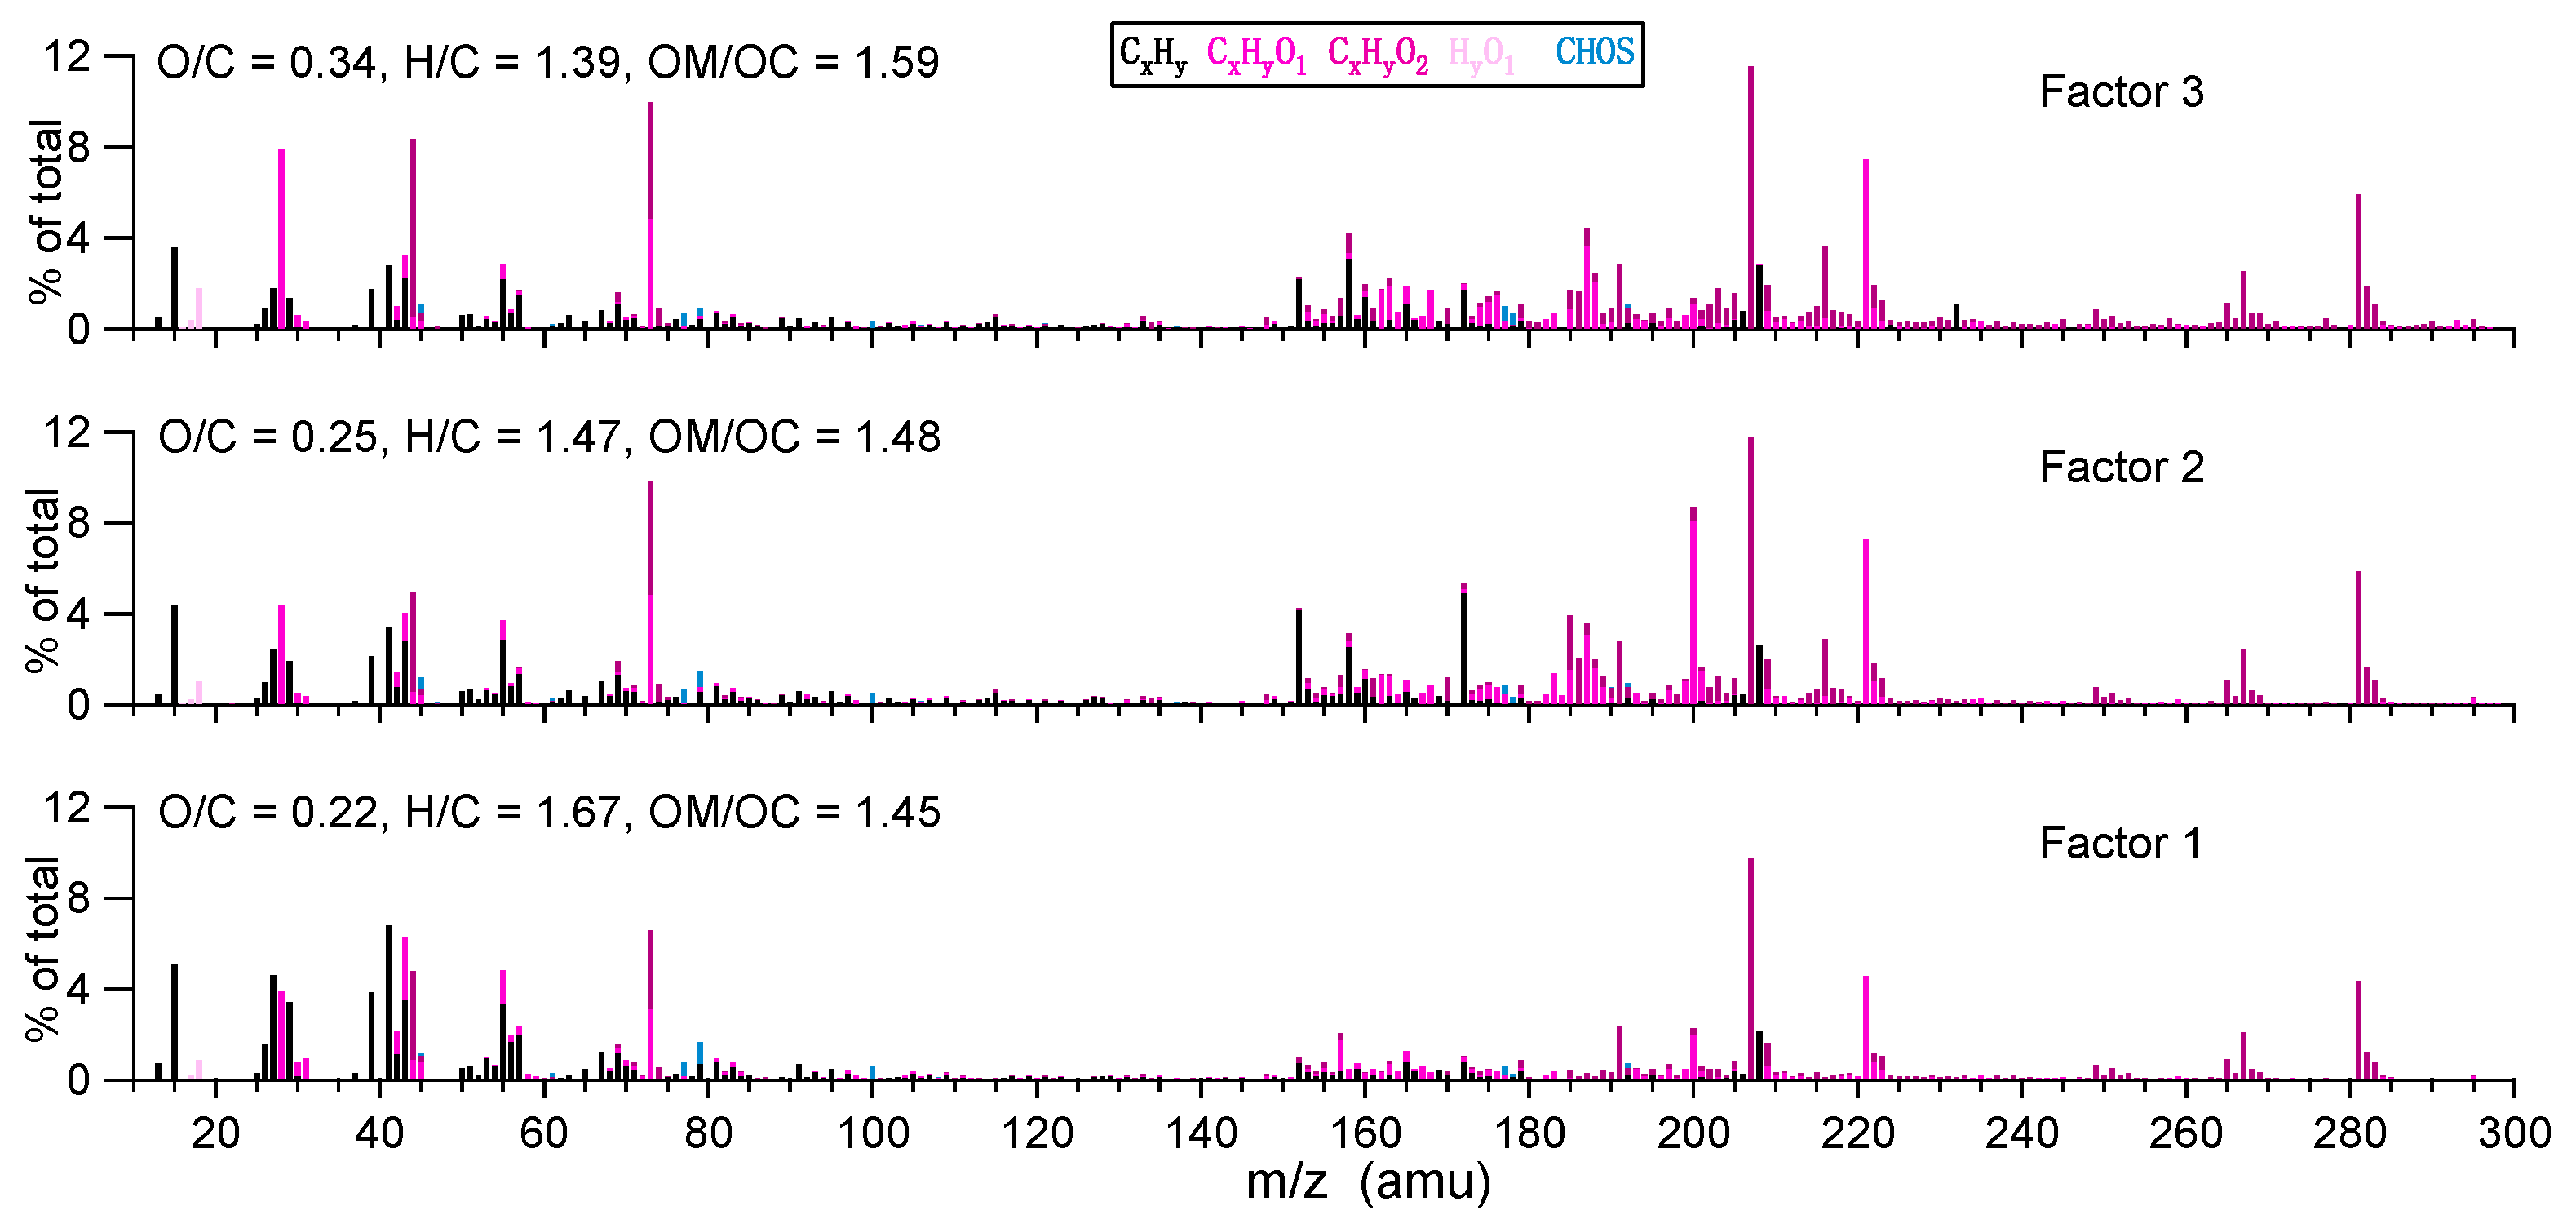
3.2. Chemical Properties and Evolution of aqSOA

During the OH-initiated oxidation experiment, we added ammonium sulfate as an internal standard. It is necessary to check whether or not ammonium sulfate can influence the aqueous oxidation. In this work, we found that sulfate concentration remained the same throughout the course of oxidation, and no significant N-containing fragment ions were found in the aqSOA mass spectra, indicating that both ammonium and sulfate influences were negligible. In fact, ammonium sulfate was used as an internal standard in a number of previous studies [14,24,25,26], and reactions between ammonium sulfate and the precursors were also not found. However, some organic precursors, such as isoprene epoxydiol [34], glycolaldehyde [37], methylglyoxal [38,39], aldehydes [40] and glyoxal [41,42], could react with ammonium. Therefore, interactions between ammonium salts and different organic species in aqueous phases and influences on the SOA are yet to be investigated.
With the SP-AMS, we could obtain an ion-speciated mass spectrum of the organic species from nebulized solution (aqOrg) every 1.5 min. Examples of such mass spectra at 60 min, 300 min and 480 min are shown in Figure 3. Ion fragments with m/z up to 300 amu were fitted. Based on the mass spectra, elemental ratios of the aqOrg measured at each time step were calculated by using the method of Aiken et al [43]. It should be noted that the aqOrg mass at the starting point of reaction (time 0) was not zero; therefore, the SP-AMS determined aqOrg composition might be influenced by unevaporated precursor and background organic impurities. In this case, relative changes rather than absolute values of bulk properties of aqOrg can better reflect the evolution of aqSOA. The relative values were calculated by subtracting the absolute value at time 0 from the corresponding value at time t.
We illustrated the relative changes of the oxygen-to-carbon (O/C) ratio (△O/C) and the hydrogen-to-carbon (H/C) ratio (△H/C) for both photochemical and dark oxidations in Figure 4. Note the absolute O/C and H/C values of the starting aqOrg were 0.14 and 1.38, respectively; while O/C and H/C of pure DBT were 0 and 0.73 (if adjusted by the AMS calibration ratio). Therefore, the starting aqOrg did contain background organics. Nevertheless, during the course of photo-oxidation, we observed a generally continuous increase of O/C and a decrease of H/C. In the end, the increment of O/C was ~0.21, while the decrease of H/C was about -0.3. This result suggests significant oxygen-addition reactions as well as a loss of species with high H/C ratios during photochemical aging. During dark oxidation, the data was largely scattered. In general, no significant changes in O/C were found. Corresponding △H/C ratio showed no obvious changes on average in the first 250 min but decreased to about -0.04 in the end. Note the changes of H/C matched with those of aqSOA yield, suggesting the formation of products with relatively low H/C ratios after 250 min. The oxidation state, calculated as 2 × O/C − H/C [44], is often used as a metric of the oxidation state of OA. The relative changes of OSc (△OSc, also calculated by subtraction of absolute OSc value at time 0 from that at time t) were presented in Figure 5 for both photochemical and dark aged aqSOA as well. In general, △OSc rose significantly to ~0.8 till the end of oxidation, while during the dark aging process it had very large uncertainties, and there was no very clear change after 250 min as those in Figure 1b and Figure 4d. Nevertheless, degradation of DBT did occur in the first 250 min (Figure 2b), yet led to no changes in aqSOA yields, O/C, H/C and OSc. The underlying mechanism of the dark aging process cannot be well resolved by current SP-AMS measurements and should be investigated in the future.
To further elaborate the aqueous oxidation mechanisms, we performed PMF analyses on the aqOrg data matrix. Similar to our and some other previous works [14,17,36], a three-factor solution was resolved. The temporal variations of different factors during the course of photochemical oxidation are shown in Figure 6, and the corresponding factor profiles are presented in Figure 7. Since the aqOrg data matrix obtained under dark had very large uncertainties as can be seen in Figure 4c,d and Figure 5b, PMF analysis was technically impractical and the results were non-robust, therefore they are not discussed here. In fact, the results in Figure 6 had some uncertainties as well due to the very fine time resolution of the SP-AMS measurement. Factor 1, representing the first-generation products, had the smallest OSc (−1.23). Compared with other factors, the starting concentration of Factor 1 was not zero, indicating that this factor also contained unevaporated precursor and background organics. The time series of Factor 1 increased most rapidly among three factors in the initial stage, and reached its maximum mass concentration at ~100 min, then decreased quickly and was completely depleted at ~400 min. Factor 2, with a medium OSc (−0.97), lagged behind Factor 1, reached its peak at ~250 min, then gradually decreased to about zero till the end of oxidation (~540 min). Such behaviors suggest there was very likely a chemical transformation of Factor 1 (first-generation products) to Factor 2 (second-generation products). Factor 3 increased continuously throughout the illumination, and it has the highest OSc (−0.70) among the three factors. Both Factor 1 and Factor 2 initially formed could contribute to Factor 3 during the oxidation. It should be noted that PMF factors can be used to describe the average particle composition during specific time periods of the experiment [45], but they may not be directly attributed to distinct chemical groups and oxidation generations. A better way to elucidate the aqSOA evolution can be fulfilled by investigating the temporal variations of tracer compounds generated from different reaction pathways. In this regard, molecular identification and quantification of the products sampled during different stages of oxidation are needed.

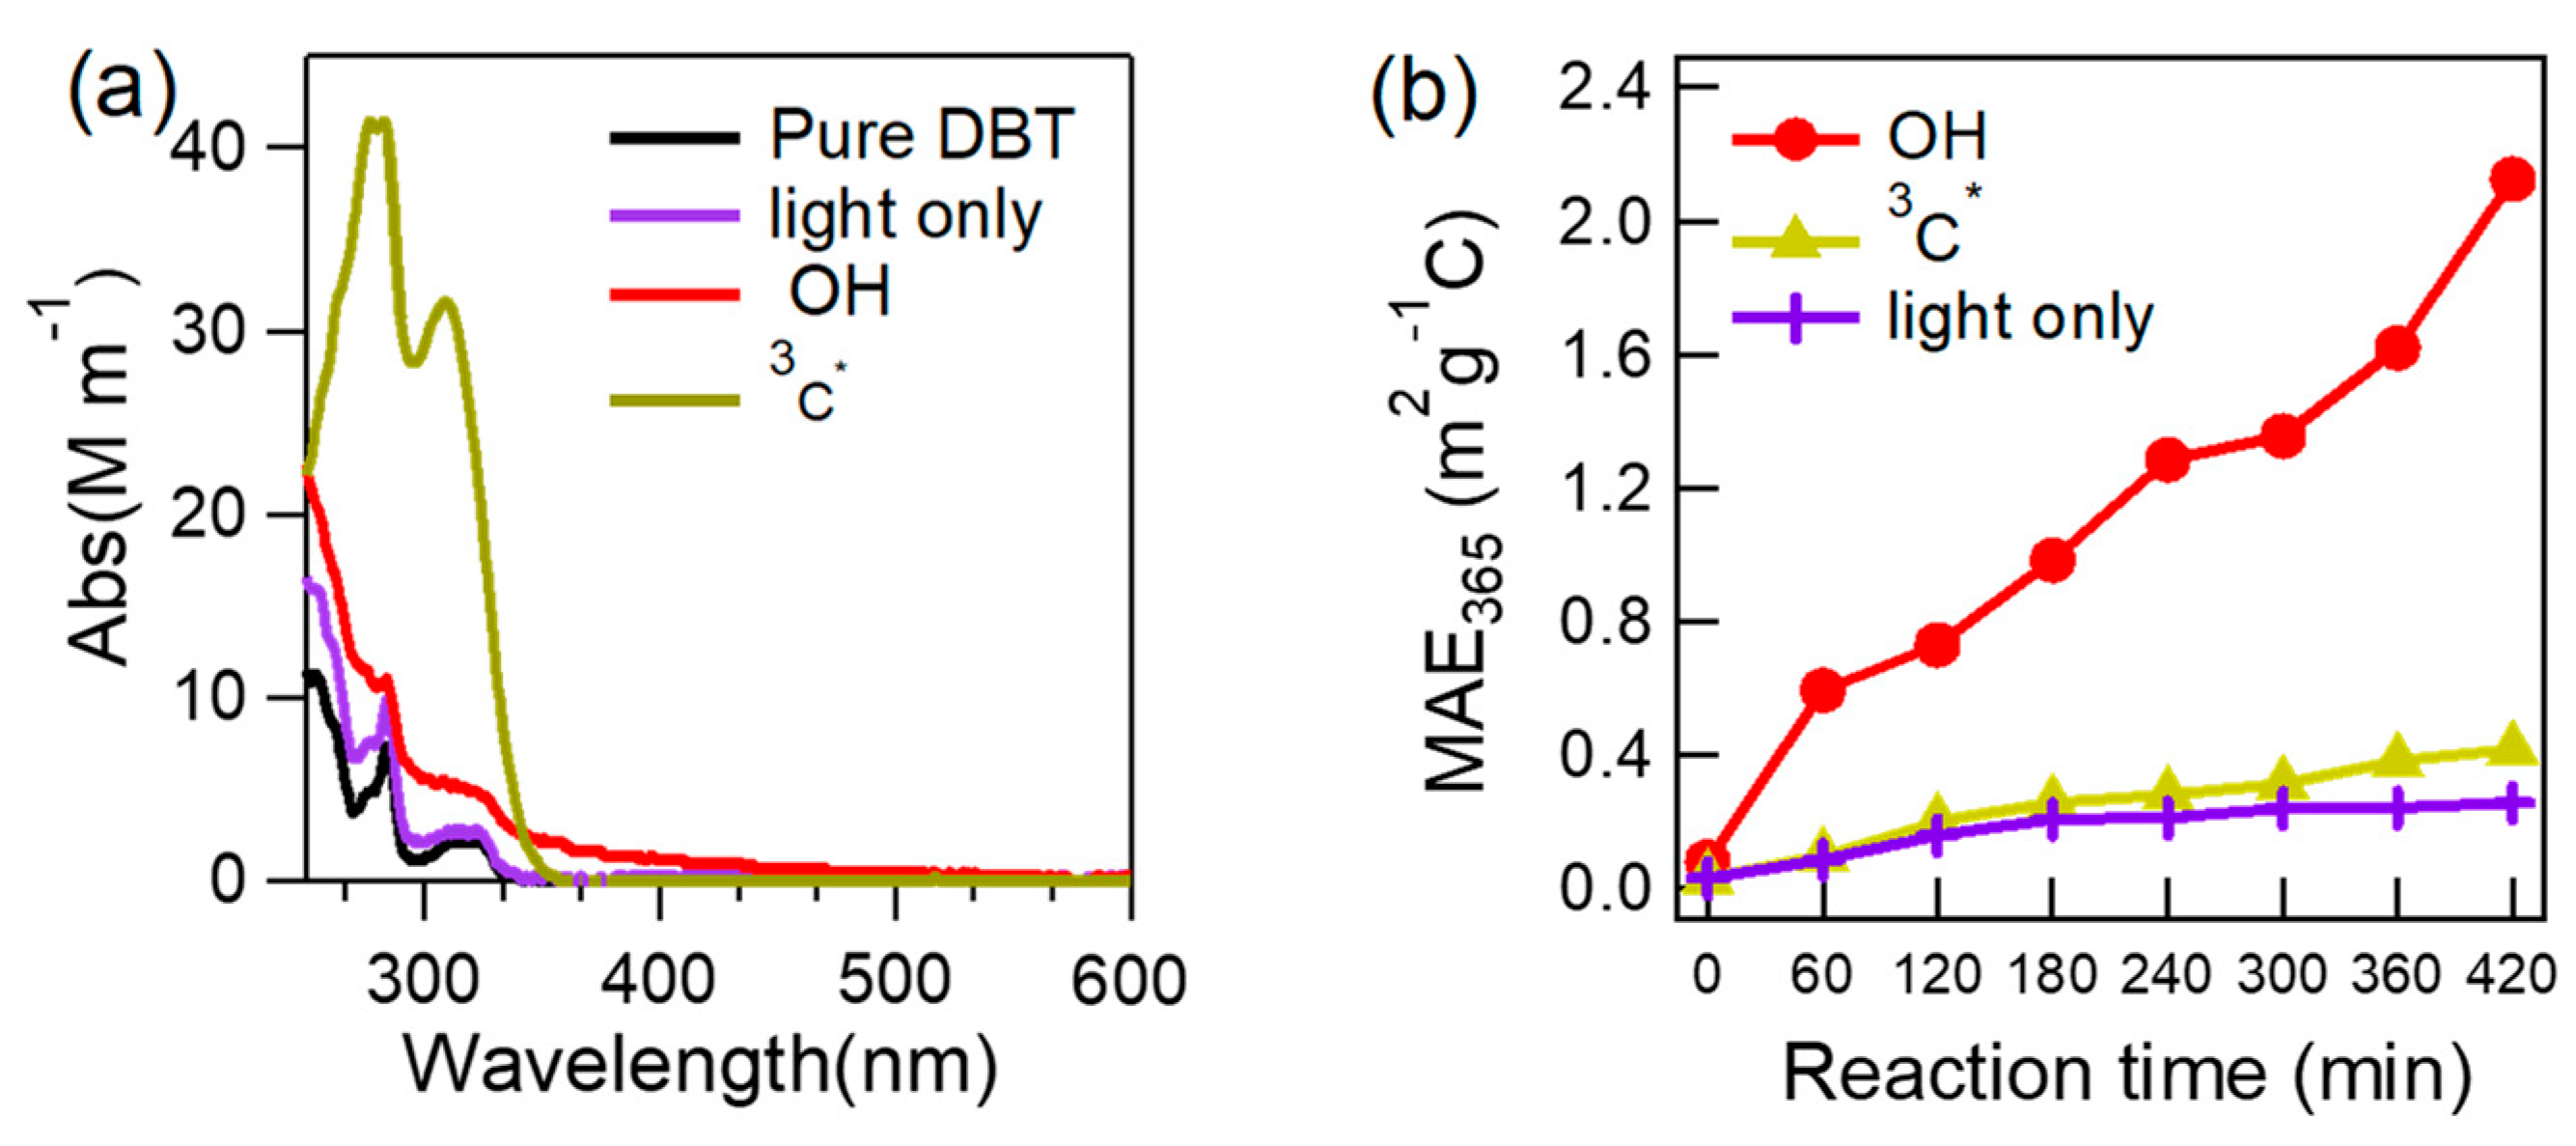
3.3. Optical Properties of Illuminated Solutions

To probe whether or not aqueous oxidation can enhance the light absorption of DBT, we measured light absorption spectra of the starting pure DBT solution, and the final solutions upon direct photolysis, OH-oxidation and 3C*-oxidation, respectively (Figure 8a). Results show that aqueous oxidation under different conditions all can increase light absorption of the precursor. Direct illuminated solution, however, mainly led to appreciable increase in the short-wavelength ultraviolet light range (<300 nm), while illuminated solution by OH also had significant enhancement over 300 nm. A very large absorption enhancement below 350 nm was observed for 3C*-oxidized solution, but this was mainly due to light absorption by 3C* itself, rather than the aqSOA products; light enhancement above 350 nm due to products was in fact small.
We further used the mass (using OC mass) normalized absorption coefficient at 365 nm, also known as MAE365, to assess the light-absorbing ability of aqueous-phase processed solutions. Corresponding to Figure 1, MAE365 values of solutions during different times were determined and shown in Figure 8b. MAE365 was found to increase in all processes, indicating aqueous oxidation leads to BrC formation. The magnitude of the enhancement by direct light irradiation (up to 0.26 m2 g−1C), and the 3C*-mediated reactions (up to 0.42 m2 g−1C), were relatively small. Their MAE365 values were lower than those observed in urban areas [29]; however, remarkable photo-enhancement was found during the course of OH-initiated photo-oxidation (up to 2.13 m2 g−1C), suggesting aqueous reactions by OH can be a significant source of BrC.

4. Conclusions and Implications

This work conducted aqueous oxidation experiments on an IVOCs model compound, DBT. We showed that DBT decayed under both OH and organic triplet excited state (3C*) oxidations. Direct light irradiation could lead to photo-degradation too but to a much lesser extent. Based on our experimental condition, DBT could degrade under dark, with rate constants even higher than that of direct photolysis, yet more tests are still needed to verify the significance of dark oxidation. In the future, second-order rate constants should be investigated for a better evaluation of the decay kinetics. The aqSOA yields of OH-initiated photo-oxidation and dark oxidation were determined to be ~32% and ~15%, respectively. The oxidation degree of aqSOA increased remarkably during OH-mediated oxidation, but insignificantly during dark aging. However, the dark oxidation might be influenced by the presence of molecular O2, and control experiments where oxygen is removed from the system should be investigated to reveal the detailed mechanism of dark oxidation. PMF analyses resolved three factors of the aqSOA from OH photo-oxidation. It was found that there was an initial formation of relatively less oxygenated first- and second-generation products, and they could chemically transform into highly oxygenated third-generation products in different stages of oxidation. In addition, light absorption measurements showed OH-mediated aqueous oxidation was a significant source of BrC.
Overall, our findings in this work demonstrate that aqueous oxidation of IVOCs (photochemical or dark aging) can be a source of SOA, pointing out a likely additional SOA source not previously considered. Our experiments mimicked the cloudy/foggy conditions. Similar processes may occur in wet aerosols but require further investigations. Of course, studies on more IVOCs with diverse saturation vapor pressures, water solubility as well as molecular structures, are highly needed to obtain a full understanding of the probabilities and significances of IVOCs-aqSOA. If it is important, aqueous processing of IVOCs should be implemented in atmospheric models to facilitate accurate simulation of SOA. In addition, our work shows that IVOCs-aqSOA (especially from OH-oxidation) is a source of BrC, therefore this process may play a role in aerosol light absorption, radiative forcing, as well as climate change.

Author Contributions

Conceptualization, Z.Y. and X.G.; data curation, Y.C. and X.G.; Formal analysis, Y.L. (Yu Liu), J.L., Y.C., Y.L. (Yue Liu) and Z.Y.; funding acquisition, X.G.; methodology, Y.L. (Yu Liu), J.L., Y.C. and Z.Y.; project administration, X.G.; writing—original draft, Y.L. (Yu Liu); writing—review and editing, X.G. All authors have read and agreed to the published version of the manuscript.

Funding

This research was funded by the Natural Science Foundation of China (NSFC) (grant number 91544220 and 21976093), and the Jiangsu Natural Science Foundation (grant number BK20181476).

Conflicts of Interest

The authors declare no conflicts of interest.

References

  1. Hallquist, M.; Wenger, J.C.; Baltensperger, U.; Rudich, Y.; Simpson, D.; Claeys, M.; Dommen, J.; Donahue, N.M.; George, C.; Goldstein, A.H.; et al. The formation, properties and impact of secondary organic aerosol: Current and emerging issues. Atmos. Chem. Phys. 2009, 9, 5155–5236. [Google Scholar] [CrossRef] [Green Version]
  2. Barsanti, K.C.; Kroll, J.H.; Thornton, J.A. Formation of Low-Volatility Organic Compounds in the Atmosphere: Recent Advancements and Insights. J. Phys. Chem. Lett. 2017. [Google Scholar] [CrossRef]
  3. Ervens, B.; Turpin, B.J.; Weber, R.J. Secondary organic aerosol formation in cloud droplets and aqueous particles (aqSOA): A review of laboratory, field and model studies. Atmos. Chem. Phys. 2011, 11, 11069–11102. [Google Scholar] [CrossRef] [Green Version]
  4. Ge, X.; Zhang, Q.; Sun, Y.; Ruehl, C.R.; Setyan, A. Effect of aqueous-phase processing on aerosol chemistry and size distributions in Fresno, California, during wintertime. Environ. Chem. 2012, 9, 221–235. [Google Scholar] [CrossRef]
  5. Presto, A.A.; Hennigan, C.J.; Nguyen, N.T.; Robinson, A.L. Determination of Volatility Distributions of Primary Organic Aerosol Emissions from Internal Combustion Engines Using Thermal Desorption Gas Chromatography Mass Spectrometry. Aerosol Sci. Technol. 2012, 46, 1129–1139. [Google Scholar] [CrossRef] [Green Version]
  6. Zhao, Y.; Nguyen, N.T.; Presto, A.A.; Hennigan, C.J.; May, A.A.; Robinson, A.L. Intermediate Volatility Organic Compound Emissions from On-Road Diesel Vehicles: Chemical Composition, Emission Factors, and Estimated Secondary Organic Aerosol Production. Environ. Sci. Technol. 2015, 49, 11516–11526. [Google Scholar] [CrossRef] [PubMed]
  7. Drozd, G.T.; Zhao, Y.; Saliba, G.; Frodin, B.; Maddox, C.; Chang, M.C.O.; Maldonado, H.; Sardar, S.; Weber, R.J.; Robinson, A.L.; et al. Detailed Speciation of Intermediate Volatility and Semivolatile Organic Compound Emissions from Gasoline Vehicles: Effects of Cold Starts and Implications for Secondary Organic Aerosol Formation. Environ. Sci. Technol. 2018, 53, 1706–1714. [Google Scholar] [CrossRef] [PubMed]
  8. Huang, C.; Hu, Q.; Li, Y.; Tian, J.; Ma, Y.; Zhao, Y.; Feng, J.; An, J.; Qiao, L.; Wang, H.; et al. Intermediate Volatility Organic Compound Emissions from a Large Cargo Vessel Operated under Real-World Conditions. Environ. Sci. Technol. 2018, 52, 12934–12942. [Google Scholar] [CrossRef]
  9. Cross, E.S.; Hunter, J.F.; Carrasquillo, A.J.; Franklin, J.P.; Herndon, S.C.; Jayne, J.T.; Worsnop, D.R.; Miake-Lye, R.C.; Kroll, J.H. Online measurements of the emissions of intermediate-volatility and semi-volatile organic compounds from aircraft. Atmos. Chem. Phys. 2013, 13, 7845–7858. [Google Scholar] [CrossRef] [Green Version]
  10. Chan, A.W.H.; Kreisberg, N.M.; Hohaus, T.; Campuzano-Jost, P.; Zhao, Y.; Day, D.A.; Kaser, L.; Karl, T.; Hansel, A.; Teng, A.P.; et al. Speciated measurements of semivolatile and intermediate volatility organic compounds (S/IVOCs) in a pine forest during BEACHON-RoMBAS 2011. Atmos. Chem. Phys. 2016, 16, 1187–1205. [Google Scholar] [CrossRef] [Green Version]
  11. Li, W.; Li, L.; Chen, C.-l.; Kacarab, M.; Peng, W.; Price, D.; Xu, J.; Cocker, D.R. Potential of select intermediate-volatility organic compounds and consumer products for secondary organic aerosol and ozone formation under relevant urban conditions. Atmos. Environ. 2018, 178, 109–117. [Google Scholar] [CrossRef] [Green Version]
  12. Zhao, Y.; Hennigan, C.J.; May, A.A.; Tkacik, D.S.; de Gouw, J.A.; Gilman, J.B.; Kuster, W.C.; Borbon, A.; Robinson, A.L. Intermediate-volatility organic compounds: a large source of secondary organic aerosol. Environ. Sci. Technol. 2014, 48, 13743–13750. [Google Scholar] [CrossRef] [PubMed]
  13. Zhao, Y.; Lambe, A.T.; Saleh, R.; Saliba, G.; Robinson, A.L. Secondary Organic Aerosol Production from Gasoline Vehicle Exhaust: Effects of Engine Technology, Cold Start, and Emission Certification Standard. Environ. Sci. Technol. 2018, 52, 1253–1261. [Google Scholar] [CrossRef] [PubMed]
  14. Huang, D.D.; Zhang, Q.; Cheung, H.H.Y.; Yu, L.; Zhou, S.; Anastasio, C.; Smith, J.D.; Chan, C.K. Formation and Evolution of aqSOA from Aqueous-Phase Reactions of Phenolic Carbonyls: Comparison between Ammonium Sulfate and Ammonium Nitrate Solutions. Environ. Sci. Technol. 2018, 52, 9215–9224. [Google Scholar] [CrossRef]
  15. Grossman, J.N.; Stern, A.P.; Kirich, M.L.; Kahan, T.F. Anthracene and pyrene photolysis kinetics in aqueous, organic, and mixed aqueous-organic phases. Atmos. Environ. 2016, 128, 158–164. [Google Scholar] [CrossRef]
  16. Ye, Z.; Qu, Z.; Ma, S.; Luo, S.; Chen, Y.; Chen, H.; Chen, Y.; Zhao, Z.; Chen, M.; Ge, X. A comprehensive investigation of aqueous-phase photochemical oxidation of 4-ethylphenol. Sci. Total Environ. 2019, 685, 976–985. [Google Scholar] [CrossRef]
  17. Lu, J.; Ge, X.; Liu, Y.; Chen, Y.; Xie, X.; Ou, Y.; Ye, Z.; Chen, M. Significant secondary organic aerosol production from aqueous-phase processing of two intermediate volatility organic compounds. Atmos. Environ. 2019, 211, 63–68. [Google Scholar] [CrossRef]
  18. Craven, J.S.; Yee, L.D.; Ng, N.L.; Canagaratna, M.R.; Loza, C.L.; Schilling, K.A.; Yatavelli, R.L.N.; Thornton, J.A.; Ziemann, P.J.; Flagan, R.C.; et al. Analysis of secondary organic aerosol formation and aging using positive matrix factorization of high-resolution aerosol mass spectra: application to the dodecane low-NOx system. Atmos. Chem. Phys. 2012, 12, 11795–11817. [Google Scholar] [CrossRef] [Green Version]
  19. Ho, T.C. Deep HDS of diesel fuel: chemistry and catalysis. Catalysis Today 2004, 98, 3–18. [Google Scholar] [CrossRef]
  20. Hays, M.D. Nature of unresolved complex mixture in size-distributed emissions from residential wood combustion as measured by thermal desorption-gas chromatography-mass spectrometry. J. Geophys. Res. 2004, 109. [Google Scholar] [CrossRef] [Green Version]
  21. Appendix c. List of Determinands Assessed; Europen Environment Agency: Copenhagen, Denmark, 2008.
  22. Chao, J.; Lin, C.T.; Chung, T.H. Vapor Pressure of Coal Chemicals. J. Phys. Chem. Ref. Data 1983, 12, 1033–1063. [Google Scholar] [CrossRef]
  23. Chen, H.; Ge, X.; Ye, Z. Aqueous-Phase Secondary Organic Aerosol Formation Via Reactions with Organic Triplet Excited States—a Short Review. Curr. Pollut. Rep. 2018, 4, 8–12. [Google Scholar] [CrossRef]
  24. Yu, L.; Smith, J.; Laskin, A.; Anastasio, C.; Laskin, J.; Zhang, Q. Chemical characterization of SOA formed from aqueous-phase reactions of phenols with the triplet excited state of carbonyl and hydroxyl radical. Atmos. Chem. Phys. 2014, 14, 13801–13816. [Google Scholar] [CrossRef] [Green Version]
  25. Li, Y.J.; Huang, D.D.; Cheung, H.Y.; Lee, A.K.Y.; Chan, C.K. Aqueous-phase photochemical oxidation and direct photolysis of vanillin—A model compound of methoxy-phenols from biomass burning. Atmos. Chem. Phys. 2014, 14, 2871–2885. [Google Scholar] [CrossRef] [Green Version]
  26. Yu, L.; Smith, J.; Laskin, A.; George, K.M.; Zhang, Q. Molecular transformations of phenolic SOA during photochemical aging in the aqueous phase: Competition among oligomerization, functionalization, and fragmentation. Atmos. Chem. Phys. 2016, 16, 4511–4527. [Google Scholar] [CrossRef] [Green Version]
  27. Collett, J.L.; Hoag, K.J.; Sherman, D.E.; Bator, A.; Richards, L.W. Spatial and temporal variations in San Joaquin Valley fog chemistry. Atmos. Environ. 1998, 33, 129–140. [Google Scholar] [CrossRef]
  28. Hecobian, A.; Zhang, X.; Zheng, M.; Frank, N.; Edgerton, E.S.; Weber, R.J. Water-Soluble Organic Aerosol material and the light-absorption characteristics of aqueous extracts measured over the Southeastern United States. Atmos. Chem. Phys. 2010, 10, 5965–5977. [Google Scholar] [CrossRef] [Green Version]
  29. Chen, Y.; Ge, X.; Chen, H.; Xie, X.; Chen, Y.; Wang, J.; Ye, Z.; Bao, M.; Zhang, Y.; Chen, M. Seasonal light absorption properties of water-soluble brown carbon in atmospheric fine particles in Nanjing, China. Atmos. Environ. 2018, 187, 230–240. [Google Scholar] [CrossRef]
  30. Onasch, T.B.; Trimborn, A.; Fortner, E.C.; Jayne, J.T.; Kok, G.L.; Williams, L.R.; Davidovits, P.; Worsnop, D.R. Soot Particle Aerosol Mass Spectrometer: Development, Validation, and Initial Application. Aerosol Sci. Technol. 2012, 46, 804–817. [Google Scholar] [CrossRef]
  31. Wang, J.; Ge, X.; Chen, Y.; Shen, Y.; Zhang, Q.; Sun, Y.; Xu, J.; Ge, S.; Yu, H.; Chen, M. Highly time-resolved urban aerosol characteristics during springtime in Yangtze River Delta, China: insights from soot particle aerosol mass spectrometry. Atmos. Chem. Phys. 2016, 16, 9109–9127. [Google Scholar] [CrossRef] [Green Version]
  32. Ge, X.; Li, L.; Chen, Y.; Chen, H.; Wu, D.; Wang, J.; Xie, X.; Ge, S.; Ye, Z.; Xu, J. Aerosol characteristics and sources in Yangzhou, China resolved by offline aerosol mass spectrometry and other techniques. Environ. Pollution 2017, 225, 74–85. [Google Scholar] [CrossRef] [PubMed]
  33. Ulbrich, I.M.; Canagaratna, M.R.; Zhang, Q.; Worsnop, D.R.; Jimenez, J.L. Interpretation of organic components from Positive Matrix Factorization of aerosol mass spectrometric data. Atmos. Chem. Phys. 2009, 9, 2891–2918. [Google Scholar] [CrossRef] [Green Version]
  34. Riva, M.; Chen, Y.; Zhang, Y.; Lei, Z.; Olson, N.E.; Boyer, H.C.; Narayan, S.; Yee, L.D.; Green, H.S.; Cui, T.; et al. Increasing Isoprene Epoxydiol-to-Inorganic Sulfate Aerosol Ratio Results in Extensive Conversion of Inorganic Sulfate to Organosulfur Forms: Implications for Aerosol Physicochemical Properties. Environ. Sci. Technol. 2019, 53, 8682–8694. [Google Scholar] [CrossRef] [PubMed]
  35. Zhang, Q.; Alfarra, M.R.; Worsnop, D.R.; Allan, J.D.; Coe, H.; Canagaratna, M.R.; Jimenez, J.L. Deconvolution and Quantification of Hydrocarbon-like and Oxygenated Organic Aerosols Based on Aerosol Mass Spectrometry. Environ. Sci. Technol. 2005, 39, 4938–4952. [Google Scholar] [CrossRef]
  36. Zhao, R.; Aljawhary, D.; Lee, A.K.Y.; Abbatt, J.P.D. Rapid Aqueous-Phase Photooxidation of Dimers in the α-Pinene Secondary Organic Aerosol. Environ. Sci. Technol. Lett. 2017, 4, 205–210. [Google Scholar] [CrossRef] [Green Version]
  37. Yi, Y.; Cao, Z.; Zhou, X.; Xue, L.; Wang, W. Formation of aqueous-phase secondary organic aerosols from glycolaldehyde and ammonium sulfate/amines: A kinetic and mechanistic study. Atmos. Environ. 2018, 181, 117–125. [Google Scholar] [CrossRef]
  38. Aiona, P.K.; Lee, H.J.; Leslie, R.; Lin, P.; Laskin, A.; Laskin, J.; Nizkorodov, S.A. Photochemistry of Products of the Aqueous Reaction of Methylglyoxal with Ammonium Sulfate. Acs Earth Space Chem. 2017, 1, 522–532. [Google Scholar] [CrossRef]
  39. De Haan, D.O.; Hawkins, L.N.; Welsh, H.G.; Pednekar, R.; Casar, J.R.; Pennington, E.A.; de Loera, A.; Jimenez, N.G.; Symons, M.A.; Zauscher, M.D. Brown carbon production in ammonium- or amine-containing aerosol particles by reactive uptake of methylglyoxal and photolytic cloud cycling. Environ. Sci. Technol. 2017, 51, 7458–7466. [Google Scholar] [CrossRef]
  40. Galloway, M.M.; Powelson, M.H.; Sedehi, N.; Wood, S.E.; Millage, K.D.; Kononenko, J.A.; Rynaski, A.D.; De Haan, D.O. Secondary Organic Aerosol Formation during Evaporation of Droplets Containing Atmospheric Aldehydes, Amines, and Ammonium Sulfate. Environ. Sci. Technol. 2014, 48, 14417–14425. [Google Scholar] [CrossRef] [Green Version]
  41. Galloway, M.M.; Chhabra, P.S.; Chan, A.W.H.; Surratt, J.D.; Flagan, R.C.; Seinfeld, J.H.; Keutsch, F.N. Glyoxal uptake on ammonium sulphate seed aerosol: reaction products and reversibility of uptake under dark and irradiated conditions. Atmos. Chem. Phys. 2009, 9, 3331–3345. [Google Scholar] [CrossRef] [Green Version]
  42. Kampf, C.J.; Jakob, R.; Hoffmann, T. Identification and characterization of aging products in the glyoxal/ammonium sulfate system-implications for light-absorbing material in atmospheric aerosols. Atmos. Chem. Phys. 2012, 12, 6323–6333. [Google Scholar] [CrossRef] [Green Version]
  43. Aiken, A.C.; Decarlo, P.F.; Kroll, J.H.; Worsnop, D.R.; Huffman, J.A.; Docherty, K.S.; Ulbrich, I.M.; Mohr, C.; Kimmel, J.R.; Sueper, D.; et al. O/C and OM/OC ratios of primary, secondary, and ambient organic aerosols with high-resolution time-of-flight aerosol mass spectrometry. Environ. Sci. Technol. 2008, 42, 4478–4485. [Google Scholar] [CrossRef] [PubMed]
  44. Kroll, J.H.; Donahue, N.M.; Jimenez, J.L.; Kessler, S.H.; Canagaratna, M.R.; Wilson, K.R.; Altieri, K.E.; Mazzoleni, L.R.; Wozniak, A.S.; Bluhm, H. Carbon oxidation state as a metric for describing the chemistry of atmospheric organic aerosol. Nature Chemi. 2011, 3, 133–139. [Google Scholar] [CrossRef] [PubMed]
  45. Koss, A.R.; Canagaratna, M.R.; Zaytsev, A.; Krechmer, J.E.; Breitenlechner, M.; Nihill, K.; Lim, C.; Rowe, J.C.; Roscioli, J.R.; Keutsch, F.N.; et al. Dimensionality-reduction techniques for complex mass spectrometric datasets: Application to laboratory atmospheric organic oxidation experiments. Atmos. Chem. Phys. Discussion 2019, 2019, 1–42. [Google Scholar] [CrossRef] [Green Version]
Figure 1. Concentrations of the precursor (dibenzothiophene, DBT) during aqueous oxidation under different conditions.
Atmosphere 11 00151 g001
Figure 2. Mass yields of the aqSOA formed during hydroxyl radical (OH)-mediated photochemical oxidation (a) and dark oxidation (b) (note in each plot, the first pink point is zero; the first black circle is the average of the first 7 pink points, namely the 10.5 min average value; other black circles are average values of every 12 pink points, namely the 18 min average; the error bar is one standard deviation).
Atmosphere 11 00151 g002
Figure 3. Examples of high-resolution mass spectra of the organics determined by the soot particle aerosol mass spectrometer (SP-AMS) during OH-mediated aqueous oxidation at different times: (a) 60 min, (b) 300min, and (c) 480 min.
Atmosphere 11 00151 g003
Figure 4. Time series of changes of oxygen-to-carbon (O/C) and hydrogen-to-carbon (H/C) during OH-mediated photochemical oxidation (a,b) and dark oxidation (c,d) (note in each plot, the first pink point is zero; the first black circle is the average of the first 7 pink points, namely the 10.5 min average value; other black circles are average values of every 12 pink points, namely the 18 min average; the error bar is one standard deviation).
Atmosphere 11 00151 g004
Figure 5. Temporal variations the oxidation states (OSc) during OH-mediated photochemical oxidation (a) and dark oxidation (b) (note in each plot, the first pink point is zero; the first black circle is the average of the first 7 pink points, namely the 10.5 min average value; other black circles are average values of every 12 pink points, namely the 18 min average; the error bar is one standard deviation).
Atmosphere 11 00151 g005
Figure 6. Temporal variations of the positive matrix factorization (PMF)-resolved factors during the course of OH-mediated photochemical oxidation.
Atmosphere 11 00151 g006
Figure 7. High-resolution mass spectra of the PMF-resolved factors (factors 1 to 3 are the names of resolved factors).
Atmosphere 11 00151 g007
Figure 8. Light absorption spectra of the final illuminated solutions (a), and temporal variations of mass absorption efficiency at 365 nm (MAE365) (b) during illumination under different conditions.
Atmosphere 11 00151 g008
Table 1. Experimental conditions and the decay parameters of DBT.
PrecursorOxidantOxidant ConcentrationIlluminationk (10−3 min−1)t1/2(min)
DBT (10μM)H2O2300 μM2.03 (±0.08)342
H2O2300 μM0.602 (±0.06)1152
DMB15 μM1.03 (±0.1)668
DMB15 μM0.532 (±0.08)1303
0.433 (±0.04)1601

