Article

Physico-Chemical Characterization of an Urban Rainwater (Zagreb, Croatia)

by
Palma Orlović-Leko
1,
Kristijan Vidović
2,*,
Irena Ciglenečki
1,
Dario Omanović
1,
Mathieu Dutour Sikirić
1 and
Ivan Šimunić
3
1
Division for Marine and Environmental Research, Ruđer Bošković Institute, Bijenička 54, 10000 Zagreb, Croatia
2
National Institute of Chemistry, Hajdrihova 19, SI-1000 Ljubljana, Slovenia
3
Faculty of Agriculture, Department of Soil Amelioration, University of Zagreb, Svetošimunska cesta 25, 10000 Zagreb, Croatia
*
Author to whom correspondence should be addressed.
Atmosphere 2020, 11(2), 144; https://doi.org/10.3390/atmos11020144
Submission received: 20 December 2019 / Revised: 20 January 2020 / Accepted: 22 January 2020 / Published: 28 January 2020
(This article belongs to the Special Issue Atmospheric Aqueous-Phase Chemistry)

Abstract

:
The characterization of organic matter (OM) and trace elements (TEs) was conducted in bulk precipitation samples collected in an urban area of Croatia (Zagreb center), from January 2009 to October 2011 (N = 31). Characterization of OM was performed by measurement of dissolved (DOC) and particulate forms of organic carbon (POC), as well as surface-active substances, copper complexing capacity and reduced sulfur species which were determined electrochemically. Concentrations of TEs (Al, Fe, Zn, Cr, Ba, Mn, Cu, Sr, Ti, Pb, V, Ni, Rb, Sb, As, Sn, Se, Co, Cd, Mo) were analyzed by HR ICP-MS. The most important outcome of this study is confirmed relatively low concentrations of DOC (0.69–4.86 mgC L−1) and TEs. Daily fluxes of Zn, Pb, Ni, As, and Cd were two to three times lower than that of those reported for an urban industrial site in Europe. Additionally, this study shows that the value and reactivity of rainwater DOC has not considerably changed if compared with the results from the 1998–1999 study (0.78–4.39 mgC L−1). High traffic density and thermal power plants are assumed to be the main local sources of pollutants in Zagreb. Using Al as a reference element, it was found that Cd, Sb, and Cu were associated with anthropogenic sources. The solubility of Sr, Zn, Cd, Ni, Cr, As, and Rb was higher than 70%. Another critical characteristic of precipitation composition is episodic variation in POC concentration because of Saharan dust transport. Obtained data can be valuable for environmental quality assessment, as well as for insight into atmospheric deposition processes.

Graphical Abstract

1. Introduction

Many atmospheric organic and inorganic compounds have a tendency toward dissolution in atmospheric water (cloud droplets and rainwater) [1]. Rainwater is very sensitive to changes in the chemistry of the atmosphere [2]. The physico-chemical properties of the precipitation are influenced by local sources (natural and anthropogenic) [1] as well as long-range transport of dust and aerosols [3,4]. It was found that 40% of the dissolved organic carbon (DOC) in the rainwater is resistant to bacterial degradation and may be transported by long-distance in the atmosphere before being removed by rain [5]. Previous studies on the rainwater chemistry in Croatia have shown that the rainwater composition is profoundly affected by the transport of the eolian dust from North Africa (very often in spring and summer) as well as polluted aerosols from the other Europe countries [6,7]. Atmospheric transport and deposition is an important pathway of various substances, including organic compounds and trace metals to the surface environment [5,8,9,10,11,12,13]. Removal of substances from the atmosphere by precipitation affects chemistry, biogeochemistry, and sedimentation in the aquatic environment [11,14]. These processes have a decisive role in global changes and in environmental protection [5,8,9,10,11].
Dissolved organic matter (DOM), measured as dissolved organic carbon (DOC), is an important component of the rainwater [5]. Removal of the atmospheric DOC by rainwater, including non-oxidized organic compounds, decreases the generation of carbon dioxide [15]. This process is crucial for the evaluation of the global carbon cycle [5,15]. The climate change in recent decades has led to increased interest in the study of DOC in atmospheric precipitation [16,17,18,19,20] and surface waters [14] (and references therein).
Surface-active substances (SAS) make up a portion of rainwater DOC [21,22,23] (and references therein) and the water-soluble organic carbon (WSOC) fraction of atmospheric aerosols [24] (and references therein). These compounds are the most reactive part of DOC [25] because they tend to adsorb on the natural phase boundaries (air-water, water-sediment/suspended particles) and, in this way, significantly affect the transfer of mass and energy. In our previous work, we have shown that some metal ions can accumulate in adsorbed layers of organic molecules [23]. This mechanism could be important for the geochemical cycle of metals.
Film-forming compounds can influence the microphysical processes of humid aerosol particles and atmospheric droplets [24,26]. Because of these properties, atmospheric SAS plays an essential role in various atmospheric processes that reflect climate change [24] (and references therein). Physico-chemical properties of OM are often more important than the amount present [22]. Atmospheric humic-like substances, HULIS were found to be an important class of SAS in aerosol particles [24,27,28] (and references therein). Rainwater SAS are compositionally different from those found in surface waters [29]. Atmospheric HULIS decrease the surface tension more efficiently than the terrestrial and aquatic humic substances because of the different composition [27]. Some studies also suggested that atmospheric SAS could be “biosurfactants” of microbial origin [24]. Quantification and characterization of the SAS in the atmospheric deposition are important for a better understanding of its contribution to organic carbon (OC) cycling.
Complexation of OC with metal ions has a significant impact on mobility, solubility, and bioavailability of metals in precipitation and further in the aquatic environment [30,31,32,33,34,35,36].
The organically complexed metals such as Cu, Co, Ni, Pb, Cd, and Zn have been observed in urban rainwater [32] (and references therein). Metal complexing capacity (MeCC) refers to the amount of OM present that can specifically bind metal ions, and it is often used as a parameter for qualitative and quantitative characterization of the OM in natural waters [32,33,34,35]. These investigations are usually focused on the complexation of Cu ligands [32,33,34,35] because the Cu ions have a strong affinity for naturally occurring organic ligands [32,33]. In the urban atmosphere, Cu is derived from fossil fuel combustion, exhaust emissions, and industrial processes [37] (and references therein), although the significant atmospheric Cu in western Europe comes from brake wear [38].
In the atmosphere, sulfur is mainly emitted in its reduced form [39]. Carbon disulfide (CS2), dimethyl sulfide (CH3SCH3, DMS), and hydrogen sulfide (H2S) are the most frequently reduced sulfur species (RSS), which are found in the atmosphere [40]. In Orlović-Leko et al. [41], inorganic or organic RSS has been confirmed at nano-levels in rainwater samples by electrochemical methods. The chemistry of RSS is crucial for many environmental problems, such as acid rain and climate change [39]. While sulfur species, together with SAS, could play a crucial role in speciation and solubility of trace metals in aquatic systems [42].
In an urban environment, metals are emitted primarily by anthropogenic sources, which include traffic, industry, corrosion of construction materials, and waste incineration [43].
An important ecological property of metals is their persistence and ability to accumulate in ecosystems [43]. Measurements of TEs concentrations in the rainwater could be critical to understanding of their geochemical cycling [44,45,46,47]. The investigation of the soluble fraction of metal in atmospheric deposition is a priority in many studies [36,47,48,49] because the solubility of TEs affects their bioavailability. The solubility of TEs depends on the pH values of rainwater and the size of particles [48]. The particles of anthropogenic origin are highly soluble [46] (and references therein).
The aim of this study is the characterization of OM (through measurement of DOC, particulate organic carbon POC, SAS, RSS) and TEs in precipitation of an urban environment, in Zagreb city, Croatia. In our previous studies, conducted in 1998–1999 and 2003–2007, spatial and temporal variability of DOC concentrations in bulk precipitation of urban and coastal areas in Croatia have been discussed [21,22]. However, in accordance with the literature that emphasized a lack of data on DOC measurements in rainwater in central and eastern Europe [17], as well as trends based on the long-term observations of DOC in rainwater [8] (and references therein), in this paper, we focus on studying the possible changes that may have occurred in the concentration and reactivity of DOC between two sampling periods (1998–1999 and 2009–2011), in line with socio-economic and global changes. Namely, Croatia ratified the Kyoto Protocol (April 2007), thereby committing to reducing emissions of greenhouse gases in the period 2008–2012 compared to the baseline emissions in nineties (1990). Also, as a prerequisite for achievements of EU Directive 2006/32/EC on energy efficiency and energy services, Croatia prepared a program “Adjustment and upgrades of energy development strategies,” which foresees adaptation of the power plant in Zagreb to use renewable energy. In the studied sampling period the Zagreb thermal power plant was operated on fuel oil, which may affect DOC and TE concentrations. Therefore, this study on the rainwater OM and TE is unique for Zagreb, and Croatia, and could serve as a baseline for future investigations in the area.
Data treatment for TEs included the calculation of their daily fluxes and percentage of solubility. In order to study the possible sources of TEs, correlation analyses, and enrichment factors (EFs) were considered.

2. Experiments

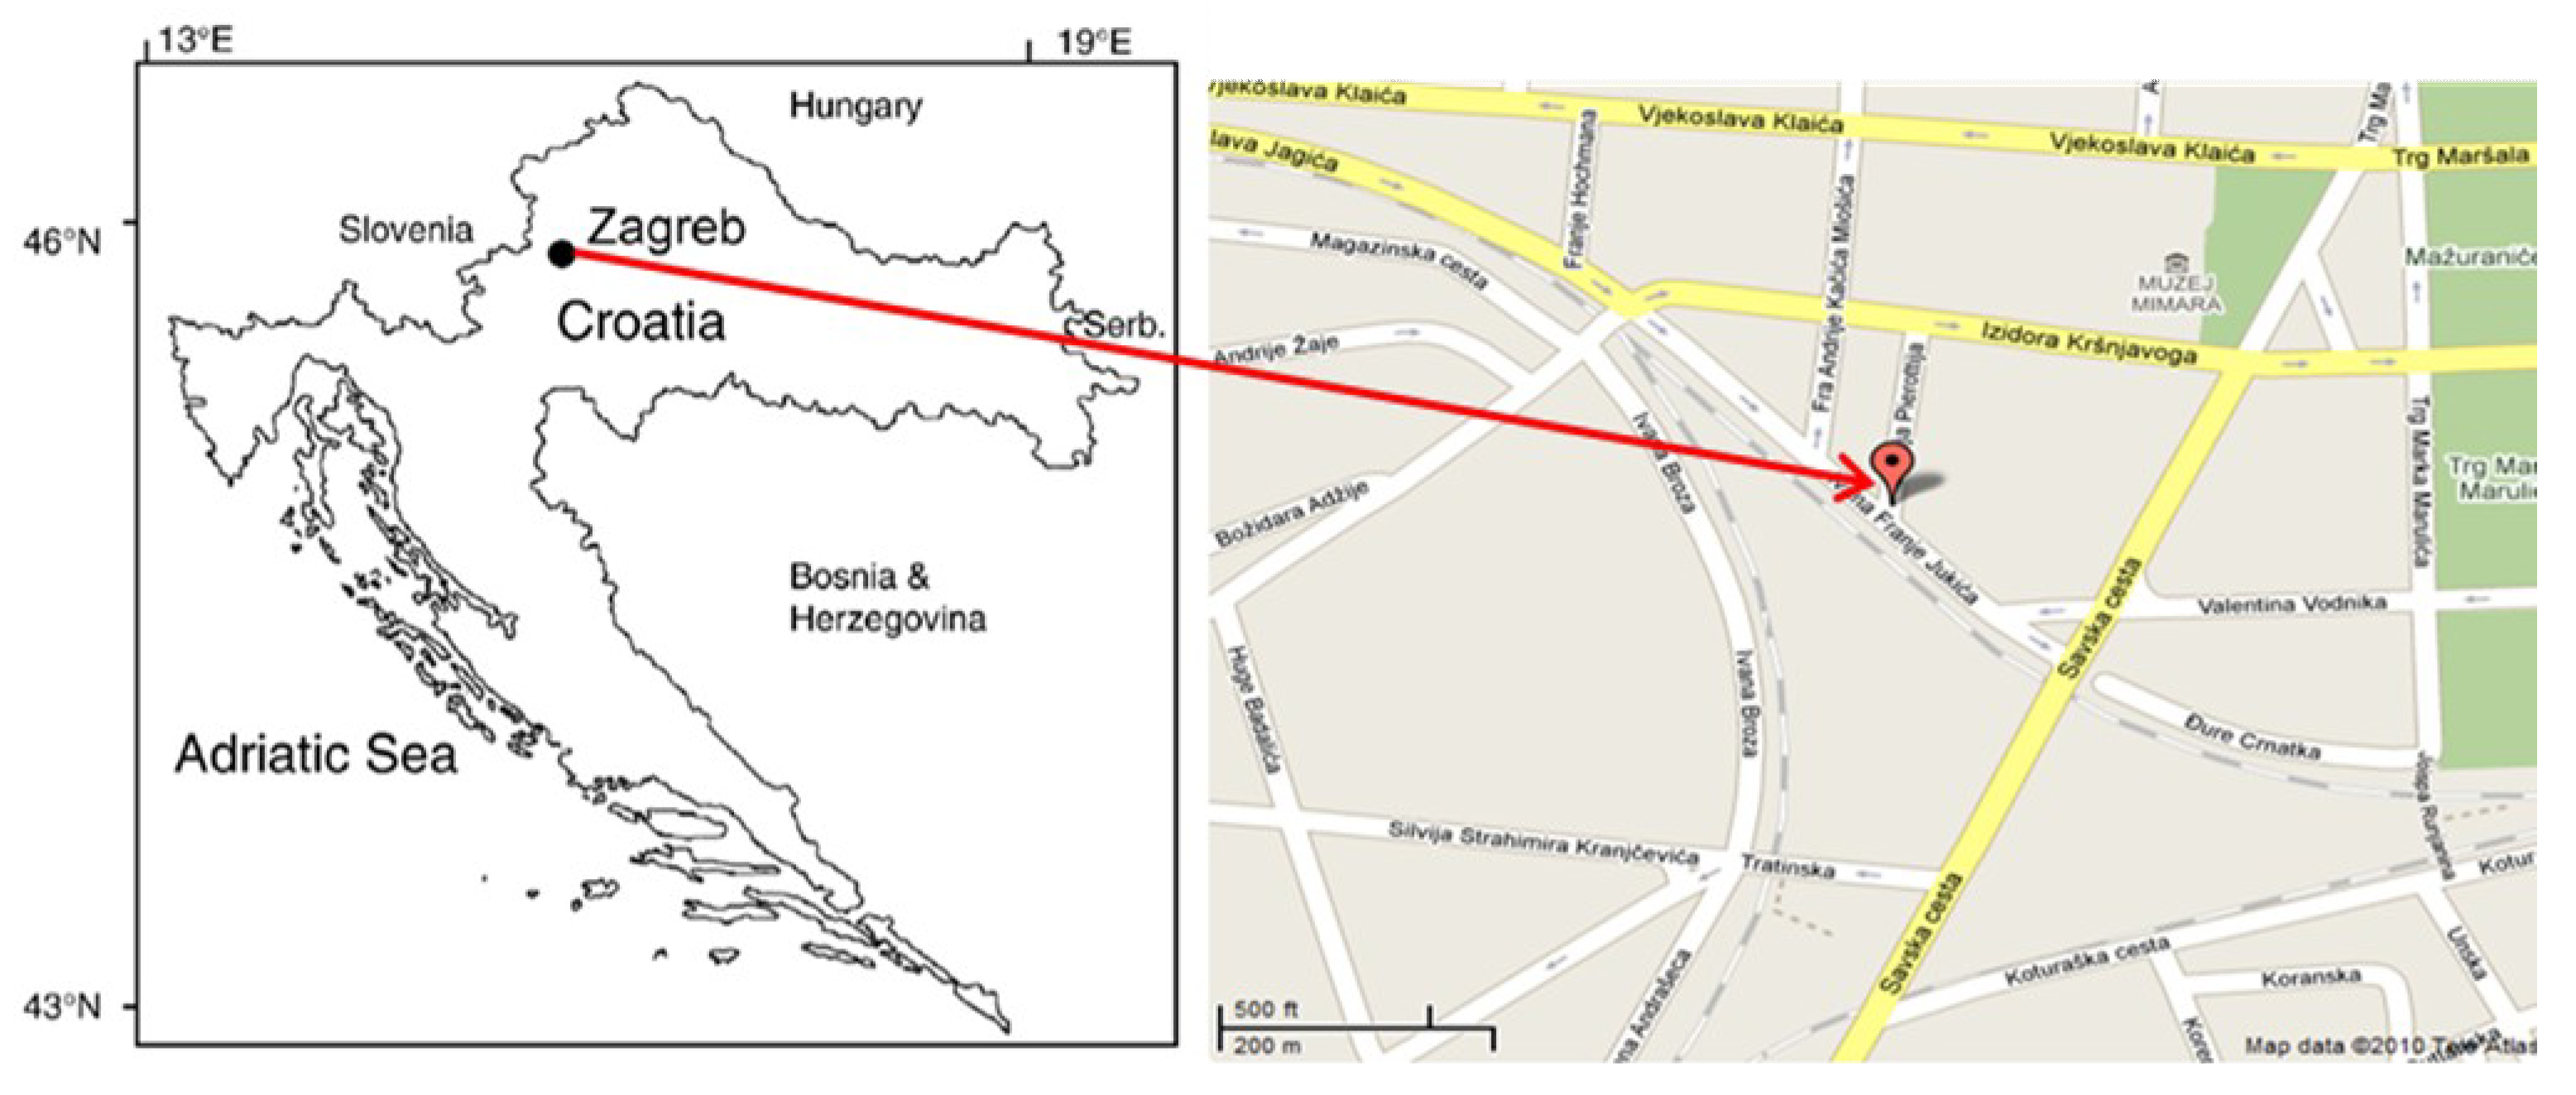
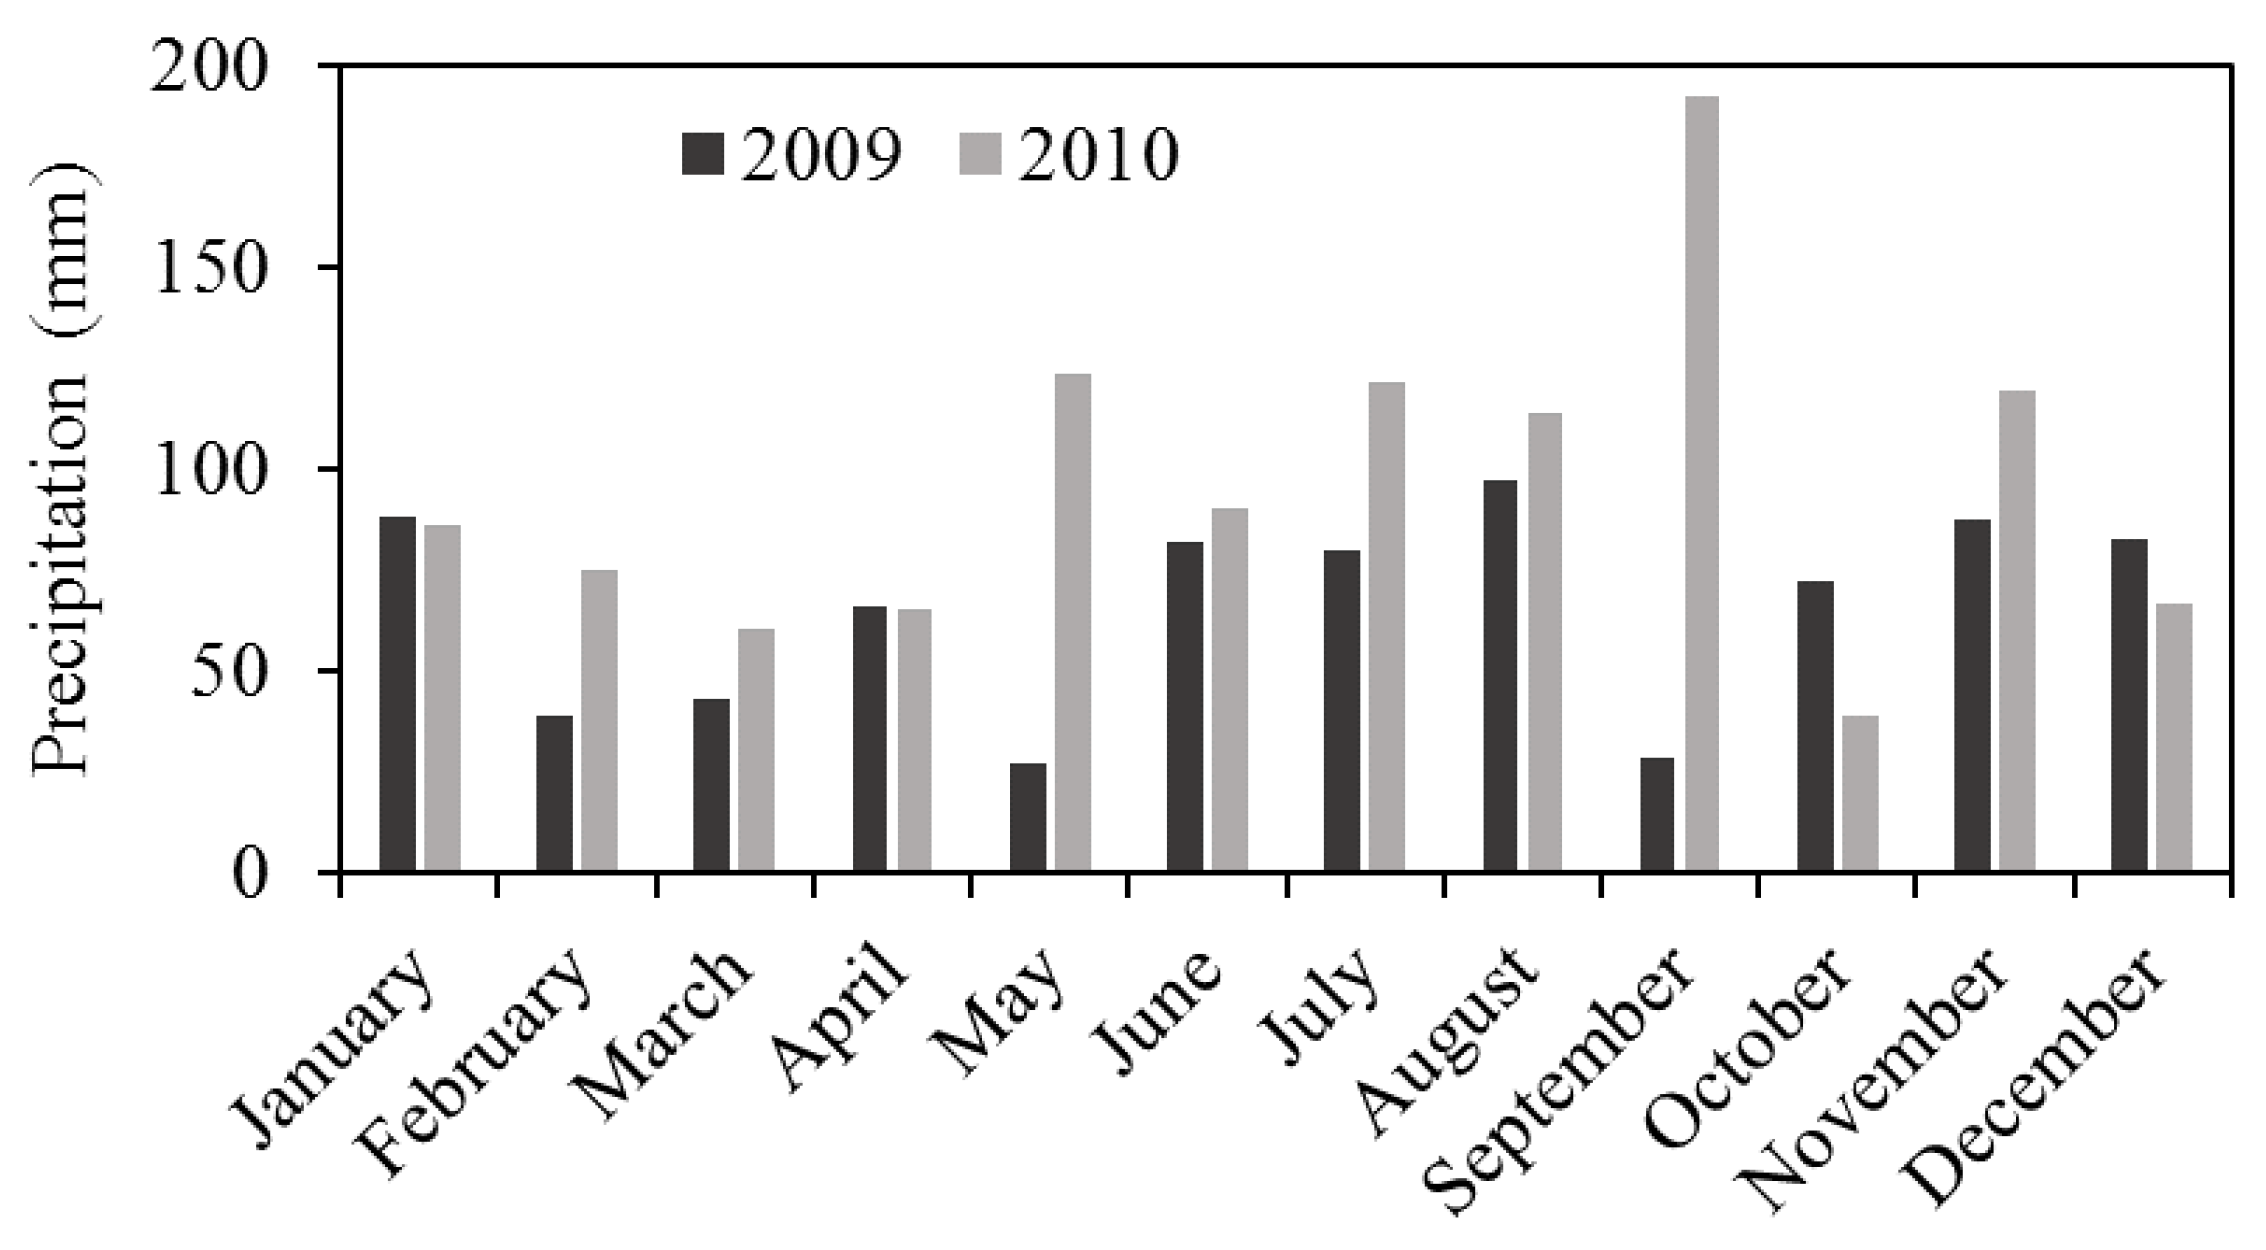
2.1. Area Description

The sampling site (Figure 1) was located in the center of Zagreb (45°48′24″ N and 15°57′50″ E), on the roof (20 m above ground level) of the Faculty of Mining, Geology, and Petroleum Engineering building. The site is not surrounded by rows of buildings, and therefore, airflow was not channeled, obstructed, or restricted. It is close to the parking lot and two main roads characterized by heavy traffic all day long. The thermal power station (burns gas and oil fuel) is located approximately 2 km from our sampling location. However, it is important to note that there are no large industries in Zagreb and that the topography of the sampling site did not change over the course of the sampling period. The primary local pollution sources are traffic and two thermal power stations. Gas is a standard fuel for domestic heating.
Zagreb has a continental precipitation regime, with its maximum in the warm months of the year and a secondary maximum in autumn. The analysis of annual precipitation amounts from 1961 to 1990 showed that in Croatia, the annual precipitation amount in 2009 (794.8 mm) and 2011 (520.8 mm) was below the average, and in 2010 (1155.1 mm) it was above the average [50,51,52]. A comparison of monthly precipitation in 2009/2010 in the Zagreb area is presented in Figure 2 [50,51]. During the study period, daily precipitation ranged from 0.3 to 28.8 mm (Croatian Meteorological and Hydrological Service Data, DHZM).

2.2. Sampling Method and Sample Treatment Prior Analyses

Daily, bulk precipitation (27 samples) were sampled from January 2009 to May 2010. In 2011, only four samples were collected, each in different seasons. The sampling was performed using two samplers consisting of a glass funnel (25 cm diameter) and a glass bottle (2.5 L), which were installed 1.0 m above the ground for bulk rainwater sampling. Both components of the sampler were prepared according to the standard cleaning procedure. They were washed with chrome-sulphuric acid (in-house), rinsed by HNO3 (p.a. Kemika, Zagreb, Croatia), and several times with Milli-Q water (Milli-Q, 18.2 MW, total organic carbon (TOC) < 3 ppb) before being set up at the sampling location. The collected precipitation volumes ranged from 0.1 to 2.2 L (collected samples with a volume of less than 0.1 L were not considered).
The bulk sampler (bottle/funnel) collected dry deposition of gases and particles. However, it was found that approximately 80% of carbonaceous aerosols are removed by wet deposition (via precipitation) [53]. Furthermore, according to the European Committee for Standardization (CEN), the bulk sampler can also be used for measurements of atmospheric deposition of metals in industrial and urban sites, mainly in the case of daily samples [6,47] (and reference therein).
Volumes and the pH values of samples were measured just after collection. For measurements of TEs in the filtered fraction, the samples were filtered by use of the Millipore vacuum filtration system through a 0.45 μm cellulose-nitrate membrane filter (Sartorius). For DOC measurement, the filtered fraction was obtained by the use of the same filtration system with Whatman glass fiber filters, pore size 0.7 μm (Whatman, Grade GF/F, d = 47 mm). After preservation with the HgCl2 solution, it was stored in a cold dark place until analysis. Particulate organic carbon (POC), defined as organic matter larger than 0.7 μm, remained on the filter. Parameters, SAS, CuCC, and RSS, were measured in the original samples within two days. Prior to analysis, the samples were stored at 4 °C.

2.3. Chemical Analyses

2.3.1. Organic Matter (DOC, POC Measurements)

DOC and POC content was determined by the high-temperature catalytic oxidation (HTCO) method at a TOC-VCPH instrument (Shimadzu, Japan). The DOC and POC concentrations of each sample were calculated as an average of three replicates. The limits of quantification (LOQ) are 0.228 mg/L for DOC and 7.11 μg/L for POC. The precision of DOC and POC measurements, given as the relative standard deviation (RSD) was based on the analysis of selected samples and the reference materials; RSD never exceeded 6% and 5%, respectively. Both measurement procedures were validated through international intercalibrations as a prerequisite for accreditation achieved in 2017 (HRN EN ISO/IEC 17025:2007).

2.3.2. Surface Activity of Rainwater DOC

The surface activity of DOC was determined by the electrochemical method of alternating current voltammetry with out-of-phase mode by using a µ-Autolab (Electrochemical Instrument Eco Chemie, Metrohm Autolab B.V., Utrecht, The Netherlands) Potentiostat connected with 663 VA Stand Metrohm mercury electrode [54]. The concentration of surface-active substances (SAS) was expressed as equivalent in mg/L to a model substance, the nonionic surfactant polyoxy ethylene-t-octylphenol (Triton-X-100). The detection limit of SAS determination was 0.01 mg L−1 equivalent of T-X-100, with LOQ of 0.03 mg L−1. The method enables a rough characterization of SAS based on its adsorption behavior, i.e., hydrophobic—hydrophilic interactions, as seen by electrochemical measurements at the Hg electrode in the water solution [54].

2.3.3. CuCC Measurements

CuCC was measured by using differential pulse anodic stripping voltammetry (DPASV) by direct titration of the sample with copper ions [34]. The value of CuCC, as well as the corresponding stability constant, was calculated by applying the linear transformation plot [34] (and references therein). The RSD of the mean value calculated for five independent measurements was below 10%.

2.3.4. Reduced Sulfur Species

The RSS measurements were performed by cathodic stripping linear sweep voltammetry with a µ-Autolab (Electrochemical Instrument Eco Chemie, Utrecht, The Netherlands) electrochemical analyzer connected to a 663 VA Stand Metrohm mercury electrode, as previously described [55]. Quantification for RSS was done based on sulfide calibration. The precision obtained with 120 s accumulation time is 0.5 nM (1 σ), giving a detection limit (3 σ) of about 1.5 nM, with relative 1σ uncertainty better than ±10%.

2.3.5. Trace Elements

Multielemental analysis was performed by Element 2, High Resolution Inductively Coupled Plasma Mass Spectrometer (HR ICPMS, Thermo, Bremen, Germany). For the analyses, the samples were prepared in pre-cleaned polypropylene tubes by adding 100 µL of concentrated HNO3 and 50 µL of In (115) as internal standard (0.1 mg L−1) into 5 mL of the sample aliquot. The concentrations of the elements were determined using the external calibration plots. Quality control (QC) of HR ICP-MS measurements was checked by the determination of element concentration in “River Water Reference Material for Trace Metals” (SLRS-4, National Research Council Canada). Measured concentrations of all elements in the reference material were within the range of provided certified uncertainties (Table S1 in Supplementary Materials). The procedural blanks of MQ water were far below the level of concentrations measured in samples.

2.3.6. pH Measurements

A digital pH meter (Model Metrohm 691) was used for the determination of the pH parameter values. Calibration was carried out before measurement using standard buffer solutions of pH 4.00 and 7.00.

2.3.7. Correlation Analysis

For the purpose of finding the relation between investigated parameters, a correlation analysis was carried out. For this, Real Statistics was used, which is an add-in tool for Excel (Microsoft office). Before correlation analysis, each variable (concentration of metals, pH, rainfall, the solubility of metals, and concentration of DOC) was tested for normality by use of Shapiro-Wilk’s test (for which Real Statistics add-in was also used). In the case where the variables did not show normality or linearity, a Spearman’s rank correlation was performed, where in the case of normal distributed variables with linear relationships between them, a Pearson correlation analysis was used.

3. Results and Discussion
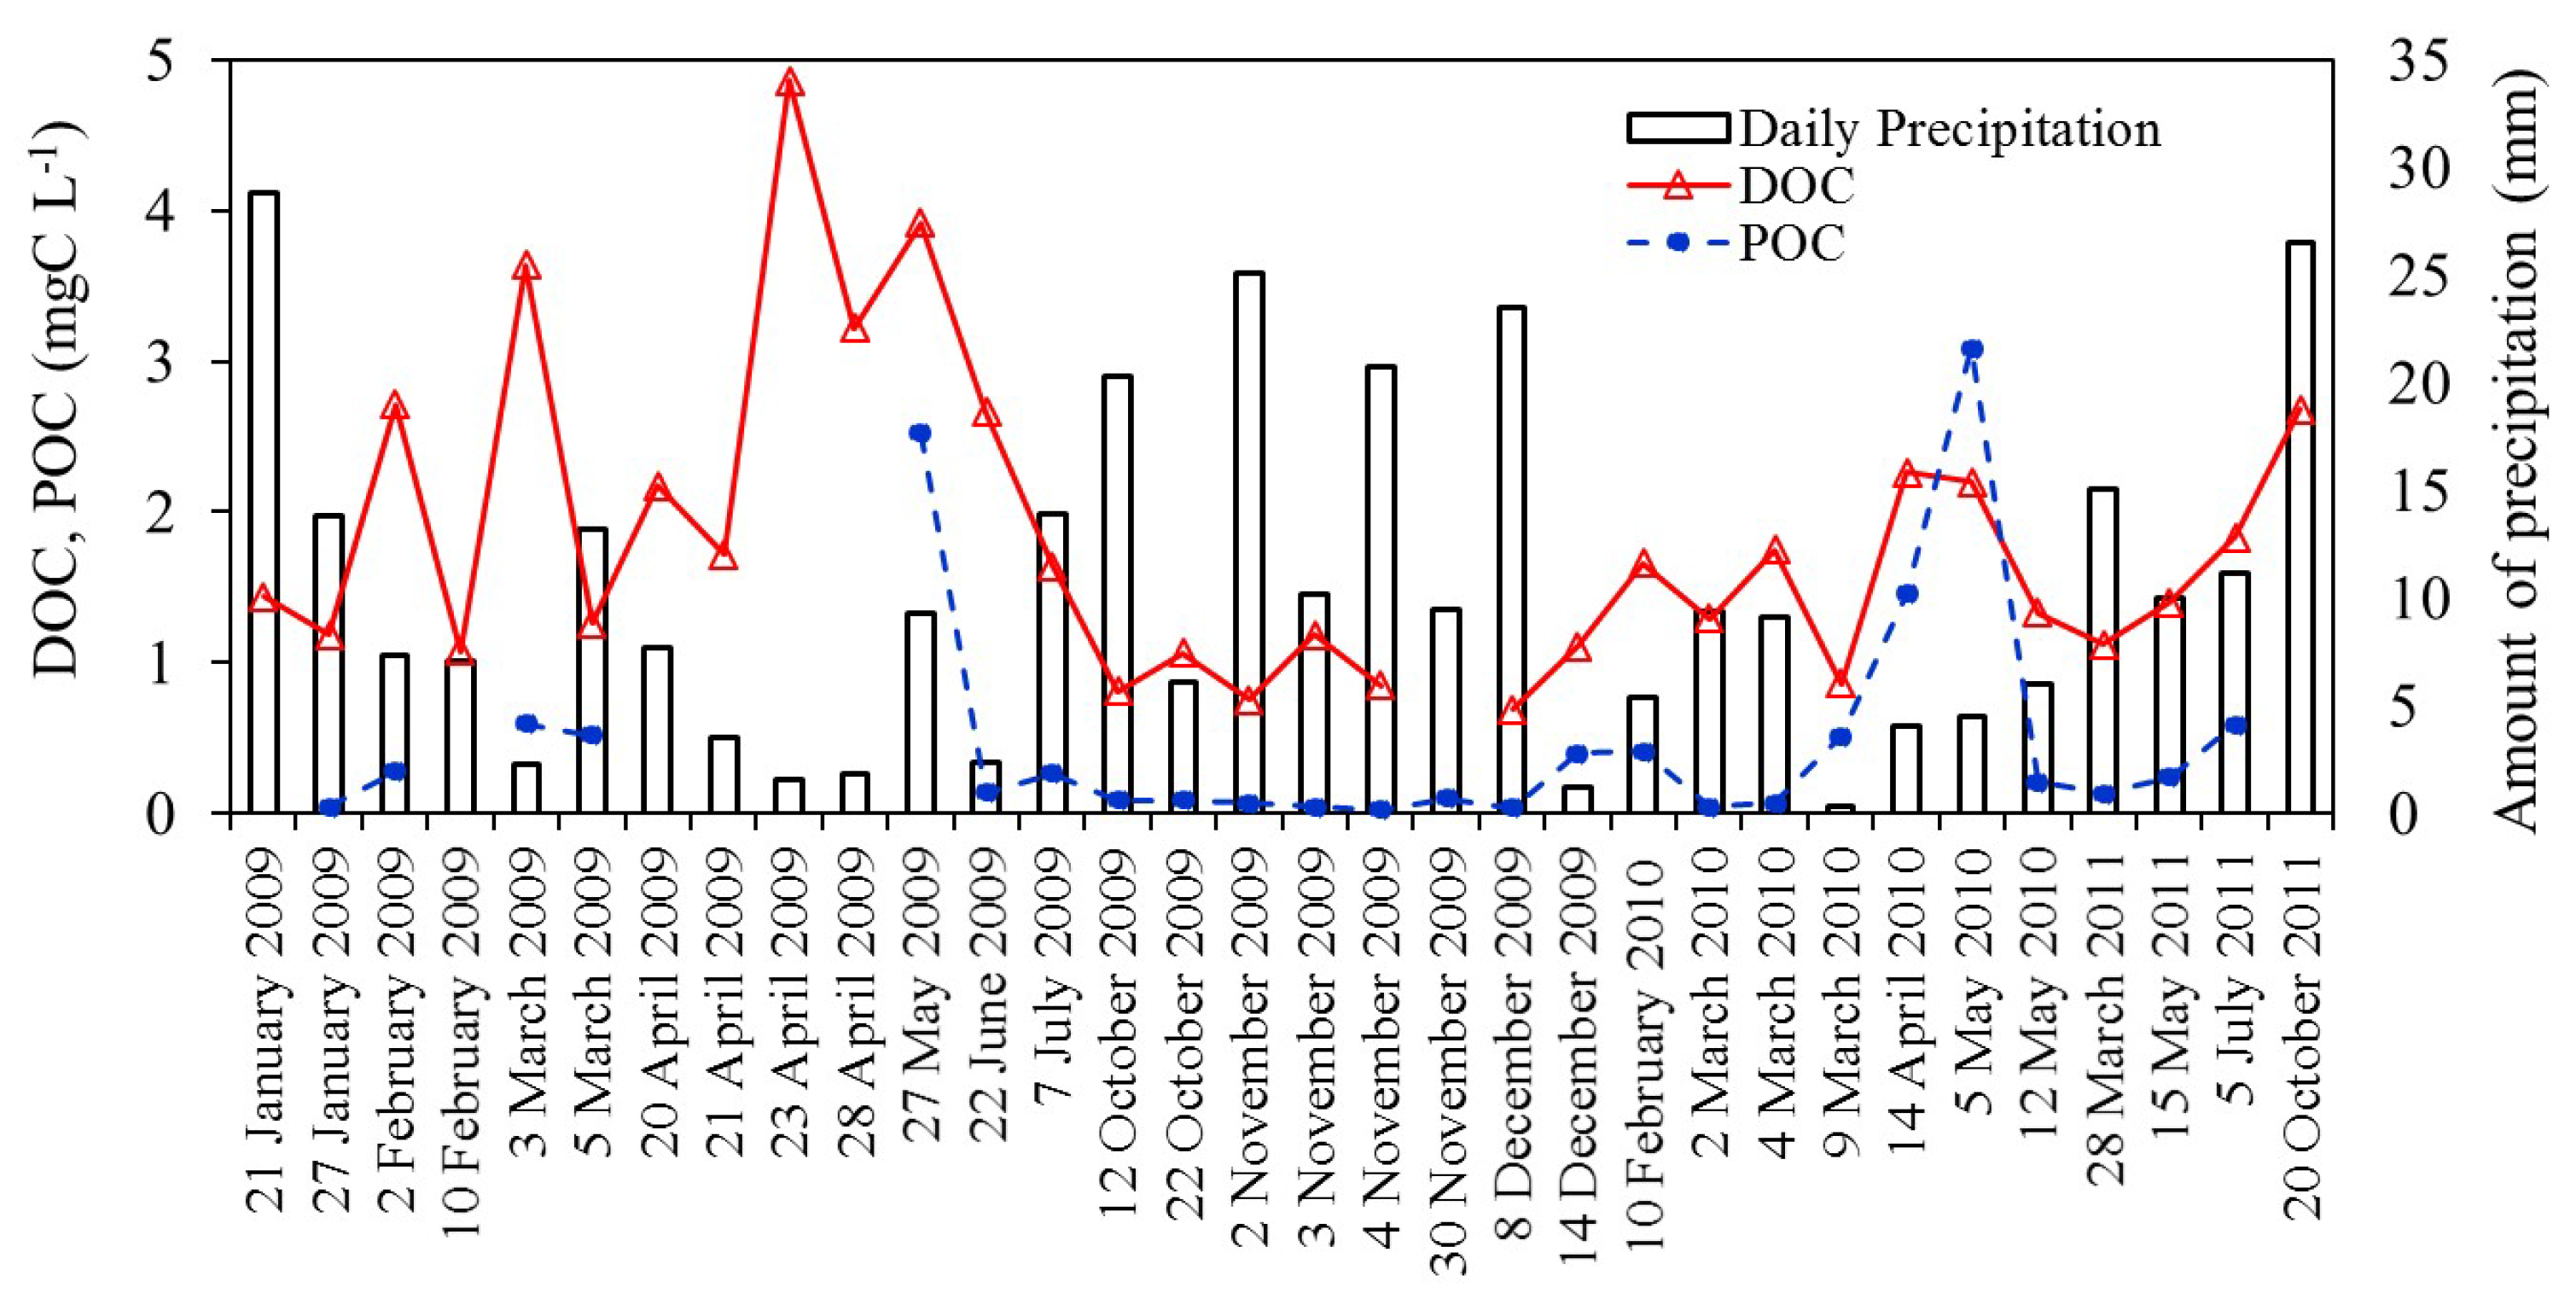
3.1. Organic Carbon

Temporal variability of concentrations of DOC and POC in the rainwater samples from January 2009 through October 2011 (N = 31) in Zagreb city center are shown in Figure 3. The daily sample concentrations of DOC ranged from 0.69 to 4.86 mgC L−1, with an average value of 1.82 ± 1.02 mgC L−1. The DOC content found in this study was much lower than the concentrations reported for other urban and polluted areas [17,18,19,56]. For example, in the industrialized and urbanized region of Poznań (Poland), the average DOC concentration (5.10 mgC L−1) was about three times higher than values in Zagreb [17]; in Mexico City DOC (up to 19.5 mgC L−1) is five times higher [19], while in the southeastern Tibetan Plateau, DOC ranges from 0.74 to 1.31 mgC L−1 [20]. This difference can be partly attributed to the various origins of DOC in precipitation. In Zagreb, rainwater DOC concentrations were mainly associated with traffic (both diesel and gasoline exhausts) and thermal power stations (combustion of natural gas and/or fuel oil).
The air mass sources and rainfall amount can affect rainwater DOC concentrations [18,20]. At our location, a weak and significant negative correlation (r = −0.39: p < 0.05) between concentrations of DOC and rainfall amount was found, similar to what has been observed in our previous study [22]. According to Kieber et al. [15], this result may reflect the possibility that some components of DOC are formed in the atmospheric aqueous phase continuously during rain events. However, this lack of correlation also may be due to the photolysis of DOC [20].
No significant correlation (p > 0.05) was observed between DOC concentrations and pH values (Table S2 in Supplementary Materials). Results suggest that organic acids contributed a relatively small percentage to the acidity in the Zagreb precipitation [15].
The DOC concentrations from this study are not significantly different from the data of our previous two studies conducted in the Zagreb area from 1998 to 1999 and 2003 to 2007 (0.78–4.39 and 0.67–4.03 mgC L−1) [21,22]. Additionally, a very similar average concentration of DOC (1.85 ± 0.81 mgC L−1) was calculated for the sampling period from 1998 to 1999 at the same location (center of Zagreb) [21]. In contrast, a rainwater study conducted in Wilmington, NC, USA, observed an approximately 50% reduction of DOC within a decade (between 1996–1997 and 2008) [2]. The authors attribute these results to changes in air quality regulation and advances in emission technology.
In order to study the possible sources of DOC, we applied correlation analysis between DOC and TEs concentrations measured in the same samples (see the section below), Table S3 in Supplementary Materials. The significant (p < 0.05) and moderate correlation values (Spearman′s coefficient, 0.50 < r < 0.70) are found for anthropogenic metals (tracers of vehicular emissions): Cu, Fe, Ni, Pb, Sb, and Zn [37,38]. Among the fossil fuel combustion-generated elements [37], DOC significantly correlated (p ≤ 0.05; r > 0.60) with As and Co and especially correlated highly with Se and Mo (r = 78). There is a good relationship between DOC and soil elements: Fe, Al, Mn, and Sr (p < 0.005; 0.70 < r < 0.76). A significant link between DOC and metals point to their possible association and to the similarity of their sources. It is known that DOC can act as a chelating reagent and thus influences the solubility of the metal in precipitation [31] and in the aquatic environment [35].
The concentrations of DOC obtained in this study for continental rainwater were compared with those of surface freshwater systems in Croatia, Table 1.
As can be seen, the concentrations of DOC in rainwater are in the same concentration range as measured in the selected freshwater systems, except for Lake Brljan (Krka River), which has relatively low DOC values. It is important to note that the Krka River is characterized by extremely low natural concentrations of trace elements also [61]. Therefore, it can be assumed that this ecosystem could be affected by the input of atmospheric organic and inorganic compounds. In the study conducted in Pennsylvania (USA) [9], the average annual volume-weighted concentration of DOC was 0.71  mgC  L−1, and annual wet deposition fluxes of DOC were in the range from 3 to 13 kg C ha−1 year−1, with an average value of 8 kg C ha−1 year−1. This work underlined the significance of the atmospheric deposition of reactive carbon species to watersheds. Bao et al. [10] reported that precipitation inputs play a significant role in supplying the fraction of biolabile DOC (BDOC) to the ocean. They estimated the depositional flux of rainwater DOC into Xiamen Bay (southeastern China) of 2.1 Gg C year−1; approximately 35% of that was BDOC flux.
Particulate organic carbon is very often used to quantify OM in natural waters [8]. In the present study, concentration of POC (N = 25) in rainwater ranged from 0.03 to 3.09 mgC L−1 (average 0.48 ± 0.77), Figure 3. For the majority of samples (N = 18), concentrations of POC were less than 0.5 mgC L−1. According to the literature [62], rainwater usually contains between 0.2–0.5 mgC L−1 of POC.
Higher POC values were observed in samples from 27 May 2009 (POC = 2.52 mgC L−1; pH = 6.74), 14 April 2010 (POC = 1.46 mgC L−1; pH = 5.4) and 5 May 2010 (POC = 3.09 mgC L−1; pH = 7.25). The last sample, with the maximum POC value (>DOC = 2.2 mgC L−1), was sampled during the Saharan dust event as shown in Figure 4 for Zagreb area from 24 April to 5 May in 2010.
The more alkaline pH value is probably due to the neutralization of acidity in precipitation by alkaline compounds from Saharan material (i.e., increased values of Ca2+ and NH4+ according to data of DHZM). In comparison, the pH values in other rainwater samples ranged from 3.8 to 7.25 (on average, pH = 5.4), with the contribution of acid rain (pH < 5.6) of 65.5%. The higher levels of POC observed in spring rain samples might be related to the presence of biogenic particles such as pollen. Therefore, an important characteristic of the chemical composition of rainwater in the Zagreb area is episodic variation in the POC concentration and pH values as well.
Total organic carbon (TOC) was calculated as the sum of POC and DOC fractions and varied from 0.10 to 6.44 mgC L−1 (average, 2.05 ± 1.49). The POC contribution to TOC was dominant (about 58%) only in the case of African dust events. For all other samples, the proportion of DOC to TOC was more significant and ranged from 61 to 97% (average, 83%). According to literature, DOC makes up between 65 and 99% of TOC depending on the location and emissions [8] (and references therein). In this study, the presence of significant quantities of POC (up to 39%) may reflect a relatively high contribution of dry atmospheric OC deposition [8].

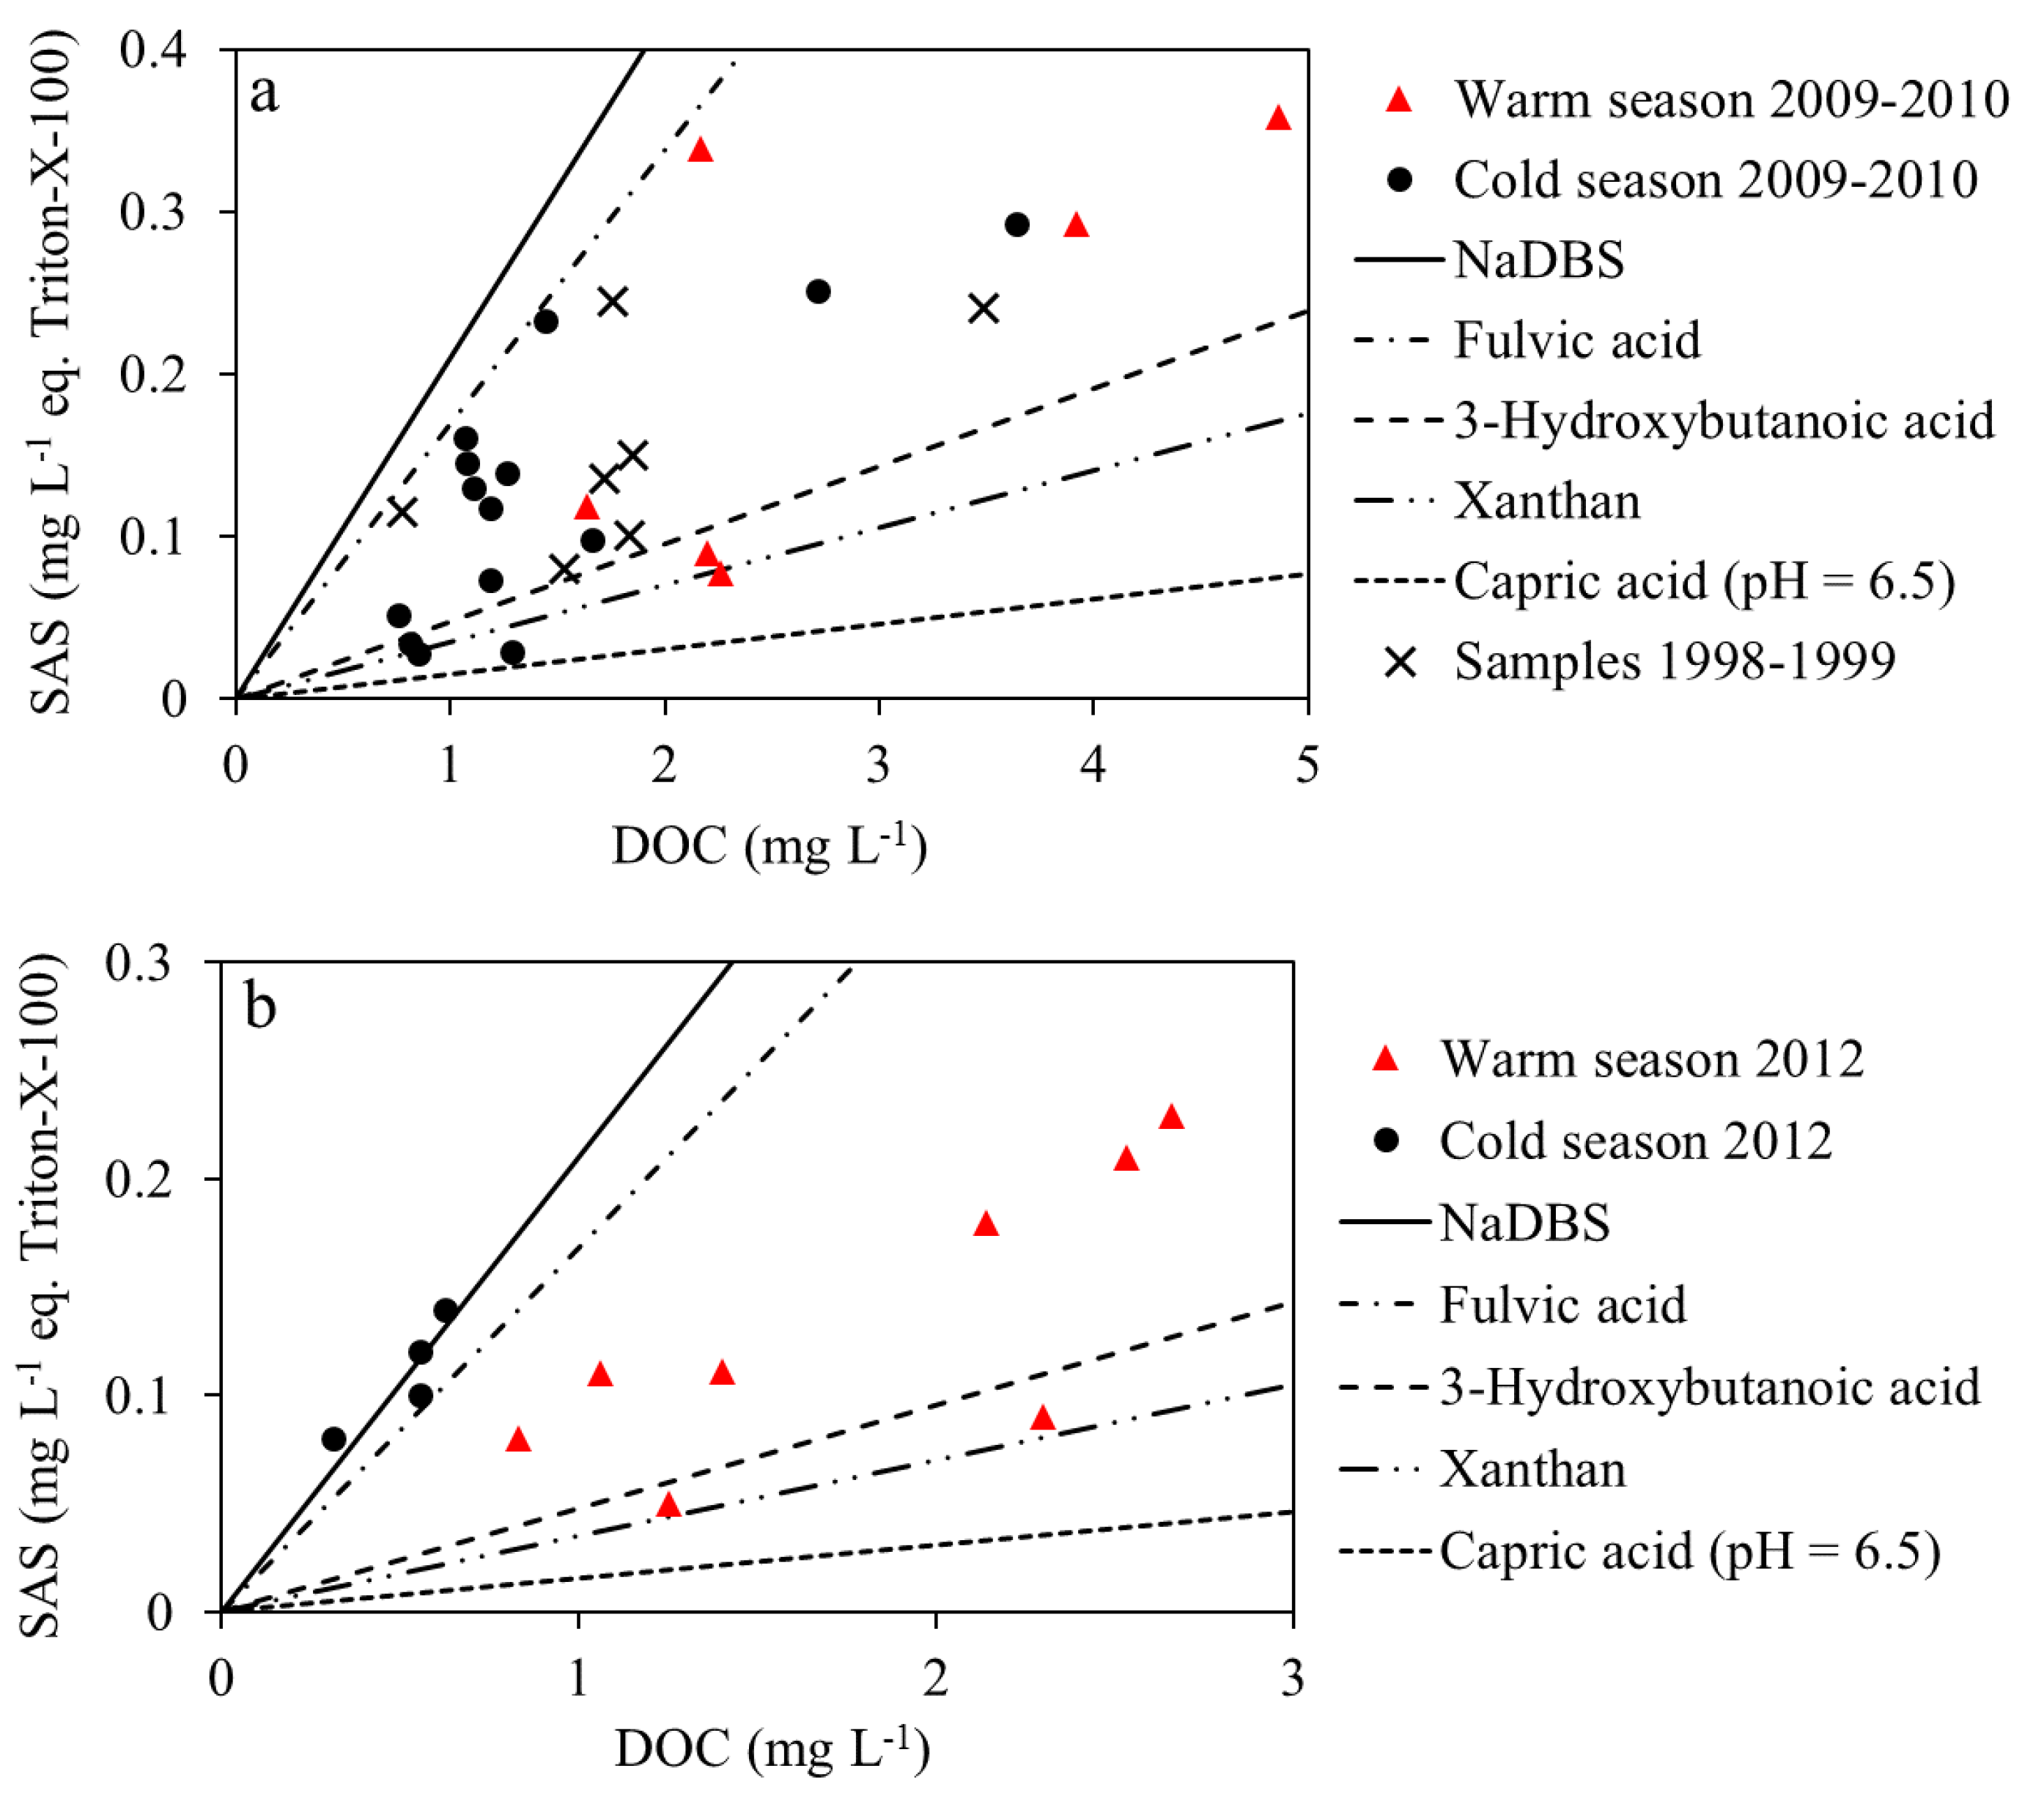
3.2. Surface Active Reactivity Characterization of DOC in Rainwater

The surface reactivity of the DOC was evaluated by the determination of SAS by the electrochemical method. In the present study, the relative concentrations of SAS values in rainwater samples (N = 21) varied between 0.030 and 0.358, with an average of 0.156 ± 0.10 mg L−1 eq. Triton-X-100. The obtained results were compared to those from previous studies in Zagreb [21,22] as well as to levels of SAS in the surface freshwater systems in Croatia (Table 2).
As evident, the more adsorbable SAS were measured in the samples of rainwater than in the surface waters. This may be due to the presence of a higher amount of SAS in the samples but also due to the difference in their nature i.e., surface reactivity [55,65]. Namely, in freshwater systems, surface-active material corresponds mainly to humic-type substances [60], and the surface activity of atmospheric humic substances (HULIS) was found to be higher than that determined for aqueous humic materials [29]. Our SAS results probably reflect these facts. On the other hand, in the literature, it has been shown the importance of adsorption of atmospheric hydrophobic gaseous (volatile and semivolatile organic compounds, VOCs and SOCs) to the surface of atmospheric droplets (cloud, rain, and fog) i.e., on the interface of gaseous phase—atmospheric liquid phase [62,66,67]. For example Wang et al. [67] observed that concentrations of hydrophobic VOCs in cloud water can be supersaturated by a factor of 10–103 in comparison with Henry’s law of equilibrium. Therefore, the relatively high surface-active properties of present organic matter in atmospheric precipitation are probably a consequence of the higher concentration of hydrophobic organic contaminants in rain droplets as has been shown in our earlier studies [23,65].
In order to make a rough characterization of the SAS in the studied samples based on the different hydrophobicity, i.e., different adsorption properties at the mercury surface, the simple electrochemical method developed within the group was applied. In such an approach, the type of OM was estimated by comparison of the rain sample SAS normalized to its DOC content (called normalized surfactant activity, NSA) with the same properties (NSA) of the model substances [65]. For example, hydrophobic substances such as anionic surfactant, sodium dodecyl benzene sulfonate (NaDBS), and fulvic acid are characterized by a higher NSA, i.e., SAS/DOC ratios (0.21 and 0.17) than more hydrophilic OM with the lower SAS/DOC ratio (NSA = 0.05 for 3-hydroxybutanoic acid, 3-HBA, and 0.015 for capric acid) [65]. The application of the method is illustrated in Figure 5.
From Figure 5a, it can be seen that the seasonal differences (warm season, April–June, and cold season, October–March) in the type of SAS are not clearly expressed. Although data from the warm season are slightly shifted toward more hydrophilic substances, the results from the cold season fall between hydrophobic/hydrophilic behavior. The SAS/DOC ratios for precipitation in the previous investigation (1998–1999) are also distributed between fulvic acid and 3-HBA and reflect the very similar hydrophilic/hydrophobic nature of the studied OM. In daily wet-only rain samples (collected in the area of Zagreb in 2012), a defined seasonal pattern of SAS was observed, Figure 5b [68]. During autumn/winter, hydrophobic SAS was the principle fraction, while the hydrophilic fraction becomes more evident during spring/summer. Data from the cold season show a very similar adsorption (reactivity) behavior to NaDBS, while the data from the warm season are grouped close to the line for 3-HBA, pointing to the similar nature of the existing surface-active material. Taking into account that the largest fraction of hydrophobic organic material in the rain comes from incompletely combusted fossil fuels [69], the increase of fuel consumption in the heating season is probably contributing to the obtained differences in the SAS properties.
Additionally, results from an investigation on SAS in the water-soluble organic carbon (WSOC) fraction of PM10, collected in the northern part of Zagreb (2011–2012), have shown a defined seasonal pattern [70]. The concentrations of WSOC fraction were lower in spring/summer (average: 2.97 ± 0.81 and 2.64 ± 0,87 µgC m−3) than in autumn/winter (average: 6.43 ± 3.52 and 7.08 ± 3.16 µgC m−3). During the cold season, hydrophobic WSOC was the principle fraction (autumn/winter), while the hydrophilic fraction becomes more critical during the warm season (spring/summer). A similar result was observed in atmospheric aerosols in Beijing where the mean concentrations of WSOC were 10.2 μg m−3 with increased values in winter and lower values in summer [71].
The complexation of copper ions (CuCC) in rainwater obtained in 11 unfiltered samples varied between 48–370 nM (Figure S1 in Supplementary Materials) with apparent stability constants (log Kapp) in the range between 6.0 and 9.5. The complexation stability constant (log Kapp) can be used to compare the relative stability of the Cu complexes [34]. In the previous study conducted in Zagreb on other location, on the hill (northern part of Zagreb) surrounded by a forest, approximately 2 km (airline) from the city center, with low traffic, the CuCC was higher, up to 586 nM with stability constants, of up to 10 [22]. It is possible that biogenic emissions contributed to these results.
The study of RSS was performed by voltammetric measurements at the Hg electrode. The presence of two different types of RSS that have different interactions with the Hg was confirmed: tiol-type, which forms a complex with Hg, i.e., RS-Hg and sulfide/S0-like compounds which deposit the HgS [72,73]. The compounds that contribute to the RS-Hg interaction were removed by acidification and purging of the samples, indicative of their volatile nature. The acidification and purging step is usually used as an essential methodological step in the characterization of volatile and non-volatile RSS [41,72,73]. S0-like compounds that correspond to nonvolatile RSS contributed to the HgS behavior [41,72,73]. Concentration of volatile and nonvolatile RSS in all studied precipitation samples ranged between 2–8 nM (Table S4 in Supplementary Materials) equivalent to sulfide calibration [41]. The exact nature of the detected RSS is still unknown; however, the fact that a large percentage of the rainwater DOC has been attributed to atmospheric HULIS [27,74], we assume that detected RSS can be associated with the same organic material. The oligomers, organosulfates, and nitrooxy organosulfates obtained in the atmospheric samples could play a significant part in the HULIS fraction of atmospheric organic matter [27] and could contain electrochemically active sulfur as already shown for the same type of organic materials isolated from the lagoon and marine sediments [72,75]. Such complex organic material could contribute to higher solubility and stabilization of volatile RSS in the atmospheric aqueous-phase, as is similarly obtained for natural organic macromolecules and S0 in the seawater and water-soluble fraction of marine aerosol particles [72,73]. Sulfur-containing compounds in the class of carbohydrates and proteins have been recently identified in HULIS extracts of atmospheric aerosol particles collected in the coastal area of South Korea [76].
The same compounds are shown to be electroactive on the Hg [77,78]. This type of OM that includes RSS might be important for speciation as well as for the solubility of trace metals in the atmospheric aqueous-phase.

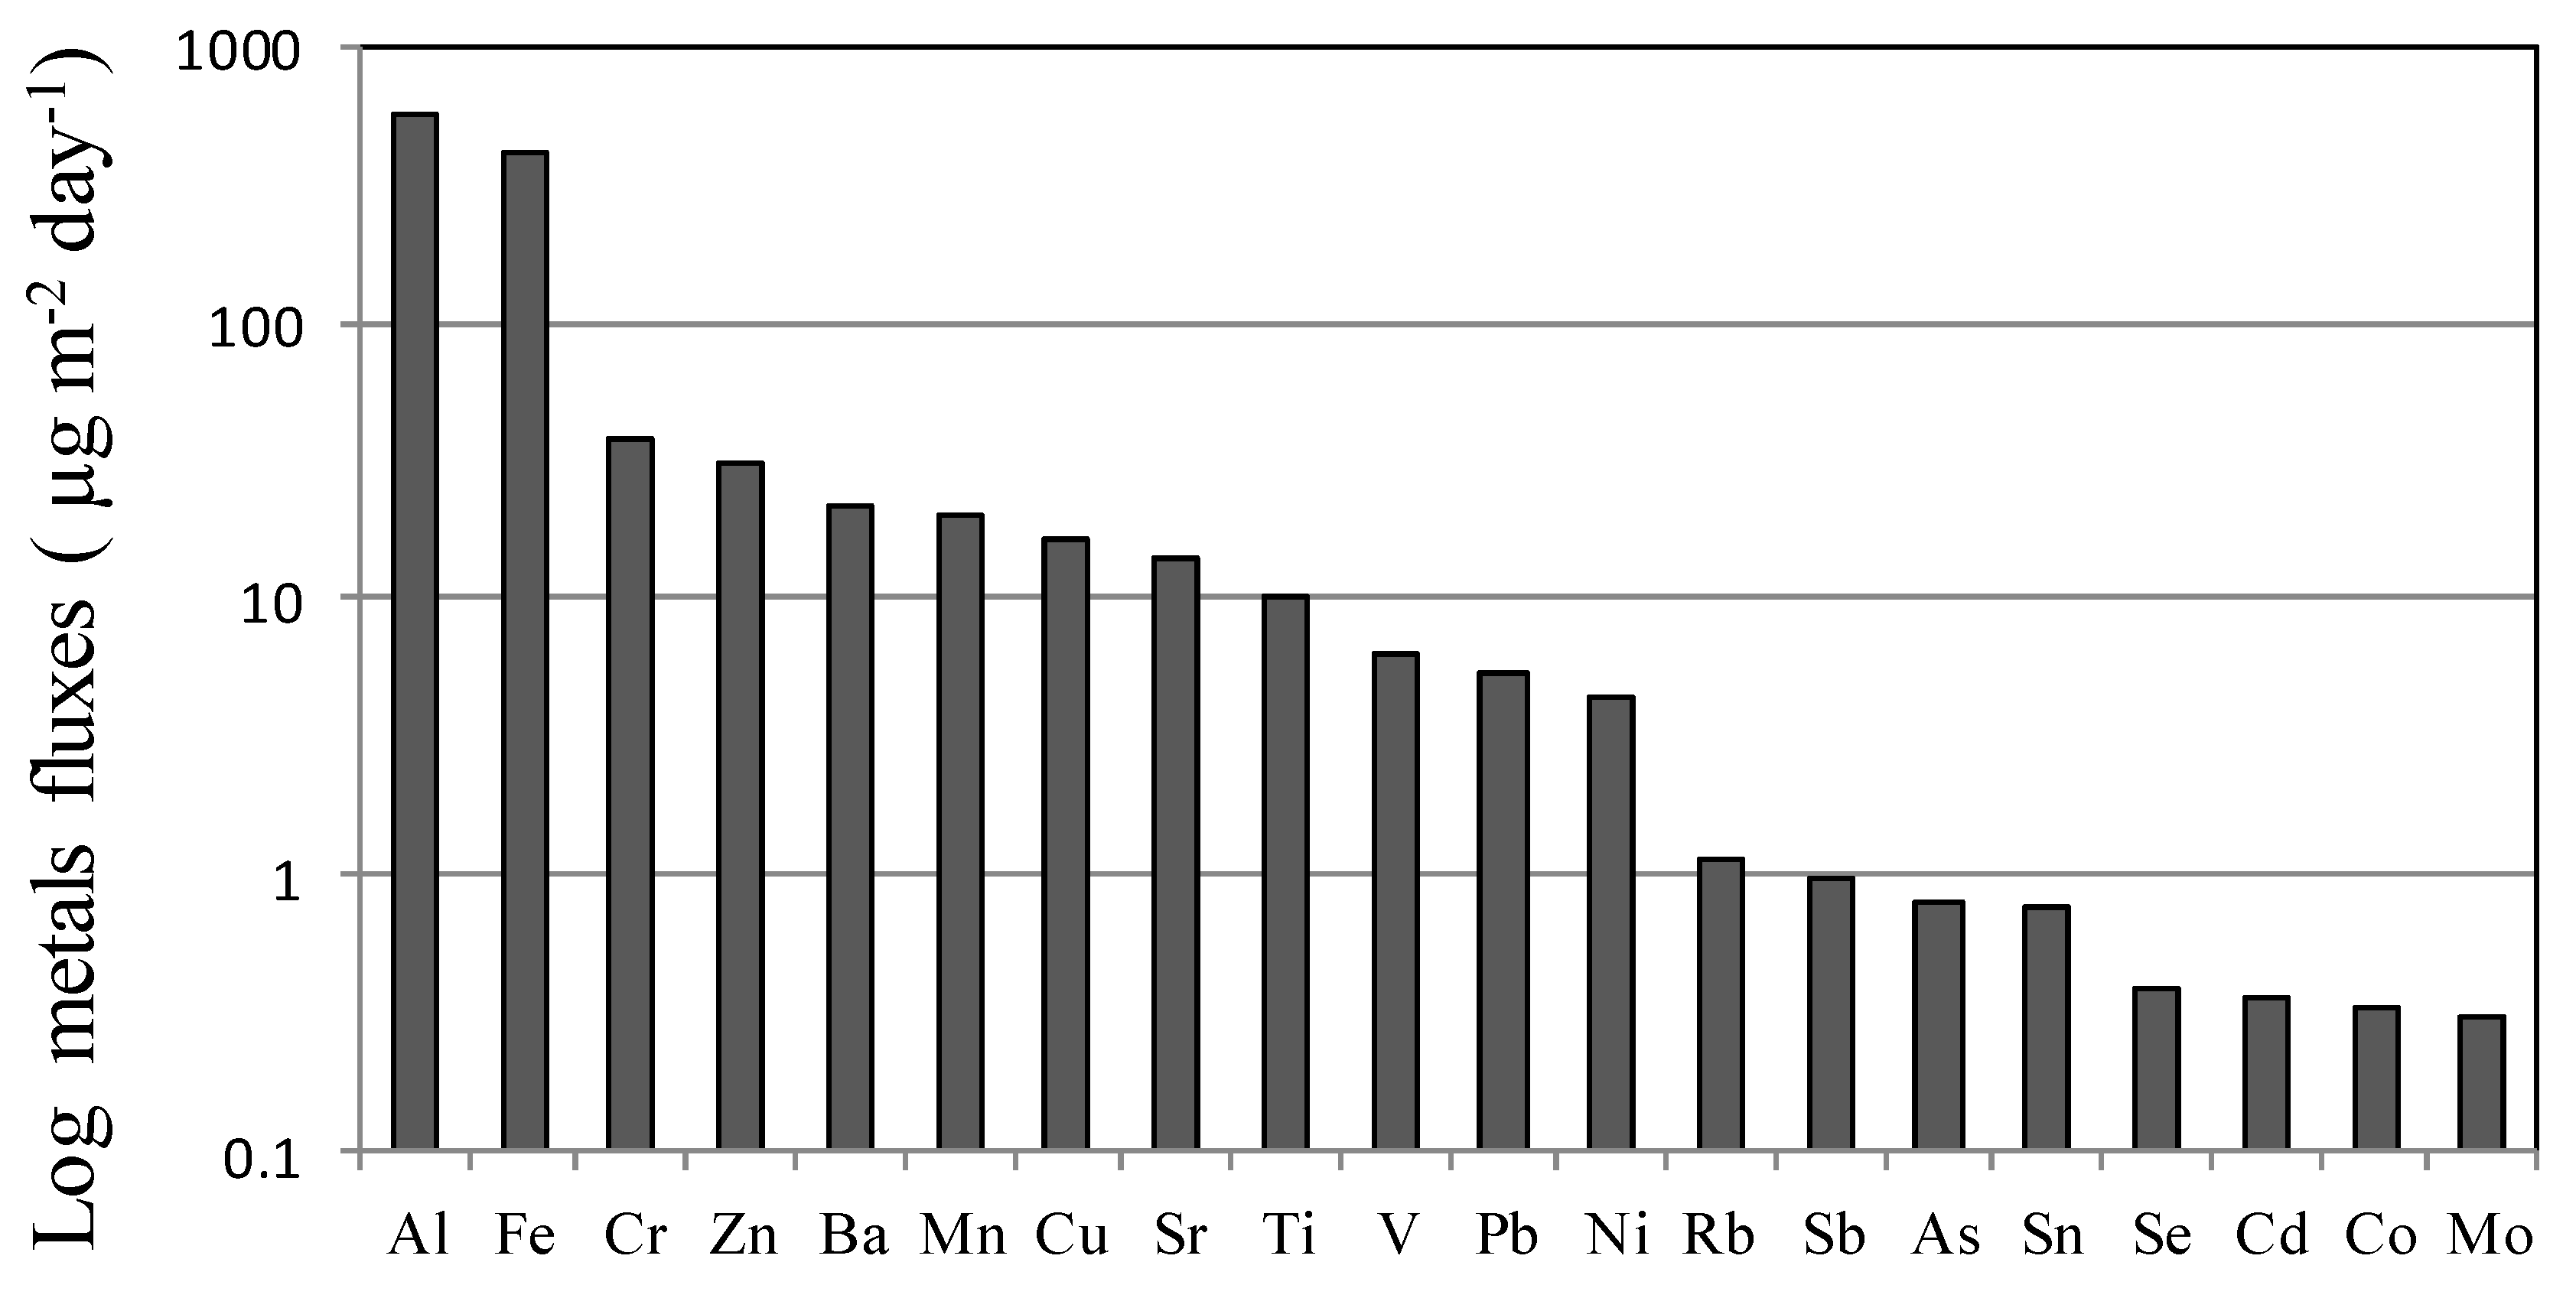
3.3. Metal Content in Rainwater

The trace metals are another important component of rainwater. The levels of twenty metals (Al, Fe, Zn, Cr, Ba, Mn, Cu, Sr, Ti, Pb, V, Ni, Rb, Sb, As, Sn, Se, Co, Cd, Mo) were investigated in rainwater samples (N = 19) in Zagreb, from April 2009 to May 2010. Table S5 in Supplementary Materials represents the descriptive statistic parameters of the total concentrations of TEs. The high standard deviation (SD) reflects the variability of trace metal concentrations. The soil elements (Al and Fe) display the maximum variability of concentrations (high SD). The lowest SD (<1) is calculated for Sn, Co, Cd, Se, and Mo. The distinct variability of different metals between different rainfalls reflects their different origins. The rainfall amount might also influence the temporal variability of metal concentrations [79]. In this study, except for V, all the other metals concentrations are significantly (p < 0.05) negatively correlated with the amount of precipitation, Table S6 in Supplementary Materials. Considering that the abrasion of asphalt is one of the possible sources of V [38]. Zn and Cu have the strongest correlation (r < −0.80; p < 0.0001) with the amount of rainwater. It is possible that the concentrations of these elements were associated with the seasonal variability in precipitation. Such an observation suggests that washout is the main mechanism that incorporates those traces of metals into rainwater [45].
In order to compare our results with those previously published, the average daily fluxes of metals (µg m−2 day−1) were calculated from data regarding metal concentration and daily amount of precipitation (DHZM Data), Figure 6. The highest average fluxes (569.4 and 405.8 µg m−2 day−1) were observed for crustal elements (Al and Fe). Also, the dominant metals in the atmospheric deposition (approximately between 20–40 µg m−2 day−1) were Cr, Zn, Ba, Mn, while Se, Cd, Co, Mo belong to the group with the lowest deposition level (<0.4 µg m−2 day−1). The Zn enrichment of rainwater has been observed worldwide [45] (and references therein). However, we have no explanation for high concentrations of Cr in our samples (up to 23.28 µg L−1 or up to 30.75 µg m−2 day−1 (Table S5 in SI, and Figure 5). There are many possible sources of Cr, such as fossil fuel combustion, resuspended surface dust, and brake wear [37,38]. The concentration of Cr in rainwater is commonly in the range from 0.2–1 μg L−1 [80]. It was found that the deposition of Cr occurs primarily by dry deposition, while wet deposition can only scavenge a relatively small amount of Cr from the atmosphere [81]. Considering that there is no local industrial emission that actively contributes to the abundance of the atmospheric metals in Zagreb, it can be assumed that our sampling site was contaminated by Cr.
We compared our data with literature data using similar sampling procedures. The daily fluxes of Zn, Cu, Mn, Pb, V, and Ni were lower in Zagreb by a factor of about 4, 6, 3, 11, 9, and 7 than those at an industrial site in Belgrade [82]. The comparison was also made with data from the city of Venice [13]. Our results have shown that averaged fluxes of Zn, Ti, Pb, Ni, As, and Cd was significantly reduced (for 3, 11, 3, 2, 2, and 2 times), while data for Cu and V were comparable to those in Venice. In a similar study, conducted in the Northern Spanish coastal urban area, with low to middle pollution level [47], the daily atmospheric deposition of anthropogenic elements V, Ni, As, and Cd, were somewhat lower (by factor 2.0; 2.2; 2.6; 3.5) than those detected in Zagreb. This could be the consequence of a minor influence of industrial emissions over Zagreb, and the main sources of TMs could be ascribed to the domestic heating, traffic, and thermal power plants.

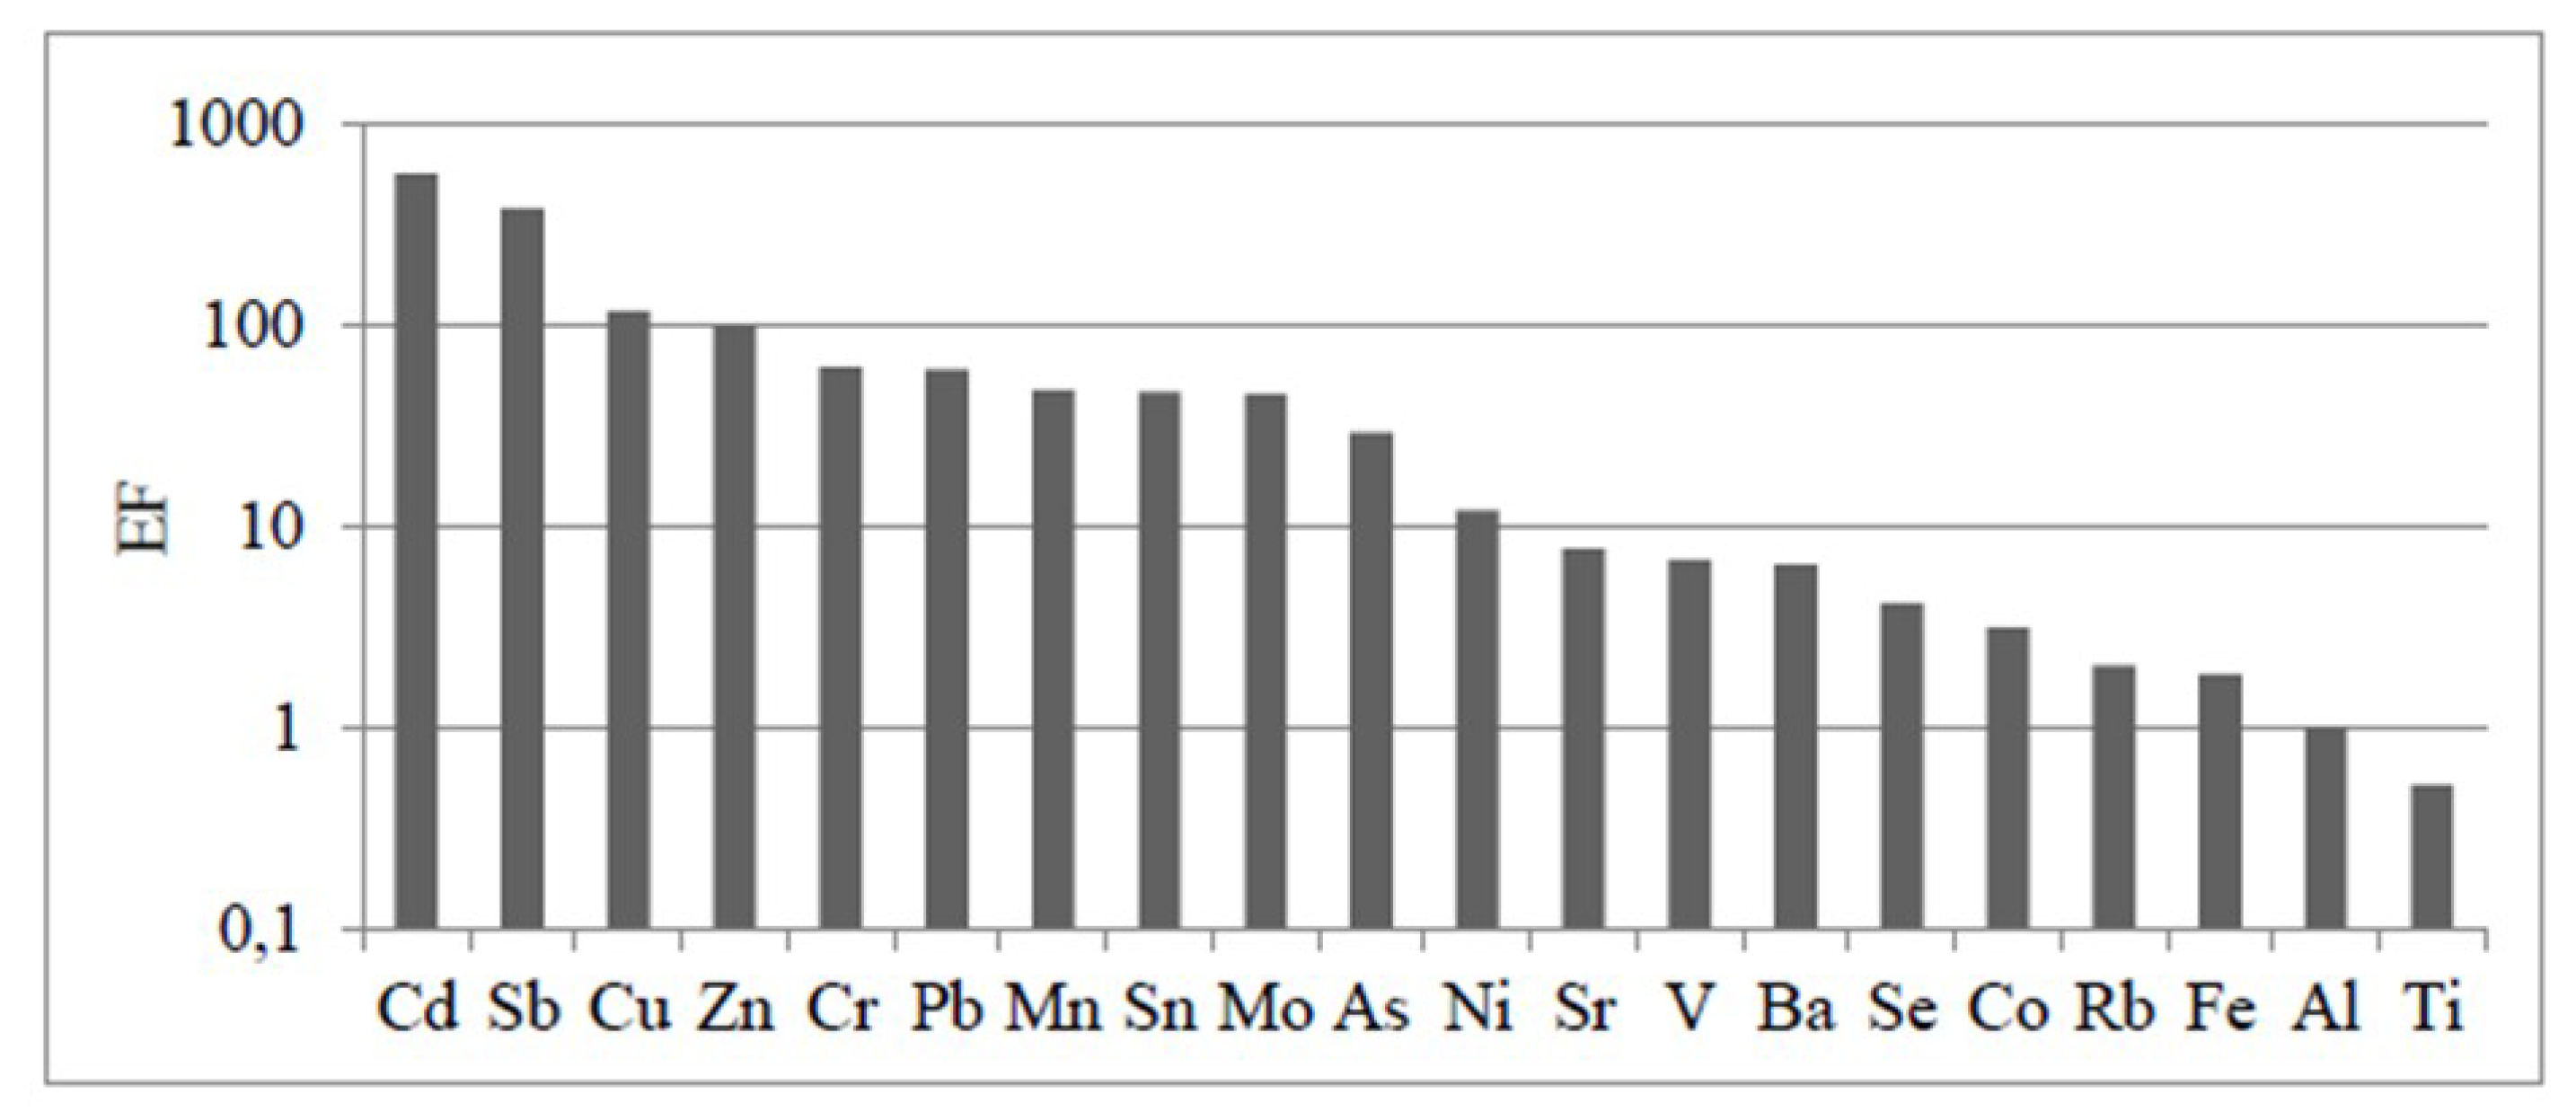
3.3.1. Sources of TEs

Correlations between elemental concentrations in rainwater can help to identify their sources in the atmosphere. The correlation matrixes, including Spearman coefficient values (p ≤ 0.05), were given in Table S7 in Supplementary Materials. With the exception of Cr and V, all the other metals show a significant correlation between themselves. Vanadium significantly correlated (r = 0.67) only with Ni (data not shown), which is indicative of their common source—fossil-fuel combustion. It is known that V and Ni are considered as a tracer of diesel combustion [83]. Cr is not significantly correlated with Pb, Rb, As, Sn, Cd, but it shows a significant and weak correlation with the other investigated metals (0.50 < r < 0.68) (data not shown).
The major crustal element, Al, is highly correlated (r > 0.90) with Fe, Ba, Sr, Ti, Zn, and Co. Of these elements, Fe, Ba, Sr, Ti belong to the same group associated with possible natural geological sources. However, the high correlation of Zn and Co with typical geological marker elements (Al, Fe, Sr, Ti, Mn, Sr) suggests a contribution from road dust, which is enriched in these elements. Previous studies showed that the primary sources of Zn in the urban atmosphere are exhaust emissions from both gasoline and diesel-fueled road vehicles, as well as tire wear [37,80,84] (and references therein). Our result confirms this finding; Zn had a good correlation with a group of metals that generally originate from road traffic emissions (Cu, Pb, Sb, As, Co, Mo) [37,38]. Co, Mo, and Mn are correlated between themselves (Table S7 in Supplementary Materials). These elements are constituents of steel alloys and are therefore correlated [38]. There is also a very high correlation coefficient (r = 0.9) between Cd and Sb, which is mainly derived from brake linings [84]. For Cu, the highest correlation was found with Mo and As, elements that attribute to fossil fuel combustion [37]. It was previously suggested that the vehicle-derived metal Ba is mainly derived from brake wear rather than from combustion [84]. In rainwater samples, Ba correlated well with Sb and with fossil fuel combustion-generated elements such as Zn, Co, and Mo [37]. On the other hand, Ba also correlated well with crustal elements (Al, Fe, Sr, Ti, Mn). However, a significant correlation between the two analyzed concentrations does not necessarily indicate that they originate from the same type of source, but that they under certain physical conditions show similar behavior.
Enrichment factor (EF) as a good indicator for classifying the source of metals (natural or anthropogenic), it was calculated according to Duce et al. [85]. Al is selected as a reference element because it is assumed that it originates exclusively from crustal materials. Elemental crust values were found in Rudnick and Gao [86]. The average EF for metals in rainwater are plotted in Figure 7.
The elements with EF value close to 1, have a crustal source [86]. In our rainwater samples, only Ti has crustal input. Distinctly high EF values (>100) were obtained for Cd, Sb, and Cu point to their anthropogenic sources [79]. The high EF for these elements reflect the local emissions from traffic activities (brake wear). The values of EF in the range between 1 and 10 might indicate the influence of local soil composition [86]. As can be seen from Figure 6, Fe, Rb, Co, Se, Ba, V, and Sr belong to this group. The remaining metals (Ni, As, Mo Sn, Mn, Pb, Cr, Zn), having EF values in the range of 10 to 100 belong to categories classified as moderately enriched, suggesting other sources in addition to crustal material [86].

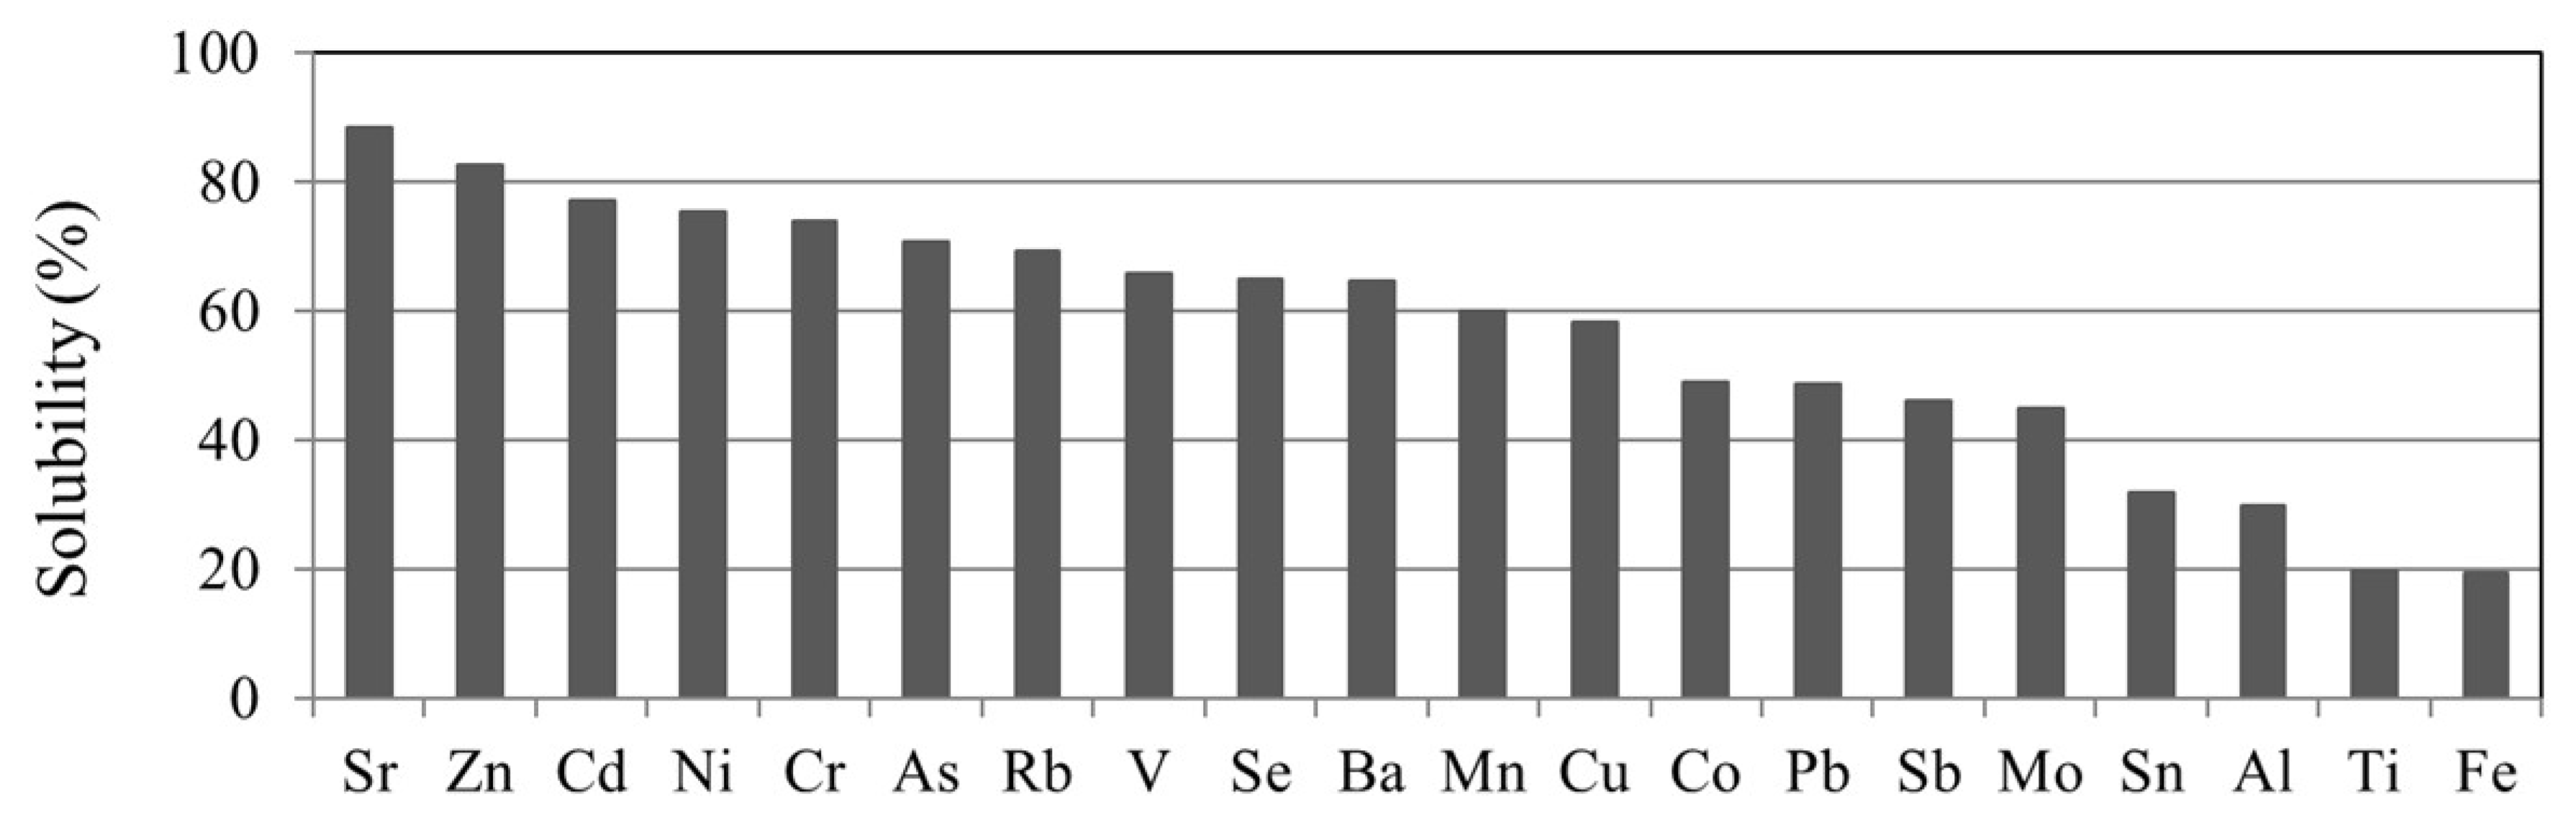
3.3.2. Solubility of TEs in Rainwater

The solubility of TEs determines the distribution of pollutants and bioavailability of deposition [39]. In order to discuss the dissolution tendency of TEs in deposition, we measured the metal concentrations in the 14 filtered samples. In this case, the soluble fraction was defined as that passing through a 0.45 μm membrane filter. For each considered trace metal, the percentage of the solubility was calculated as the ratio [filtered fraction/unfiltered (%)]. The results (average solubility) of all samples are presented in Figure 8.
The average solubility of metals was between 19 and 89%. The solubility of Sr, Zn, Cd, Ni, Cr, As, and Rb exhibits high values, generally greater than 70%. Sr and Zn (>80%) showed the highest solubility. The solubilities of Al, Sn, Mo, Sb, Pb, Co, Cu, Mn, Ba, Se, V, and Rb ranged from 30 to 70%. The crustal elements Al, Ti, and Fe, have the lowest solubility (below 20%), which is in line with the existing literature [44,46,87].
In the literature, it has been shown that pH is an important factor for the solubility of some metals [31,48] (and references therein). However, in this study, no correlation was found between pH values and the solubility of metals (p > 0.05). Probably, in the bulk samples, the relationship between pH values and solubility of metals is masked. Similar results have been obtained in the study of atmospheric bulk deposition in Paris [88].

4. Conclusions

In this study, in daily bulk precipitation samples collected in the urban area of Croatia (Zagreb city center), the characteristics of OM and TEs were investigated. This investigation included measurements of the magnitude and variability of the DOC, POC, and TEs, as well as of the selected reactive classes of organic and sulfur compounds (SAS, CuCC, RSS), having a critical function in both the atmospheric processes and natural surface waters.
The concentrations (0.69–4.86 mg L−1) and the reactivity of DOC (estimated based on the SAS content) demonstrated that the level and composition of DOC in this area had not changed significantly during the observed decade (1998–1999 versus 2009–2011). POC concentrations in rainwater sampled during 2009–2010 varied. The concentration of POC was the most significantly affected by the Saharan dust event.
The study of TEs in rainwater has shown that deposition fluxes of the metals were lower than those published in the literature for the urban areas of Europe. Dominant metals in the atmospheric deposition were Al and Fe (crustal elements). Enrichment factors show that rainwater samples were moderately enriched with Ni, As, Mo Sn, Mn, Pb, Cr, Zn. The very high EF calculated for Cd, Sb, and Cu reflect their anthropogenic origin. The high average solubility (>70%) was found for Sr, Zn, Cd, Ni, Cr, A, and Rb, while the lowest solubility (below 20%) for crustal elements (Al, Fe, and Ti).
Results from this study clearly show how monitoring of precipitation could be an important factor for evaluating the air quality in an urban area and for estimation of atmospheric impact on the other ecosystems. At the same time, the physico-chemical characterization of the rainwater can be a base for a better insight into complex atmospheric aqueous chemistry as well. In addition, this unique study for Zagreb, and Croatia, could serve as a baseline for future investigations in the area.

Supplementary Materials

The following are available online at https://www.mdpi.com/2073-4433/11/2/144/s1, Figure S1: Copper complexing capacity (CuCC) in precipitation., Table S1: Performance of HR ICP-MS analyses: quality control (QC) as represented by analyzing certified standard reference materials “River Water Reference Material for Trace Metals” (SLRS-4, National Research Council Canada) (n = 11), the common level of procedural blanks and method Level of Quantification (LOQ). All values are provided in µg/L, Table S2: Concentration of DOC and pH values in rainwater (Zagreb). Table S3: Correlation between DOC and metal concentrations in rainwater (Zagreb). Tabel S4: RSS concentration and type of interaction with Hg in rainwater samples. Tabel S5: Arithmetic means (µg/L), standard deviations (SD), median, minimum, maximum of trace elements in bulk samples (N = 19) of rainwater. Tabel S6: The relationship between metal concentrations and rainfall amounts. (Spearman correlation coefficients, r and p values). Tabel S7: Spearman correlation matrix for the metals in rainwater samples.

Author Contributions

P.O.-L.: initial study idea, original draft writing. K.V.: data processing for TEs and reviewing the manuscript. I.C.: RSS measurements, initial draft conceptualization and discussion, funding. D.O.: trace metals measurements. I.Š.: data collection, reviewing the manuscript. M.D.S.: MARRES-2 reanalysis using GEOS-5 of dust deposition at Zagreb area. All authors have read and agreed to the published version of the manuscript.

Funding

This research received no external funding.

Acknowledgments

Croatian Science Foundation project IP-2018-01-1717, MARRES is highly acknowledged for unifying of all presented results in this paper. The authors thank Z. Zovko and J. Dautović for the DOC and POC measurements and M. Plavšić for the CuCC measurements, while A. Penzić and S. Frka are highly acknowledged for collecting and SAS measurments in daily wet-only rain samples in 2012. DHZM (I Igrec) is acknowledged for providing rainfall data.

Conflicts of Interest

The authors declare no conflict of interest

References

  1. Brimblecombe, P. Air Composition and Chemistry; Cambridge University Press: Cambridge, UK, 1996. [Google Scholar]
  2. Willey, J.D.; Glinski, D.A.; Southwell, M.; Long, M.S.; Brooks Avery, G.; Kieber, R.J. Decadal variations of rainwater formic and acetic acid concentrations in Wilmington, NC, USA. Atmos. Environ. 2011, 45, 1010–1014. [Google Scholar] [CrossRef]
  3. Jeong, G.Y.; Kim, J.Y.; Seo, J.; Kim, G.M.; Jin, H.C.; Chun, Y. Long-range transport of giant particles in Asian dust identified by physical, mineralogical, and meteorological analysis. Atmos. Chem. Phys. 2014, 14, 505–521. [Google Scholar] [CrossRef] [Green Version]
  4. Richon, C.; Dutay, J.C.; Dulac, F.; Wang, R.; Balkanski, Y. Modeling the biogeochemical impact of atmospheric phosphate deposition from desert dust and combustion sources to the Mediterranean Sea. Biogeosciences 2018, 15, 2499–2524. [Google Scholar] [CrossRef] [Green Version]
  5. Willey, J.D.; Kieber, R.J.; Eyman, M.S.; Avery, G.B., Jr. Rainwater dissolved organic carbon: Concentrations and global flux. Glob. Biogeochem. Cycles 2000, 14, 139–148. [Google Scholar] [CrossRef]
  6. Canic, K.S.; Vidic, S.; Klaic, Z.B. Precipitation chemistry in Croatia during the period 1981–2006. J. Environ. Monit. 2009, 11, 839–851. [Google Scholar] [CrossRef] [PubMed]
  7. Špoler Čanić, K.K., I; Bencetić Klaić, Z. Impact of Saharan Dust on Precipitation Chemistry in Croatia. Available online: https://citeseerx.ist.psu.edu/viewdoc/summary?doi=10.1.1.680.5060 (accessed on 13 October 2019).
  8. Iavorivska, L.; Boyer, E.W.; DeWalle, D.R. Atmospheric deposition of organic carbon via precipitation. Atmos. Environ. 2016, 146, 153–163. [Google Scholar] [CrossRef] [Green Version]
  9. Iavorivska, L.; Boyer, E.W.; Grimm, J.W. Wet atmospheric deposition of organic carbon: An underreported source of carbon to watersheds in the northeastern United States. J. Geophys. Res. Atmospheres 2017, 122, 3104–3115. [Google Scholar] [CrossRef]
  10. Bao, H.Y.; Yi, Y.Y.; Wang, C.; Spencer, R.G.M.; Deng, X.; Guo, W.D. Dissolved organic matter in coastal rainwater: Concentration, bioavailability and depositional flux to seawater in southeastern China. Mar. Chem. 2018, 205, 48–55. [Google Scholar] [CrossRef]
  11. Lawlor, A.; Tipping, E. Metals in bulk deposition and surface waters at two upland locations in northern England. Environ. Pollut. 2003, 121, 153–167. [Google Scholar] [CrossRef]
  12. Tuncel, G.W.a.d.d.f.o.m.i.i.t.E.M. Black Sea and Central Anatolia. Map Tech. Rep. Series 2001, 133, 1–34. [Google Scholar]
  13. Rossini, P.; Guerzoni, S.; Molinaroli, E.; Rampazzo, G.; De Lazzari, A.; Zancanaro, A. Atmospheric bulk deposition to the lagoon of Venice - Part I. Fluxes of metals, nutrients and organic contaminants. Environ. Int. 2005, 31, 959–974. [Google Scholar] [CrossRef] [PubMed] [Green Version]
  14. Chow, M.F.; Lai, C.C.; Kuo, H.Y.; Lin, C.H.; Chen, T.Y.; Shiah, F.K. Long Term Trends and Dynamics of Dissolved Organic Carbon (DOC) in a Subtropical Reservoir Basin. Water 2017, 9, 14. [Google Scholar] [CrossRef]
  15. Kieber, R.J.; Peake, B.; Willey, J.D.; Avery, G.B. Dissolved organic carbon and organic acids in coastal New Zealand rainwater. Atmos. Environ. 2002, 36, 3557–3563. [Google Scholar] [CrossRef]
  16. Pan, Y.; Wang, Y.; Xin, J.; Tang, G.; Song, T.; Wang, Y.; Li, X.; Wu, F. Study on dissolved organic carbon in precipitation in Northern China. Atmos. Environ. 2010, 44, 2350–2357. [Google Scholar] [CrossRef]
  17. Siudek, P.; Frankowski, M.; Siepak, J. Seasonal variations of dissolved organic carbon in precipitation over urban and forest sites in central Poland. Environ. Sci. Pollut. Res. 2015, 22, 11087–11096. [Google Scholar] [CrossRef] [PubMed] [Green Version]
  18. Yan, G.; Kim, G. Dissolved organic carbon in the precipitation of Seoul, Korea: Implications for global wet depositional flux of fossil-fuel derived organic carbon. Atmos. Environ. 2012, 59, 117–124. [Google Scholar] [CrossRef]
  19. Montero-Martínez, G.; Rivera-Arellano, J.; Roy, P.D.; Rosado-Abón, A.; Hernández-Nagay, D.P.; Mendoza-Trejo, A.; Andraca-Ayala, G.L. Content and composition of dissolved organic carbon in precipitation at the southern part of Mexico City. Atmosfera 2018, 31, 331–346. [Google Scholar] [CrossRef]
  20. Niu, H.; Kang, S.; Shi, X.; Zhang, G.; Wang, S.; Pu, T. Dissolved organic carbon in summer precipitation and its wet deposition flux in the Mt. Yulong region, southeastern Tibetan Plateau. J. Atmos. Chem. 2019, 76, 1–20. [Google Scholar] [CrossRef]
  21. Leko, P.O.; Kozarac, Z.; Ćosović, B. Surface active substances (SAS) and dissolved organic matter (DOC) in atmospheric precipitation of urban area of Croatia (Zagreb). Water Air Soil Pollut. 2004, 158, 295–310. [Google Scholar] [CrossRef]
  22. Orlović-Leko, P.; Plavšić, M.; Bura-Nakić, E.; Kozarac, Z.; Ćosović, B. Organic matter in the bulk precipitations in Zagreb and Šibenik, Croatia. Atmos. Environ. 2009, 43, 805–811. [Google Scholar] [CrossRef]
  23. Orlović-Leko, P.; Kozarac, Z.; Ćosović, B.; Strmečki, S.; Plavšić, M. Characterization of atmospheric surfactants in the bulk precipitation by electrochemical tools. J. Atmos. Chem. 2010, 66, 11–26. [Google Scholar] [CrossRef]
  24. Renard, P.; Canet, I.; Sancelme, M.; Wirgot, N.; Deguillaume, L.; Delort, A.M. Screening of cloud microorganisms isolated at the Puy de Dome (France) station for the production of biosurfactants. Atmos. Chem. Phys. 2016, 16, 12347–12358. [Google Scholar] [CrossRef] [Green Version]
  25. Ćosović, B. Adsorption kinetics of the complex mixture of organic solutes at model and natural phase boundaries. In Aquatic Chemical Kinetics, Environmental Science and Technology Series; Weily: New York, NY, USA, 1990; pp. 291–311. [Google Scholar]
  26. Seidl, W. Model for a surface film of fatty acids on rain water and aerosol particles. Atmos. Environ. 2000, 34, 4917–4932. [Google Scholar] [CrossRef]
  27. Graber, E.; Rudich, Y. Atmospheric HULIS: How humic-like are they? A comprehensive and critical review. Atmos. Chem. Phys. 2006, 6, 729–753. [Google Scholar] [CrossRef] [Green Version]
  28. Kristensen, T.B.; Du, L.; Nguyen, Q.T.; Nojgaard, J.K.; Koch, C.B.; Nielsen, O.F.; Hallar, A.G.; Lowenthal, D.H.; Nekat, B.; van Pinxteren, D.; et al. Chemical properties of HULIS from three different environments. J. Atmos. Chem. 2015, 72, 65–80. [Google Scholar] [CrossRef]
  29. Santos, P.S.; Santos, E.B.; Duarte, A.C. First spectroscopic study on the structural features of dissolved organic matter isolated from rainwater in different seasons. Sci. Total Environ. 2012, 426, 172–179. [Google Scholar] [CrossRef] [PubMed]
  30. Willey, J.D.; Kieber, R.J.; Seaton, P.J.; Miller, C. Rainwater as a source of Fe(II)-stabilizing ligands to seawater. Limnol. Oceanogr. 2008, 53, 1678–1684. [Google Scholar] [CrossRef]
  31. Okochi, H.; Brimblecombe, P. Potential trace metal–organic complexation in the atmosphere. The Sci. World J. 2002, 2, 767–786. [Google Scholar] [CrossRef] [Green Version]
  32. Witt, M.; Jickells, T. Copper complexation in marine and terrestrial rain water. Atmos. Environ. 2005, 39, 7657–7666. [Google Scholar] [CrossRef]
  33. Witt, M.; Skrabal, S.; Kieber, R.; Willey, J. Copper complexation in coastal rainwater, southeastern USA. Atmos. Environ. 2007, 41, 3619–3630. [Google Scholar] [CrossRef]
  34. Plavšić, M.; Orlović-Leko, P.; Kozarac, Z.; Bura-Nakić, E.; Strmečki, S.; Ćosović, B. Complexation of copper ions in atmospheric precipitation in Croatia. Atmos. Res. 2008, 87, 80–87. [Google Scholar] [CrossRef] [Green Version]
  35. Louis, Y.; Garnier, C.; Lenoble, V.; Mounier, S.; Cukrov, N.; Omanovic, D.; Pizeta, I. Kinetic and equilibrium studies of copper-dissolved organic matter complexation in water column of the stratified Krka River estuary (Croatia). Mar. Chem. 2009, 114, 110–119. [Google Scholar] [CrossRef]
  36. Baker, A.R.; Croot, P.L. Atmospheric and marine controls on aerosol iron solubility in seawater. Mar. Chem. 2010, 120, 4–13. [Google Scholar] [CrossRef]
  37. Allen, A.; Nemitz, E.; Shi, J.; Harrison, R.; Greenwood, J. Size distributions of trace metals in atmospheric aerosols in the United Kingdom. Atmos. Environ. 2001, 35, 4581–4591. [Google Scholar] [CrossRef]
  38. Johansson, C.; Norman, M.; Burman, L. Road traffic emission factors for heavy metals. Atmos. Environ. 2009, 43, 4681–4688. [Google Scholar] [CrossRef]
  39. Faloona, I. Sulfur processing in the marine atmospheric boundary layer: A review and critical assessment of modeling uncertainties. Atmos. Environ. 2009, 43, 2841–2854. [Google Scholar] [CrossRef]
  40. Watts, S.F. The mass budgets of carbonyl sulfide, dimethyl sulfide, carbon disulfide and hydrogen sulfide. Atmos. Environ. 2000, 34, 761–779. [Google Scholar] [CrossRef]
  41. Orlović-Leko, P.; Omanović, D.; Ciglenečki, I.; Vidović, K.; Brenko, T. Application of electrochemical methods in the physicochemical characterization of atmospheric precipitation. Bulg. Chem. Commun. 2017, 49, 211–217. [Google Scholar]
  42. Rozan, T.F.; Lassman, M.E.; Ridge, D.P.; Luther, G.W., III. Evidence for iron, copper and zinc complexation as multinuclear sulphide clusters in oxic rivers. Nature 2000, 406, 879. [Google Scholar] [CrossRef]
  43. Wong, C.S.C.; Li, X.; Thornton, I. Urban environmental geochemistry of trace metals. Environ. Pollut. 2006, 142, 1–16. [Google Scholar] [CrossRef] [Green Version]
  44. Al-Momani, I.F. Trace elements in atmospheric precipitation at Northern Jordan measured by ICP-MS: Acidity and possible sources. Atmos. Environ. 2003, 37, 4507–4515. [Google Scholar] [CrossRef]
  45. Hou, H.; Takamatsu, T.; Koshikawa, M.; Hosomi, M. Trace metals in bulk precipitation and throughfall in a suburban area of Japan. Atmos. Environ. 2005, 39, 3583–3595. [Google Scholar] [CrossRef]
  46. Okubo, A.; Takeda, S.; Obata, H. Atmospheric deposition of trace metals to the western North Pacific Ocean observed at coastal station in Japan. Atmos. Res. 2013, 129, 20–32. [Google Scholar] [CrossRef]
  47. Fernández-Olmo, I.; Puente, M.; Montecalvo, L.; Irabien, A. Source contribution to the bulk atmospheric deposition of minor and trace elements in a Northern Spanish coastal urban area. Atmos. Res. 2014, 145, 80–91. [Google Scholar] [CrossRef] [Green Version]
  48. Başak, B.; Alagha, O. Trace metals solubility in rainwater: Evaluation of rainwater quality at a watershed area, Istanbul. Environ. Monit. Assess. 2010, 167, 493–503. [Google Scholar] [CrossRef] [PubMed]
  49. Heimburger, A.; Losno, R.; Triquet, S. Solubility of iron and other trace elements in rainwater collected on the Kerguelen Islands (South Indian Ocean). Biogeosciences 2013, 10, 6617–6628. [Google Scholar] [CrossRef] [Green Version]
  50. Statistics Cost-Based Optimizer. Statistical Yearbook of the Republic of Croatia. Available online: http://www.dzs.hr/Hrv_Eng/ljetopis/2010/SLJH2010.pdf (accessed on 13 October 2019).
  51. Statistics Cost-Based Optimizer. Statistical Yearbook of the Republic of Croatia. Available online: http://www.dzs.hr/Hrv_Eng/ljetopis/2011/SLJH2011.pdf (accessed on 12 September 2019).
  52. Statistical Yearbook of the Republic of Croatia. Available online: https://www.dzs.hr/Hrv_Eng/ljetopis/2012/sljh2012.pdf (accessed on 12 September 2019).
  53. Kanakidou, M.; Seinfeld, J.H.; Pandis, S.N.; Barnes, I.; Dentener, F.J.; Facchini, M.C.; Van Dingenen, R.; Ervens, B.; Nenes, A.; Nielsen, C.J. Organic aerosol and global climate modelling: A review. Atmos. Chem. Phys. 2005, 5, 1053–1123. [Google Scholar] [CrossRef] [Green Version]
  54. Cosovic, B.; Vojvodic, V. Voltammetric analysis of surface active substances in natural seawater. Electroanalysis 1998, 10, 429–434. [Google Scholar] [CrossRef]
  55. Orlović-Leko, P.; Vidović, K.; Plavšić, M.; Ciglenečki, I.; Šimunić, I.; Minkina, T. Voltammetry as a tool for rough and rapid characterization of dissolved organic matter in the drainage water of hydroameliorated agricultural areas in Croatia. J. Solid State Electrochem. 2016, 20, 3097–3105. [Google Scholar] [CrossRef]
  56. Balla, D.; Papageorgiou, A.; Voutsa, D. Carbonyl compounds and dissolved organic carbon in rainwater of an urban atmosphere. Environ. Sci. Pollut. Res. 2014, 21, 12062–12073. [Google Scholar] [CrossRef]
  57. Strmecki, S.; Ciglenecki, I.; Udovic, M.G.; Margus, M.; Bura-Nakic, E.; Dautovic, J.; Plavsic, M. Voltammetric Study of Organic Matter Components in the Upper Reach of the Krka River, Croatia. Croat. Chem. Acta 2018, 91, 447–454. [Google Scholar] [CrossRef]
  58. Šimunić, I.; Orlović-Leko, P.; Marić, A.S.; Ciglenečki, I.; Tatiana, M.; Filipović, V. Quality of Surface Water in the Agricultural District Lonja Field (Croatia). Agric. For. 2017, 63, 5–14. [Google Scholar]
  59. Orlović-Leko, L.Š.I.; DautovićOrlović-Leko, J.; Ciglenečki, I. Dissolved Organic Carbon (DOC) in the surface waters in the agricultural area (Lonja field, Croatia). In 7th Croatian Water Conference, Croatian Waters in Environmetal and Nature Protection; Biondić, D., Holjević, D., Vizner, M., Eds.; Opatija, Croatia, 2019; pp. 287–291. [Google Scholar]
  60. Cvrković-Karloci, Ž.; Krznarić, D.; Šeruga, M.; Ćosović, B. Simple electrochemical determination of surface-active substances in natural waters. Int. J. Electrochem. 2011, 2011. [Google Scholar] [CrossRef] [Green Version]
  61. Cukrov, N.; Cmuk, P.; Mlakar, M.; Omanovic, D. Spatial distribution of trace metals in the Krka River, Croatia: An example of the self-purification. Chemosphere 2008, 72, 1559–1566. [Google Scholar] [CrossRef]
  62. Capel, P.D.; Gunde, R.; Zuercher, F.; Giger, W. Carbon speciation and surface tension of fog. Environ. Sci. Technol. 1990, 24, 722–727. [Google Scholar] [CrossRef]
  63. Buchard, V.; Randles, C.A.; da Silva, A.M.; Darmenov, A.; Colarco, P.R.; Govindaraju, R.; Ferrare, R.; Hair, J.; Beyersdorf, A.J.; Ziemba, L.D. The MERRA-2 Aerosol Reanalysis, 1980 Onward. Part II: Evaluation and Case Studies. J. Clim. 2017, 30, 6851–6872. [Google Scholar] [CrossRef]
  64. Global Modeling and Assimilation Office. Available online: https://gmao.gsfc.nasa.gov/GMAO_products/reanalysis_products.php (accessed on 20 January 2020).
  65. Ćosović, B.; Orlović Leko, P.; Kozarac, Z. Rainwater dissolved organic carbon: Characterization of surface active substances by electrochemical method. Electroanal. Int. J. Devoted Fundam. Pract. Aspects Electroanal. 2007, 19, 2077–2084. [Google Scholar]
  66. Simcik, M.F. The importance of surface adsorption on the washout of semivolatile organic compounds by rain. Atmos. Environ. 2004, 38, 491–501. [Google Scholar] [CrossRef]
  67. Wang, M.; Perroux, H.; Fleuret, J.; Bianco, A.; Bouvier, L.; Colomb, A.; Borbon, A.; Deguillaume, L. Anthropogenic and biogenic hydrophobic VOCs detected in clouds at the puy de Dôme station using Stir Bar Sorptive Extraction: Deviation from the Henry’s law prediction. Atmos. Res. 2020, 104844. [Google Scholar] [CrossRef]
  68. Orlović-Leko, P.F.S.; Penezić, A.; Vidović, K.; Plećaš, S. Surface activity of precipitation and aerosol on the Zagreb area. In Proceedings of the 6th Croatian Water Conference, Opatija, Croatia, 20–23 May 2015. [Google Scholar]
  69. Avery, G.B.; Biswas, K.F.; Mead, R.; Southwell, M.; Willey, J.D.; Kieber, R.J.; Mullaugh, K.M. Carbon isotopic characterization of hydrophobic dissolved organic carbon in rainwater. Atmos. Environ. 2013, 68, 230–234. [Google Scholar] [CrossRef]
  70. Vidović, K. Seasonal Variation of Properties of Organic Matter in Aerosol in the Atmosphere over Zagreb. Master’s Thesis, University of Zagreb, Zagreb, Croatian, 2014. [Google Scholar]
  71. Tang, X.; Zhang, X.S.; Wang, Z.W.; Ci, Z.J. Water-soluble organic carbon (WSOC) and its temperature-resolved carbon fractions in atmospheric aerosols in Beijing. Atmos. Res. 2016, 181, 200–210. [Google Scholar] [CrossRef]
  72. Bura-Nakić, E.; Helz, G.R.; Ciglenečki, I.; Ćosović, B. Seasonal variations in reduced sulfur species in a stratified seawater lake (Rogoznica Lake, Croatia); evidence for organic carriers of reactive sulfur. Geochim. Cosmochim. Acta 2009, 73, 3738. [Google Scholar] [CrossRef]
  73. Cvitešić Kušan, A.F.S.; Ciglenečki, I. Electrochemical Evidence of non-Volatile Reduced Sulfur Species in Water-Soluble Fraction of Fine Marine Aerosols. Atmosphere 2019, 10, 674. [Google Scholar] [CrossRef] [Green Version]
  74. Feng, J.; Möller, D. Characterization of water-soluble macromolecular substances in cloud water. J. Atmos. Chem. 2004, 48, 217–233. [Google Scholar] [CrossRef]
  75. Gašparović, B.; Ćosović, B. Electrochemical estimation of the dominant type of surface active substances in seawater samples using o-nitrophenol as a probe. Mar. Chem. 1994, 46, 179–188. [Google Scholar] [CrossRef]
  76. Jang, K.-S.; Choi, A.Y.; Choi, M.; Kang, H.; Kim, T.-W.; Park, K.-T. Size-Segregated Chemical Compositions of HULISs in Ambient Aerosols Collected during the Winter Season in Songdo, South Korea. Atmosphere 2019, 10, 226. [Google Scholar] [CrossRef] [Green Version]
  77. Strmečki, S.; Plavšić, M.; Steigenberger, S.; Passow, U. Characterization of phytoplankton exudates and carbohydrates in relation to their complexation of copper, cadmium and iron. Mar. Ecol. Prog. Ser. 2010, 408, 33–46. [Google Scholar] [CrossRef] [Green Version]
  78. Strmečki, S.; Paleček, E. Adsorption/desorption of biomacromolecules involved in catalytic hydrogen evolution. Bioelectrochemistry 2018, 120, 87–93. [Google Scholar] [CrossRef]
  79. Al-Khashman, O.A. Study of chemical composition in wet atmospheric precipitation in Eshidiya area, Jordan. Atmos. Environ. 2005, 39, 6175–6183. [Google Scholar] [CrossRef]
  80. Potential for Human Exposure. Available online: https://www.atsdr.cdc.gov/toxprofiles/tp7-c6.pdf (accessed on 7 October 2019).
  81. Gunawardena, J.; Egodawatta, P.; Ayoko, G.A.; Goonetilleke, A. Atmospheric deposition as a source of heavy metals in urban stormwater. Atmos. Environ. 2013, 68, 235–242. [Google Scholar] [CrossRef] [Green Version]
  82. Mijic, Z.; Stojic, A.; Perisic, M.; Rajsic, S.; Tasic, M.; Radenkovic, M.; Joksic, J. Seasonal variability and source apportionment of metals in the atmospheric deposition in Belgrade. Atmos. Environ. 2010, 44, 3630–3637. [Google Scholar] [CrossRef]
  83. Fabretti, J.F.; Sauret, N.; Gal, J.F.; Maria, P.C.; Scharer, U. Elemental characterization and source identification of PM2.5 using Positive Matrix Factorization: The Malraux road tunnel, Nice, France. Atmos. Res. 2009, 94, 320–329. [Google Scholar] [CrossRef]
  84. Sternbeck, J.; Sjodin, A.; Andreasson, K. Metal emissions from road traffic and the influence of resuspension—Results from two tunnel studies. Atmos. Environ. 2002, 36, 4735–4744. [Google Scholar] [CrossRef]
  85. Duce, R.A.; Hoffman, G.L.; Zoller, W.H. Atmospheric Trace-Metals at Remote Northern and Southern-Hemisphere Sites—Pollution or Natural. Science 1975, 187, 59–61. [Google Scholar] [CrossRef]
  86. Rudnick, R.L.; Gao, S. The Crust, 3.01—The Composition of the Continental Crust. In Treatise on Geochemistry; Elsevier-Pergamon: Oxford, UK; pp. 1–64.
  87. Giusti, L.; Yang, Y.L.; Hewitt, C.N.; Hamiltontaylor, J.; Davison, W. The Solubility and Partitioning of Atmospherically Derived Trace-Metals in Artificial and Natural-Waters—A review. Atmos. Environ. Part A Gen. Top. 1993, 27, 1567–1578. [Google Scholar] [CrossRef]
  88. Motelay-Massei, A.; Ollivon, D.; Tiphagne, K.; Garban, B. Atmospheric bulk deposition of trace metals to the Seine River Basin, France: Concentrations, sources and evolution from 1988 to 2001 in Paris. Water Air Soil Pollut. 2005, 164, 119–135. [Google Scholar] [CrossRef]
Figure 1. Position of the sampling site (adapted from Google Maps).
Atmosphere 11 00144 g001
Figure 2. Monthly precipitation 2009/2010 at Zagreb area [50,51].
Atmosphere 11 00144 g002
Figure 3. Temporal variability of dissolved organic carbon (DOC), particulate forms of organic carbon (POC) concentrations in rainwater in Zagreb, and daily amount of precipitation during the sampling period (2009–2011).
Atmosphere 11 00144 g003
Figure 4. MARRES-2 reanalysis using GEOS-5 of dust deposition at Zagreb area from 24 April to 5 May in 2010 with visible maximum of dust on 5 May (a), and dust deposition over Mediterranean area, including Croatia, i.e., Zagreb area, at 5 May 2010 at 05:30. GEOS-5 system [63] has a resolution of 50 km, and forecast the dust, sea salt, POC, black carbon, and sulfates [64].
Atmosphere 11 00144 g004
Figure 5. Correlation concentrations of SAS vs. DOC values obtained in the cold/warm season in daily rain samples in Zagreb: (a) bulk samples from 2009/2010 (current study) (b) wet—only samples from 2012 [68] The lines correspond to the model substances [65].
Atmosphere 11 00144 g005
Figure 6. Average daily fluxes of trace elements (μg m−2 day−1) in Zagreb (April 2009 to May 2010).
Atmosphere 11 00144 g006
Figure 7. Average enrichment factors (EF) for trace elements in rainwater.
Atmosphere 11 00144 g007
Figure 8. Average solubility of the trace metals in rainwater.
Atmosphere 11 00144 g008
Table 1. Comparison of DOC concentrations between rainwater and natural surface waters in Croatia.
Aquatic System (Croatia)DOC (mgC L−1)References
Lake Brljan (Krka River)0.505–1.530[57]
River Sava (Zagreb)1.14–2.31 a
River Lonja 4.62–7.75 [58,59]
River Drava (Osijek)4.91[60]
River Dunav (Batina)4.21[60]
Rainwater (Zagreb)0.69–4.86 b
a Data 2016; b Data 2009–2011.
Table 2. Concentration of SAS (mg L−1 eq. Triton-X-100) in surface and rainwaters in Croatia.
Aquatic system (Croatia)SASReferences
Rainwater (Zagreb)0.090–0.37[21]
Rainwater (Zagreb) 0.055–0.450 (0.140 *)[22]
Lake Brljan (Krka River) 0.018–0.150[57]
River Sava0.153–0.255 [58]
River Lonja 0.209–0.258 a
Lake Maksimir (Zagreb) 0.263 b
Rainwater (Zagreb)0.030–0.358 (0.156 *) c
* Average value. a Data 2017–2019; b Data 2017; c Data 2009–2011.

