1. Introduction
Since the famines of Biafra and Ethiopia in the 1980s, the international community has taken steps to develop early warning systems (EWSs) to trigger timely action to prevent natural disasters. The humanitarian community persistently equates drought with food insecurity [
1]. As a result, the EWSs that have been developed by the humanitarian community are focused on identifying triggers for drought-related food insecurity. At the country level in Sub-Saharan Africa, several well-established drought EWSs exist, for instance, in Kenya, Tanzania, and Ethiopia [
2,
3,
4,
5,
6]. None of these countries has to date established a food EWS that would be separate and additional to the drought EWS [
7]. The past decades have seen significant advancement in the development of drought EWSs, including through developing the indicators used [
8].
Drought-related food insecurity is persistent in Kenya [
9]. Humanitarian interventions have had little positive impact and, in some cases, even a negative impact [
10,
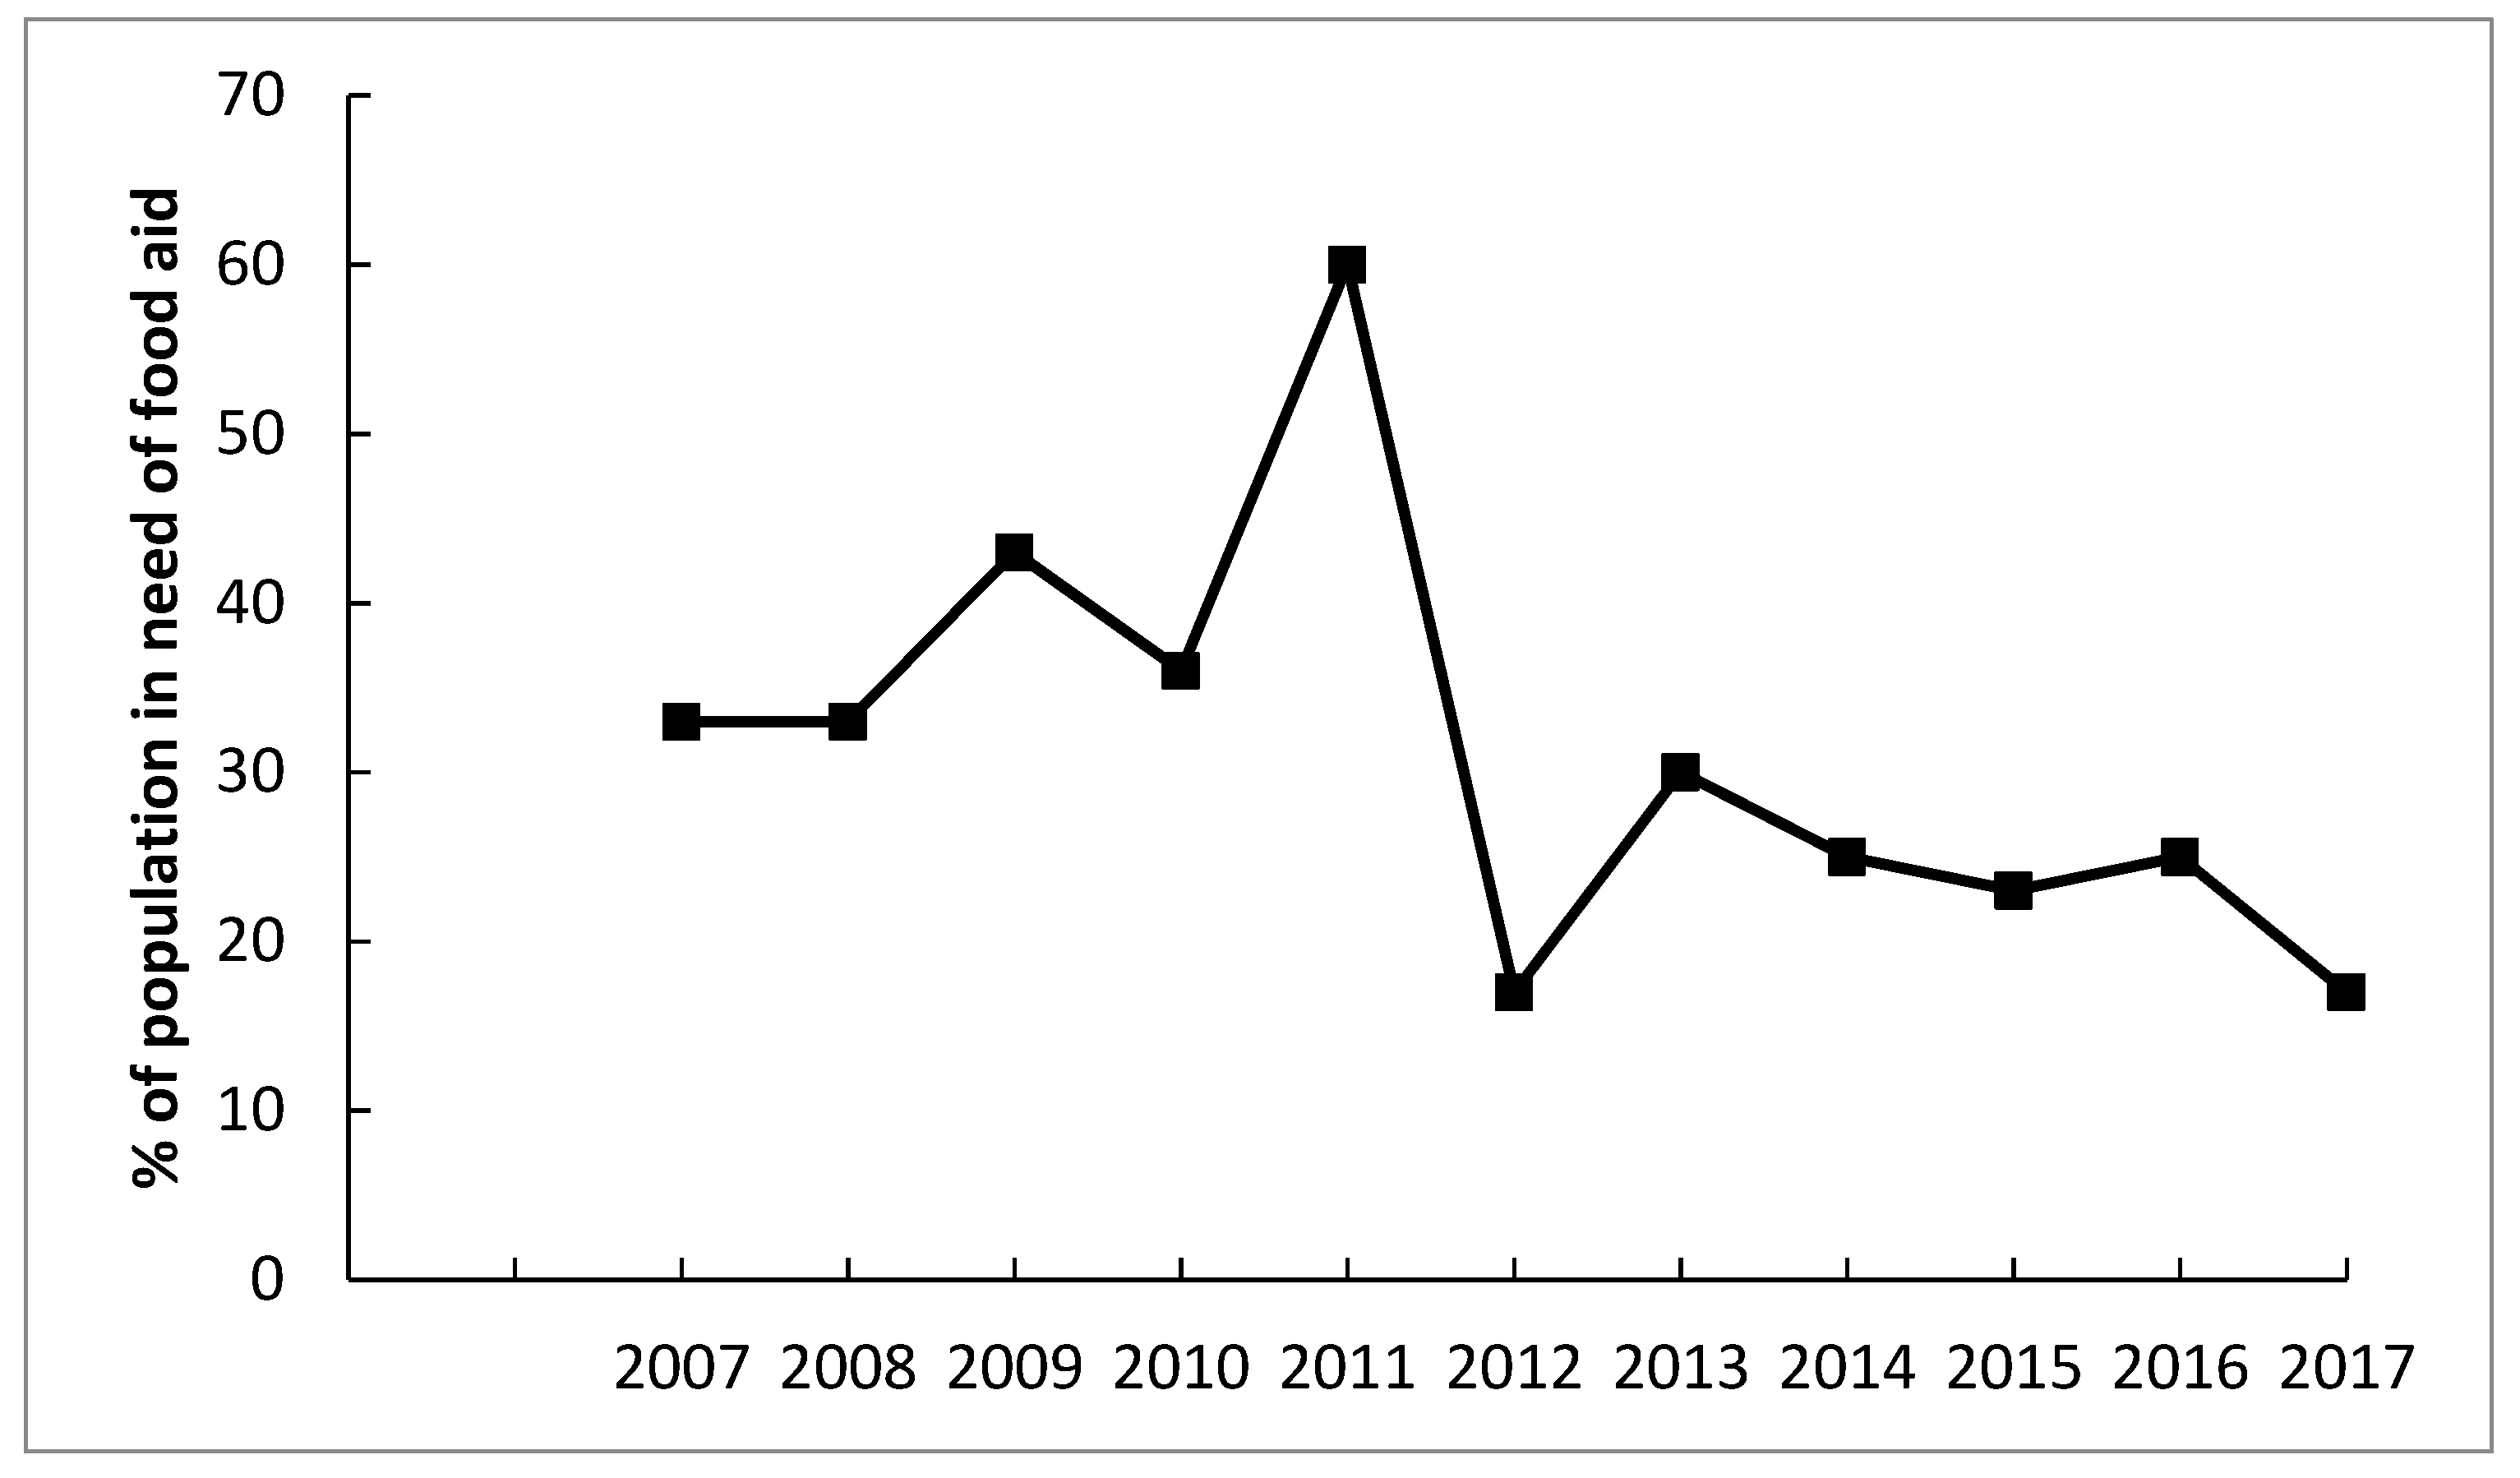
11]. The total number and proportion of people requiring food aid have remained consistently high [
10]; for example, in September 2020, the Famine EWS Network (FEWSNET) predicted that up to 10 million people in the country will need food aid in the next six months [
12]. The Kenyan drought management system consists of national policies setting the regulatory framework, a drought EWS with a set of predetermined warning stages, county-level drought contingency plans, and drought contingency funds, as well as coordination structures at the county and national level. In addition, a range of programs are being implemented to increase resilience and reduce drought risk [
13]. Drought management is also increasingly integrated into the wider national disaster management framework [
4,
5]. Drought management is led and coordinated by the National Drought Management Agency (NDMA), established under the Ministry of Devolution and Planning in 2011 [
6]. The mandate of the NDMA includes coordination of structures for drought management, operation of the drought EWS, support for drought-related policy formation, and coordination of disaster risk reduction activities [
6,
14].
Although recent years have seen a strengthening of the institutional framework for drought management in Kenya, the existence of the NDMA means that drought issues are handled separately from general agricultural policies and programs, which are managed by the Ministry of Agriculture, Livestock and Fisheries. This distinction between emergencies and long-term development provides major challenges to coordination of drought management and food security initiatives [
15].
For coordination of food security responses, the Kenya Food Security Meeting (KFSM) (now the Kenya Food Security Forum, KFSF) was established in 1998 to bring together various non-governmental organizations (NGOs), government agencies, donors, and UN agencies that are working on food security in Kenya. The KFSF has a subsidiary body called the Kenya Food Security Steering Group (KFSSG), which consists of representatives from Government of Kenya (GoK) departments, UN agencies, NGOs, and donors [
15]. The NDMA, together with the KFSSG, carries out NDMA/KFSSG biannual assessment focusing on the performance of the March to May rainy season (long rains) and the October to November rainy season (short rains).
Since 2006, these assessments have applied the Integrated Food Security and Humanitarian Phase Classification system (IPC) as the analytical framework, which uses a set of indicators with existing thresholds, bringing rigor to the analytical process and allowing for comparison within and between countries [
16]. The fact that these assessments are conducted jointly by government, civil society, and UN agencies should ensure that all stakeholders trust the information generated by the assessments, which is a prerequisite for action [
17]. The assessments are the documents that drive the process of planning humanitarian interventions, including identifying the need for food assistance, and raise funding for them [
16].
Over the years, attempts have been made to improve the accuracy of the biannual assessments by making technical improvements to the measurement of climatic and environmental variables. Recent improvements include more sophisticated use of NDVI [
3], using NDVI together with rainfall and crop yield data to develop a drought risk index for food crop yield. The Kenyan EWS has also been supported by technical advances at the regional and global level, such as the development by FEWSNET of a seasonal agricultural drought forecasting system for East Africa by simulating soil moisture scenarios using a hydrological model [
7]. However, studies have found low levels of use of the climate information included in the EWS by decision makers. A workshop organized by the Kenyan and Ethiopian meteorological agencies in 2017 found that of the participants, 29 out of 46 (63%) indicated lack of skill for processing and/or incorporating the information at a local scale as a reason for not using the climate information [
7].
Overall, several researchers have raised the question whether the current drought EWS in Kenya adequately responds to the highlighted problems of vulnerability to food shortage and famine in drought-exposed areas [
15,
16,
18]. There is also existing research on the gaps and challenges of the EWS (see, for instance, [
2,
6]). However, a detailed analysis of what type of information and indicators are used in the EWS that inform resource allocation and action has not been conducted. Therefore, we review the climate-related indicators in the context of other indicators, with a specific focus on the use of rainfall data in the drought EWS in Kenya using the arid county of Turkana as a particular case study. In our research we use the term “indicator” in a broad manner to refer to the variables used in the EWS. These variables range from simple standalone indicators, measuring a single variable, to wider indices which are composite products [
19].
This research is important due to the increase in emphasis on forecast-based financing products in the humanitarian community, where the idea is that climate and weather forecasts trigger actions as agreed in the EWS and response plans [
9]. The underlying assumption behind this type of intervention model is that the meteorological indicators in the EWS are solid enough to be relied upon to trigger responses and that there is a direct link between drought and food insecurity.
We focus on two research questions:
What indicators, especially meteorological drought indicators, are used in the national biannual assessments conducted by the National Drought Management Authority (NDMA) and monthly drought bulletins for Turkana?
Are there differences in the methodology used for analysis of meteorological indicators in the different products generated by the EWS system in Kenya?
3. Results
A total of 50 indicators were used in the biannual assessment process, divided into segments that describe factors that drive the food security situation and indicators of the impact on food security (
Table 1). The vast majority of these indicators, 30 in total, were found to be related to the first element of the food system (availability). Of the indicators assessed, 17 were related to food access and only 7 were related to food utilization (
Table 1). The county drought bulletins include far less indicators, with only 14 indicators in total, grouped in four categories: biophysical, production, access, and utilization.
In the national-level biannual NDMA/KFSSG assessment reports, the indicators included in the “impacts” section of the assessment reports relate to crop and livestock production, water, performance of markets, nutrition and health, and coping strategies. None of the assessment reports include indicators related to the social value and social acceptability of food, food utilization (i.e., there was no analysis of poor dietary diversification and overreliance on carbohydrates), or food safety. The access- and affordability-related indicators do not consider wider market-related factors. The assessments do not assess the food security situation of households in different categories. Such an attempt would, for instance, be to create separate categories of food aid beneficiaries. However, the only categorization of the population used in the reports was geographic locations. Neither the NDMA/KFSSG biannual assessment nor the monthly drought bulletins include information that would allow for an analysis of the significance placed on meteorological indicators in comparison to the other drought and socioeconomic indicators, or how important these categories are considered to be in relation to the other categories. As seen above, the county drought bulletins include relatively limited information on food distribution and availability, including information on market prices of the staple food items.
In addition to meteorological drought indicators, the county drought bulletins include water-related data such as on the state of water sources and household access to water. The only information on the state of water sources contained in the county bulletins is the percentage of population using each type of water source compared to the average. No information is included on the level of the water source. Household access to water is measured in distance in kilometers to the nearest water source and does not as such capture the quantity of water available for households. The bulletins do not contain any data related to temperature, and neither do they contain any information on land use change and the possible impact that can have on rainfall. The county bulletins also include the vegetation cover index (VCI) data.
3.1. Type of Rainfall Data Used in the NDMA/KFSSG Biannual Assessments for Turkana County
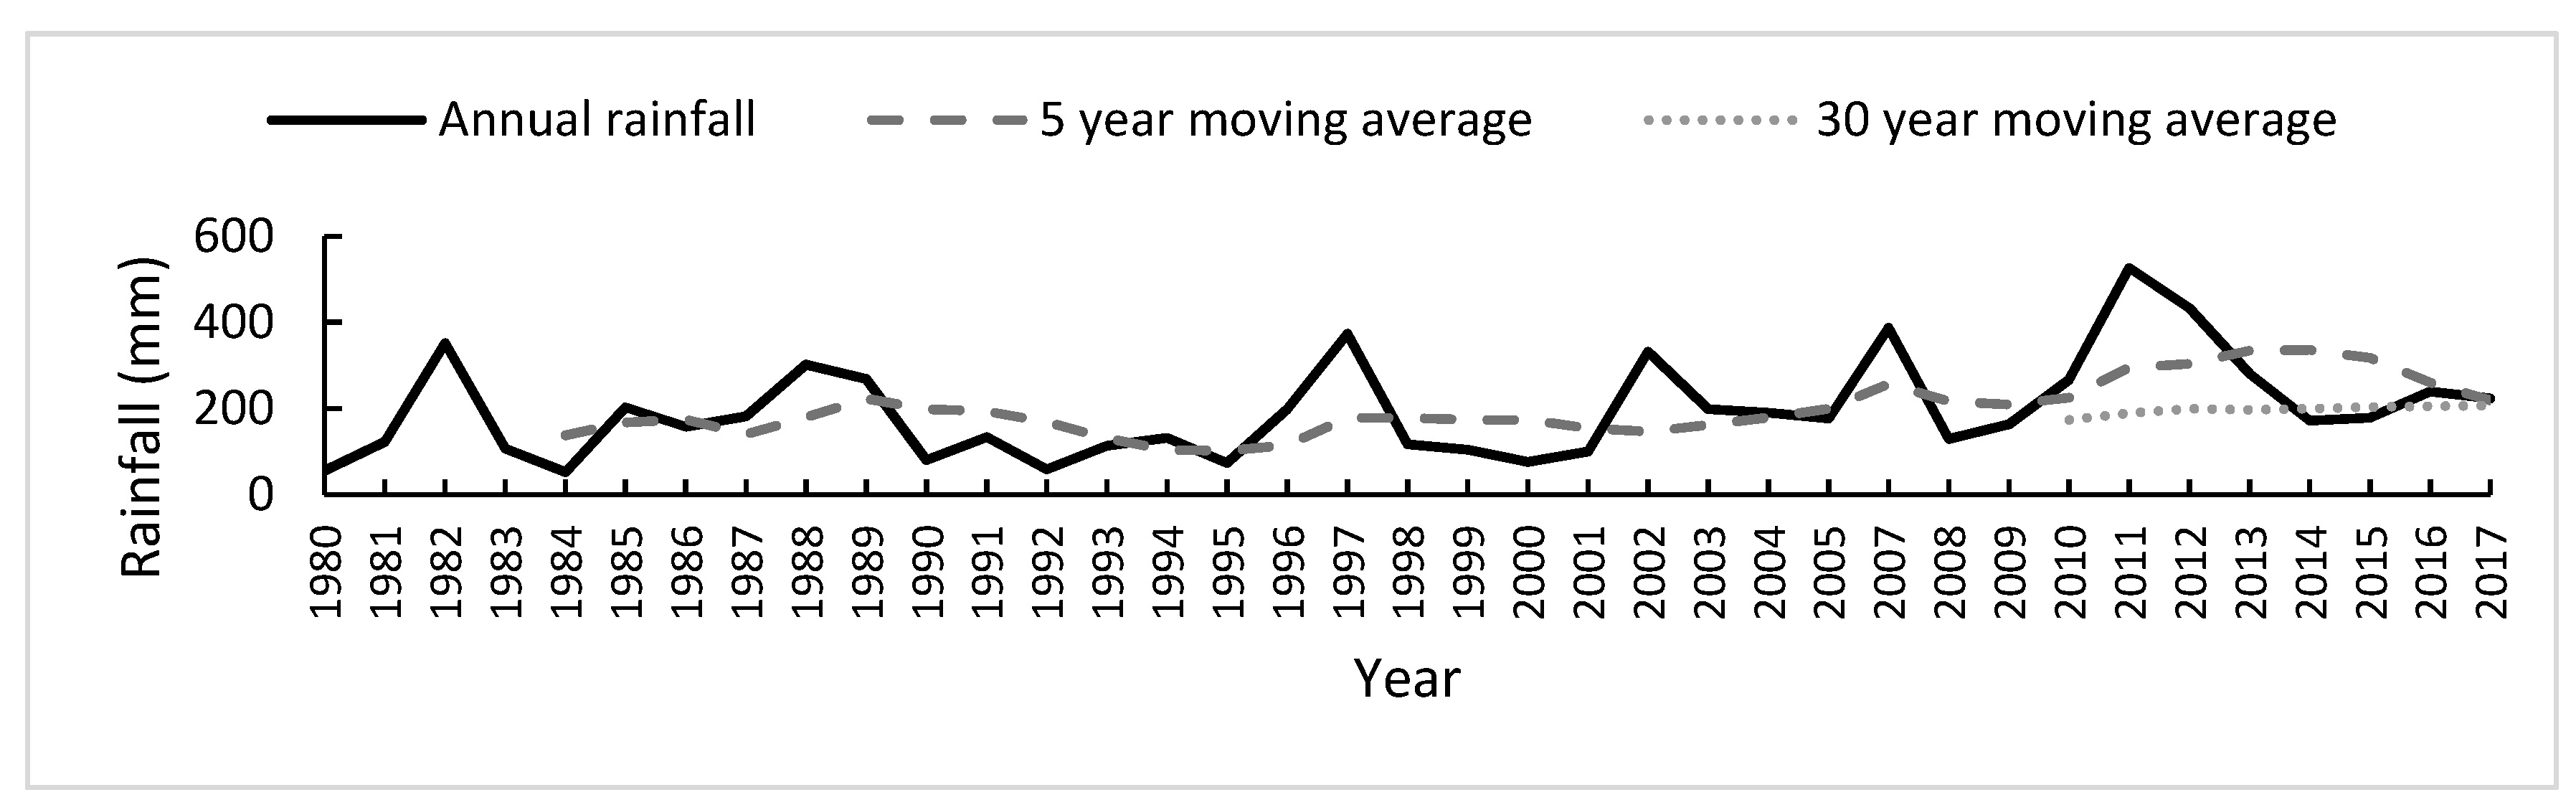
Overall, in Turkana, it simply rains very little. Several years receive less than 100 mm in total annual rainfall. The average annual rainfall for Turkana for the period 1987–2017 was 208.0 mm (
Figure 2). Eight of the 12 years that received over the average rainfall amount were in the last 10 years of period observed. The wettest year in the record observed was 2011, which saw a total of 526.8 mm of rain, and the driest was 1992 with only 57.6 mm of rain in the whole year.
The NDMA/KFSSG assessment reports include a detailed section on rainfall information, including on the timing (onset and cessation), distribution, and amount of rainfall, expressed in relation to the average through statements such as “below normal” and “above normal”, and sometimes using a percentage. The indicator used in the assessment reports is therefore closely related to, but not fully compliant with, the meteorological drought indicator outlined in the World Meteorological Organization (WMO) drought monitoring handbook from 2016 [
8], “Percent of Normal Precipitation”. The handbook identifies as a key weakness for this index that the “normal” calculated using the method can be mistaken to represent mean or average precipitation, which are calculated using a different methodology taking into account the different climate regimes of wet and dry seasons [
8]. The assessments lack a section on methodology, meaning that it is not possible to verify the sources of the information or determine what statements such as 50–75% of average mean either in terms of actual rainfall or compared to what dataset. The information in the NDMA/KFSSG assessments for Turkana is provided downscaled to parts of the district, but not consistently. The reports use broad terminology in relation to geographic locations, referring to the southern, northern, and central parts of Turkana, without specifying the borders of these subdivisions of the county.
In one of the years we studied, 2014, a different climate-related drought index, the standardized precipitation index (SPI), was used. This is a value as a three-month average, and the main meteorological drought index recommended by WMO [
8]. Our research found no evidence of the use, or attempted use, of any of the other available meteorological drought indices, and it was unclear why the use of SPI was discontinued [
23].
3.2. Type of Rainfall Data Used in the County Drought Bulletins
With regard to climate and rainfall information, the county drought bulletins consistently include information on the total amount of rainfall received, based on the observations of the Lodwar meteorological station [
24]. The bulletins do not include rainfall measurements from any other source. The bulletins also sometimes include information on the spatial and temporal distribution of rains. The information on the amount of rainfall received is provided in mm for the month, while the other information is only provided as statements of “above normal” or “below normal”. The rainfall information is not downscaled and is provided at the county level.
In the country drought bulletins, the observational rainfall data are analyzed against various time periods ranging from three to six years. This is significantly shorter than the 30-year reference period that WMO has defined as the minimum for establishing a climate normal [
8] and that is used, for instance, in the analysis of variations in rainfall in Kenya conducted by Buchanan-Smith et al. [
27]. The drought bulletins do not provide a justification for the time period selected to calculate the average or “normal range”. As the long rains assessment and the short rains assessment and SRAs, the bulletins include information on total rainfall received, but also on the date of the onset and cessation of rainy days and the number of rainy days.
3.3. Divergence in Methodology Used for Rainfall Analysis
The main finding from our analysis of the type of rainfall data used in the country drought bulletins and the NDMA/KFSSG assessments was the difference in the methodology used to establish the climate normal for rainfall. A comparison of the percentage range of rainfall included in NDMA/KFSSG assessments with the 30-year average calculated using the meteorological data from the Lodwar station (
Figure 2) reveals a general convergence of analysis. A more detailed comparison is not possible due to the divergence of the scale and level of detail of the data. However, for some seasons in the period reviewed, we found a divergence in the rainfall analysis included in the NDMA/KFSSG assessment reports and the Lodwar rainfall observational record. The short rains assessment reports for the years 2014, 2015, and 2017 refer to poor rainfall performance, but this analysis is contradicted by the observational rainfall record. The short rains assessment for 2014 cites as its first key finding that: “Below average performance of the 2014 short rains resulted in hindered improvements in food security in the pastoral, agro-pastoral and marginal agricultural areas” [
23]. However, the Lodwar rainfall data for the OND season shows that the total rainfall received (48.8 mm) corresponds to 105% of the 30-year average of 48.0 mm. This could be explained by the simple fact that NDMA/KFSSG uses a different source for rainfall data, but what is clear is that the interpretation of statements such as “above normal” and “below normal” needs to be accompanied by an explanation of what the “normal” range is.
For most of the years that we analyzed the county drought bulletins for, we found that the average amount of rainfall was significantly higher for the shorter reference period used in the bulletins than for a 30-year average period which is used in NDMA/KFSSG (
Figure 2,
Figure 3 and
Figure 4). Thus, county drought bulletins stated that rainfall was significantly “below average”, ranging from the low of 45% of average rainfall in 2015 to the high of 71% in 2017. When the annual rainfall was compared to the 30-year average, which is the WMO standard, however, a very different picture emerged. Three out of the five years reviewed received above normal rainfall compared to the 30-year average, with the exceptions being 2014 and 2015, which received only 86% and 88% of the average rainfall, respectively.
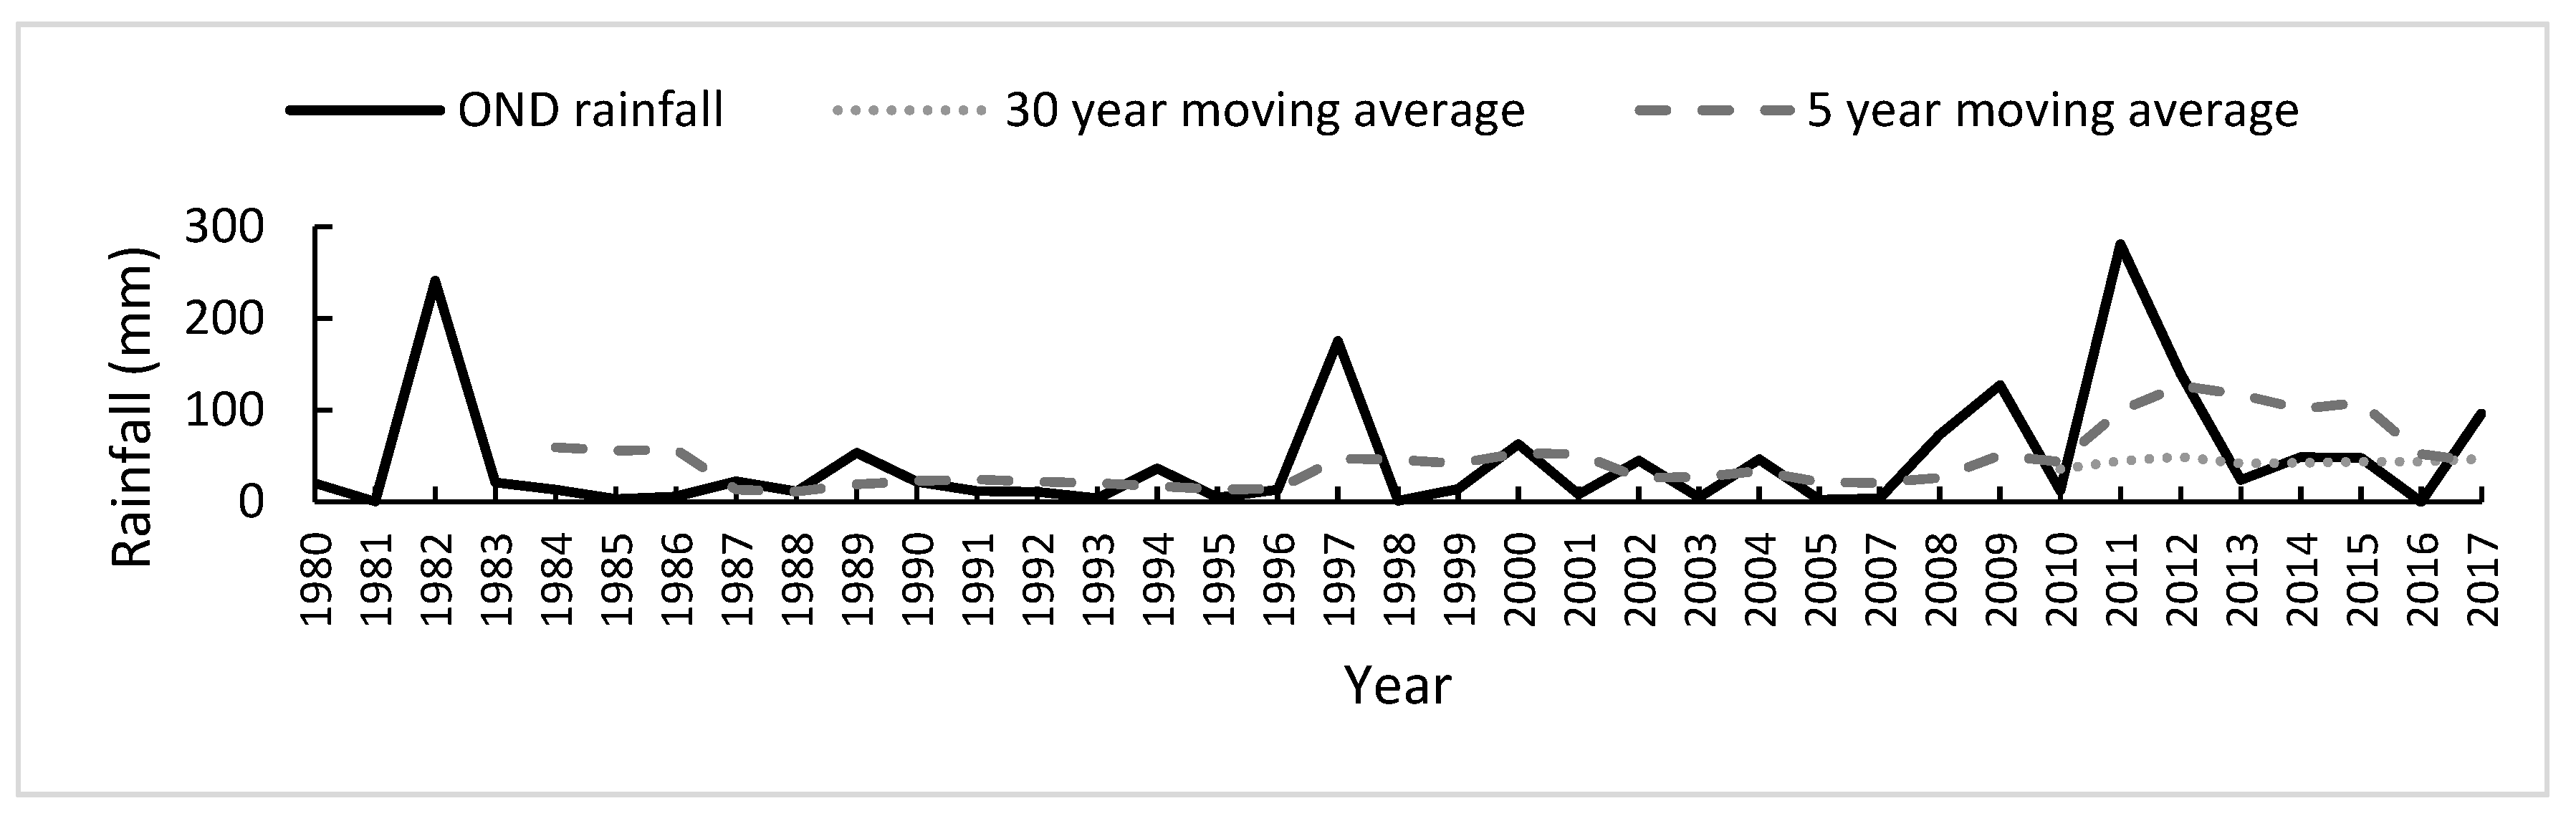
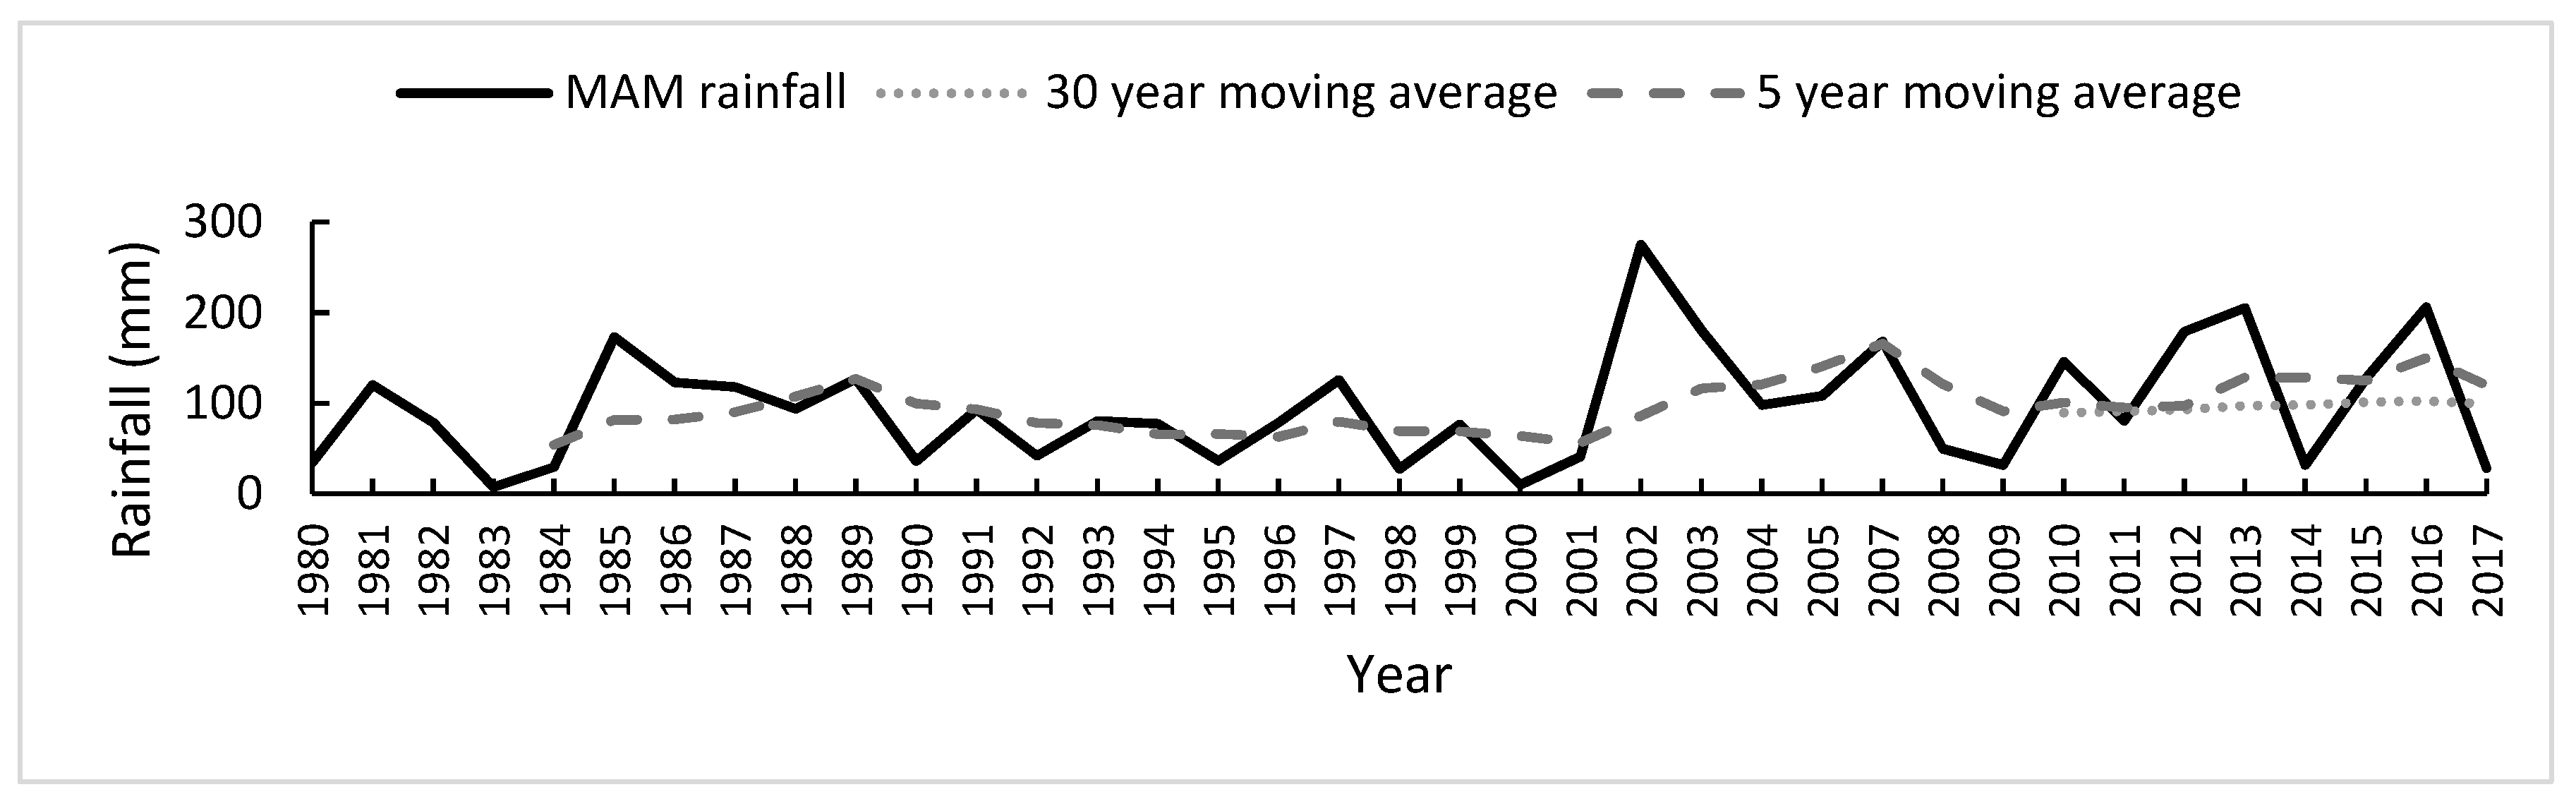
If we take a closer look specifically at the OND and MAM rainfall, we find that the “normal” range is significantly higher for the shorter time range than for the 30-year average (see
Figure 3 and
Figure 4). This means that when the OND and MAM rainfall is compared to the 30-year period, three (2014, 2015, and 2017) of the five years reviewed received above average rainfall. Using the shorter reference period, only 2017 can be considered to have received above average rainfall. Altering the reference period in this manner therefore significantly changes the outcome of the analysis. We have not found similar research being conducted on how the use of a different reference period can change the analysis in the EWS.
The 30-year average rainfall for the MAM period for the years 1983 to 2013 is 97.1 mm, which is lower than the average for any of the five-year reference periods used in the assessment. The five-year average for the MAM period ranges from a high of 156.3 mm for the 2009–2017 period used in the 2014 assessment to a low of 107.4 mm for the 2008–2012 period used in the 2017 assessment. As the difference in the average is not as significant as for the OND season, the use of a different set of reference periods does not generate divergent outcomes in the analysis for the years studied.
In a few instances, use of different reference periods yielded the same result. In two of the five years of the analysis (2013 and 2016), the rainfall performance was significantly below average for the OND season when compared to both the 30-year average and the shorter reference period. Similarly, the MAM season performed well below average when compared to the 30-year average in 2014 and in 2017, and this is reflected in the long rains assessment reports for these years. The 2014 report cites “50 to 75 percent of normal for Northern part of Turkana” [
23], while the 2016 LRA report mentions poor “temporal distribution of the long rains” [
23].
4. Discussion
Our analysis of policy documents and rain data used in the NDMA/KDSSG assessments, as well as the county drought bulletins, primarily belong to the food availability category. The food availability category includes climate-related indicators, with the most prevalent climate-related indicator used in all the reports we looked at being precipitation as a percentage of normal.
Overall, there is a fairly broad body of research on the Kenyan EWS available (see, for instance, [
2,
27,
28,
29]), much of it dedicated to identifying existing weaknesses and gaps in the system, with the aim to provide guidance to policymakers on how to strengthen it. As Shiferaw et al. [
3] point out, the main challenge is to make the information generated by the system better tailored to user needs. However, we found no previous research conducted that critically evaluated the validity of the analysis produced by the EWS. Based on our analysis, we identify three issues in particular that need to be further discussed, namely the timing of assessments, the use and omission of particular indicators and place relevant data (downscaling).
First, our findings are supported by existing literature but also provide more detailed evidence on the EWS in Kenya, highlighting the technical gaps in the system, such as the timing of the long and short rains assessments. The report for the October to December rainy season, the so-called short rains assessment, is not published until February at the earliest [
25]. This leads to the content being backward rather than forward looking and contributes to a model of consistently late responses. The biannual timeframe of the assessments has been identified to hinder response to humanitarian needs outside the “normal” timeframe [
19]. This has been addressed by introducing monthly bulletins in the most vulnerable counties [
2]. The monthly county-level drought early warning bulletins have been issued since 2012 by the Kenyan Drought Management Authority for all arid districts in Kenya. These bulletins identify the Early Warning Phase classification based on livelihoods zones. For Turkana, for instance, these livelihood zones are pastoral, agro-pastoral, and fisheries. The bulletins are a central tool in the EWS, as decisions to release county-level drought early warning funds are made on the basis of the recommendations of the bulletins. The bulletins being issued at the county level serve to decentralize drought early warning in Kenya and link early warning to early action, as the issuance of the county drought bulletins are linked to the establishment of county-level drought contingency funds [
2].
Second, previous evaluations of the Kenyan EWS have identified its reliance on climate- and agriculture-related indicators over social and individual factors as a weakness [
15], and this is corroborated by our findings. It has been shown in the literature that effective drought monitoring requires a comprehensive assessment of future drought and water supply conditions and better understanding of temperature and land surface feedbacks [
2]. This would include complex EWSs that capture a range of indicators measuring impacts on all the four different types of drought: meteorological, hydrological, agricultural, and socio-economic [
3]. However, the socio-economic indicators used in the EWS focus mainly on food access, using price and income information. Monetary access indicators are limited to general average producer prices and income statistics produced by FAO and the World Bank and it is not possible for the information to be “downscaled” to specific locations [
14]. As these indicators capture the situation at the national level through estimates of food surplus and deficits, they do not detect local discrepancies [
14], nor are they able to accurately reflect the complexity of vulnerability with no agreement on suitable indicators.
Third, focusing on the climate-related indicators, in our analysis, we find a reliance on meteorological drought indicators, specifically the percent of normal precipitation, which is a simple drought indicator [
8]. The main difference observed is that the county bulletins consistently included total amount of rainfall as expressed in mm, whereas the NDMA/KFSSG bulletins only included rainfall information expressed as “below normal” or “above normal”. Neither the county bulletins nor the long-term assessments therefore use the indicator consistently. Moreover, our in-depth analysis of the use of the precipitation indicator in both the country drought bulletins and the NDMA/KFSSG assessments shows a difference in the methodology used to establish the climate normal for rainfall. The NDMA/KFSSG biannual assessment used rainfall data with a 30-year reference period used to establish the climate normal. The county drought bulletins depend on data from a single meteorological station, and compared the rainfall received to a timescale significantly shorter than WMO guidelines for calculating the climate normal [
30]. The county bulletins do not include any information on temperature and land surface feedbacks. The use of different types of methodologies can lead to different outcomes in terms of the analysis, signaling a different level of food security through the EWS.
Furthermore, our findings show that neither of the EWS products we reviewed provide information on rainfall data that is downscaled to a level that would render it usable to decision makers, that is, information is not provided at a geographical scale that makes it actionable for end-users, which often means county or district level [
31,
32]. The only evidence of downscaling we found was in some of the NDMA/KFSSG assessments analyzed which did include information that was downscaled to specific geographic parts of Turkana (central/northern). This was not, however, done consistently from year to year. As also shown by our findings, the sparsity of the meteorological observational network in Kenya and the lack of capacity to accurately forecast the weather, analyze available data, and make long-term climate scenarios have been well documented [
2,
29]. This contributes to the lack of clarity identified by [
2] on what action to take and when. As outlined in the case study description, recent years have seen an improvement in the downscaling of the assessments, with the biannual assessment now done at a county level. Furthermore, such technical improvements, as well as strengthening of institutions for cooperation as outlined in previous research [
2], would serve to enhance the EWS further.
Lastly, while not a finding of our research, it is worth highlighting that the fact that the biannual assessments are conducted jointly by the NDMA and KFSSG reveals how intrinsic the link between drought and food security is in the Kenyan early warning system. There is no separate assessment for food security at the national level. None of the assessment reports include indicators related to the social value and social acceptability of food, food utilization (i.e., there was no analysis of poor dietary diversification and overreliance on carbohydrates), or food safety. In addition, the access- and affordability-related indicators do not consider wider market-related factors.


