Five-Year Climatology of Local Convections in the Dabie Mountains


Abstract
:1. Introduction
2. Data and Methodology
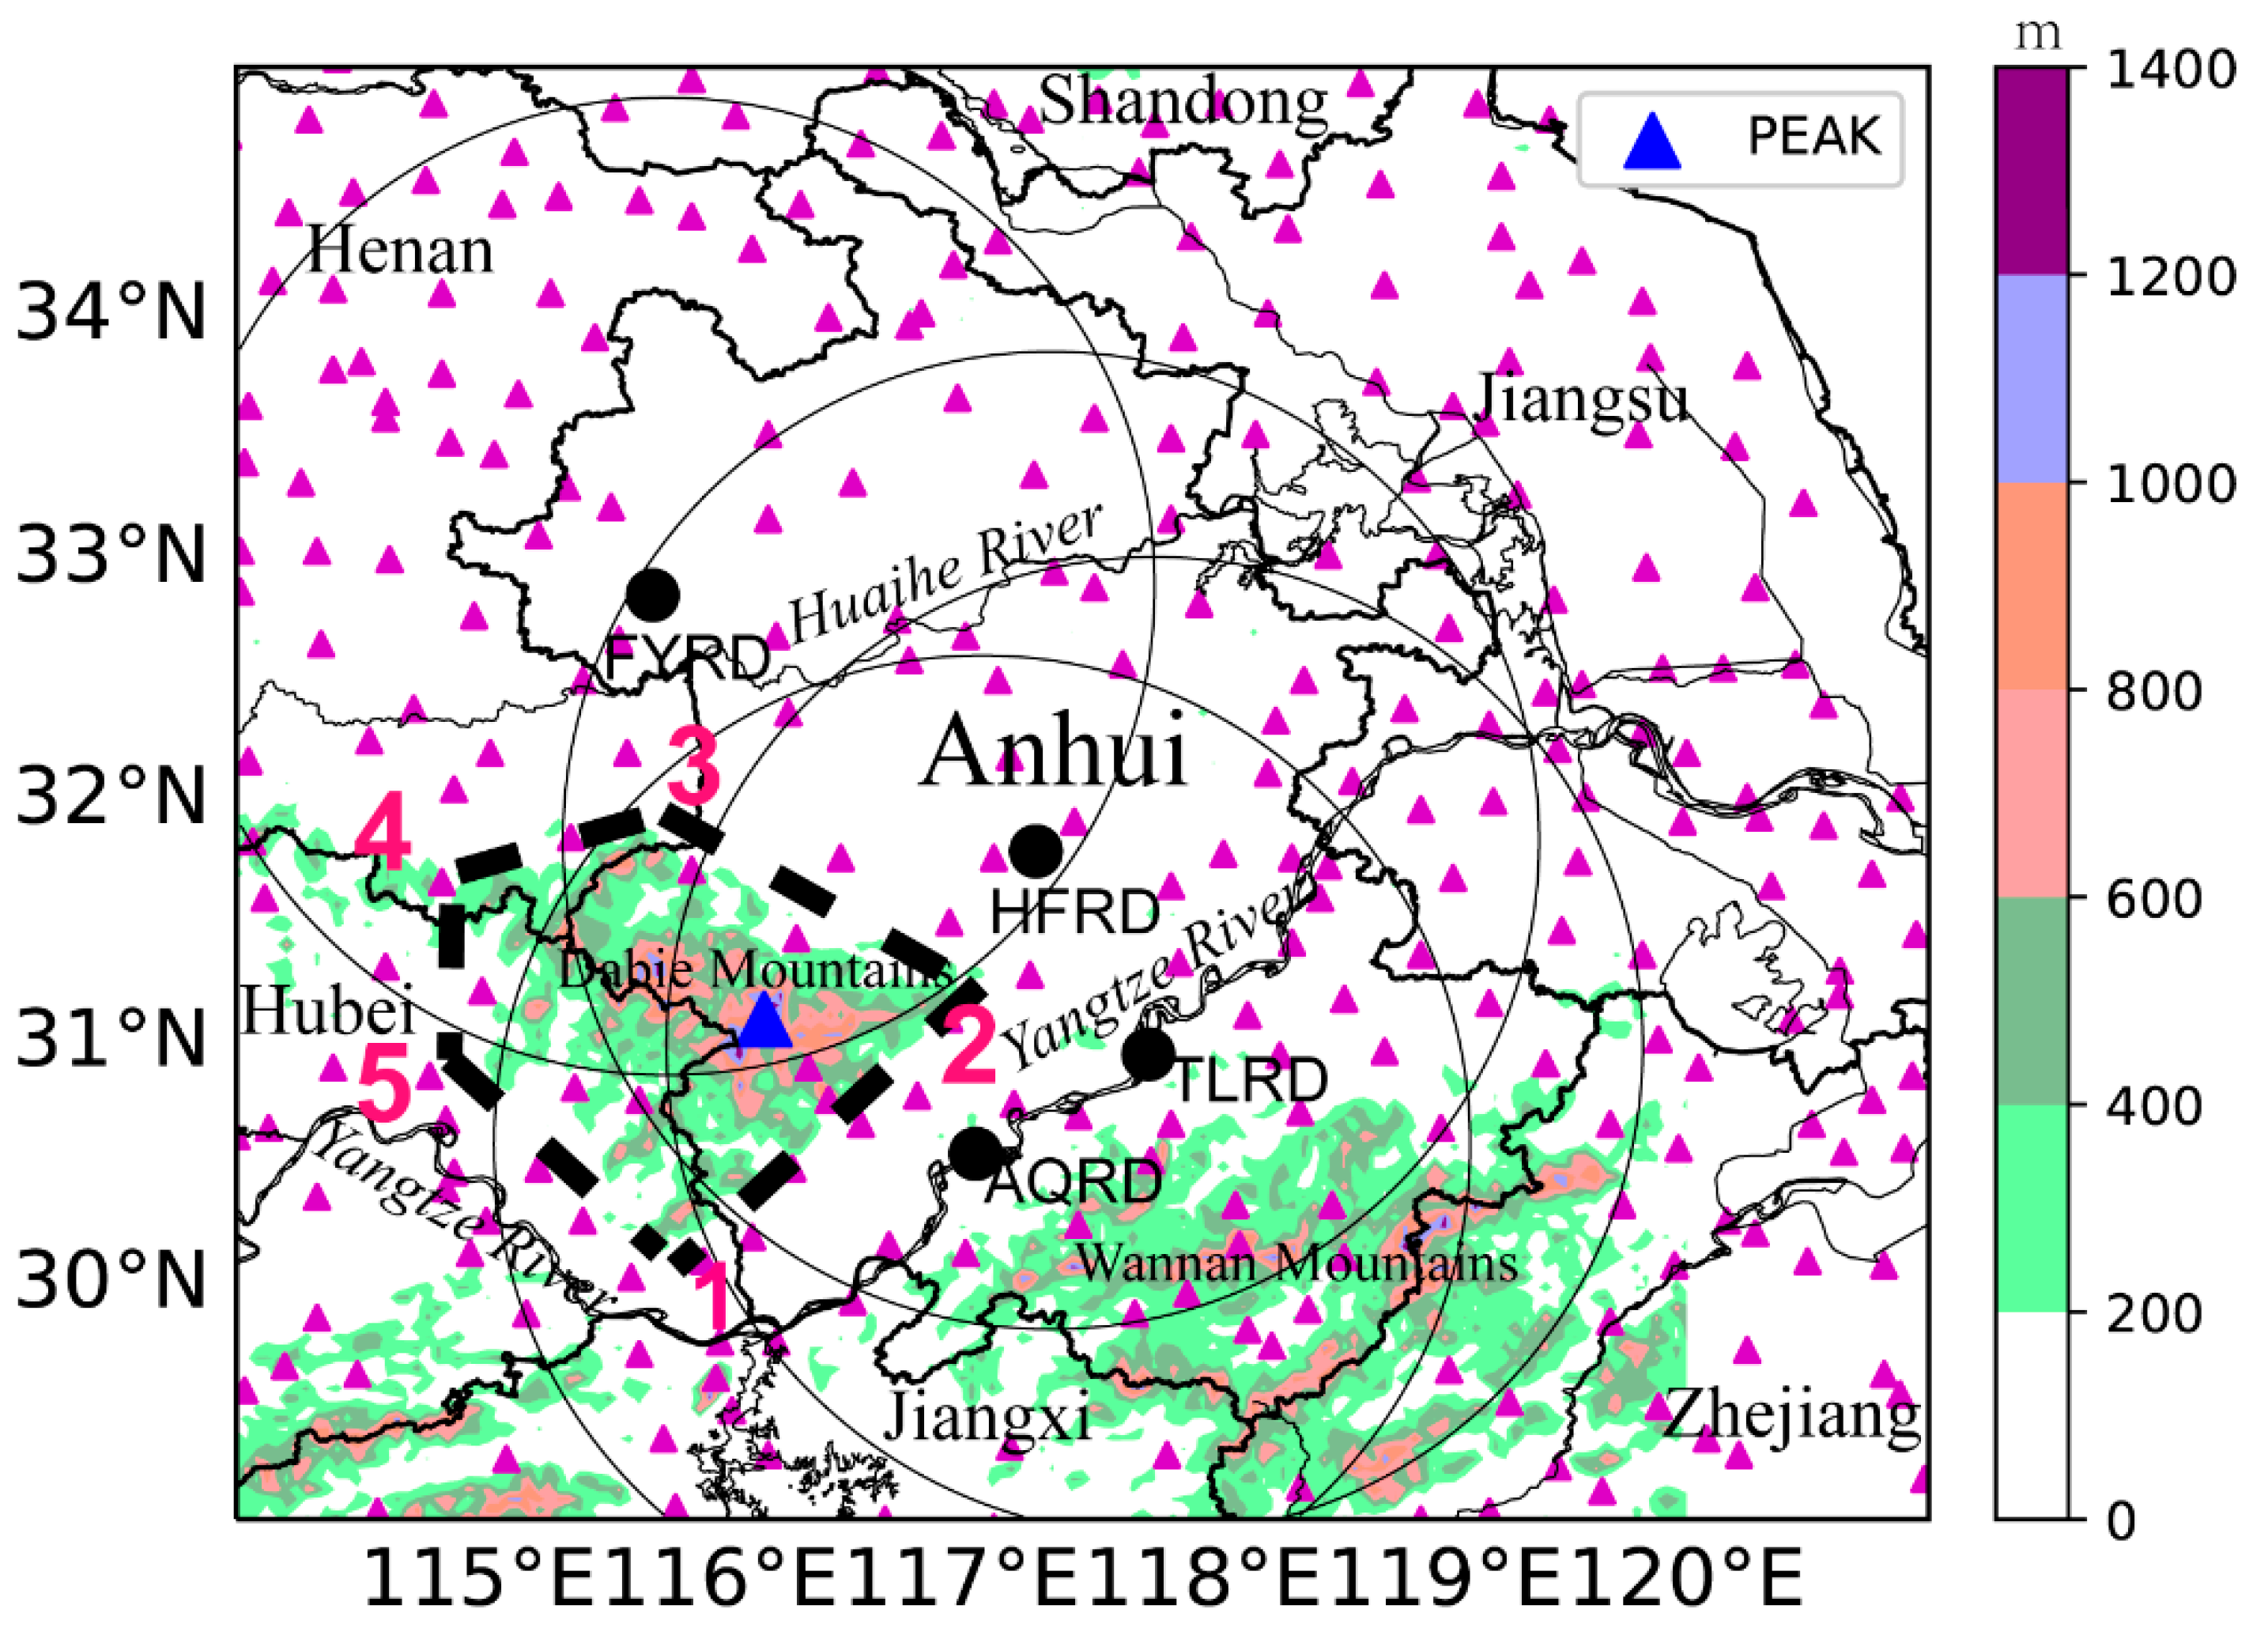
2.1. Study Region and Database
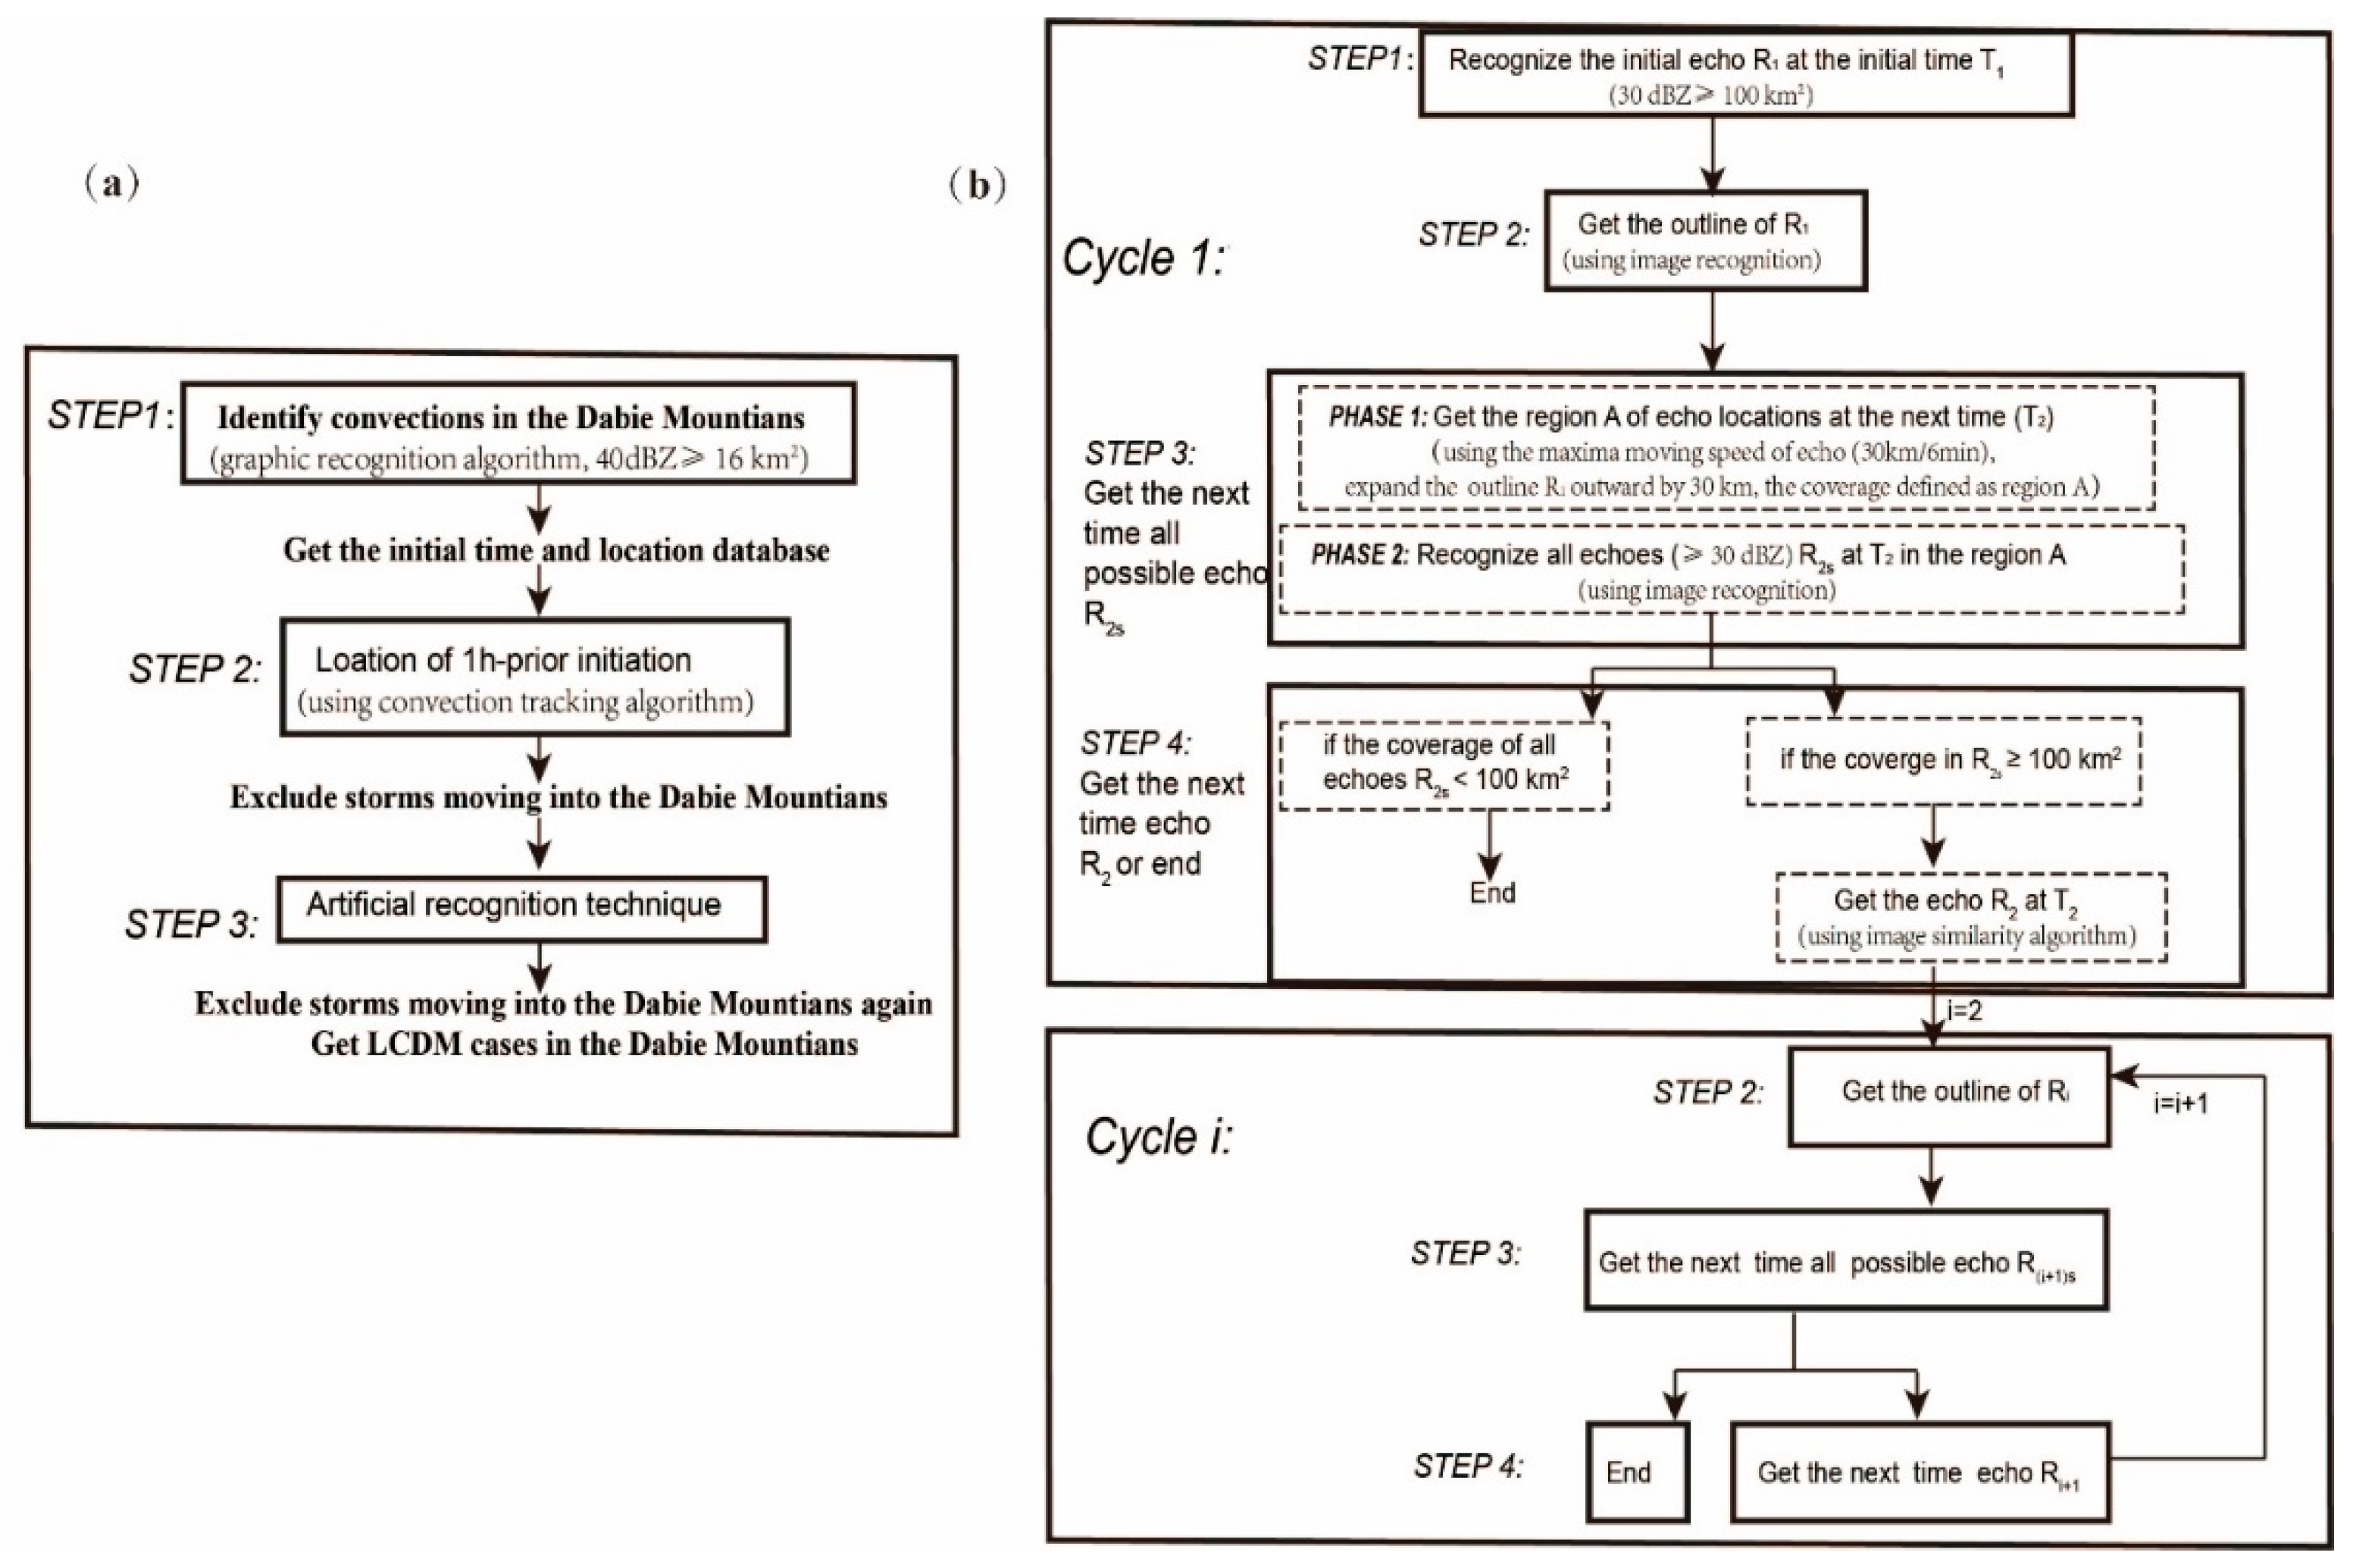
2.2. LCDM Identification and Tracking
2.2.1. LCDM Identification
2.2.2. LCDM Tracking
3. Spatial Distribution and Temporal Variations
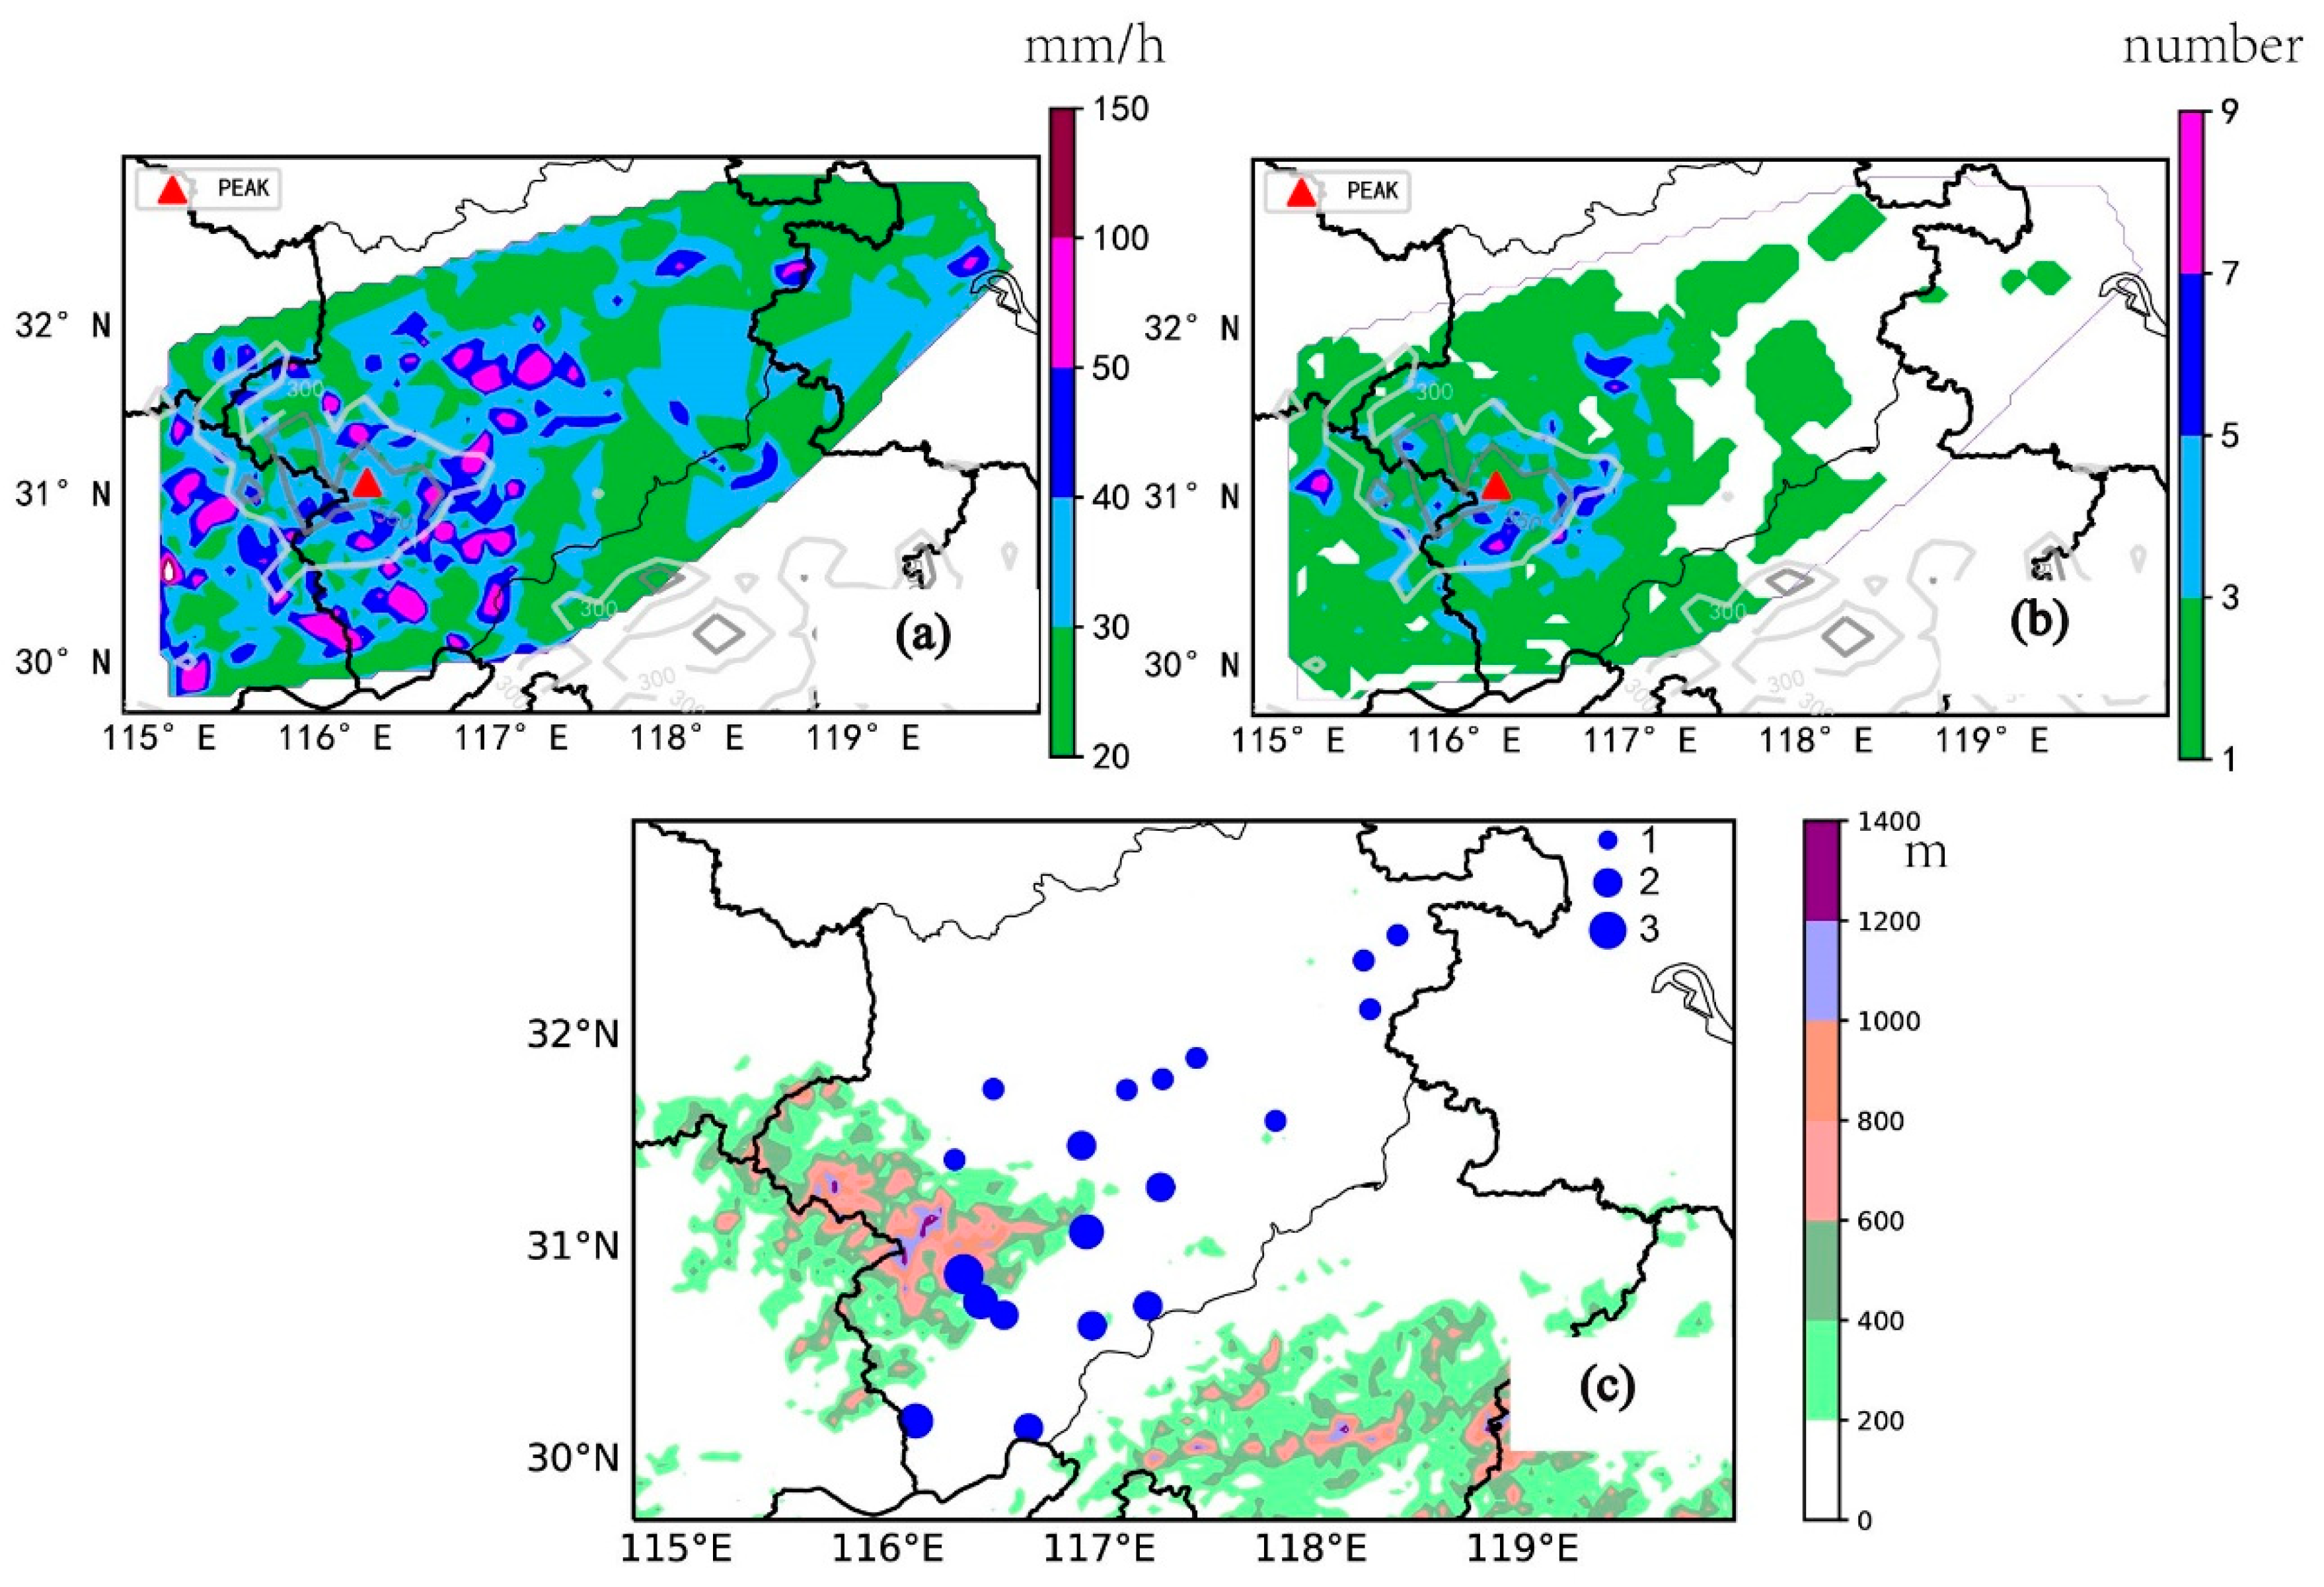
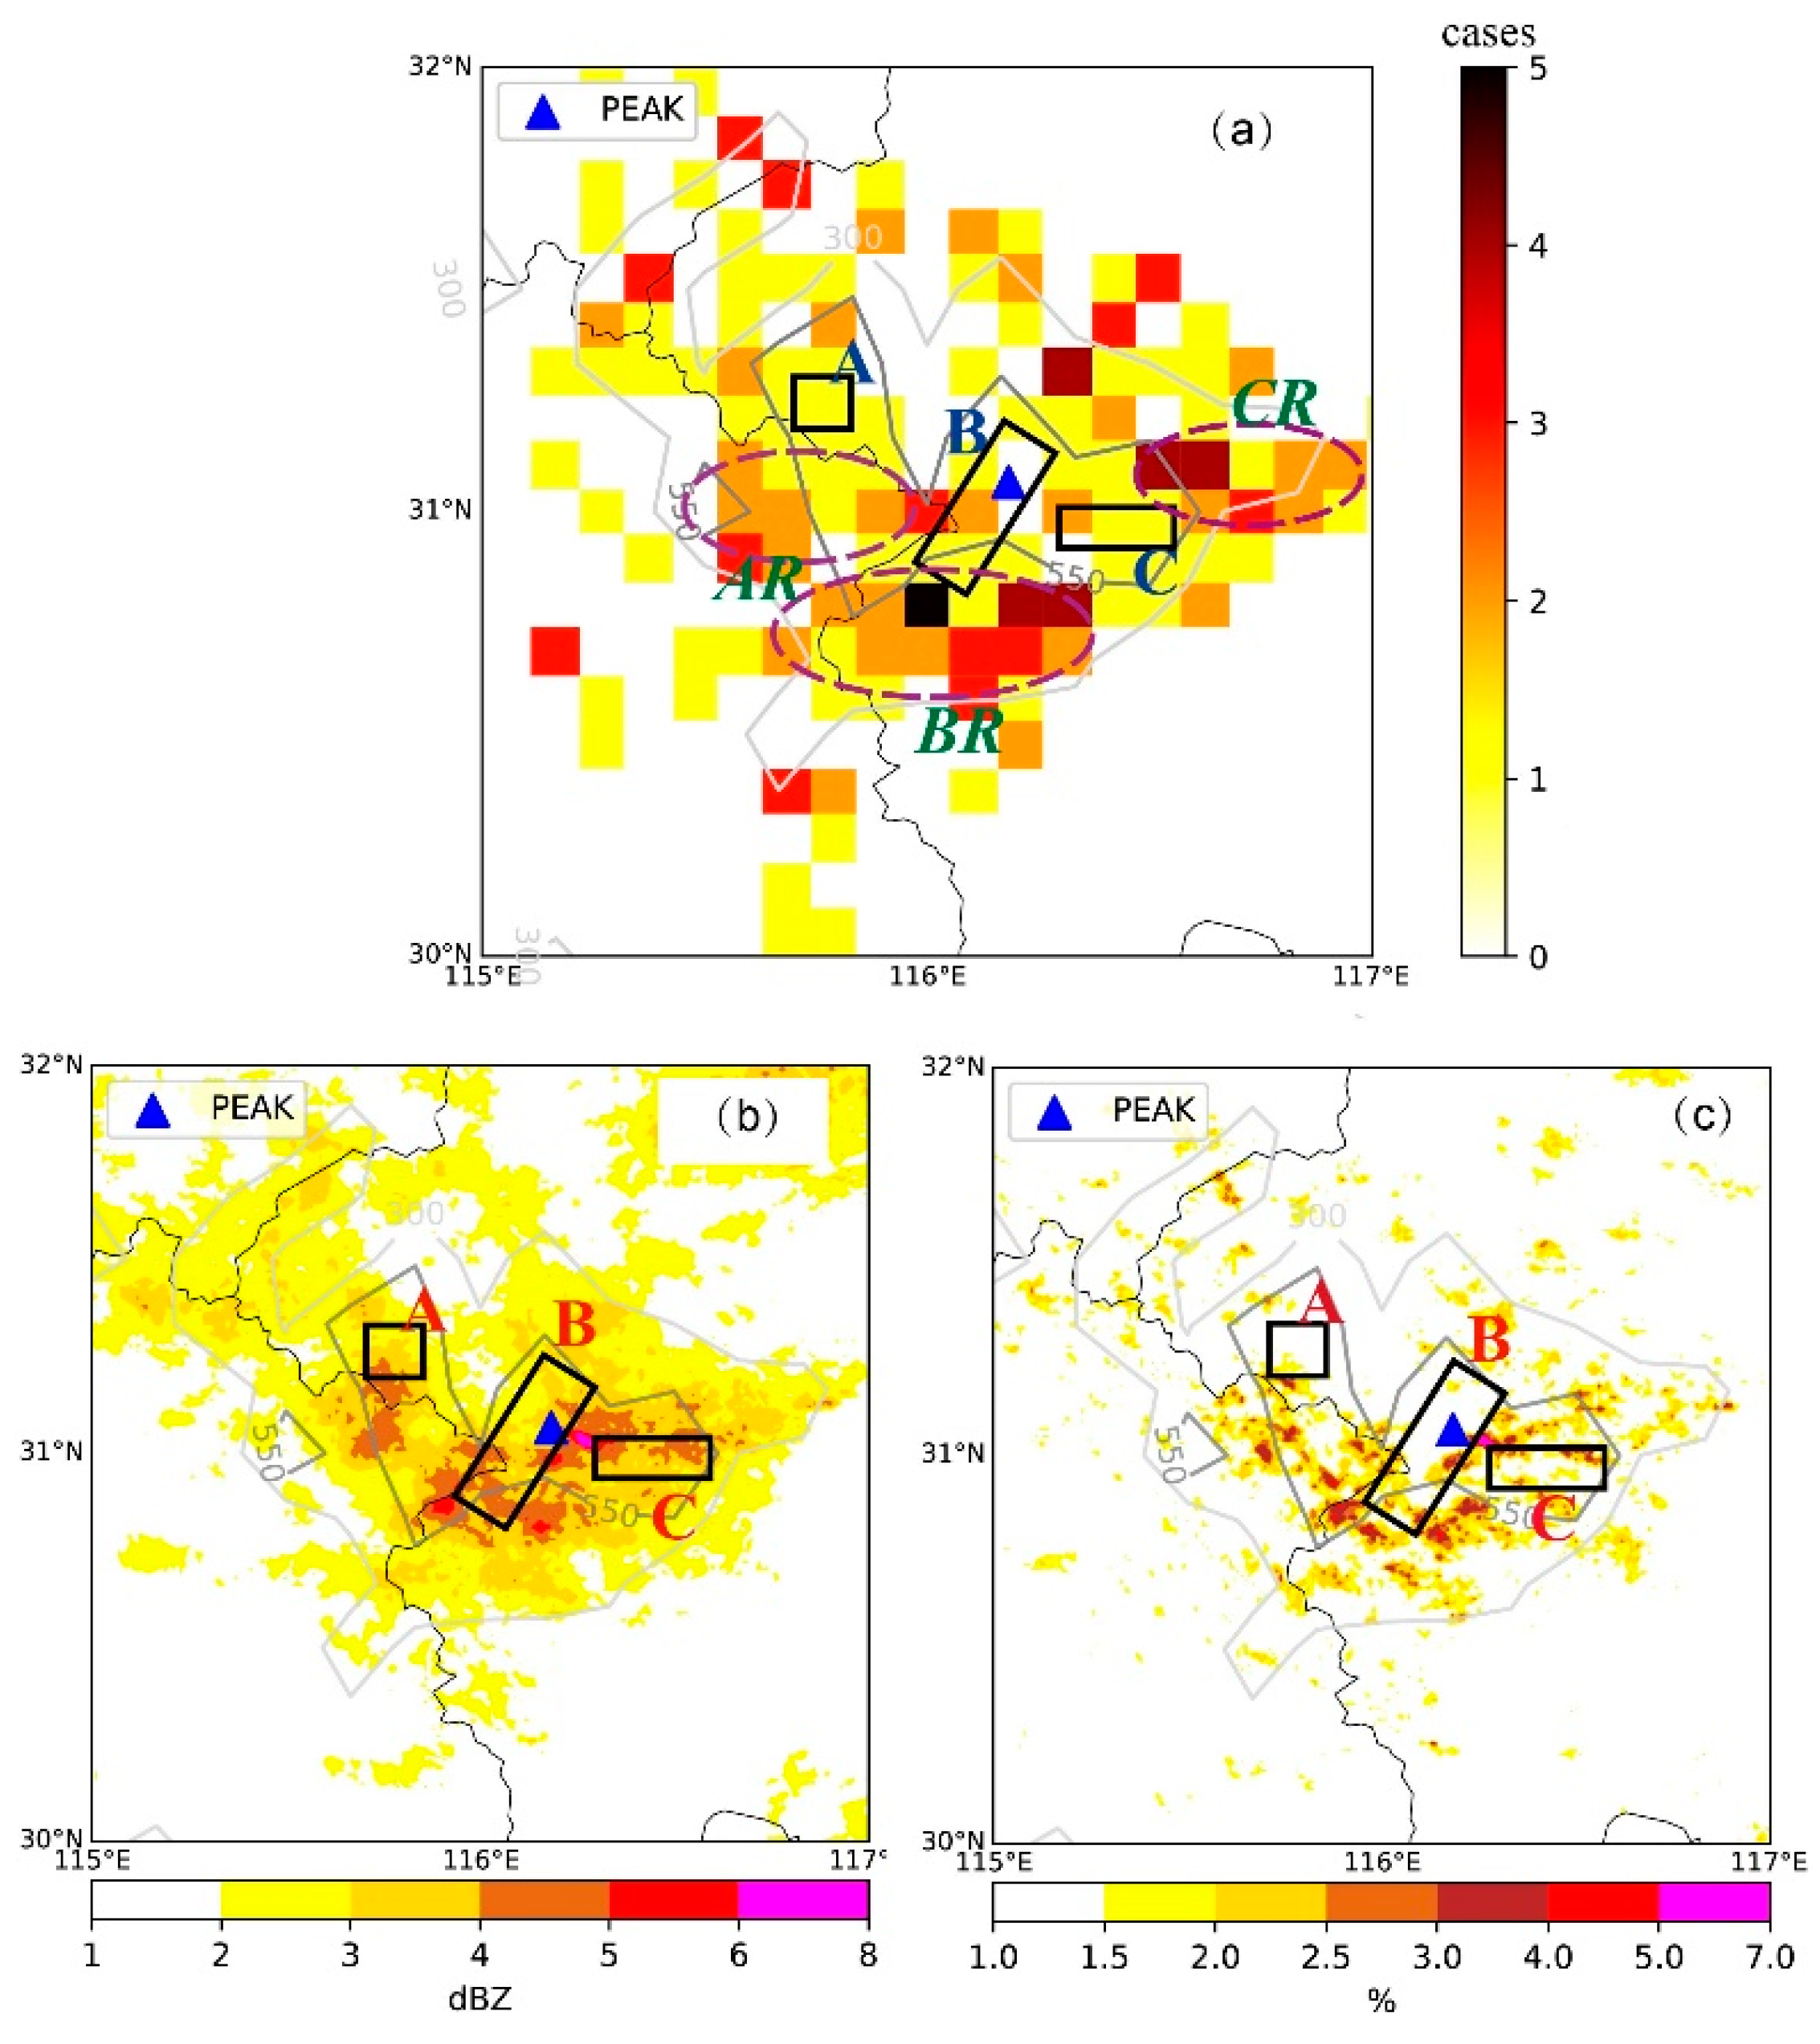
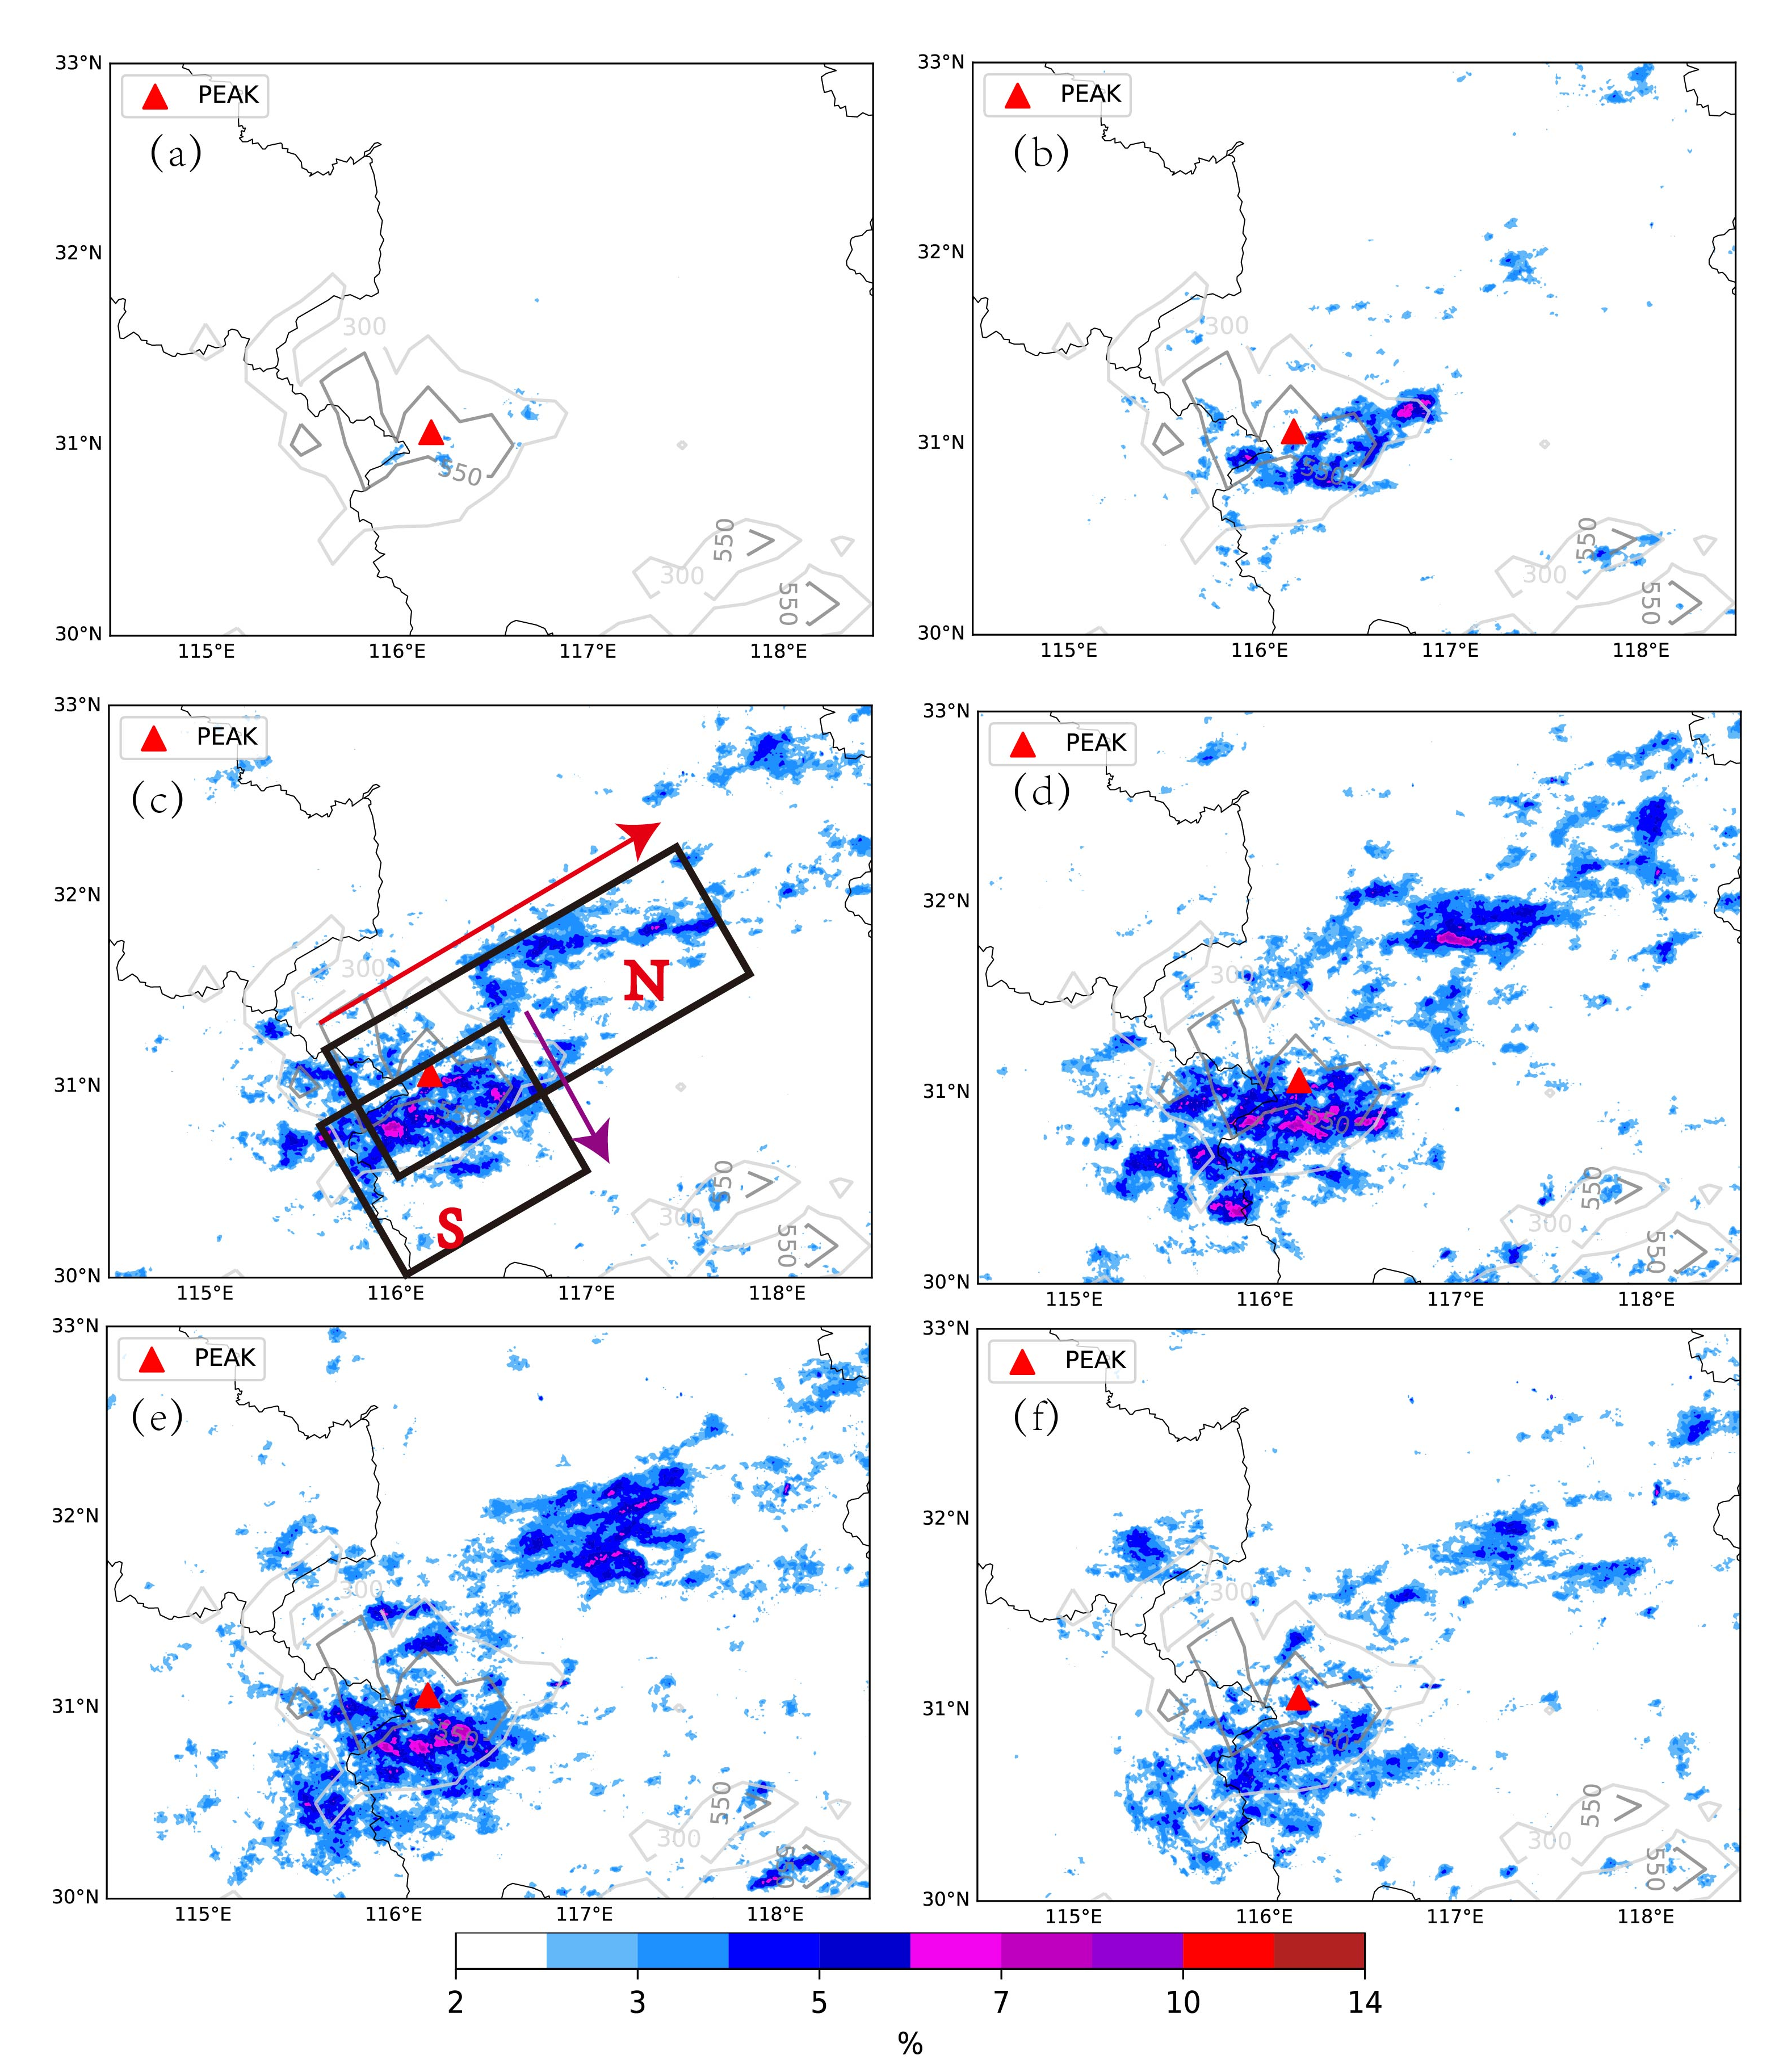
3.1. Spatial Distribution
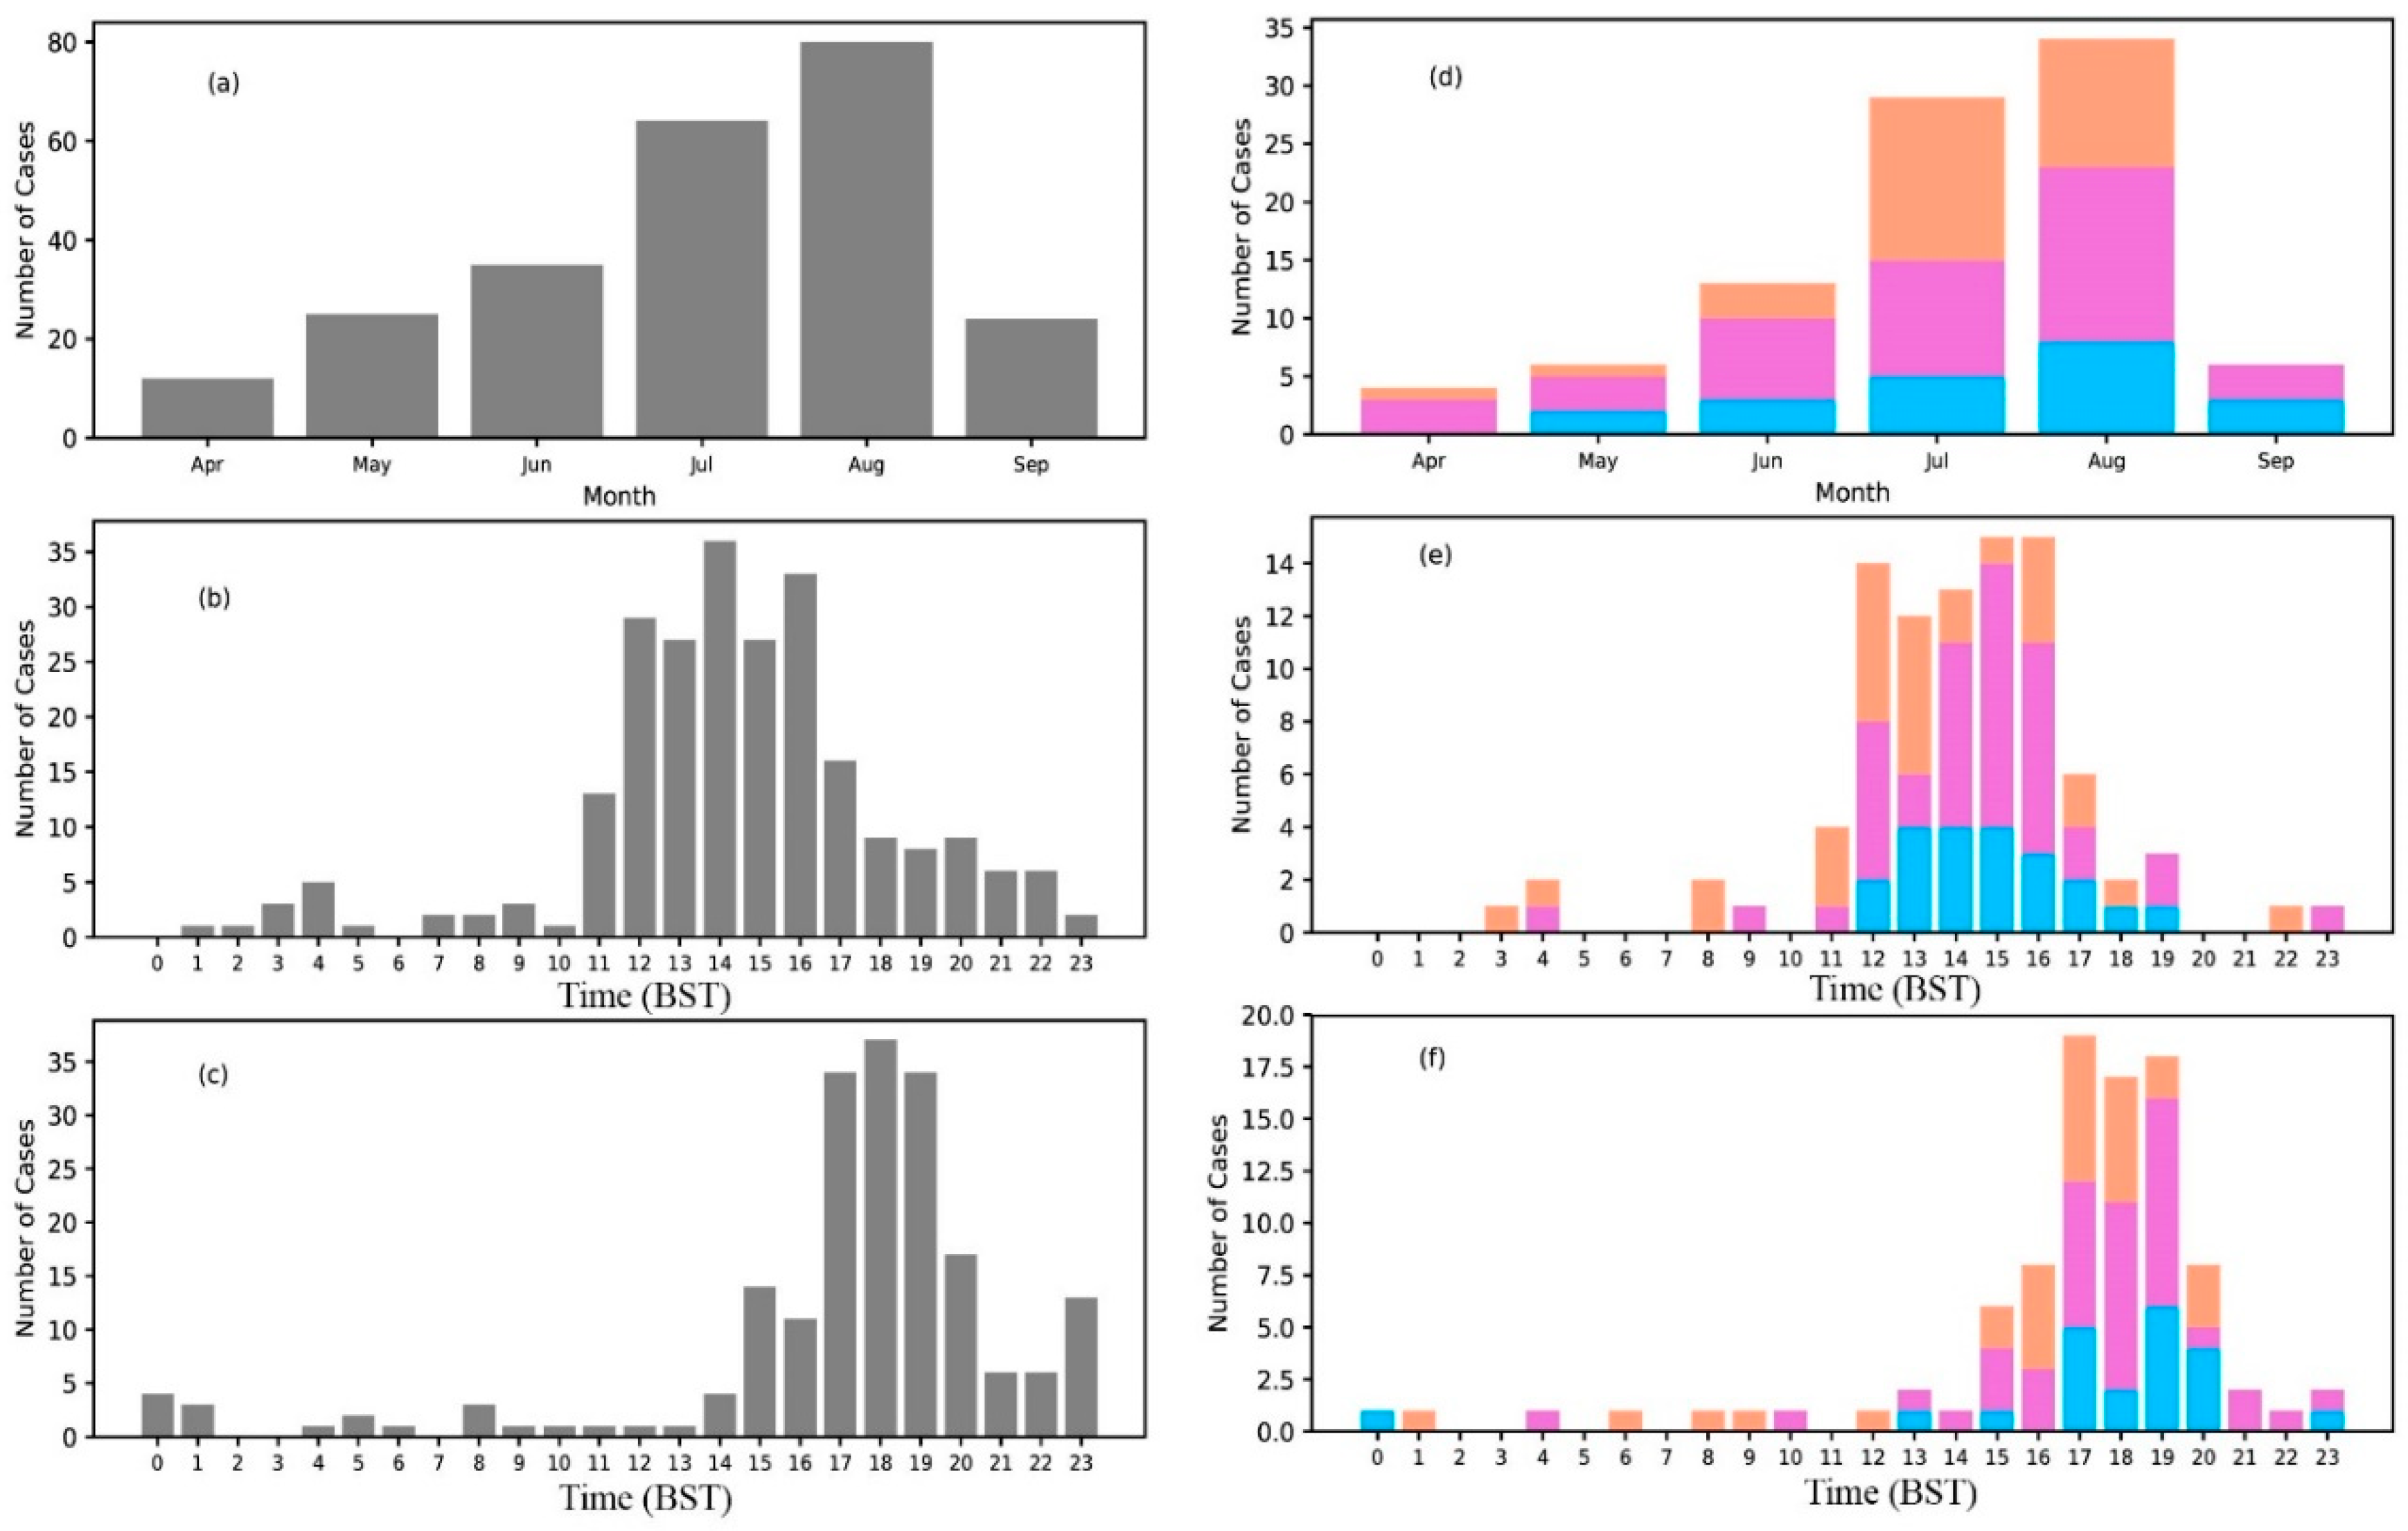
3.2. Monthly and Diurnal Variations
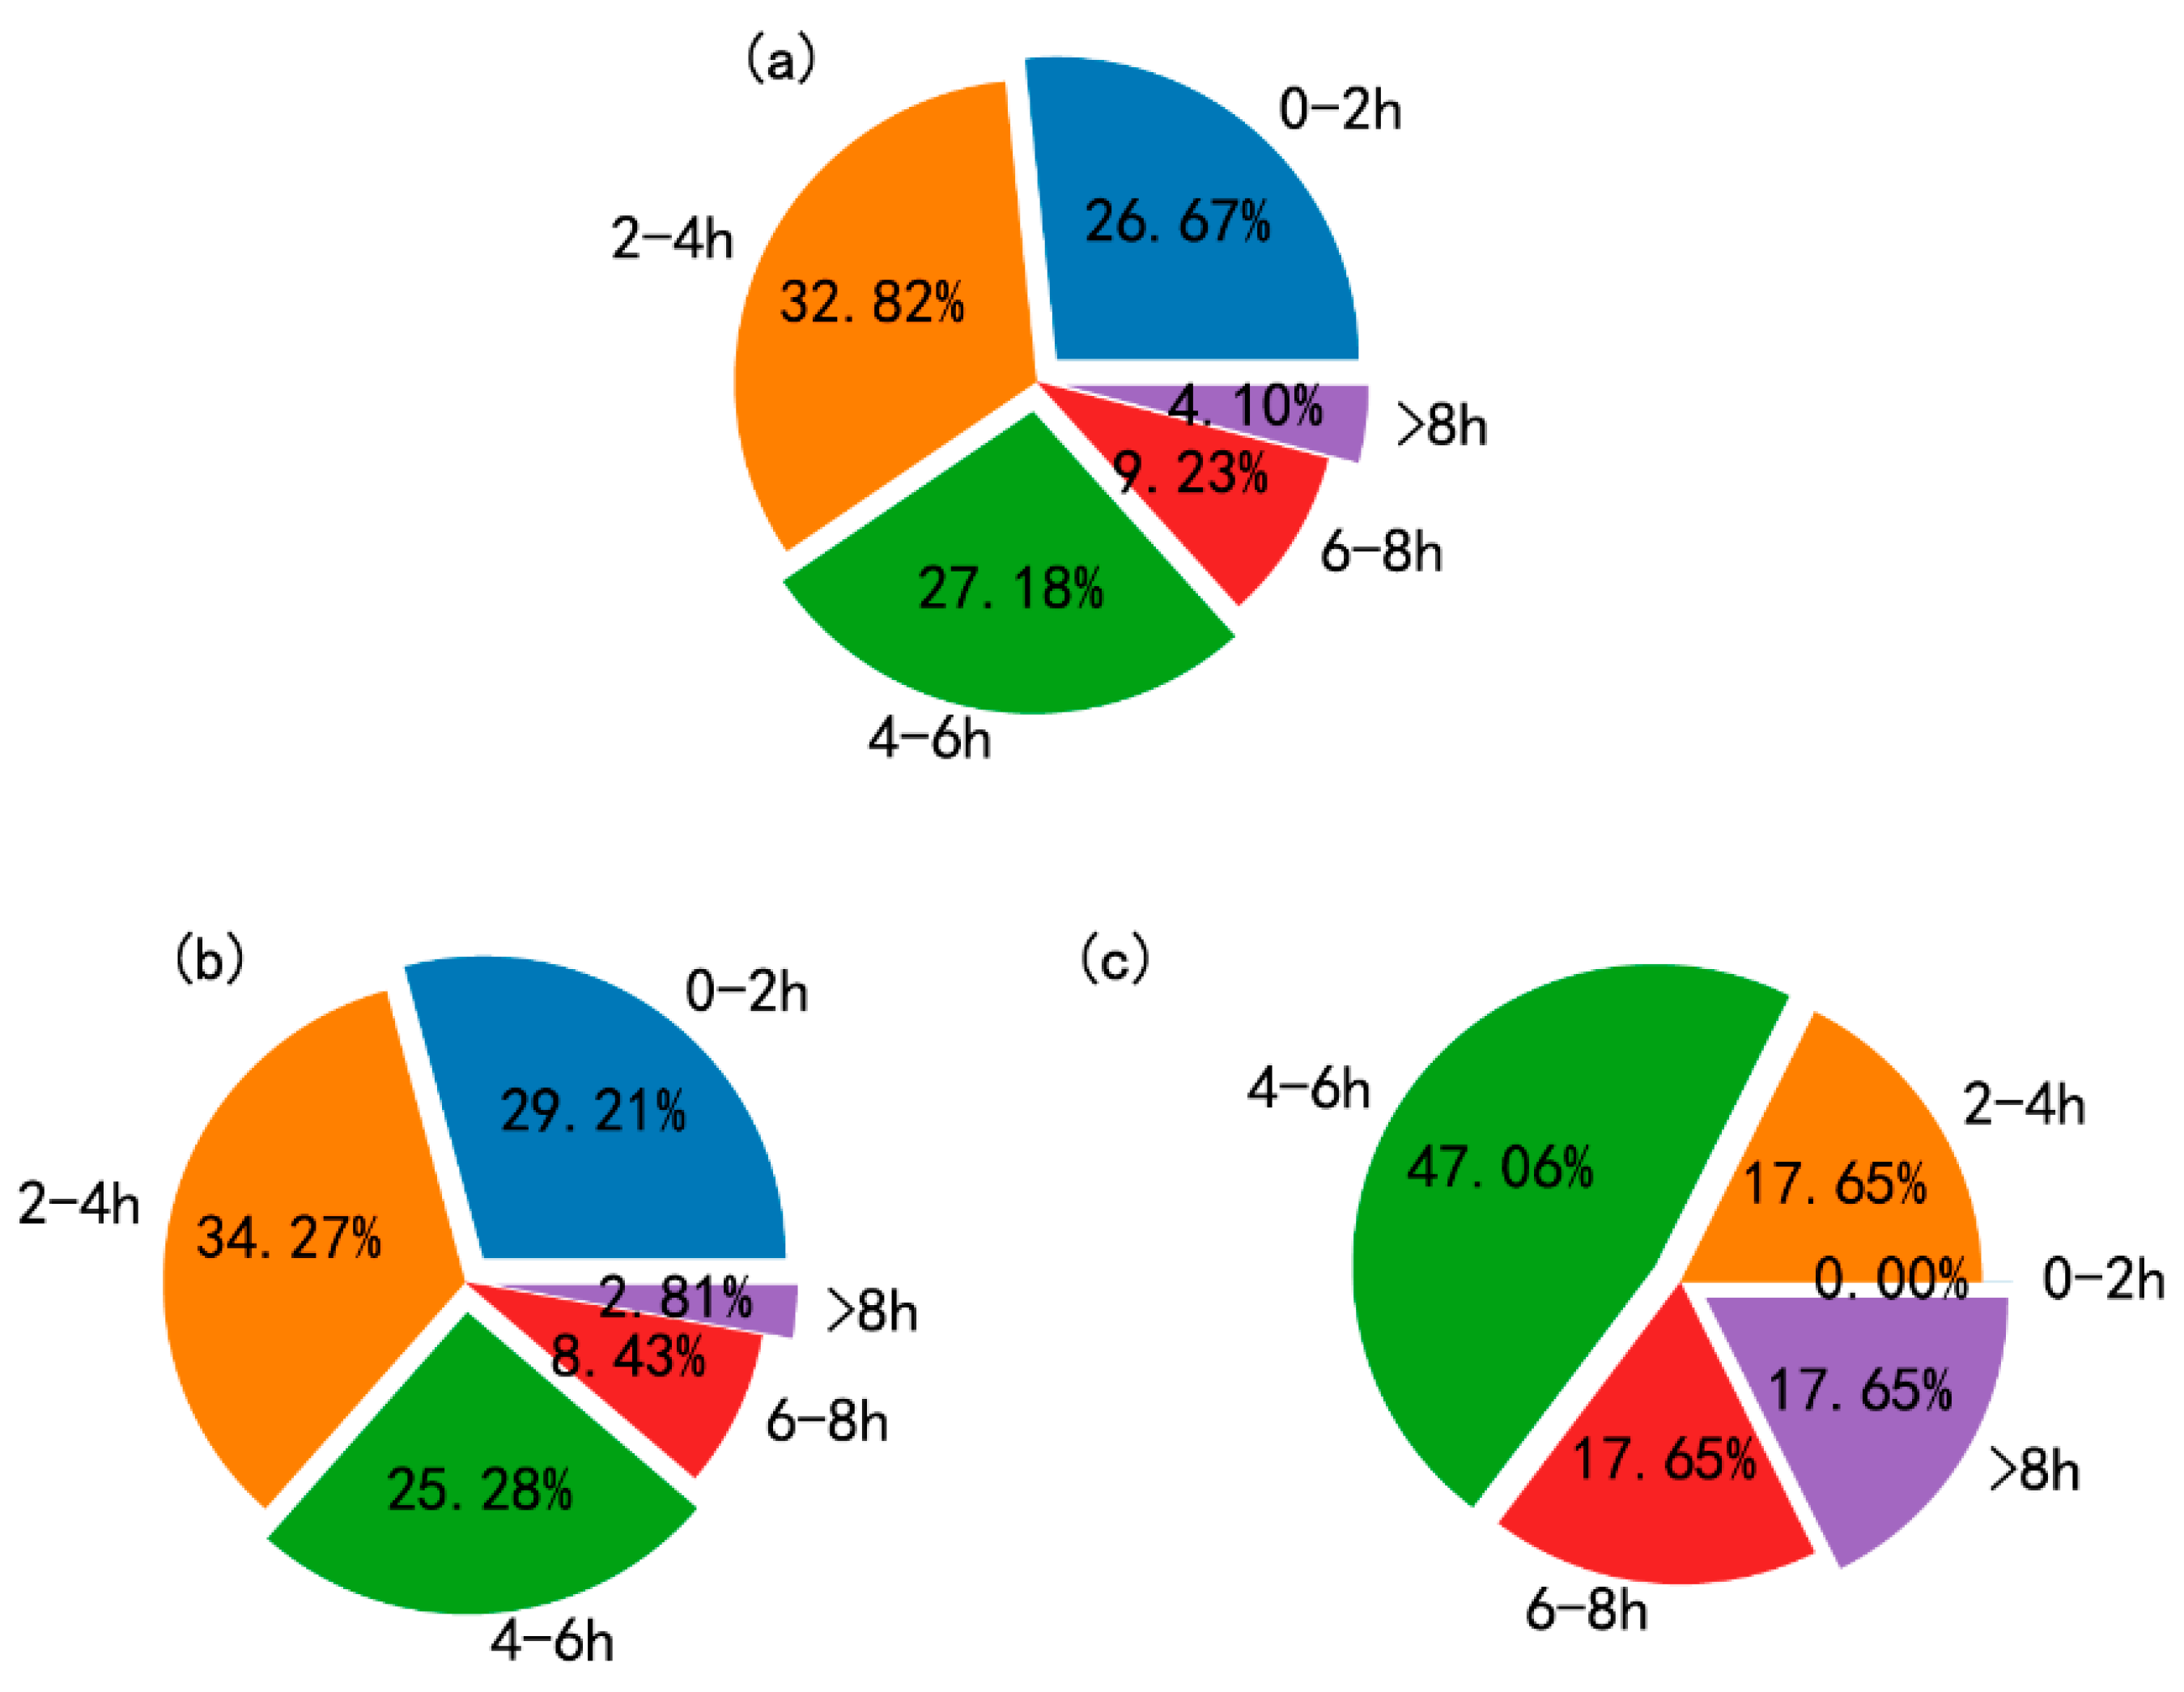
3.3. Lifespans
3.4. Related Severe Convective Weather
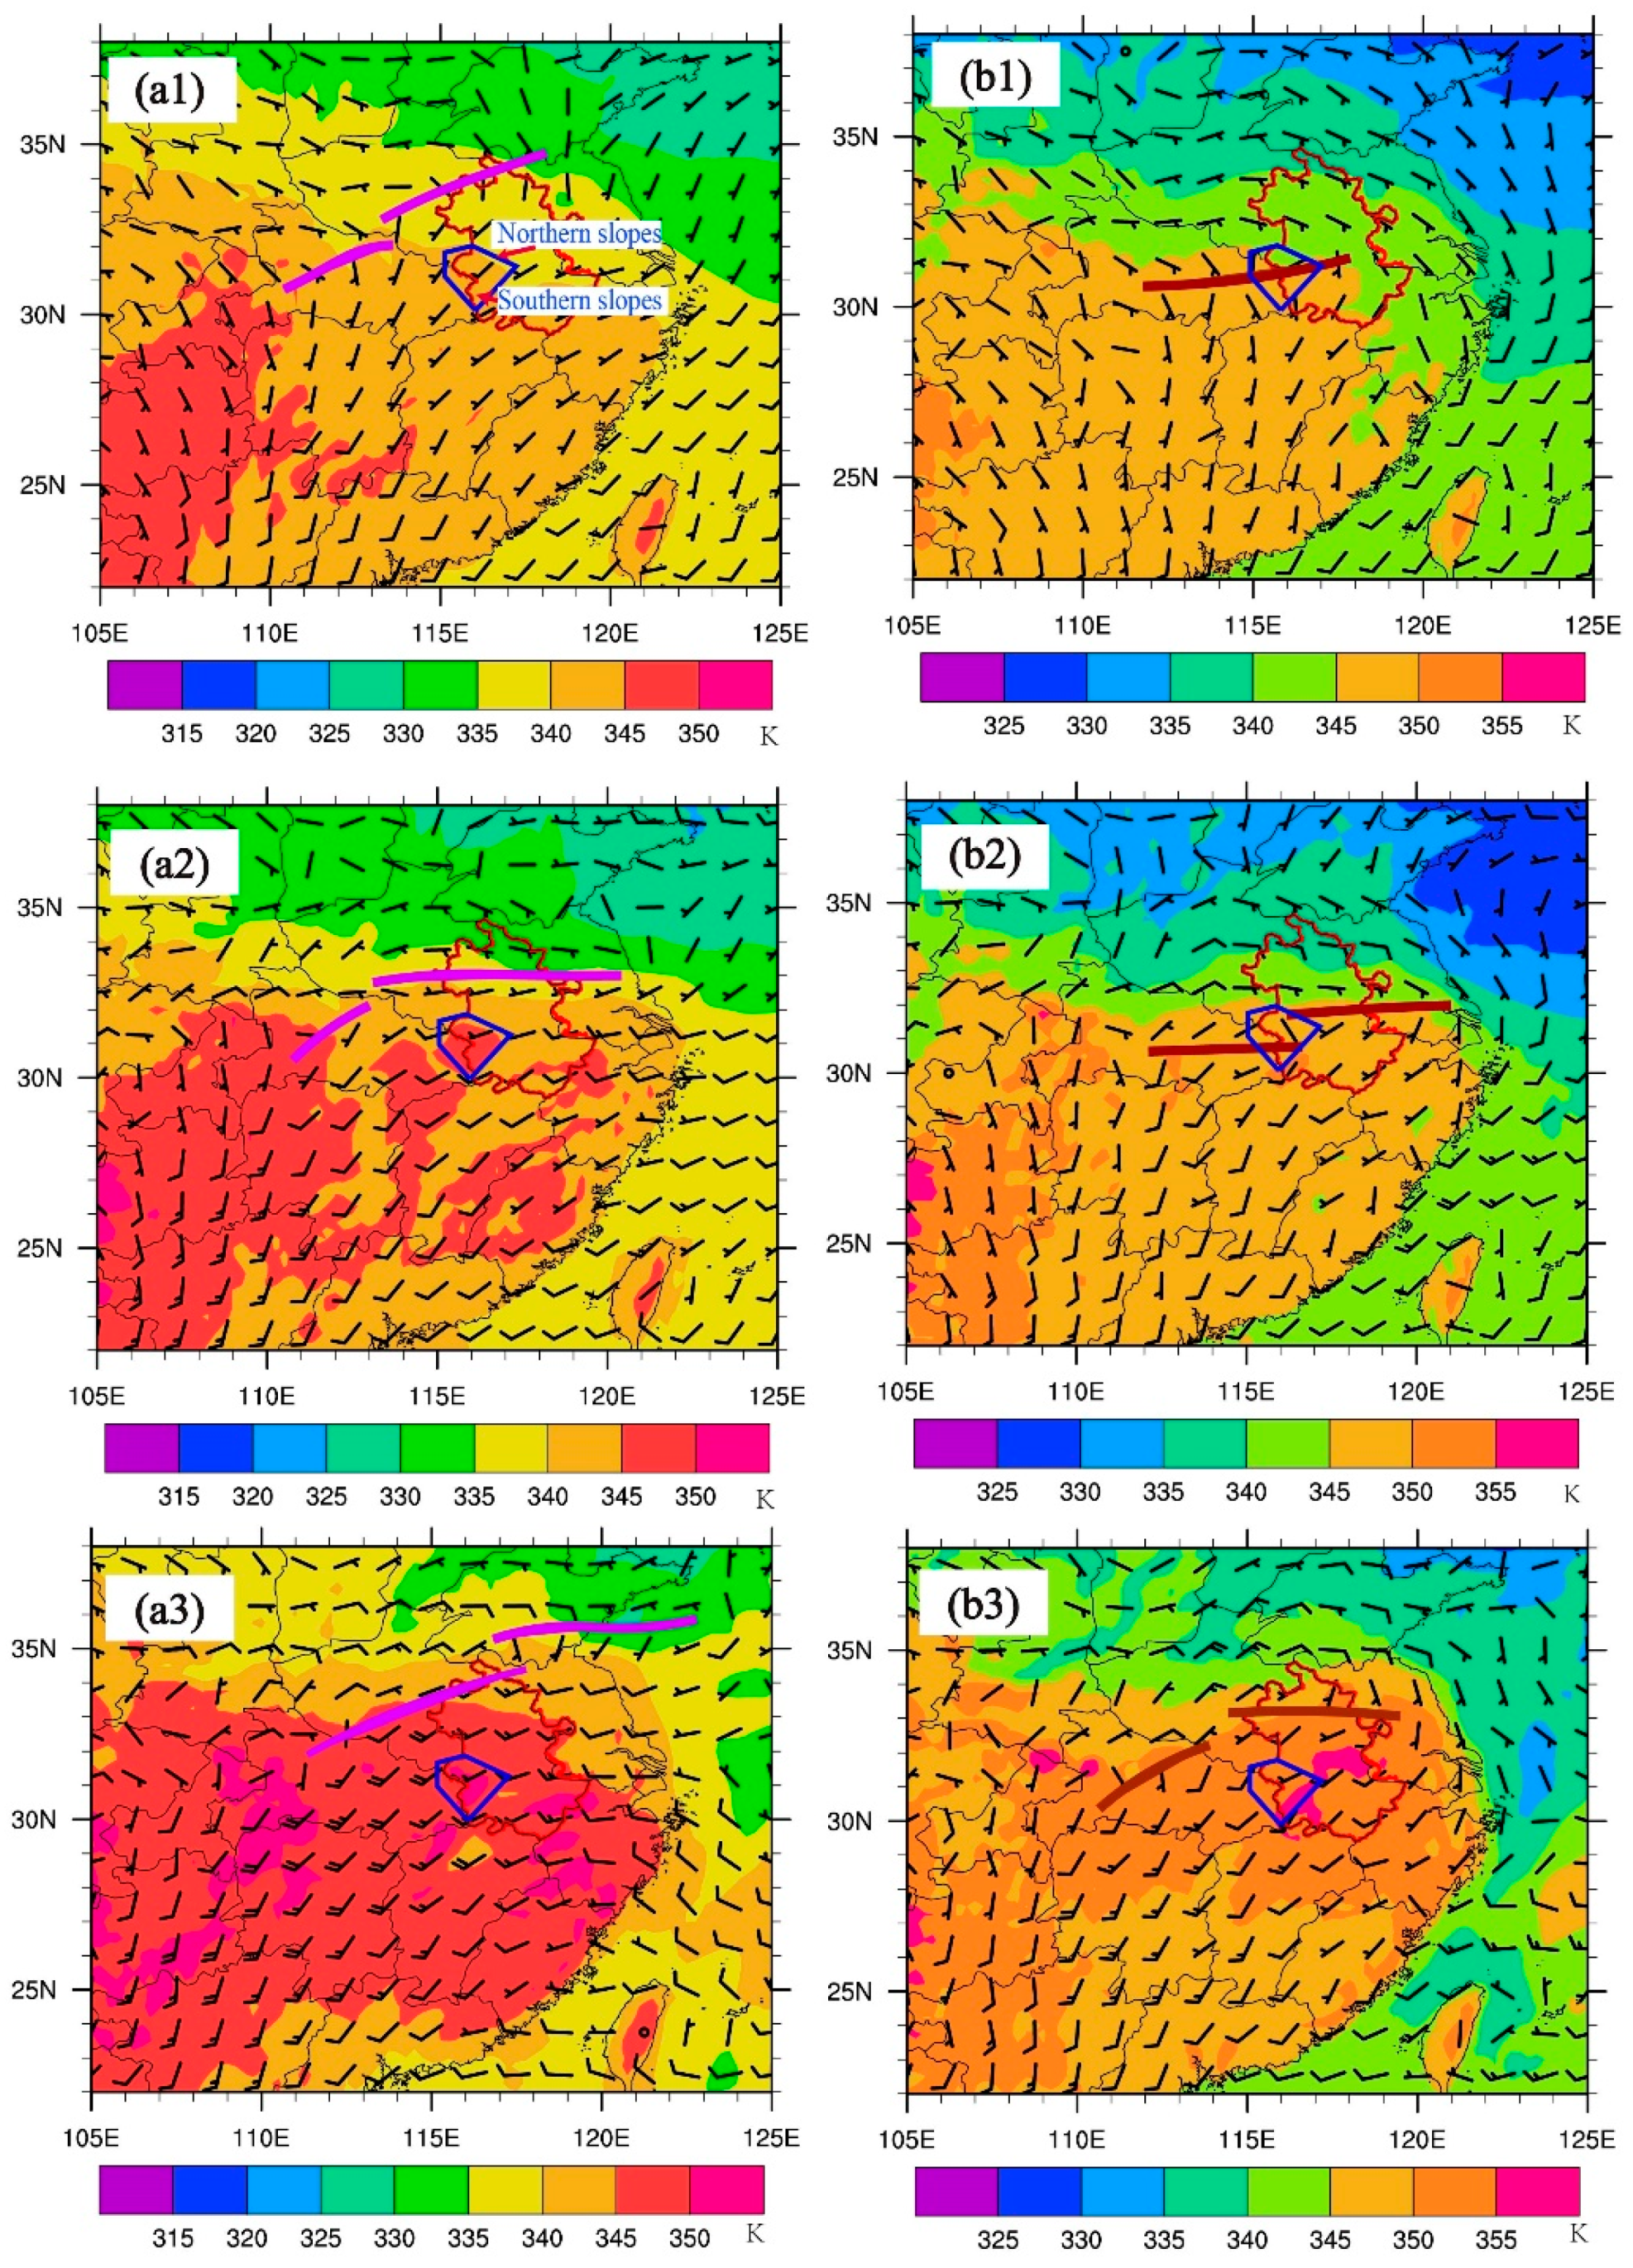
4. South- and North-Type Features
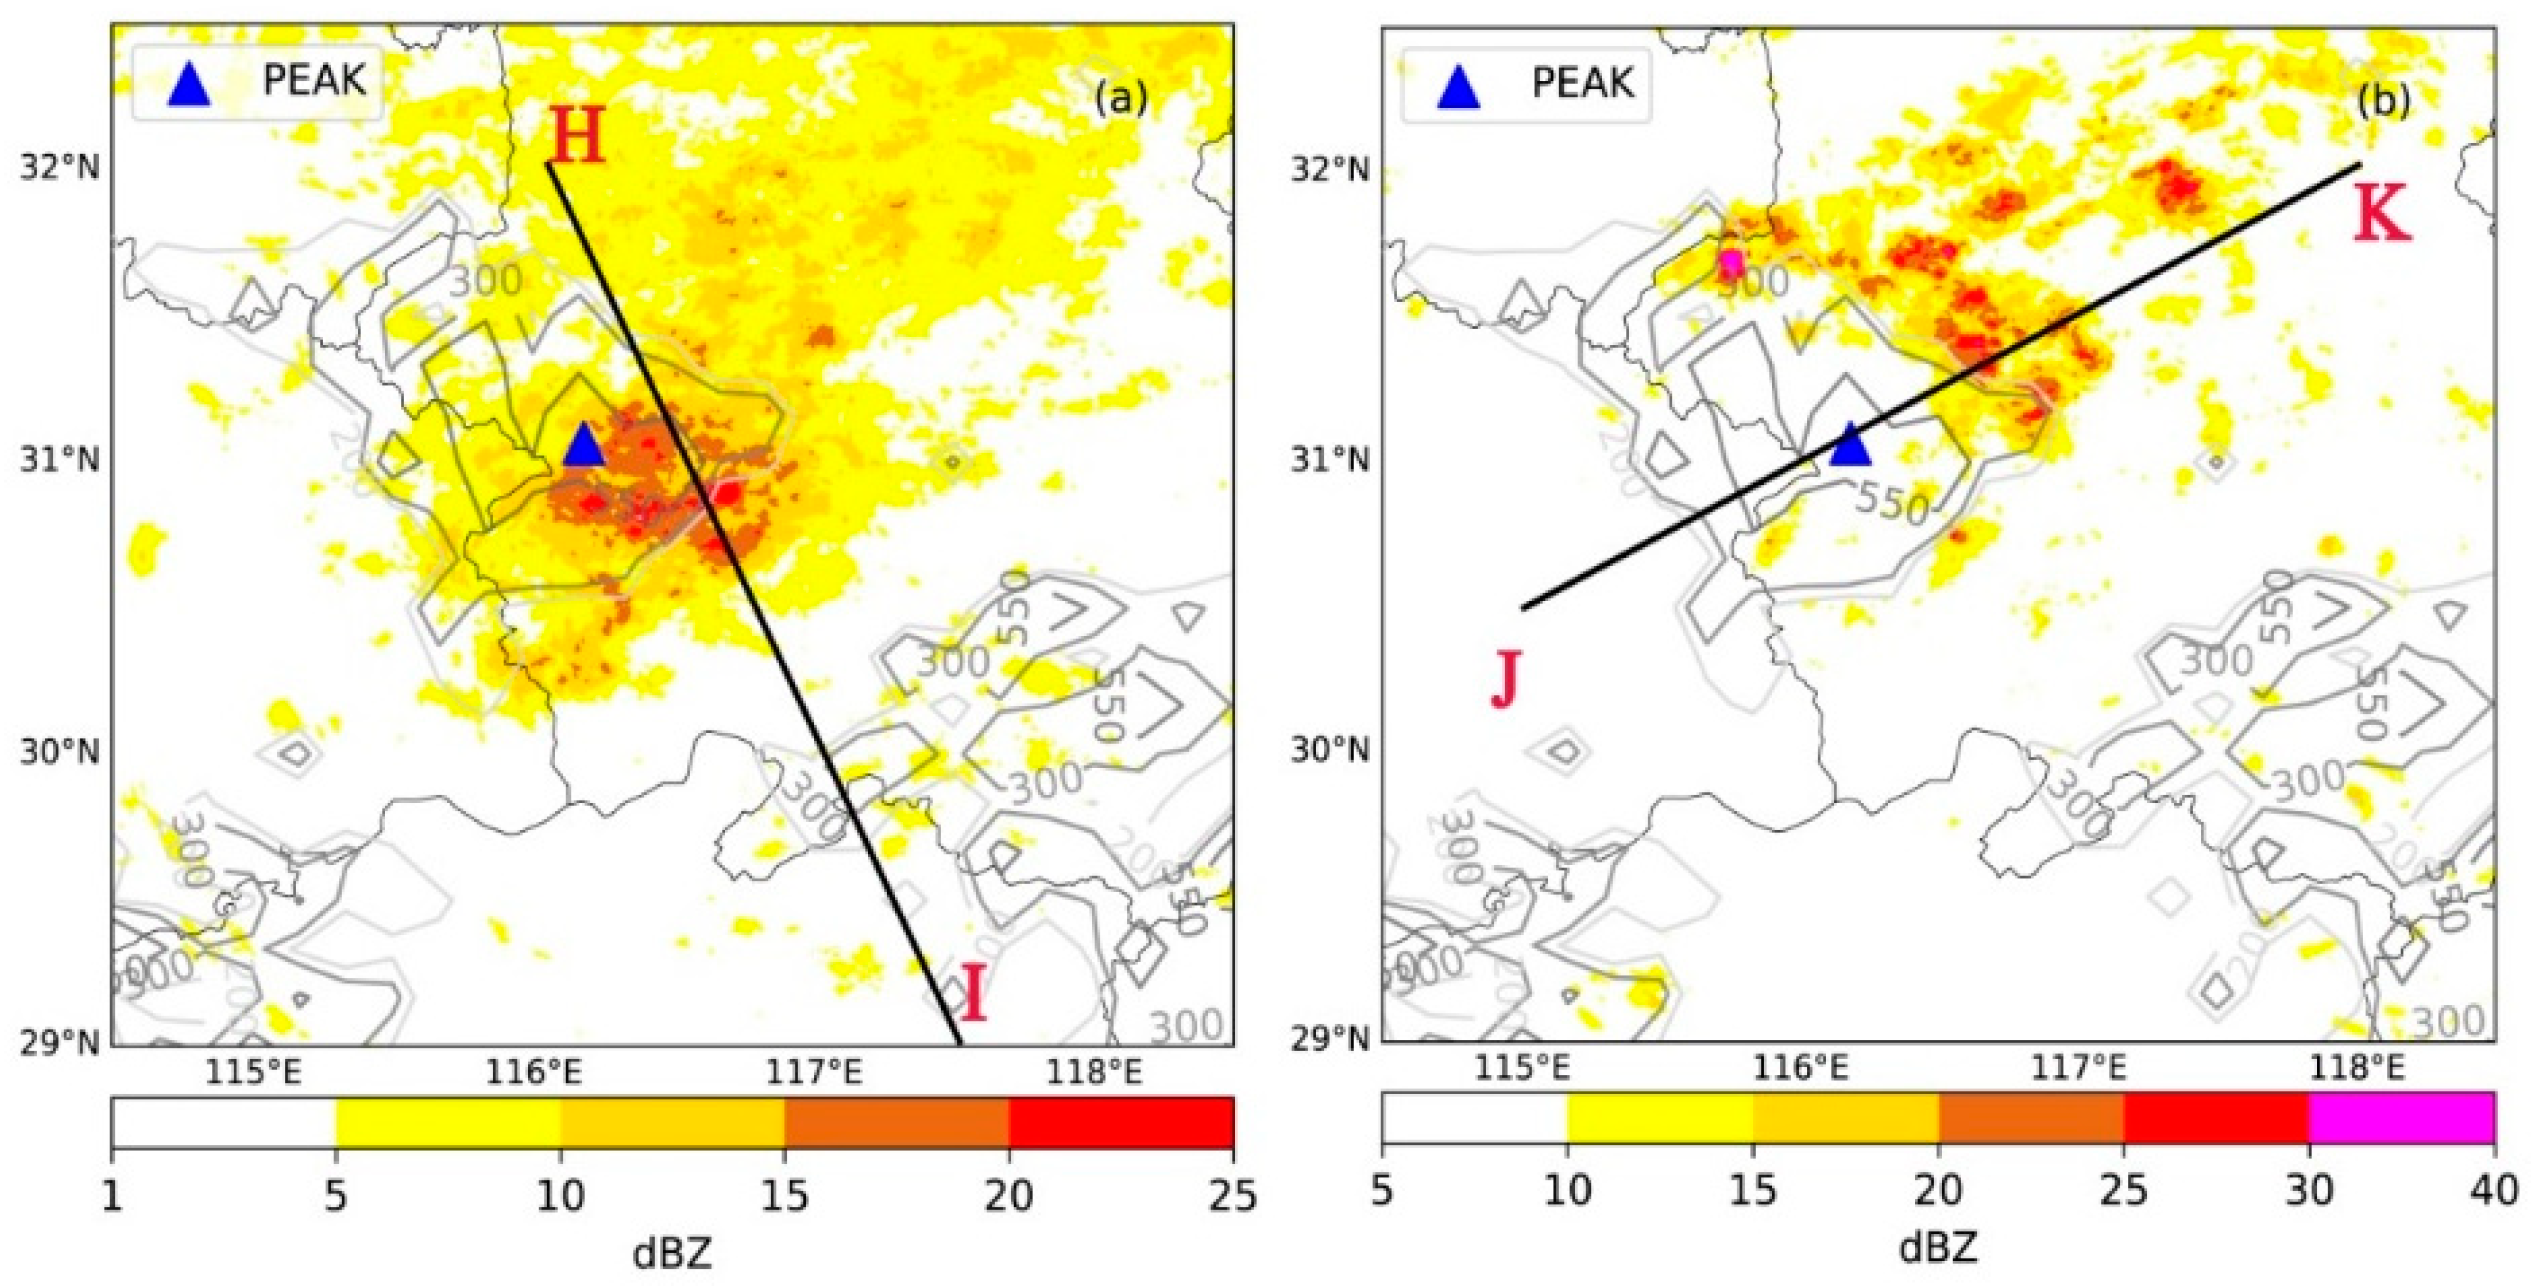
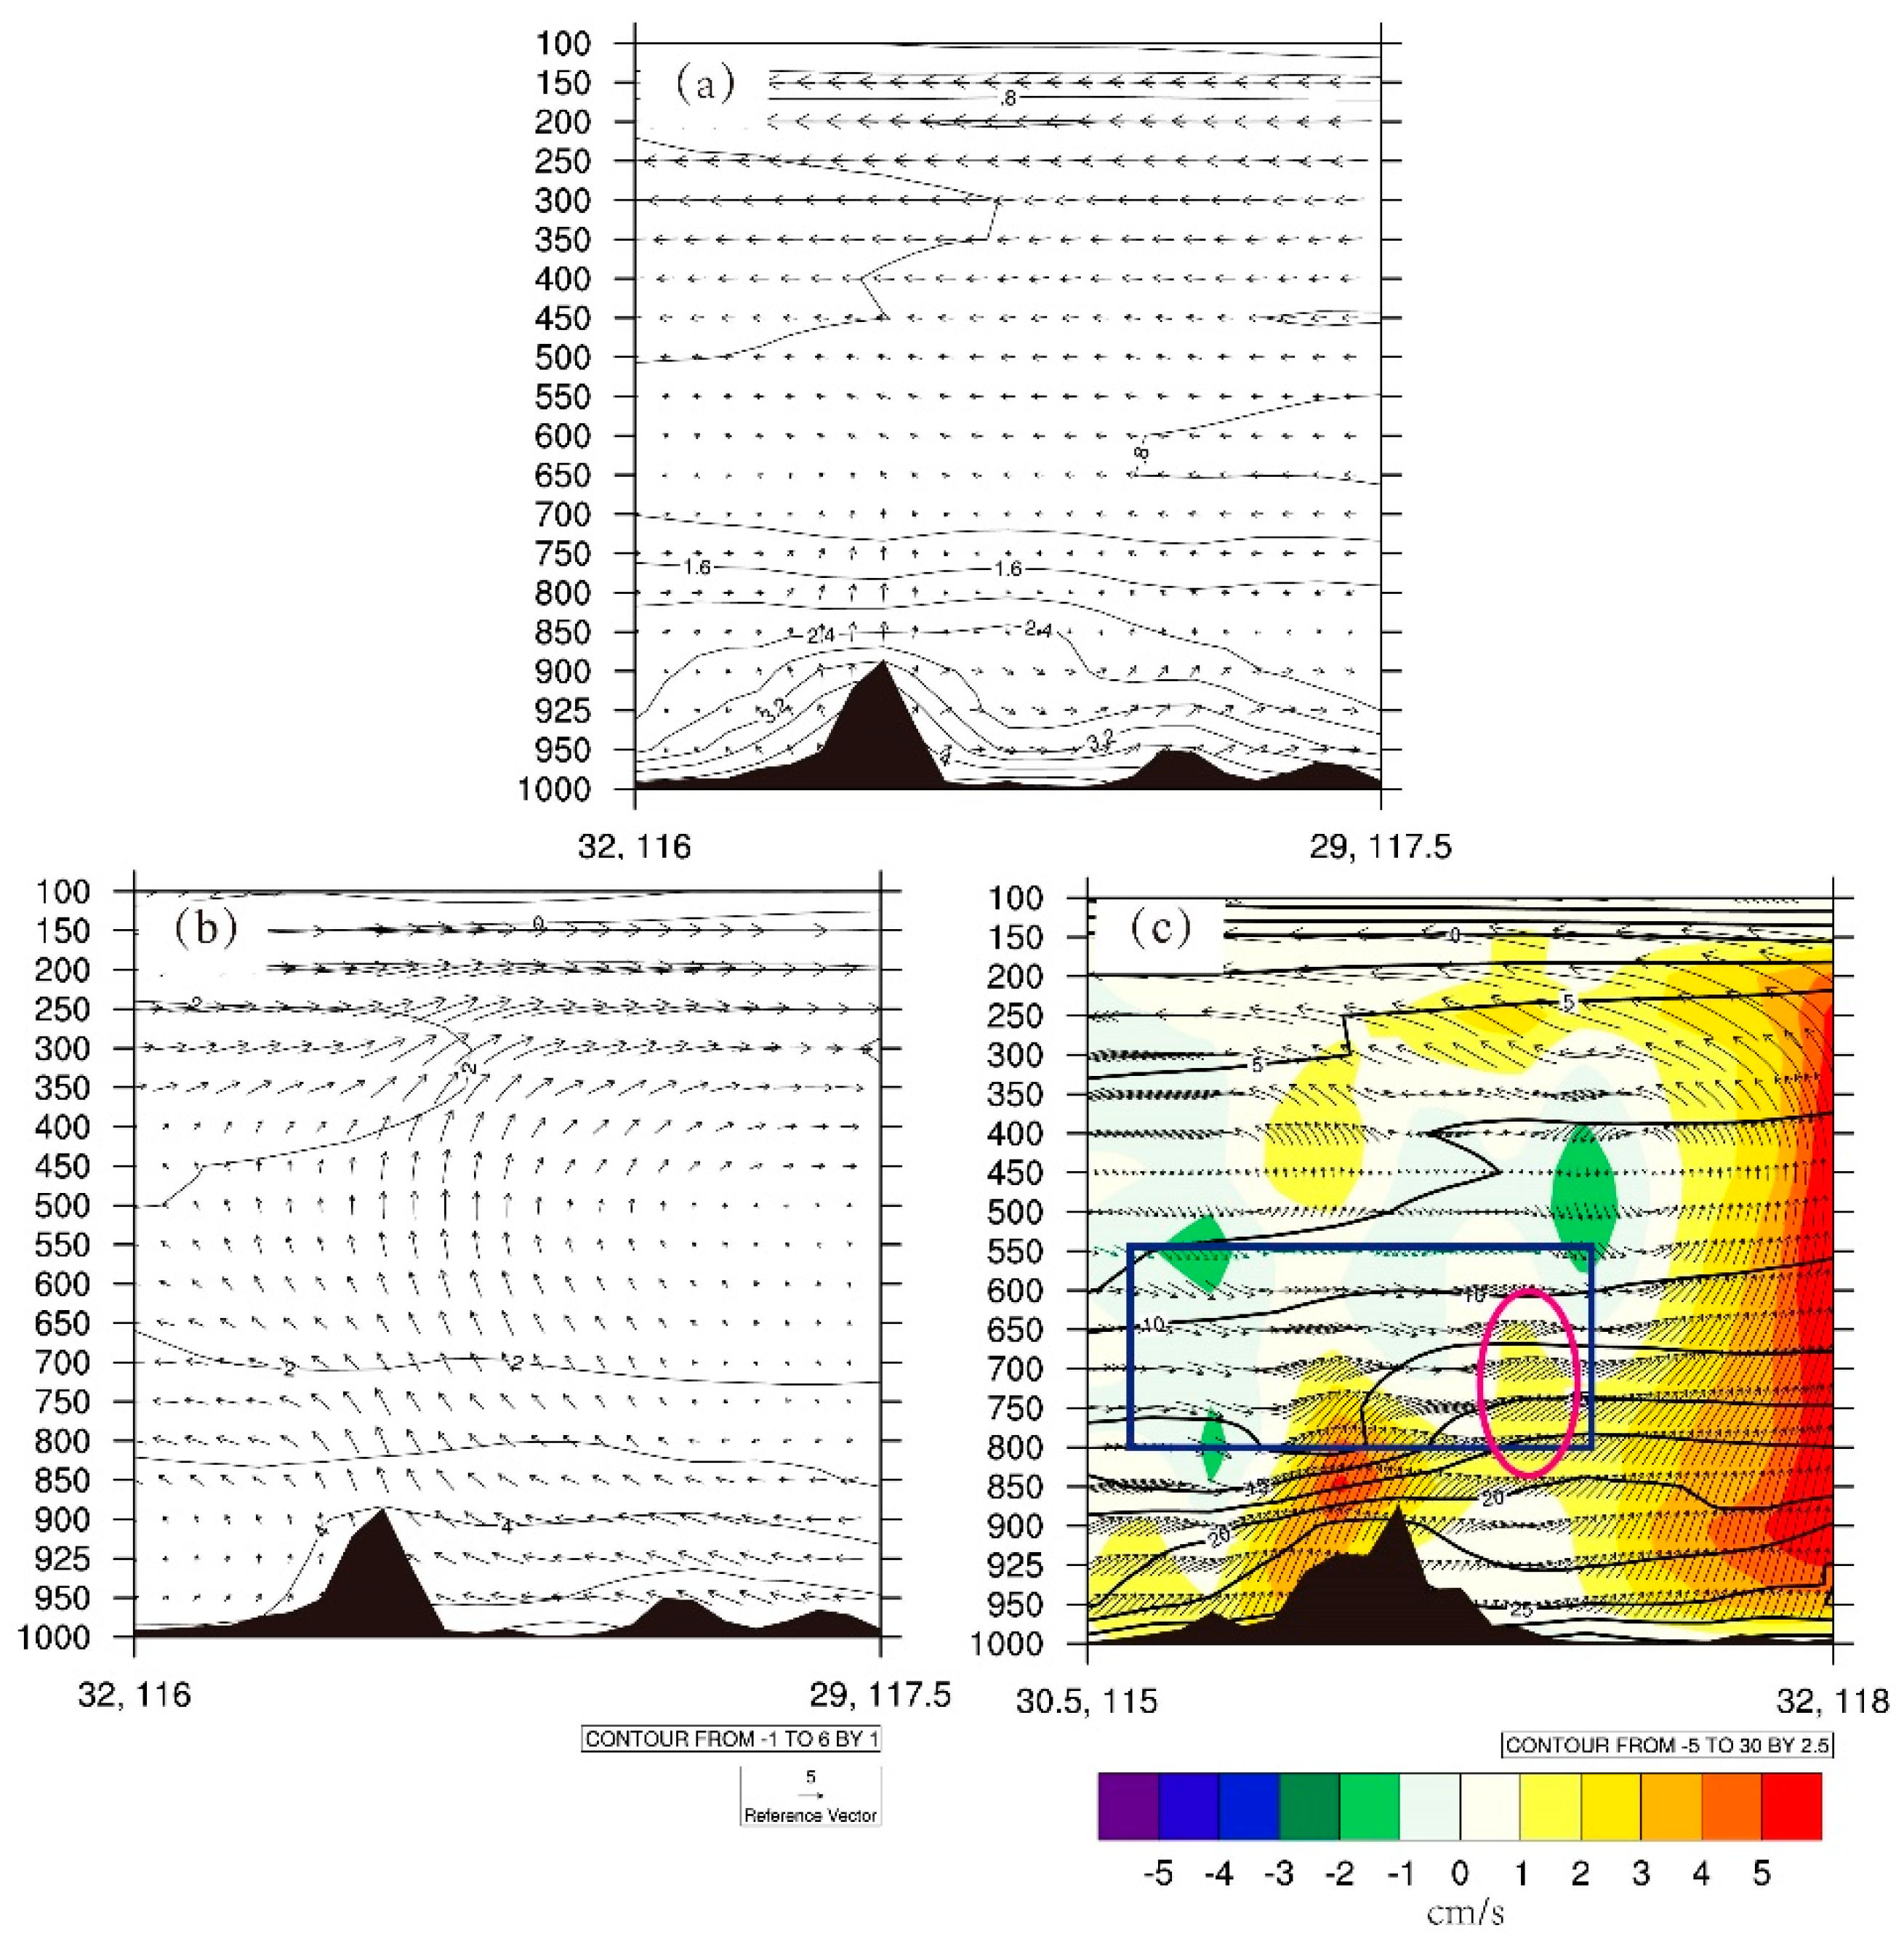
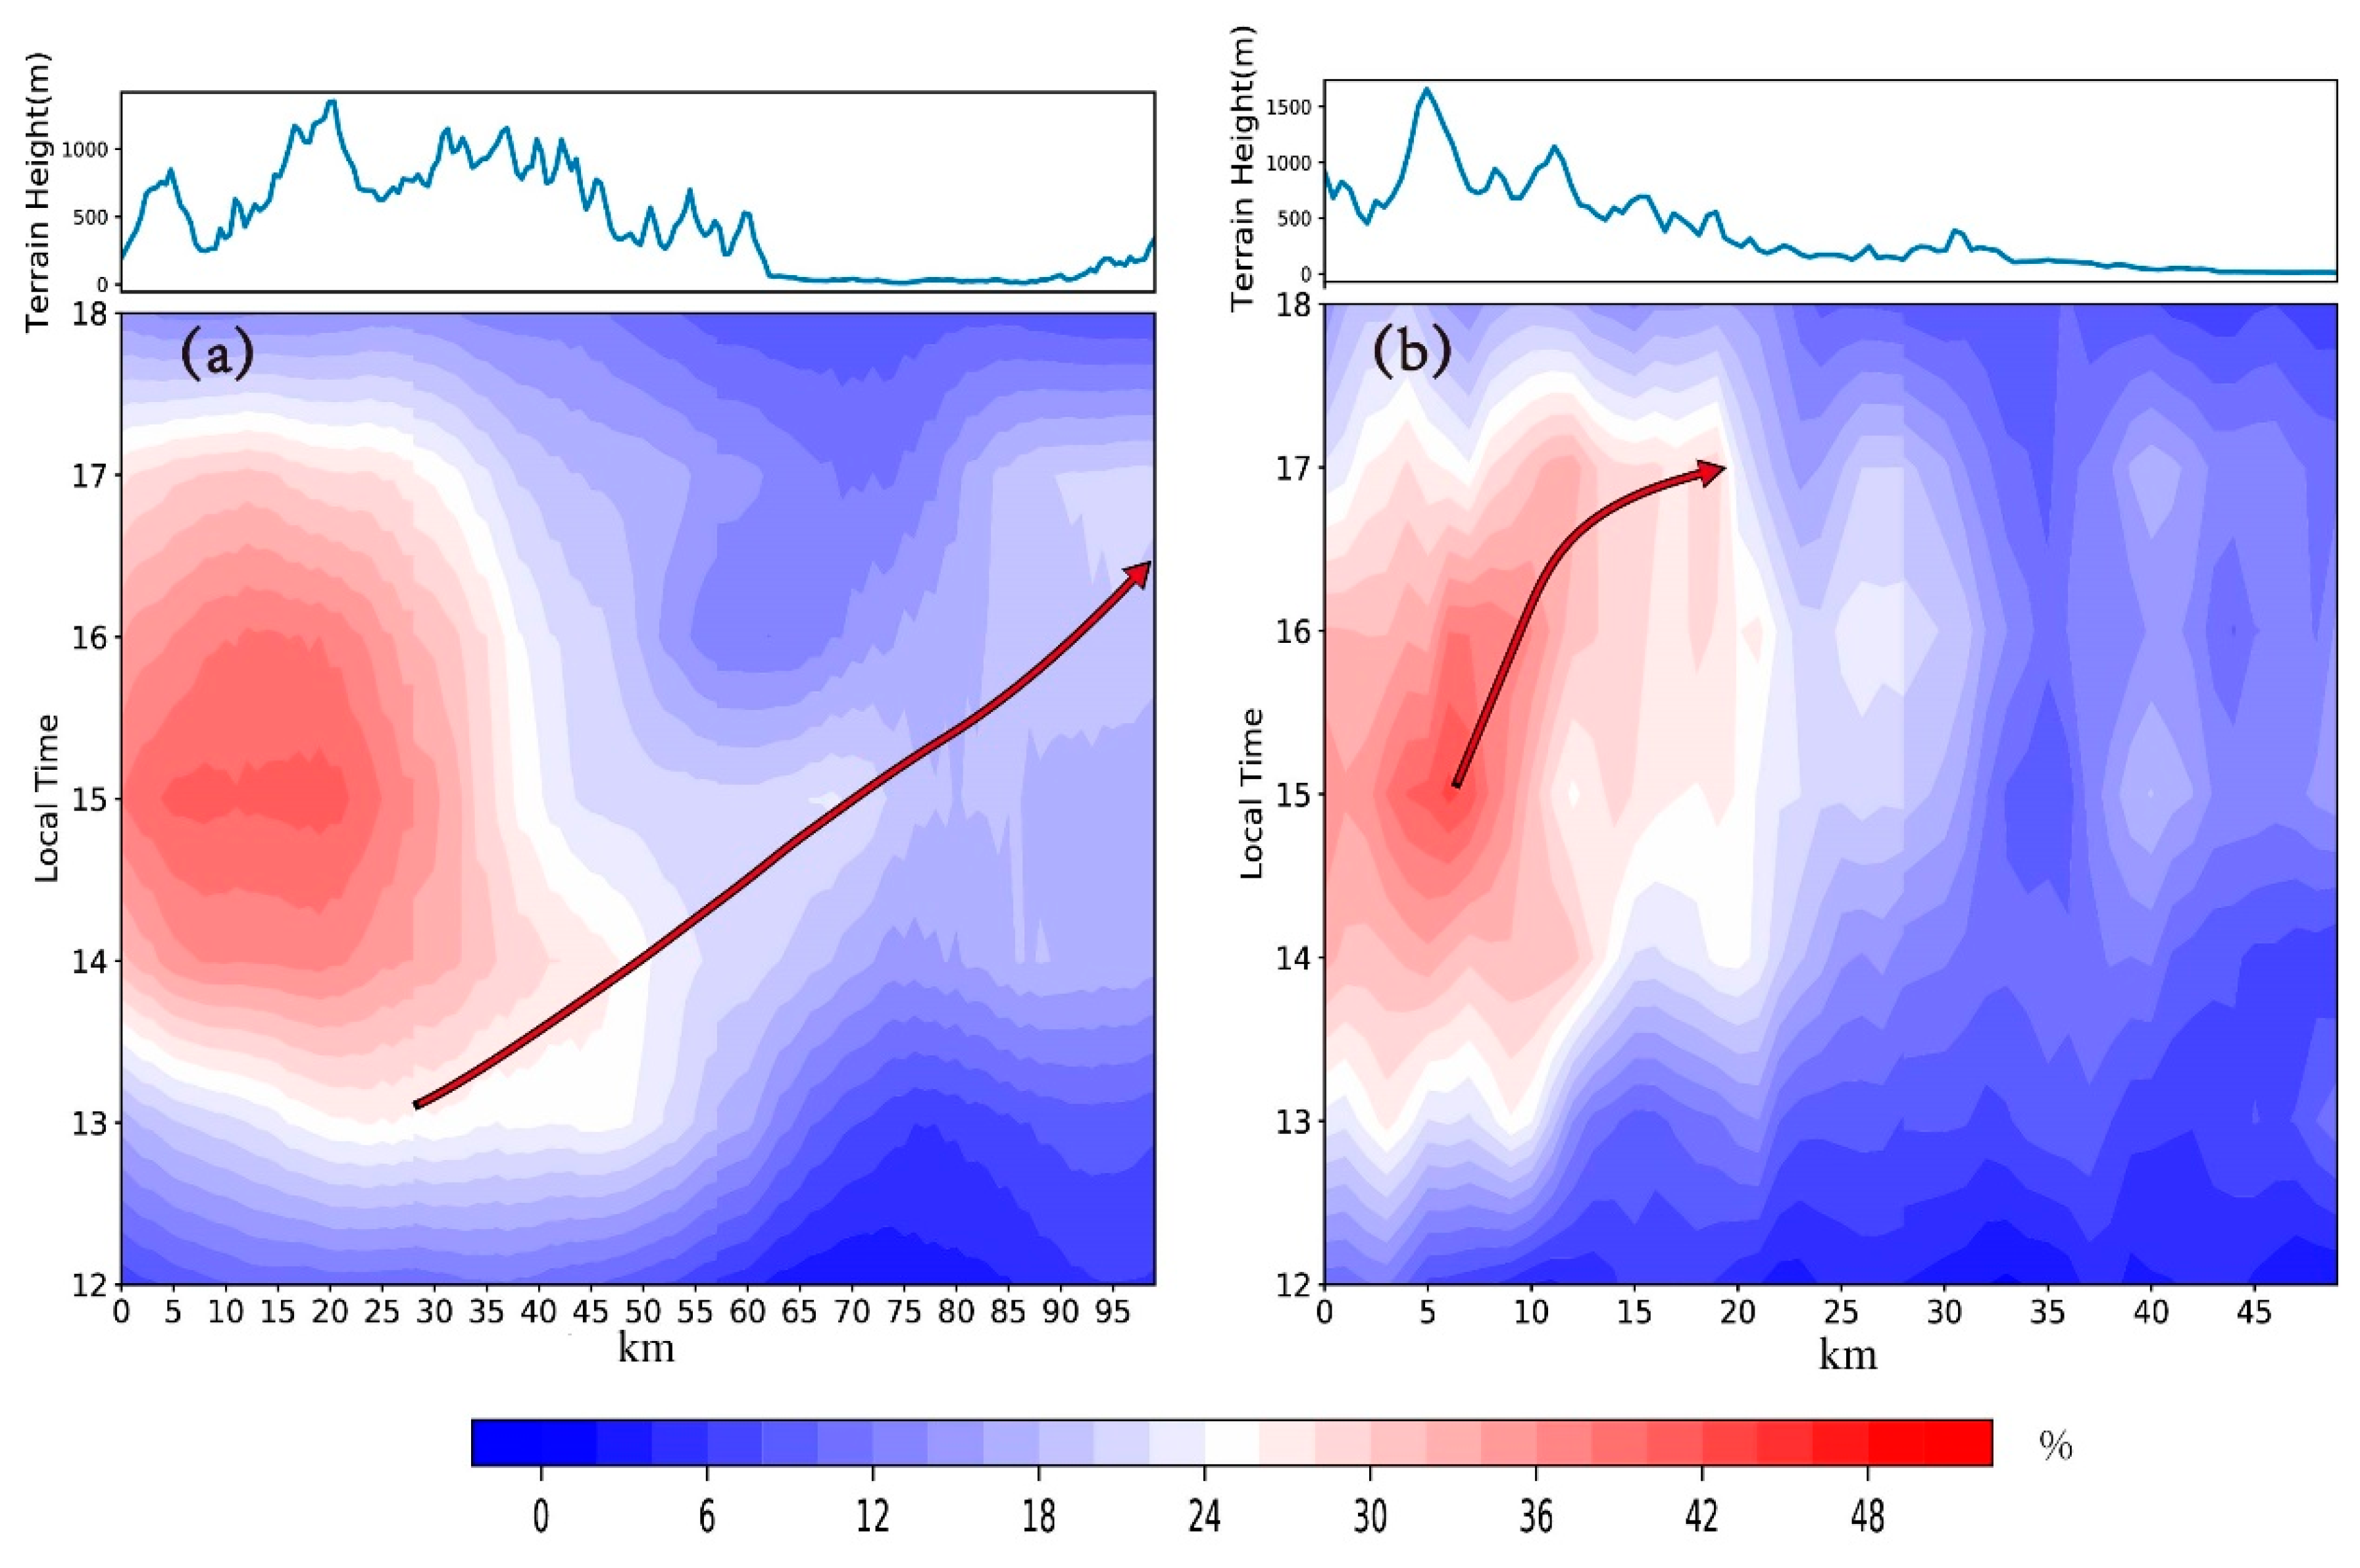
4.1. Developmental Characteristics
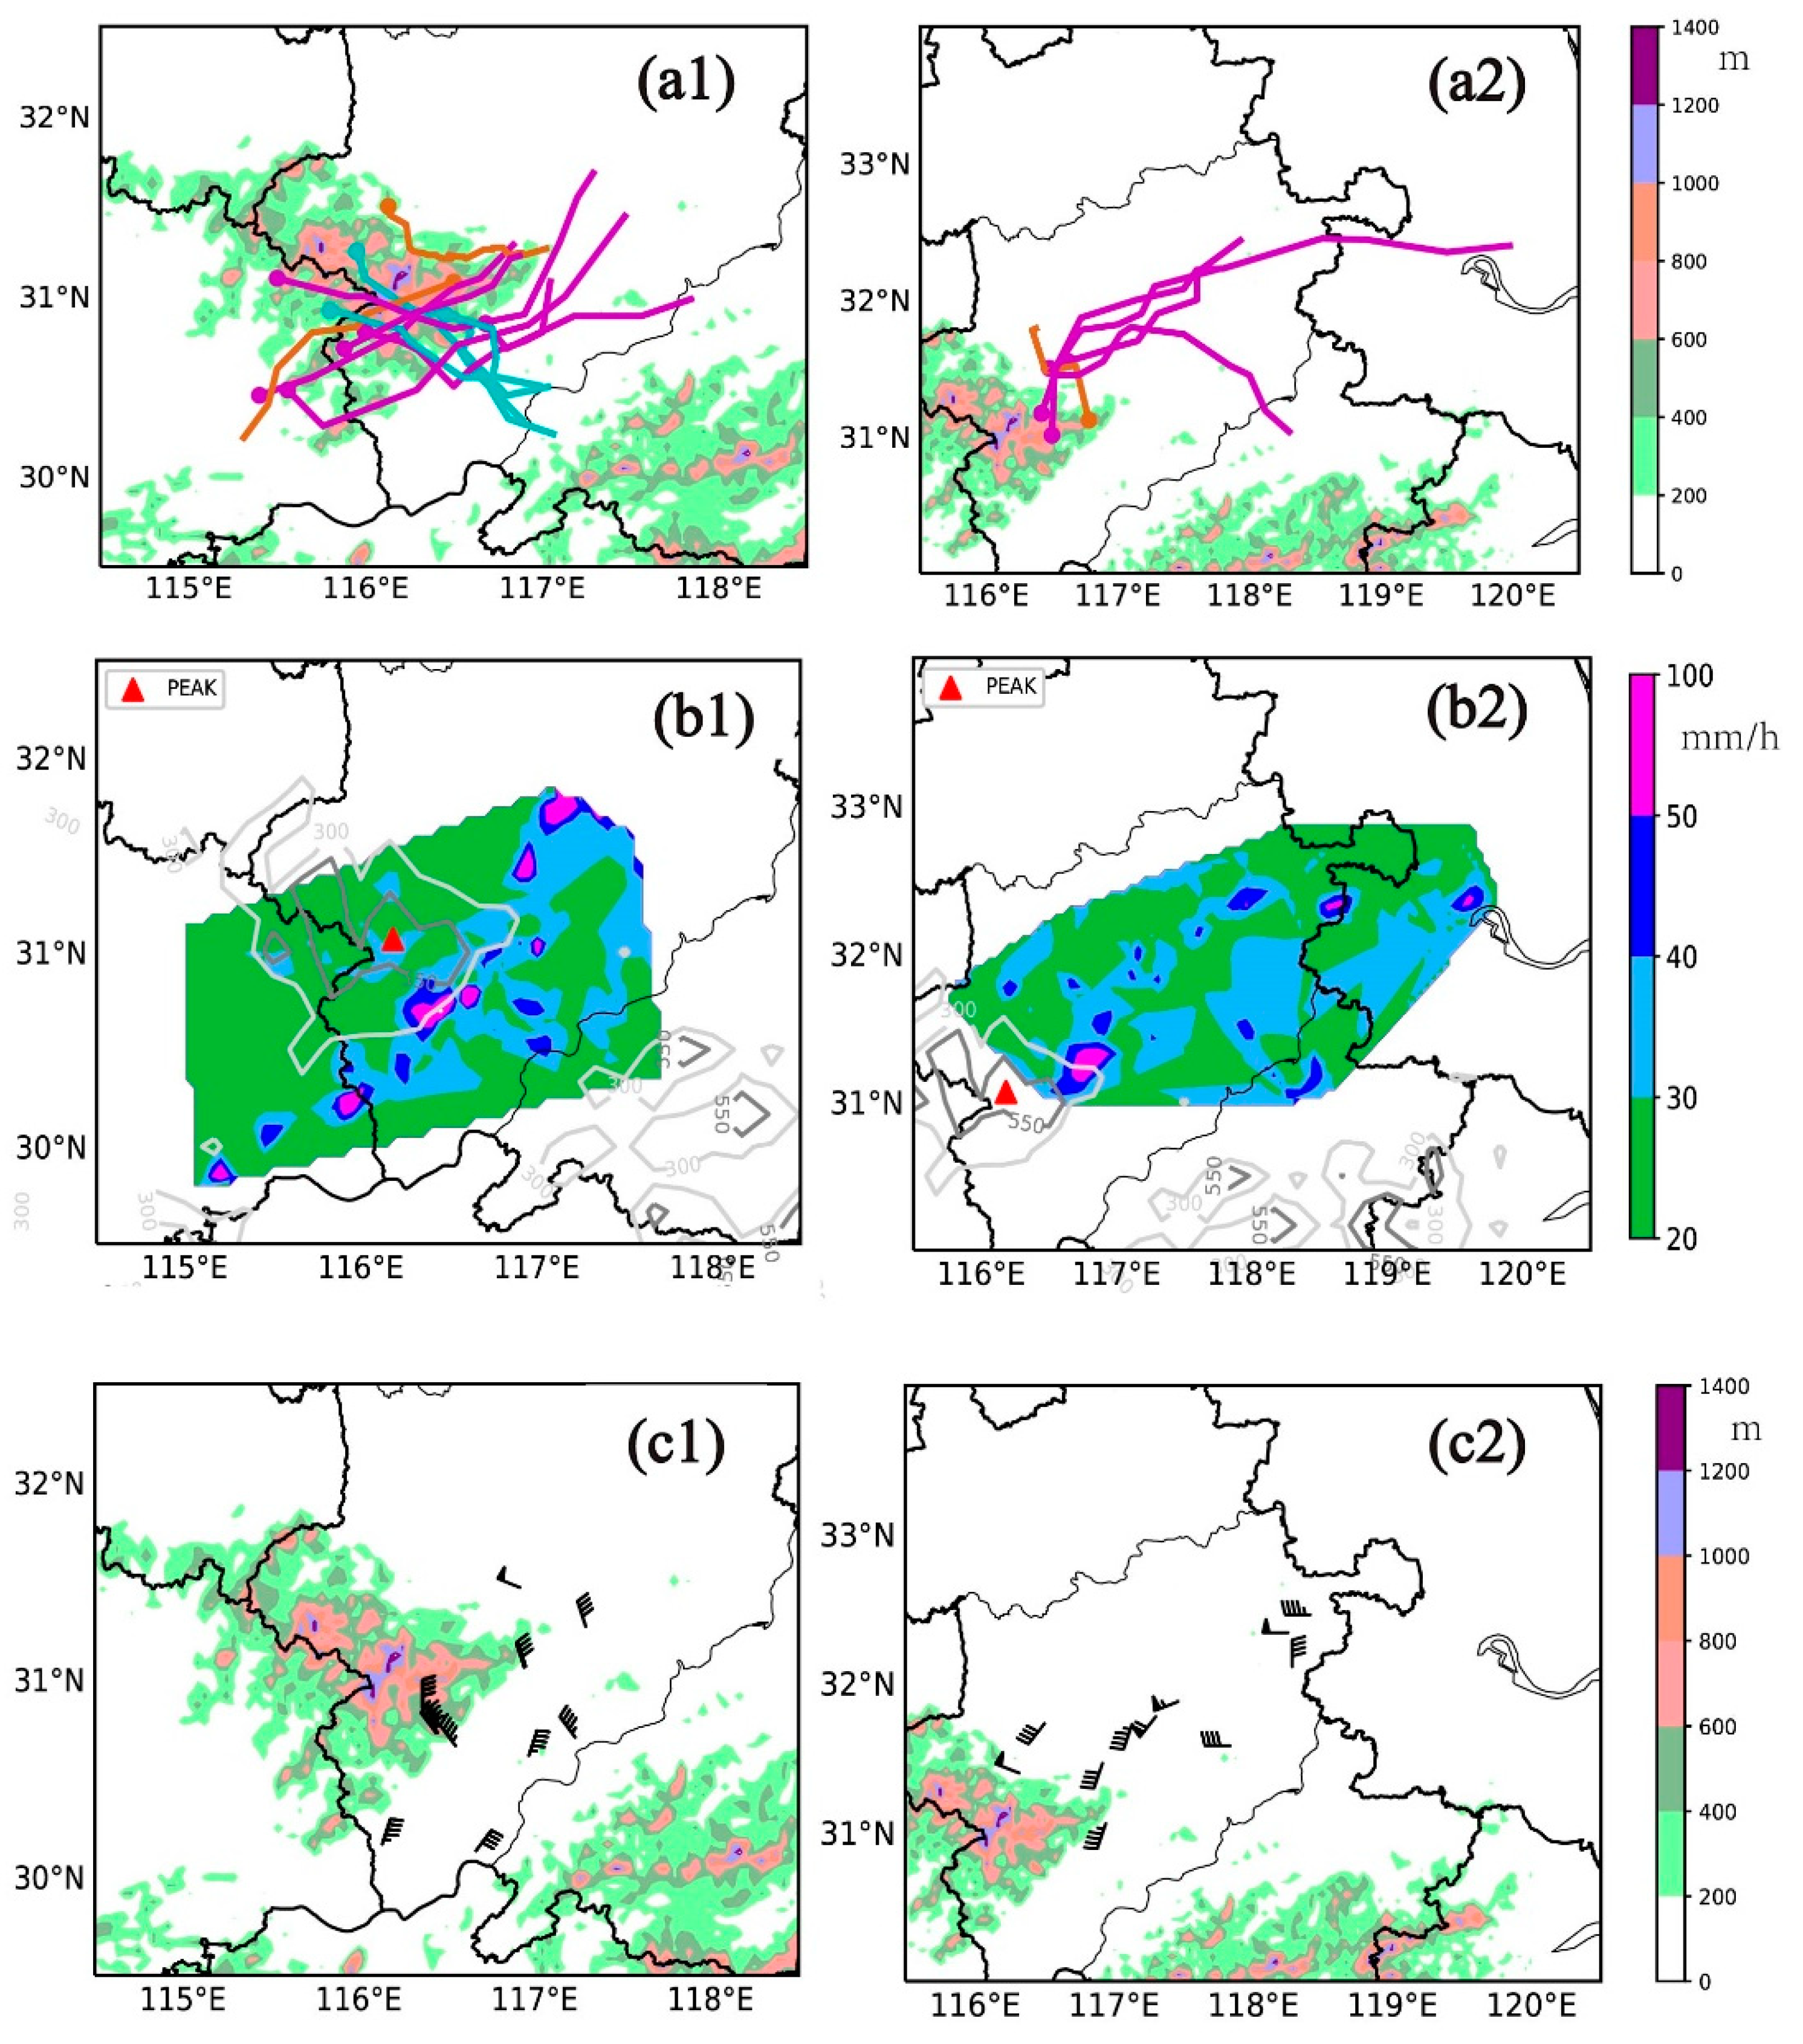
4.2. Tracks and Severe Convective Weather
5. Conclusions and Discussion
Author Contributions
Funding
Conflicts of Interest
References
- Banta, R.M.; Schaaf, C.L.B. Thunderstorm genesis zones in the Colorado Rocky Mountains as determined by traceback of geosynchronous satellite images. Mon. Weather Rev. 1987, 115, 463–476. [Google Scholar] [CrossRef] [Green Version]
- Aoshima, F.; Behrendt, A.; Bauer, H.S.; Wulfmeyer, V. Statistics of convection initiation by use of Meteosat rapid scan data during the Convective and Orographically-induced Precipitation Study (COPS). Meteorol. Ztschrif 2008, 17, 921–930. [Google Scholar] [CrossRef]
- Bluestein, H.B.; Golden, J.H. A review of tornado observations. The Tornado: Its Structure, Dynamics, Prediction, and Hazards. Geophys. Monogr. 1993, 79, 319–352. [Google Scholar]
- Wakimoto, R.M. Forecasting dry microburst activity over the high plains. Mon. Weather Rev. 1985, 113, 1131–1143. [Google Scholar] [CrossRef] [Green Version]
- Doswell, C.A. Synoptic-scale environments associated with high plains severe thunderstorms. Bull. Am. Meteor. Soc. 1980, 61, 1388–1400. [Google Scholar] [CrossRef]
- Wojtiw, L. Climate Summaries of Hailfall in Central Alberta (1957–73); Alberta Research Council: Edmonton, AB, Canada, 1975; 102p. [Google Scholar]
- Smith, S.B.; Yau, M.K. The mesoscale effect of topography on the genesis of Alberta hailstorms. Beitr. Phys. Atmos. 1987, 60, 371–392. [Google Scholar]
- Houze, R.A.; Schmid, W.; Fovell, R.G.; Schiesser, H.H. Hailstorms in Switzerland: Left movers, right movers, and false hooks. Mon. Weather Rev. 1993, 121, 3345–3370. [Google Scholar] [CrossRef] [Green Version]
- Zheng, L.L.; Sun, J.H.; Wei, J. Thunder events in China: 1980–2008. Atmos. Ocean. Sci. Lett. 2010, 3, 181–188. [Google Scholar]
- Yu, R.; Zhang, X.; Li, G.; Gao, Q. Analysis of frequency variation of thunderstorm, hail and gale wind in Eastern China from 1971 to 2000. Meteorol. Mon. 2012, 38, 1207–1216. (In Chinese) [Google Scholar]
- Liu, H.; Hi, W.; Huang, X. Statistical analysis of merger characteristic of convective cloud on July in Dabie Mountains. J. Atmos. Environ. Opt. 2010, 5, 33–39. (In Chinese) [Google Scholar]
- Zhang, J.; Yuan, S.; Yao, Y. Analysis on consistency of thunderstorm data from lightening detection network and manual observation in the Yangtze and Huaihe River region. Torrential Rain Disasters 2015, 34, 286–292. (In Chinese) [Google Scholar]
- Zhou, K.; Pan, Y.; Wang, D.; Chen, B. Numerical simulations of the orographic effects of the Dabie Mountains on the mesoscale convective system of a spring cold front. J. Nanjing Univ. (Nat. Sci.) 2007, 43, 535–543. (In Chinese) [Google Scholar]
- Zhao, Y.; Zhao, G.; Miao, C.; Bo, Y. Analysis of the terrain sensitivity torrential rain in Jianghuai region 2007-07-07. Sci. Technol. Innov. 2015, 3, 28–30. (In Chinese) [Google Scholar]
- Zhu, M.; Yu, Z.H.; Lu, H.C. The effect of meso-scale lee wave and its application. Acta Metorologocal Sin. 1999, 57, 705–714. (In Chinese) [Google Scholar]
- Zhao, Y.; Xu, X.; Cui, C. Case study of the impact of mesoscale topography on Meiyu frontal rainstorm. Plateau Meteorol. 2012, 31, 1268–1281. (In Chinese) [Google Scholar]
- Dong, M.; Chen, L.; Cheng, Z.; Li, Y. Numerical study of topography effect on rainfall reinforcement associated with Tropical Cyclone ‘Talim’. Plateau Meteorol. 2011, 30, 700–710. (In Chinese) [Google Scholar]
- Kovacs, M.; Kirshbaum, D.J. Topographic impacts on the spatial distribution of deep convection over southern Quebec. J. Appl. Meteor. Climatol. 2016, 55, 743–762. [Google Scholar] [CrossRef]
- Lanicci, J.M.; Warner, T.T. A synoptic climatology of the elevated mixed-layer inversion over the Southern Great Plains in spring. Part I: Structure, dynamics, and seasonal evolution. Weather Forecast. 1991, 6, 198–213. [Google Scholar] [CrossRef]
- Tripoli, G.J.; Cotton, W.R. Numerical study of an observed orogenic mesoscale convective system. Part I: Simulated genesis and comparison with observations. Mon. Weather Rev. 1989, 117, 273–304. [Google Scholar] [CrossRef] [Green Version]
- Tripoli, G.J.; Cotton, W.R. Numerical study of an observed orogenic mesoscale convective system. Part II: Analysis of governing dynamics. Mon. Weather Rev. 1989, 117, 304–328. [Google Scholar]
- Szoke, E.J.; Mueller, C.K.; Wilson, J.W.; Zipser, E.J. Development of convection and severe weather along outflow boundaries in northeast Colorado: Diagnosing the above-surface environment with a mobile sounding system. Preprints, 14th Conference on Severe Local Storms, Indianapolis, IN. Am. Meteor. Soc. 1985, 66, 386–389. [Google Scholar]
- Wilson, J.W.; Schreiber, W.E. Initiation of convective storms at radar-observed boundary-layer convergence lines. Mon. Weather Rev. 1986, 114, 2516–2536. [Google Scholar] [CrossRef] [Green Version]
- Jou, B.J.D. Mountain-originated mesoscale precipitation system in northern Taiwan: A case study 21 June 1991. Terr. Atmos. Oceanic. Sci. 1994, 5, 169–197. [Google Scholar] [CrossRef]
- Kuo, J.T.; Orville, H.D. A Radar climatology of summertime convective clouds in the Black Hills. J. Appl. Meteorol. 1973, 12, 359–367. [Google Scholar] [CrossRef] [Green Version]
- Lin, P.F.; Chang, P.L.; Jou, J.D.; Wilson, J.W.; Roberts, R.D. Warm season afternoon thunderstorm characteristics under weak synoptic-scale forcing over Taiwan island. Weather Forecast. 2011, 26, 44–60. [Google Scholar] [CrossRef] [Green Version]
- Zheng, L.; Sun, J.; Zhang, X.; Liu, C. Organizational modes of mesoscale convective systems over central East China. Weather Forecast. 2013, 28, 1081–1098. [Google Scholar] [CrossRef] [Green Version]
- Meng, Z.; Zhang, F. On the squall lines preceding landfalling tropical cyclones in China. Mon. Weather Rev. 2012, 140, 445–470. [Google Scholar] [CrossRef]
- Meng, Z.; Yan, D.; Zhang, Y. General features of squall lines in East China. Mon. Weather Rev. 2013, 141, 1629–1647. [Google Scholar] [CrossRef]
- Han, F.; Wo, W. Design and implementation of SWAN2.0 platform. J. Appl. Meteorol. Sci. 2018, 1, 25–34. (In Chinese) [Google Scholar]
- Wu, T.; Wan, Y.; Wo, W.; Leng. L. Design and application of Radar reflectivity quality control algorithm in SWAN. Meteorol. Sci. Technol. 2013, 41, 809–817. (In Chinese) [Google Scholar]
- Parker, M.D.; Knievel, J.C. Do meteorologists suppress thunderstorms?: Radar-derived statistics and the behavior of moist convection. Bull. Am. Meteorol. Soc. 2005, 86, 341–358. [Google Scholar] [CrossRef] [Green Version]
- Chen, M.; Wang, Y.; Gao, F.; Xiao, X. Diurnal variations in convective storm activity over contiguous North China during the warm season based on radar mosaic climatology. J. Geophys. Res. 2012, 117, D20115. [Google Scholar] [CrossRef] [Green Version]
- Lin, C.Y.; Chen, W.C.; Chang, P.L. Impact of the urban heat island effect on precipitation over a complex geographic environment in northern Taiwan. J. Appl. Meteorol. Climatol. 2011, 50, 339–353. [Google Scholar] [CrossRef]
- Chechik, G.; Shalit, U.; Sharma, Y. An Online Algorithm for Large Scale Image Similarity Learning. In Proceedings of the Advances in Neural Information Processing Systems 22: 23rd Annual Conference on Neural Information Processing Systems 2009, Vancouver, BC, Canada, 7–10 December 2009; Curran Associates Inc.: New York, NY, USA, 2009. [Google Scholar]
- Hereford, J.M.; Rhodes, W.T. Nonlinear Optical Image Filtering By Time-Sequential Threshold Decomposition. Opt. Eng. 1988, 27, 274. [Google Scholar] [CrossRef]
- Liu, H.; Hou, X. The Precise Location Algorithm of License Plate Based on Gray Image. In Proceedings of the Computer Science & Service System (CSSS), 2012 International Conference on. IEEE Computer Society, Nanjing, China, 11–13 August 2012. [Google Scholar]
- Juhola, M.; Katajainen, J.; Raita, T. Comparison of algorithms for standard median filtering. IEEE Trans. Signal Process. 2002, 39, 204–208. [Google Scholar] [CrossRef]
- IPCC. Special Report on Global Warming of 1.5 °C; Cambridge University Press: Cambridge, UK, 2018. [Google Scholar]
- Qi, Q.; Cai, R.; Guo, H. The Climatic Variations of Temperature Extremes in the Eastern of China. Sci. Geogr. Sin. 2019, 39, 1340–1350. [Google Scholar] [CrossRef]
- Johnson, R.H.; Bresch, J.F. Diagnosed characteristics of precipitation systems over Taiwan during the May–June 1987 TAMEX. Mon. Weather Rev. 1991, 119, 2540–2557. [Google Scholar] [CrossRef]
- Lin, S.M.; Kuo, H.C. A study of summertime afternoon convection in southern Taiwan during 1994 (in Chinese with English abstract). Atmos. Sci. 1996, 24, 249–280. [Google Scholar]
- Chen, G.T.J.; Chou, H.C.; Chang, T.C. Frontal and non-frontal convection over northern Taiwan in mei-yu season (in Chinese with English abstract). Atmos. Sci. 2001, 29, 37–52. [Google Scholar]
- Henz, J.F. Characteristics of severe convective storms in Colorado High Plains. Preprints, Eighth Conf. on Severe Local Storms, Denver, Colorado. Amer. Meteor. Soc. 1973, 113, 96–103. [Google Scholar]
- Karr, T.W.; Wooten, R.L. Summer radar echo distribution around Limon, CO. Mon. Weather Rev. 1976, 104, 728–734. [Google Scholar] [CrossRef]
- Klitch, M.A.; Weaver, J.F.; Kelly, F.P.; Vonder Haar, T.H. Convective cloud climatologies constructed from satellite imagery. Mon. Weather Rev. 1985, 113, 326–337. [Google Scholar] [CrossRef] [Green Version]
- Yang, R.; Zhang, Y.; Sun, J.; Fu, S.; Li, J. The characteristics and classification of eastward-propagating mesoscale convective systems generated over the second-step terrain in the Yangtze River Valley. Atmos. Sci. Lett. 2018, 20, e874. [Google Scholar] [CrossRef] [Green Version]
- Sun, J. The effect of vertical distribution of the lower level flow on precipitation location. Plateau Meteorol. 2005, 24, 62–69. (In Chinese) [Google Scholar]
- Ni, T.; Huang, Y.; Ling, X.; Huang, G.; Li, J. Characteristics of orographic precipitation in Dabie Mountain. Meteorol. Sci. Technol. 2018, 46, 556–562. (In Chinese) [Google Scholar]
- Jirak, I.L.; Cotton, W.R.; Mcanelly, R.L. Satellite and Radar Survey of Mesoscale Convective System Development. Mon. Weather Rev. 2003, 131, 2428. [Google Scholar] [CrossRef] [Green Version]
- Tao, S.Y. Heavy Rainfalls in China; Science Press: Beijing, China, 1980; 225p. (In Chinese) [Google Scholar]
- Luo, Y.L.; Wang, H.; Zhang, R.H.; Qian, W.M.; Luo, Z.Z. Comparison of rainfall characteristics and convective properties of monsoon precipitation systems over south China and the Yangtze and Huai River basin. J. Clim. 2013, 26, 110–132. [Google Scholar] [CrossRef] [Green Version]
- Wang, Q.W.; Xue, M.; Tan, Z.M. Convective initiation by topographically induced convergence forcing over the Dabie Mountains on 24 June 2010. Adv. Atmos. Sci. 2016, 33, 1120–1136. [Google Scholar] [CrossRef] [Green Version]
- Weckwerth, T.M.; Wilson, J.W.; Hagen, M.; Emerson, T.J.; Pinto, J.O.; Rife, D.L.; Grebe, L. Radar climatology of the COPS region. Q. J. R. Meteorol. Soc. 2011, 137, 31–41. [Google Scholar] [CrossRef] [Green Version]
- Chen, M.; Wang, Y.; Gao, F.; Xiao, X. Diurnal evolution and distribution of warm-season convective storms in different prevailing wind regimes over contiguous North China. J. Geophys. Res. Atmos. 2014, 119, 2742–2763. [Google Scholar] [CrossRef]
- Carbone, R.E.; Tuttle, J.D. Rainfall occurrence in the U.S. warm season: The Diurnal Cycle. J. Clim. 2008, 21, 4132–4146. [Google Scholar] [CrossRef]
- Tong, J.; Wei, L.X.; Ye, J.Y.; Zhou, K.; Yuan, S. Spatial-temporal distribution characteristics of short-time strong precipitation in the flood season under different terrains over Anhui province. J. Meteorol. Environ. 2017, 33, 42–48. [Google Scholar]
- Yang, X.L.; Sun, J.H. Organizational modes of severe wind-producing convective systems over North China. Adv. Atmos. Sci. 2018, 35, 540–549. [Google Scholar] [CrossRef]
- Doswell, C.A.; Brooks, H.E.; Kay, M.P. Climatological estimates of daily local nontornadic severe thunderstorm probability for the United States. Weather Forecast. 2005, 20, 577–595. [Google Scholar] [CrossRef] [Green Version]
- Egger, J. Valley winds and the diurnal circulation over plateaus. Mon. Weather Rev. 1987, 115, 2177–2186. [Google Scholar] [CrossRef] [Green Version]
- Yang, K.; Koike, T.; Fujii, H.; Tamura, T.; Xu, X.; Bian, L.; Zhou, M. The daytime evolution of the atmospheric boundary layer and convection over the Tibetan Plateau: Observations and simulations. J. Meteor. Soc. Jpn. 2004, 82, 1777–1792. [Google Scholar] [CrossRef] [Green Version]
- Bhatt, B.C.; Nakamura, K. A climatological-dynamical analysis associated with precipitation around the southern part of the Himalayas. J. Geophys. Res. 2006, 111, D02115. [Google Scholar] [CrossRef]
- Liu, X.; Bai, A.; Liu, C. Diurnal variations of summertime precipitation over the Tibetan Plateau in relation to orographically-induced regional circulations. Environ. Res. Lett. 2009, 4, 045203. [Google Scholar] [CrossRef]
- Szoke, E.J.; Weisman, M.L.; Brown, J.M.; Caracena, F.; Schlatter, T.W. A subsynoptic analysis of the Denver tornadoes of 3 June 1981. Mon. Weather Rev. 1984, 112, 790–808. [Google Scholar] [CrossRef] [Green Version]
- Tucker, D.F.; Crook, N.A. Flow over heated terrain. Part II: Generation of convective precipitation. Mon. Weather Rev. 2005, 133, 2565–2582. [Google Scholar] [CrossRef] [Green Version]
- Daniel, K.; Bianca, A.; Norbert, K.; Christian, B.; Stefano, S. Moist Orographic convection: Physical mechanisms and links to surface-exchange processes. Atmosphere 2018, 9, 80. [Google Scholar]
- Johnson, R.H.; Mapes, B.E. Mesoscale processes and severe convective weather. In Severe Convective Storms; American Meteorological Society: Boston, MA, USA, 2001; pp. 71–122. [Google Scholar]
- Grossman, R.L.; Durran, D.R. Interaction of low-level flow with the western Ghat Mountains and offshore convection in the summer monsoon. Mon. Weather Rev. 1984, 112, 652–672. [Google Scholar] [CrossRef] [Green Version]
- Houze, R.A., Jr.; James, C.N.; Medina, S. Radar observations of precipitation and airflow on the Mediterranean side of the Alps: Autumn 1998 and 1999. Q. J. R. Meteorol. Soc. 2001, 127, 2537–2558. [Google Scholar] [CrossRef]
- Davolio, S.; Volonté, A.; Manzato, A.; Pucillo, A.; Sicogna, A.; Ferrario, M.E. Mechanisms producing different precipitation patterns over north-eastern Italy: Insights from HyMeX-SOP1 and previous events. Q. J. R. Meteorol. Soc. 2016, 142, 188–205. [Google Scholar] [CrossRef] [Green Version]
- Houze, R.A. Orographic effects on precipitating clouds. Rev. Geophys. 2012, 50, RG1001. [Google Scholar] [CrossRef]
- Tian, W.S.; Parker, D.J. A modeling study and scaling analysis of orographic effects on boundary layer shallow convection. J. Atmos. Sci. 2003, 60, 1981–1991. [Google Scholar] [CrossRef]


| Year | 2014 | 2015 | 2016 | 2017 | 2018 | Total | Annual Mean |
|---|---|---|---|---|---|---|---|
| LCDM | 22 | 36 | 38 | 49 | 50 | 195 | 39 |
| Out-Type | 3 | 4 | 3 | 4 | 6 | 20 | 4 |
| NoOut-Type | 19 | 32 | 35 | 45 | 44 | 175 | 36 |
Publisher’s Note: MDPI stays neutral with regard to jurisdictional claims in published maps and institutional affiliations. |
© 2020 by the authors. Licensee MDPI, Basel, Switzerland. This article is an open access article distributed under the terms and conditions of the Creative Commons Attribution (CC BY) license (http://creativecommons.org/licenses/by/4.0/).
Share and Cite
Zheng, L.; Sun, J.; Qiu, X.; Yang, Z. Five-Year Climatology of Local Convections in the Dabie Mountains. Atmosphere 2020, 11, 1246. https://doi.org/10.3390/atmos11111246
Zheng L, Sun J, Qiu X, Yang Z. Five-Year Climatology of Local Convections in the Dabie Mountains. Atmosphere. 2020; 11(11):1246. https://doi.org/10.3390/atmos11111246
Chicago/Turabian StyleZheng, Linlin, Jianhua Sun, Xuexing Qiu, and Zuxiang Yang. 2020. "Five-Year Climatology of Local Convections in the Dabie Mountains" Atmosphere 11, no. 11: 1246. https://doi.org/10.3390/atmos11111246
APA StyleZheng, L., Sun, J., Qiu, X., & Yang, Z. (2020). Five-Year Climatology of Local Convections in the Dabie Mountains. Atmosphere, 11(11), 1246. https://doi.org/10.3390/atmos11111246