Assessment of Vulnerability to Drought Disaster in Agricultural Reservoirs in South Korea


1
Department of Bioresources and Rural Systems Engineering, Hankyong National University, Anseong 17579, Korea
2
School of Social Safety and Systems Engineering, Hankyong National University, Anseong 17579, Korea
3
Institute of Agricultural Environmental Science, Hankyong National University, Anseong 17579, Korea
4
National Agricultural Water Research Center, Hankyong National University, Anseong 17579, Korea
5
Department of Convergence of Information and Communication Engineering, Hankyong National University, Anseong 17579, Korea
6
Department of Bioproducts and Biosystems Engineering, University of Minnesota, St. Paul, MN 55108, USA
*
Authors to whom correspondence should be addressed.
Atmosphere 2020, 11(11), 1244; https://doi.org/10.3390/atmos11111244
Submission received: 10 October 2020
/
Revised: 12 November 2020
/
Accepted: 16 November 2020
/
Published: 18 November 2020
(This article belongs to the Special Issue Meteorological Extremes in Korea: Prediction, Assessment, and Impact)
Abstract
:Drought is a natural disaster affecting agriculture worldwide. Drought mitigation and proactive response require a comprehensive vulnerability mapping approach considering various factors. This study investigates the vulnerability to agricultural drought in South Korea based on exposure, sensitivity, and adaptability. The evaluation of agricultural drought factors yielded 14 items, which are categorized into meteorological, agricultural reservoir, social, and adaptability factors. Each item is assigned a weight using the analytical hierarchy process (AHP). We analyzed vulnerability to drought disaster in agricultural reservoirs, and generated vulnerability maps by applying the vulnerability framework for climate change. The generated map was divided into four categories based on drought vulnerability: A (Very high), B (High), C (Moderate), and D (Low). The weights for the meteorological (0.498), agricultural reservoir (0.286), social (0.166), and adaptability (0.05) factors were obtained using AHP. The rating frequencies were 41.91%, 19.76%, 9.58%, and 5.39% for A, B, C, and D, respectively. The western region is extremely vulnerable to meteorological and agricultural reservoir factors, whereas the eastern region is more vulnerable to adaptability. The results of this study visually represent agricultural drought and can be used for evaluating regional drought vulnerability for assisting preemptive drought responses to identify and support drought-prone areas.
1. Introduction
Precipitation patterns are expected to change worldwide due to climate change, and the magnitude and frequency of droughts have been increasing due to the lack of precipitation [1]. Drought is a globally damaging disaster that has economic and social effects, and is classified into four main types according to duration, scope, and frequency [2,3,4]. Droughts are commonly classified as meteorological, hydrological, agricultural, and socio-economic types. Agricultural drought is defined as the occurrence of damage to crops due to the lack of soil moisture and agricultural reservoir water, directly affecting crop growth and yield [5,6,7]. According to a recent drought-related study, the intensity and frequency of droughts are expected to increase due to climate change [8,9,10].
In the past, drought has been evaluated using a single indicator, such as the local drought index and damaged area [11]. However, procedures such as vulnerability mapping and evaluation that comprehensively evaluate various indicators are essential to prevent, mitigate, and prepare for long-term and frequent droughts due to climate change [12,13,14,15]. The concept of vulnerability generally refers to the degree of potential damage to the internal state of a system caused by external influences in fields such as food security, natural disasters, and disaster management [16,17]. Vulnerability is also defined as the extent to which the environment and social system are exposed to the adverse effects of climate change and is derived through the relationship between exposure, sensitivity, and adaptability functions [18,19]. From an agricultural perspective, vulnerability assessment is a potentially useful tool for proactive drought response. The severity of agricultural drought varies across regions; hence, it is necessary to evaluate vulnerability by analyzing the reasons for agricultural drought according to the meteorological and topographic characteristics of each region through vulnerability assessment [20,21,22,23]. Gentillucci et al. [24] analyzed the impact of climate change on water resources. A complex region of Italy was selected. Precipitation and temperature, which have a significant effect on drought, were evaluated spatiotemporally through six topographic variables, and expressed through GIS. Kang and Sridhar [25] evaluated the severity and intensity of future droughts based on precipitation, temperature, hydrological models, and various drought indices. Hoque et al. [26] proposed a spatial multi-criteria approach through vulnerability mapping in northwestern Bangladesh to establish a drought mitigation strategy. They observed that the strategy was effective for mapping drought vulnerability. Mohmmed et al. [27] studied drought vulnerability in five agricultural areas of Sudan. In addition, they evaluated various components of the vulnerability index among the communities in the study area. Murthy et al. [28] generated a detailed vulnerability map and mitigation measures to minimize the loss from droughts. Moneo [29], evaluated the vulnerability components by developing an adaptability index for evaluating agricultural drought vulnerability through coping and response capabilities, such as regional characteristics, environment, and economic system. In addition, several studies have been conducted on drought vulnerability mapping—for example, studies on drought vulnerability considering a single factor [13,30] and on vulnerability assessment through spatial analysis using remote-sensing tools [28,31]. However, no studies have investigated agricultural droughts in a comprehensive and reliable manner by selecting various factors and objective criteria. Vulnerability derived through evaluation is more reliable when a weight system is established for each item. In this study, the weights of evaluation items were calculated using the analytical hierarchy process (AHP) to formulate an objective criterion for evaluating vulnerability to agricultural drought.
South Korea has approximately 18,000 agricultural reservoirs, which should be considered when evaluating vulnerability to agricultural drought. Such an investigation needs to consider not only agricultural reservoirs but also meteorological and environmental impacts. This study was conducted on 3500 government-managed agricultural reservoirs out of about 18,000 agricultural reservoirs in South Korea. The study presents vulnerability assessment criteria for 167 cities and counties in eight provinces of South Korea. The past statistical drought events are analyzed and objective evaluation items are selected using previous studies. Evaluation items are pre-processed by applying weights calculated through standardization and AHP, and appropriate grades are set for drought-vulnerable stages by region. This study aims to present appropriate evaluation items for agricultural drought vulnerability maps. It also aims to analyze vulnerable areas in South Korea and create agricultural drought vulnerability maps through objective evaluation methods.
2. Study Area
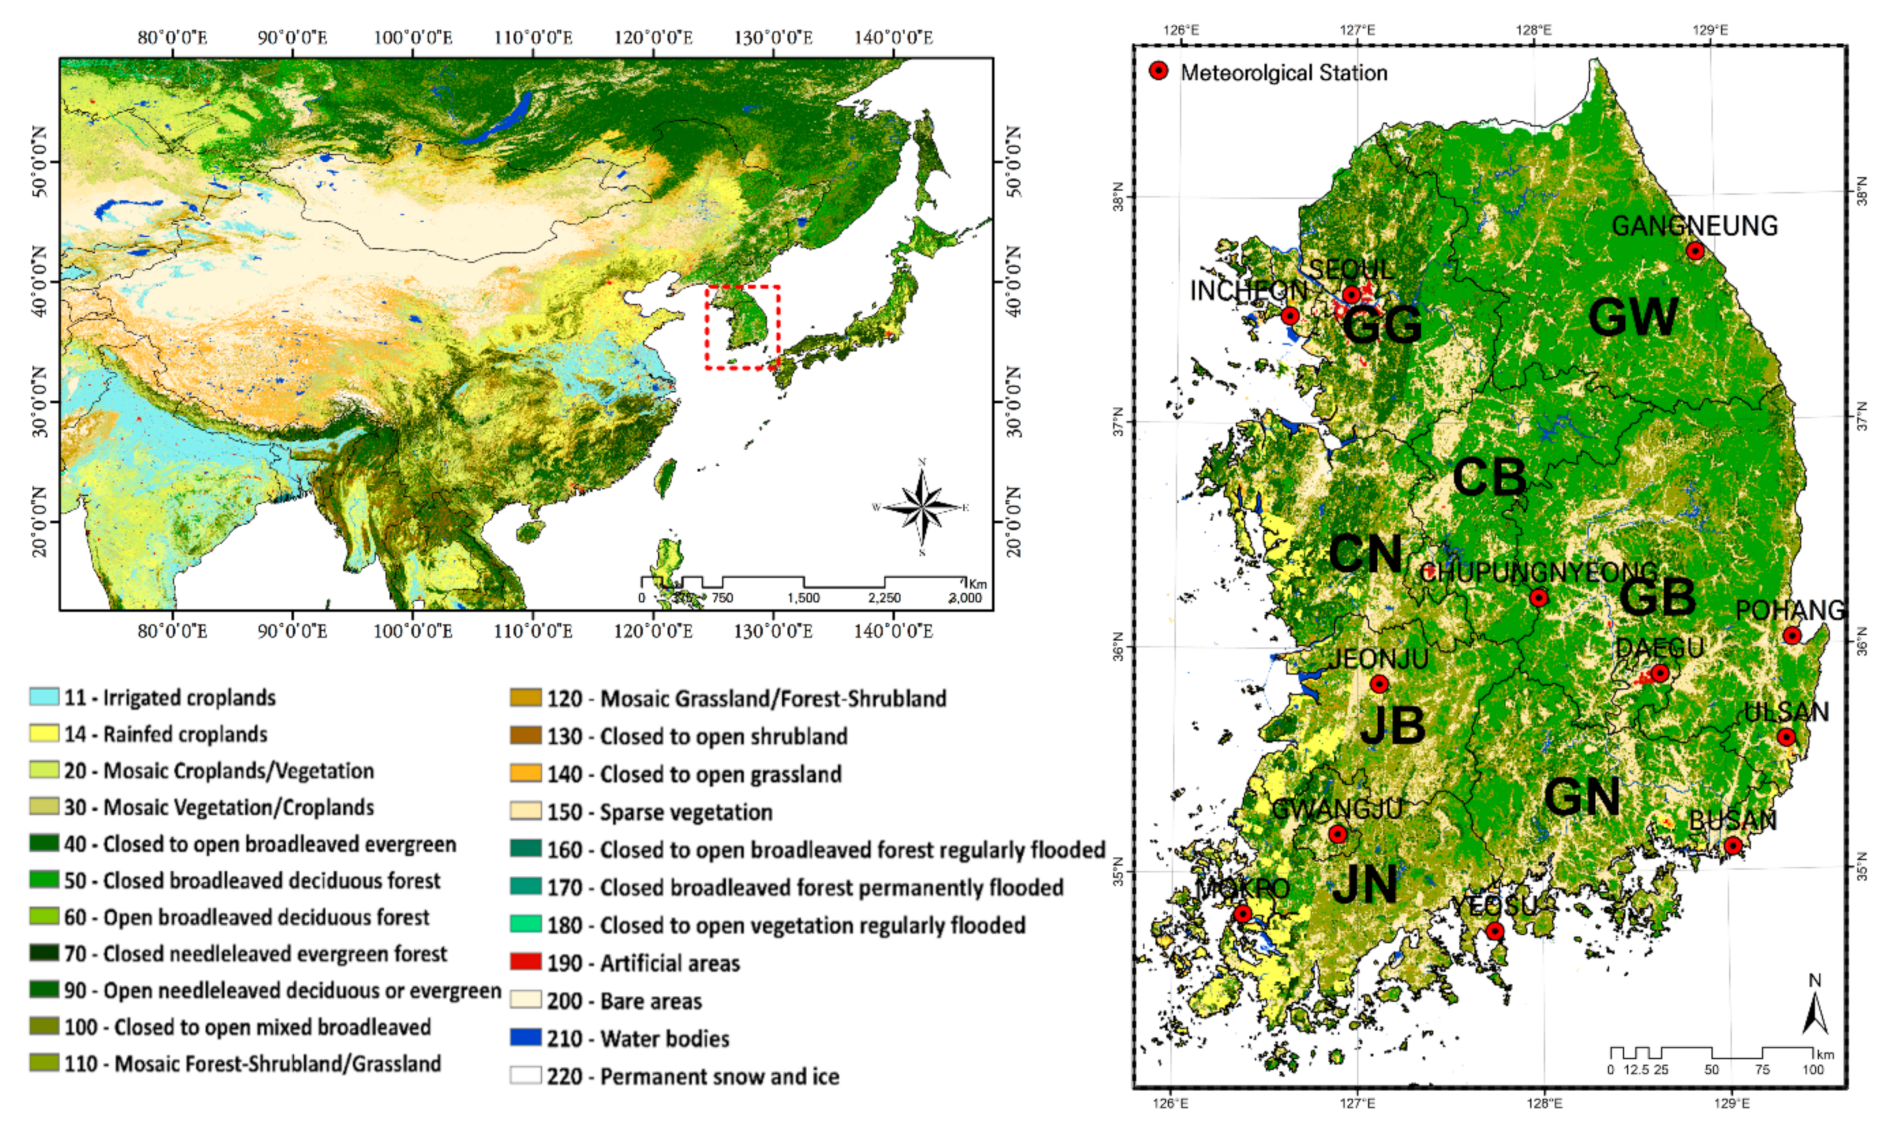
South Korea is a country in East Asia, constituting the southern part of the Korean Peninsula and sharing a land border with North Korea. It lies between 34°18′ N and 37°22′ N and 124°19′ E and 130°52′ E [32]. Due to climate change and abnormal climate, natural disasters occur frequently in East Asia, and disasters such as drought are increasing in South Korea than in the past. A high temperature phenomenon occurs the worst drought in 104 years, and drought occurred nationwide in 2012, and regional drought occurred in the southern region in 2013. The precipitation in the central region of South Korea was 46% of the mean historical rainfall record, resulting in a severe drought in 2015. In addition, there was a serious shortage of precipitation nationwide, and 2822 (ha) of drought damage to agricultural paddy fields occurred. Since then, continuous drought has occurred every year, causing socioeconomic damage and damage to crops, and drought countermeasure committees and countermeasures have been promoted [33]. South Korea’s agriculture is mostly conducted in summer, and water supply and precipitation are concentrated in the summer. Figure 1 and Figure 2 show the locations of meteorological stations and land cover map (Ministry of Environment), and the spatial distribution map of annual average precipitation and annual average temperature from 1981 to 2018.
Korea’s climate is an annual mean temperature of 12.3 °C and a range of annual average temperatures from 6.6 °C (winter) to 16.6 °C (summer). Climatologically, the annual maximum precipitation is usually recorded during the summer rainy season, from late June through July. Many parts of South Korea receive between 1200 mm to 1400 mm, which is slightly above the worldwide average. The annual mean precipitation is approximately 1300 mm. The middle and southwest regions are major agricultural areas. Agricultural water withdrawal constitutes approximately 47% of the total water use in South Korea, and is mostly utilized for paddy irrigation. This study was conducted in 167 si/guns (i.e., cities/rural areas, respectively) across South Korea. It is intended to consider measures tailored to each region through the assessment of vulnerability to agricultural drought based on agricultural reservoirs.
3. Data and Methodology
In South Korea, drought is generally assessed through the drought index of SPI (standardized precipitation index). SPI is a drought index that analyzes the lack and excess of precipitation based on precipitation, and can flexibly evaluate drought according to the time unit. This drought index has the disadvantage of evaluating drought through single or few indicators, such as precipitation. This study comprehensively evaluates agricultural drought by constructing various evaluation factor for each region through vulnerability evaluation.
The factors for the assessment of climate change vulnerability are classified as exposure, sensitivity, and adaptive capacity in IPCC reports [34]. Exposure is an indicator of the likelihood of occurrence of an event in a vulnerability assessment and of the frequency and severity of climate change. Sensitivity indicates the influence on society and the environment in the event of an abnormal disaster, such as drought. Exposure and sensitivity negatively affect drought vulnerability. In contrast, adaptive capacity, which is a measure of the response to the effects of drought, positively affects drought vulnerability [35]. In this study, the evaluation items of vulnerability to agricultural drought were classified into positive and negative types and the items relevant for evaluating exposure, sensitivity, and adaptive capacity in the existing vulnerability assessment for climate change were selected.
3.1. Meteorological Data
Meteorological data are items related to exposure in the assessment of climate change vulnerability. For example, the lack of precipitation causes drought. Therefore, they are an important parameter when evaluating vulnerability to agricultural drought. Meteorological data, such as precipitation and temperature, can be used as criteria for determining vulnerability to agricultural drought. These data comprise the monthly precipitation (MD01), the number of days without precipitation (MD02), and the number of days having a high temperature over 33 °C (MD03) (Table 1). South Korea’s heatwave advisory defines a daily maximum temperature of 33 °C or higher [36]. The average annual precipitation in South Korea is 1200–1500 mm, with intensive precipitation from June to August. Weather data were collected through the Automated Synoptic Observing System operated by the Korea Meteorological Administration.
3.2. Agricultural Reservoir Data
Agricultural reservoir data are items related to exposure—such as meteorological data—that were selected considering various aspects of South Korean agricultural reservoirs. They are another important factor for assessing vulnerability because they directly affect agricultural drought. The lower the water level of the reservoir, the more vulnerable it is to drought. In this study, the agricultural reservoir data comprise the number of days in which the water reserve rate was below the drought warning level of interest (agricultural reservoir data: RD01), end-of-month water reserve ratio (RD02), reservoir water level reduction ratio (RD03), watershed ratio (RD04), effective storage reserve per unit area (RD05), and irrigated paddy field (RD06) (Table 2). The detailed items were obtained through the Rural Agricultural Water Resource Information System of the Korea Rural Community Corporation and Korean Statistical Information Service.
3.3. Social Data
Social data are items related to sensitivity in the vulnerability assessment. They are factors that can determine the severity of damage caused by an agricultural drought. These data comprise the agricultural population ratio (social data: SD01), rice paddy ratio (SD02), and paddy water dry area (SD03) (Table 3). If the values of SD01, SD02, and SD03 for a region are higher than the national averages, the region is vulnerable to agricultural drought.
3.4. Adaptability Data
Adaptability data are items relevant to the response to an agricultural drought. Meteorological items, agricultural reservoir items, and social items have a negative effect on drought vulnerability, whereas adaptability items have a positive effect. These data comprise the number of auxiliary facilities that can supply water, apart from agricultural reservoirs, and thus, assistance waterworks (adaptability data: AD01) and pumped storage (AD02) were selected (Table 4).
3.5. Vulnerability Assessment Method
In this study, the vulnerability to agricultural drought was evaluated through items that could replace exposure, sensitivity, and adaptive capacity. Based on meteorological and hydrological data, such as agricultural reservoir and precipitation data, 167 si/guns were evaluated as agricultural drought vulnerability areas, and data from 2015 to 2018 were obtained. Evaluation items with different dimensions require the integration of units and properties, and accordingly, standardization was used as a pretreatment process. Standardization is done by applying a re-scaling that incorporates values between 0 and 1. The re-scaling method is based on the scope of the indicator and can have the same scope between indicator. In addition, it has the advantage in that the vulnerability score can be easily calculated by converting units of various distributions non-dimensionally [37]. Re-scaling can be performed through Equation (1) by using the maximum and minimum values for each item.
The adequacy of the assessment items of vulnerability to agricultural drought and the weight for each item were calculated through a survey and AHP. AHP is a decision-making method that systematically evaluates alternatives to derive priorities and importance when evaluation criteria are numerous and complex [38]. The various evaluation elements constituting the problem are layered, and the weights for each element are derived through a pairwise comparison of the elements for each layer (Equation (2)). AHP proceeds in stages, first defining the concept of decision making and setting alternatives. The comparison of different alternatives establishes the criteria that can represent each characteristic and effect well, and derives the importance of the optimum through evaluation [39]. In this study, AHP was used to assign weights to the assessment items for agricultural drought vulnerability, and a questionnaire was administered to 44 experts in academia and practice [40,41,42].
The assessment of vulnerability to agricultural drought by region is shown in Equation (3) by combining the weights of the items through standardization. In addition, the results of the regions in the vulnerability assessment can be classified into grades A (Very high), B (High), C (Moderate), and D (Low) through the equal interval method. The closer the region is to grade A, the safer it is against agricultural drought, and conversely, the closer it is to grade D, the greater is its vulnerability to agricultural drought.
where meteorological data (MD), agricultural reservoir data (RD), and social data (SD) are items that increase the vulnerability to agricultural drought, and adaptability data (AD) can compensate for the vulnerability. W represents the weight of each item.
4. Results and Discussion
4.1. Standardization and AHP Weight
In this study, agricultural drought vulnerability was evaluated in 167 si/guns in South Korea, and island regions that are greatly affected by climate were excluded. The items selected for the assessment of vulnerability to paddy agricultural drought were three meteorological items, six agricultural reservoir items, three social items, and two adaptability items from 2015 to 2018. The items with different units were re-scaled from zero to one by calculating the maximum and minimum values (Figure 3). SD03 and AD02 showed extreme results, but the other items showed various distributions. The results obtained through standardization were classified into grades A, B, C, and D based on the quartile for each item, and scored as 100, 80, 60, and 40, respectively [27]. The closer the score is to 100, the safer the area is against drought, and the closer the score is to 40, the greater is the vulnerability of the area to agricultural drought. Areas without reservoirs and areas with paddy fields less than 0.3 ha were excluded from the evaluation.
AHP analysis was performed through a survey of agricultural drought and agricultural reservoir experts. First, a hierarchical structure was formed by dividing four major categories and 14 detailed items, and a comparison matrix of Equation (2) was created. Based on the pairwise comparison data, the weights of the middle classification and detailed items were calculated, and the priority was identified through the scores for each evaluation item (Table 5). The weights are in the order of meteorological data (49%), agricultural reservoirs (28%), social items (17%), and adaptability (5%). The meteorological section had the highest weight, and the adaptability section had a slightly lower weight in the assessment of vulnerability to agricultural drought. As for the weight of the detailed items, MD01 was the highest at 54% in the meteorological item, and MD02 (35%) and MD03 (11%) values were shown. There are six detailed items of the agricultural reservoir, the weight of which was the highest as RD01 (32%), and the importance of RD06 (6%) was somewhat low. The importance of detailed items of social data was similar in three factors, SD01 (22%), SD02 (42%), and SD03 (36%), respectively. Adaptability data were AD01 (79%) and AD02 (21%), showing differences between the two factors. In this way, the weight of all items have been calculated, and items to be focused on can be identified when evaluating agricultural drought vulnerability.
4.2. Region-Based Agricultural Drought Vulnerability Assessment
The meteorological, agricultural reservoir, social, and adaptability data were considered based on existing climate change vulnerabilities to evaluate the vulnerability to agricultural drought in South Korea. Areas vulnerable to agricultural drought were mapped for each item by calculating the weight derived using the AHP method and the standardized results for each item (Figure 3). The null values of (B) and (C), which are areas without values, were not indicated on the spatial map. The agricultural drought vulnerability result values were based on Equation (3), and first, standardized items were graded through the quartile range. Meteorological data, agricultural reservoirs, and social data indicate negative effects on agricultural drought, and opposite values are expressed through inverse numbers. Adaptability data were classified as a positive influence. Finally, the agricultural drought vulnerability by year and item was expressed using Equation (3).
Meteorological data were assigned the highest weight of 0.498 through the AHP method, and vulnerability was evaluated through three items: MD01, MD02, and MD03. On the spatial map, the vulnerability of meteorological data (Figure 4A) was observed to be the highest for Chungcheongnam (CN) compared with that for the other regions. The proportion of adaptability vulnerability (D) is higher in the CN area, and the proportion of social vulnerability (C) is higher in the central area than in the northern and southern areas. The quantitative values are listed in Table 6. The national average vulnerability value of meteorological data is 69.19. The value for CN is 57.96, which is much lower than the aforementioned national average. Chungcheongbuk (CB) and Jeollanam (JB) show the next lowest values. In contrast, Gyeongnam (GN) and Jeollanam (JN) appear to be meteorologically safe. CN, CB, and JB, which have a high ratio of C and D, need to respond to vulnerabilities by considering responses to precipitation and high temperatures.
Agricultural reservoir data are an essential factor for supplying the water required for paddy fields when evaluating vulnerability to agricultural drought. These data were assigned a weight of 0.286 through the AHP method. The sub-elements of agricultural reservoir data were evaluated in six categories: RD01, RD02, RD03, RD04, RD05, and RD06. The results of the vulnerability assessment are shown in Figure 4B, and areas without agricultural reservoirs were excluded from the evaluation. Typically, there are no agricultural reservoirs in the GG and GW regions, and the vulnerability to agricultural reservoirs was evaluated in 132 si/guns. In the agricultural reservoir vulnerability map, the western regions are more vulnerable than the eastern regions. Among them, CN is the most vulnerable region. The national average vulnerability value of agricultural reservoir data is 75.26, and CN shows the lowest value at 69.27. JN (71.76) is the second most vulnerable area, and GW (82.12) is the safest area. Areas with weak agricultural reservoir supply capacity require improvements in auxiliary water source facilities and water resource management technologies.
Social data include the proportion of the population and farmland affected by the environment. They indicate the amount of damage caused by a drought. Accordingly, the ratio of agricultural population, the ratio of agricultural paddy, and the dry area of paddy fields (SD01, SD02, SD03) were evaluated. In the case of GG and GW, areas where the proportion of agricultural paddy is 0.3% or less were excluded, and consequently, GG and GW are safer than the other areas. Overall, the southern region is more socially and environmentally vulnerable than the northern region. The national average vulnerability value of social data is 80.57. The corresponding values for CN, JB, and JN are 71.50, 72.35, and 72.41, respectively. The most socially safe areas are GG, GW, and CB, with the values of 89.31, 88.86, and 86.83, respectively. Socially vulnerable areas need to formulate measures to improve their response to vulnerability through the introduction and training of management personnel.
Adaptability data correspond to adaptive capacity when evaluating existing climate change vulnerabilities. The meteorological, agricultural reservoir, and social data items increase the vulnerability to agricultural drought, whereas the adaptability data items can respond to agricultural vulnerability. The AHP analysis assigned a low weight of 0.05 to these items. This result shows that the importance of a supplementary supply of agricultural reservoirs in South Korea is low. AD01 and AD02 are included as details. In Figure 4D, regions with weak adaptability appear nationwide, but GW and GG are the most vulnerable regions. It is difficult to evaluate data in relation to reservoirs and rice paddies. The national average vulnerability value of adaptability data is 59.27. The values for GW and GG are 46.43 and 49.33, respectively, which are lower than the aforementioned national average. CN, the most vulnerable area in the other categories, is the safest area in this aspect with an adaptability value of 69.19.
4.3. Mapping of Agricultural Drought Vulnerabilities
The vulnerable areas were analyzed by evaluating the vulnerability of the meteorological, agricultural reservoir, social, and adaptability factors. Through the integration of vulnerability of each item, the weights obtained from the AHP analysis were applied to create a map of vulnerability to agricultural drought in South Korea. Figure 4 shows the map of vulnerability to agricultural drought by year from 2015 to 2018 and a map of vulnerability to agricultural drought in South Korea based on all the factors and weights. The frequency of D in CN and GB was high in 2015, 2016, and 2017. CN was the most vulnerable area. Moreover, in 2018, the frequency of D was the lowest, with most regions being safe against agricultural drought. As a result of the analysis of spatial maps by year, compared with other years, 2015 was the most vulnerable in the central region. The proportion of the blank areas in this region, which are areas that were not evaluated nationwide, was 2.34% (Table 7). The ratio of D in 2015 nationally was 18.56%, and that of A was 24.55%. In 2016 and 2017, the proportions of D were 8.98% and 5.99%, respectively, which were lower than that in 2015. On the other hand, there were no D grades in 2018, and the proportion of A was 53.29%; this was the safest year against agricultural drought. The map of vulnerability to agricultural drought was plotted and analyzed from 2015 to 2018. Consequently, it was observed that the most vulnerable year was 2015, and the safest year was 2018. The proportion of D was the largest in CN, and GB was also vulnerable. If the vulnerability assessment is carried out by year, areas susceptible to agricultural drought every year can be estimated.
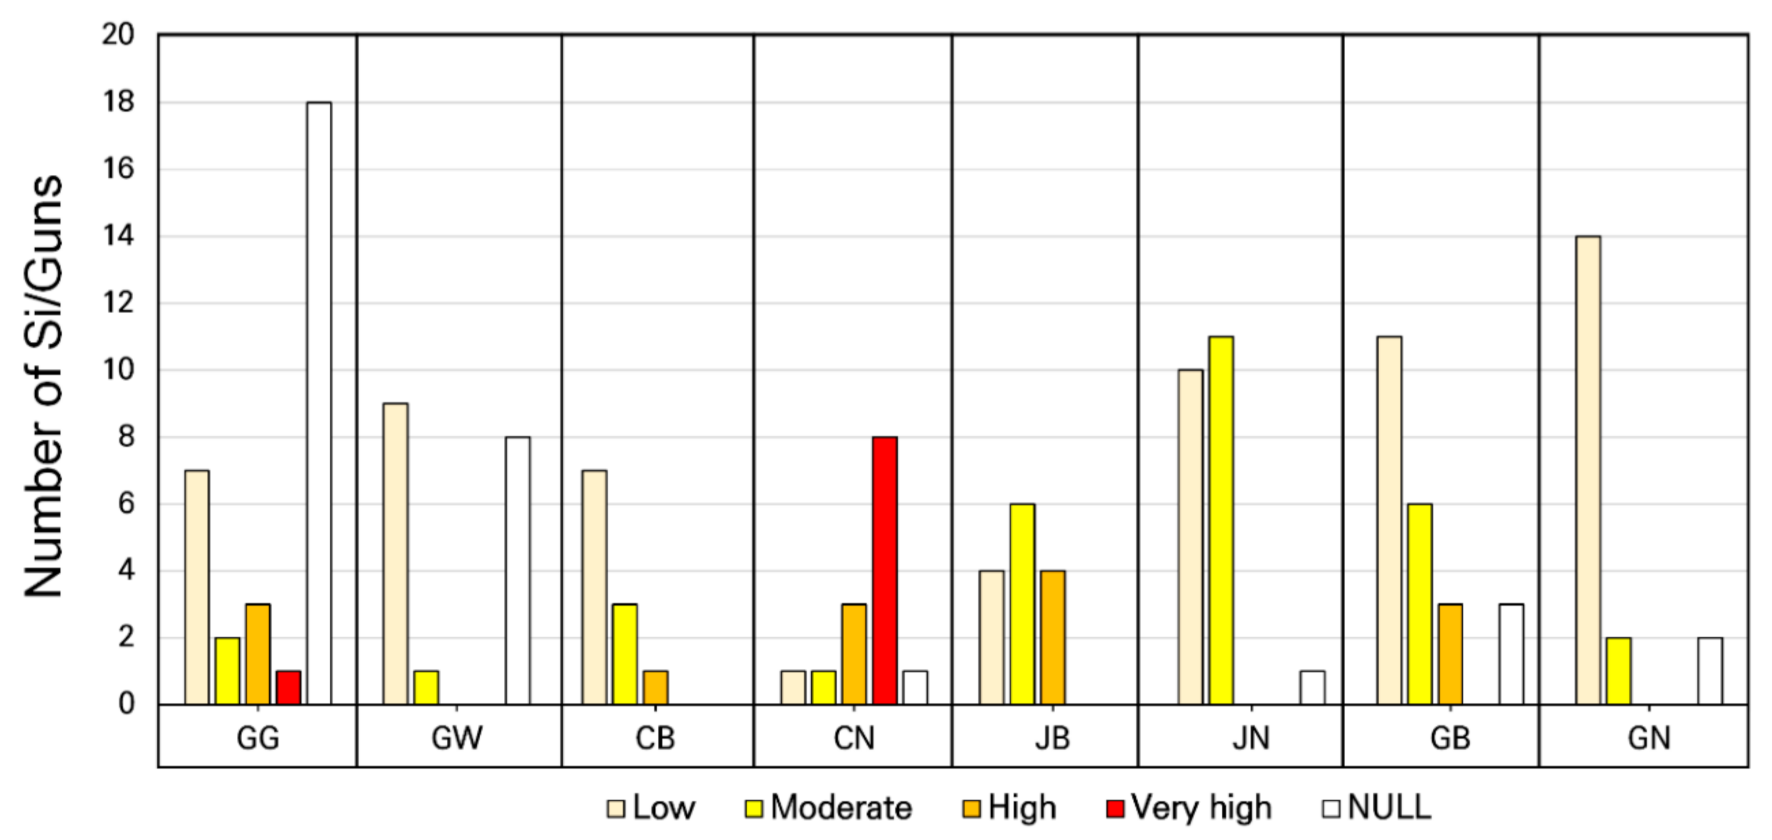
The meteorological, agricultural reservoir, social, and adaptability factors were combined from 2015 to 2018 to plot the map of vulnerability to agricultural drought. Figure 5 shows a map of vulnerability to agricultural drought in South Korea. Figure 6 shows the number of A, B, C, and D grades by si/guns in South Korea to evaluate the regions that are most vulnerable to agricultural drought and the ones that are safe. CN was the most vulnerable region, and the other vulnerable areas were identified as GB and JB. The total agricultural drought vulnerability areas of South Korea were classified as A (41.91%), B (19.76%), C (9.58%), D (5.39%), and blank (2.34%) (Table 7). According to the frequency evaluation by si/guns, the regions with the highest blank ratios were GG and GW, and these ratios were low in all the regions except CB. The area most vulnerable to agricultural drought was CN, with the highest percentage of D grades. JB, GB, and GG are considered vulnerable because of the high percentage of C. The safest area against agricultural drought was GN, with the highest percentage of A. JN and GW are also considered safe areas with a ratio of C to D of zero. In this study, a map of vulnerability to agricultural drought was prepared, and the vulnerable areas were analyzed based on the map. Consequently, CN was analyzed the most vulnerable area. In the CN region, eight of the 13 regions were found to be the most vulnerable through a drought vulnerability assessment. The total cultivated paddy rice area in the CN region, was 146 103ha, accounting for around 17.6% of the total agricultural area in South Korea. In the meteorological category, the amount of precipitation during irrigation was lower than in other regions and the number of consecutive heatwaves was higher. In the category of reservoir and society, the water level in the reservoir was somewhat lower, and the agricultural population and paddy area were slightly higher, indicating vulnerability. The auxiliary water supply was high, but if all factors were comprehensively evaluated, the CN area was analyzed to be a vulnerable area. CN is necessary to undertake measures preemptively to respond to agricultural drought in this area.
5. Conclusions
In this study, a map of regions vulnerable to agricultural drought was prepared for si/guns in South Korea for undertaking preemptive agricultural drought responses. The results of previous studies were employed to evaluate the vulnerability to agricultural drought, and detailed evaluation items were selected: three meteorological data, six agricultural reservoir data, three social data, and two adaptability data. These 14 factors were standardized through re-scaling, and the weights for each factor were calculated using the AHP method. The grades were divided into A, B, C, and D through quartiles, and the vulnerability to agricultural drought was assessed through the grade criteria. For the main and detailed items, positive and negative items were classified, and scores were assigned from 40 to 100 for the A, B, C and D grades. Vulnerability was evaluated by applying weights to the scores of each item. Through the AHP analysis, the weights were calculated as follows: meteorological data (0.498), agricultural reservoir data (0.286), social data (0.166), and adaptability data (0.05). A map of the evaluation factors was generated by applying weights to the values that had been pre-processed. CN was the most vulnerable area in terms of meteorological data vulnerability (57.96) and agricultural reservoir data vulnerability (69.27). The social data also showed that CN was the most vulnerable area (71.50). On the other hand, the adaptability data showed that GW (46.43) was the most vulnerable area. The results of the frequency according to the grade obtained through the map of vulnerability to agricultural drought prepared by year are 2015 D (18.56%), 2016 D (8.98%), 2017 D (5.99%), and 2018 D (0%). The year most vulnerable to agricultural drought was 2015. An analysis of the map of vulnerability to agricultural drought in South Korea showed that CN had the highest ratio of D, making it the most vulnerable area to agricultural drought. GN, JN, and GB are considered the safest regions owing to the high ratio of A and B.
In this article, evaluation items and methodologies were presented to analyze the vulnerability to agricultural drought, and the areas that should be considered to respond preemptively to drought were determined. However, the weight calculated through AHP analysis was relatively high for the meteorological effect. In the future, a more reliable method of calculating weights should be considered by using correction or various calculation methods, as well as AHP analysis. In addition, it is necessary to consider the accuracy of the study by establishing evaluation items for a long period of 30 years or more, not a short period. The results of this study can be used for drought response while analyzing vulnerable areas and proactively supporting them.
Author Contributions
Conceptualization, Y.-S.M., W.-H.N., and M.-G.J.; data curation, Y.-S.M., and N.-K.B.; funding acquisition, W.-H.N.; investigation, Y.-S.M.; methodology, Y.-S.M., W.-H.N., M.-G.J. and N.-K.B.; project administration, W.-H.N.; validation, W.-H.N., and T.K.; writing—original draft, Y.-S.M., and W.-H.N.; Writing—review & editing, W.-H.N., and T.K. All authors have read and agreed to the published version of the manuscript.
Funding
This research was supported by a grant (2019-MOIS31-010) from the Fundamental Technology Development Program for Extreme Disaster Response funded by the Korean Ministry of Interior and Safety (MOIS). The views expressed in this study are those of the authors and do not necessarily reflect the views of MOIS or any of its subagencies.
Conflicts of Interest
The authors declare no conflict of interest.
References
- Nam, W.H.; Choi, J.Y.; Hong, E.M. Irrigation vulnerability assessment on agricultural water supply risk for adaptive management of climate change in South Korea. Agric. Water Manag. 2015, 152, 173–187. [Google Scholar] [CrossRef]
- Wilhite, D.A.; Glantz, M.H. Understanding: The drought phenomenon: The role of definitions. Water Int. 1985, 10, 111–120. [Google Scholar] [CrossRef] [Green Version]
- Thomas, T.; Jaiswal, R.; Galkate, R.; Nayak, P.; Ghosh, N. Drought indicators-based integrated assessment of drought vulnerability: A case study of Bundelkhand droughts in central. India Nat. Hazards 2016, 81, 1627–1652. [Google Scholar] [CrossRef]
- Pei, W.; Fu, Q.; Liu, D.; Li, T.; Cheng, K.; Cui, S. A novel method for agricultural drought risk assessment. Water Resour. Manag. 2019, 33, 2033–2047. [Google Scholar] [CrossRef]
- Rosenberg, N.J. Drought in the great plains-Research on impact and strategies. In Proceedings of the Workshop on Research in Great Plains Drought Management Strategies, University of Nebraska, Lincoln, NE, USA, 26–28 March 1979. [Google Scholar]
- Nam, W.H.; Tadesse, T.; Wardlow, B.D.; Hayes, M.J.; Svoboda, M.D.; Hong, E.M.; Pachepsky, Y.; Jang, M.W. Developing the vegetation drought response index for South Korea (VegDRI-SKorea) to assess the vegetation condition during drought events. Int. J. Remote Sens. 2018, 39, 1548–1574. [Google Scholar] [CrossRef]
- Yoon, D.H.; Nam, W.H.; Lee, H.J.; Hong, E.M.; Feng, S.; Wardlow, B.D.; Tadesse, T.; Svoboda, M.D.; Hayes, M.J.; Kim, D.E. Agricultural drought assessment in East Asia using satellite-based indices. Remote Sens. 2020, 12, 444. [Google Scholar] [CrossRef] [Green Version]
- Murthy, C.; Laxman, B.; Sai, M.S. Geospatial analysis of agricultural drought vulnerability using a composite index based on exposure, sensitivity and adaptive capacity. Int. J. Disaster Risk Reduct. 2015, 12, 163–171. [Google Scholar] [CrossRef]
- Mohsenipour, M.; Shahid, S.; Chung, E.; Wang, X. Changing pattern of droughts during cropping seasons of Bangladesh. Water Resour. Manag. 2018, 32, 1555–1568. [Google Scholar] [CrossRef]
- Jiao, W.; Tian, C.; Chang, Q.; Novick, K.A.; Wang, L. A new multi-sensor integrated index for drought monitoring. Agric. Meteorol. 2019, 268, 74–85. [Google Scholar] [CrossRef] [Green Version]
- Tadesse, T.; Brown, J.F.; Hayes, M.J. A new approach for predicting drought-related vegetation stress: Integrating satellite, climate, and biophysical data over the U.S. central plains. ISPRS J. Photogramm. Remote Sens. 2005, 59, 244–253. [Google Scholar] [CrossRef]
- Hong, E.M.; Nam, W.H.; Choi, J.Y.; Pachepsky, Y.A. Projected irrigation requirements for upland crops using soil moisture model under climate change in South Korea. Agric. Water Manag. 2016, 165, 163–180. [Google Scholar] [CrossRef] [Green Version]
- Pei, W.; Fu, Q.; Liu, D.; Li, T.; Cheng, K.; Cui, S. Spatiotemporal analysis of the agricultural drought risk in Heilongjiang Province, China. Theor. Appl. Climatol. 2018, 133, 151–164. [Google Scholar] [CrossRef]
- Liu, X.; Guo, P.; Tan, Q.; Xin, J.; Li, Y.; Tang, Y. Drought risk evaluation model with interval number ranking and its application. Sci. Total Environ. 2019, 685, 1042–1057. [Google Scholar] [CrossRef] [PubMed]
- Nam, W.H.; Choi, J.Y. Development of an irrigation vulnerability assessment model in agricultural reservoirs utilizing probability theory and reliability analysis. Agric. Water Manag. 2014, 142, 115–126. [Google Scholar] [CrossRef]
- Intergovernmental Panel on Climate Change (IPCC). Climate Change 2001: The Scientific Basis. Contribution of Working Group I to the Third Report of the Intergovernmental Panel on Climate Change; Cambridge University Press: Cambridge, UK, 2001. [Google Scholar]
- Nam, W.H.; Kim, T.G.; Hong, E.M.; Choi, J.Y. Regional climate change impacts on irrigation vulnerable season shifts in agricultural water availability for South Korea. Water 2017, 9, 735. [Google Scholar] [CrossRef] [Green Version]
- Intergovernmental Panel on Climate Change (IPCC). Climate Change 2007: Impact Adaptation and Vulnerability, Contribution of Working Group II to The Third Assessment Report of the Intergovernmental Panel on Climate Change; Parry, M., Ed.; Cambridge University Press: Cambridge, UK, 2007. [Google Scholar]
- Nelson, D.R.; Adger, W.N.; Brown, K. Adaptation to environmental change: Contributions of a resilience framework. Annu. Rev. Environ. Resour. 2007, 32, 395–419. [Google Scholar] [CrossRef] [Green Version]
- Nam, W.H.; Hayes, M.J.; Svoboda, M.D.; Tadesse, T.; Wilhite, D.A. Drought hazard assessment in the context of climate change for South Korea. Agric. Water Manag. 2015, 160, 106–117. [Google Scholar] [CrossRef]
- Birkmann, J. Risk and vulnerability indicators at different scales: Applicability, usefulness and policy implications. Environ. Hazards 2007, 7, 20–31. [Google Scholar] [CrossRef]
- Carrao, H.; Naumann, G.; Barbosa, P. Mapping global patterns of drought risk: An empirical framework based on sub-national estimates of hazard, exposure and vulnerability. Glob. Env. Chang. 2016, 39, 108–124. [Google Scholar] [CrossRef]
- Sehgel, V.; Sridhar, V.; Tyagi, A. Stratified drought analysis using a stochastic ensemble of simulated and in-situ soil moisture observations. J. Hydrol. 2017, 545, 226–250. [Google Scholar] [CrossRef] [Green Version]
- Gentillucci, M.; Barbieri, M.; Burt, P. Climatic variations in Macerata Province (Central Italy). Water 2018, 10, 1104. [Google Scholar] [CrossRef] [Green Version]
- Kang, H.; Sridhar, V. Assessment of future drought conditions in the Chesapeake Bay watershed. J. Am. Water Resour. Assoc. 2018, 54, 160–183. [Google Scholar] [CrossRef]
- Hoque, M.A.; Pradhan, B.; Ahmed, N. Assessing drought vulnerability using geospatial techniques in northwestern part of Bangladesh. Sci. Total Environ. 2020, 705, 135957. [Google Scholar] [CrossRef] [PubMed]
- Mohmmed, A.; Li, J.; Elaru, J.; Elbashier, M.M.A.; Keesstra, S.; Artemi, C.; Martin, K.; Reubn, M.; Teffera, Z. Assessing drought vulnerability and adaption among farmers in Gadaref region, Eastern Sudan. Land Use Policy 2018, 70, 402–413. [Google Scholar] [CrossRef] [Green Version]
- Murthy, C.; Singh, J.; Kumar, P.; Sai, M.S. A composite index for drought hazard assessment using CPC rainfall time series data. Int. J. Environ. Sci. Technol. 2017, 14, 1981–1988. [Google Scholar]
- Moneo, M. Agricultural Vulnerability of Drought: A Comparative Study in Morocco and Spain. Master’s Thesis, CIHEAM Inter-National Agronomic Institute, Zaragoza, Spain, 2007. [Google Scholar]
- Zeng, Z.; Wu, W.; Li, Z.; Zhou, Y.; Guo, Y.; Huang, H. Agricultural drought risk assessment in Southwest China. Water 2019, 11, 1064. [Google Scholar] [CrossRef] [Green Version]
- Cheval, S.; Busuioc, A.; Dumitrescu, A.; Bîrsan, M.V. Spatiotemporal variability of meteorological drought in Romania using the standardized precipitation index (SPI). Clim. Res. 2014, 60, 235–248. [Google Scholar] [CrossRef]
- Park, S.Y.; Jeon, S.W.; Kim, S.Y.; Choi, C.U. Prediction and comparison of urban growth by land suitability index mapping using GIS and RS in South Korea. Landsc. Urban Plan. 2011, 99, 104–114. [Google Scholar] [CrossRef]
- Lee, E.G. Analysis of recent agricultural drought status and cases. Rural Resour. 2015, 57, 2–12. [Google Scholar]
- United Nations Development Programme (UNDP). Adaptation Policy Frameworks for Climate Change: Developing Strategies, Policies and Measures; Cambridge University Press: Cambridge, UK, 2005. [Google Scholar]
- Brown, J.R.; Kluck, D.; McNutt, C.; Hayes, M. Assessing drought vulnerability using a socioecological framework. Rangelands 2016, 38, 162–168. [Google Scholar] [CrossRef] [Green Version]
- Xu, Z.; FitzGerald, G.; Guo, Y.; Jalaludin, B.; Tong, S. Impact of heatwave on mortality under different heatwave definitions: A systematic review and meta-analysis. Environ. Int. 2016, 89–90, 193–203. [Google Scholar] [CrossRef] [PubMed]
- Hu, X.; Ren, H.; Tansy, K.; Zheng, Y.; Ghent, D.; Liu, X.; Yan, L. Agricultural drought monitoring using European Space Agency Sentinel 3A land surface temperature and normalized different vegetation index imageries. Agric. For. Meteorol. 2019, 279, 107707. [Google Scholar] [CrossRef]
- Saaty, T.L. The Analytic Hierarchy Process; McGraw-Hill: New York, NY, USA, 1980. [Google Scholar]
- Lyu, H.M.; Shen, S.L.; Zhou, A.N.; Zhou, W.H. Flood risk assessment of metro systems in a subsiding environment using the interval FAHP-FCA Approach. Sustain. Cities Soc. 2019, 50, 101682. [Google Scholar] [CrossRef]
- Machiwal, D.; Jha, M.K.; Mal, B.C. Assessment of groundwater potential in a semi- arid region of India using remote sensing, GIS and MCDM techniques. Water Resour. Manag. 2011, 25, 1359–1386. [Google Scholar] [CrossRef]
- Jasrotia, A.S.; Kumar, A.; Singh, R. Integrated remote sensing and GIS approach for delineation of groundwater potential zones using aquifer parameters in Devak and Rui watershed of Jammu and Kashmir. India. Arab J. Geosci. 2016, 9, 1–15. [Google Scholar] [CrossRef]
- Maheswaran, G.; Selvarani, A.G.; Elangovan, K. Groundwater resource exploration in Salem district, Tamil Nadu using GIS and remote sensing. J. Earth Syst. Sci. 2016, 125, 311–328. [Google Scholar] [CrossRef]
Figure 1.
Location of South Korea on the eastern edge of the Asian continent (GG: Gyeonggi, GW: Gangwon, CN: Chungcheongnam, CB: Chungcheongbuk, JN: Jeollanam, JB: Jeollabuk, GN: Gyeongnam, GB: Gyeongbuk).
Figure 1.
Location of South Korea on the eastern edge of the Asian continent (GG: Gyeonggi, GW: Gangwon, CN: Chungcheongnam, CB: Chungcheongbuk, JN: Jeollanam, JB: Jeollabuk, GN: Gyeongnam, GB: Gyeongbuk).

Figure 2.
Locations of meteorological stations and land cover map (Ministry of Environment), and spatial distribution map of annual average precipitation and annual average temperature from 1981 to 2018.
Figure 2.
Locations of meteorological stations and land cover map (Ministry of Environment), and spatial distribution map of annual average precipitation and annual average temperature from 1981 to 2018.
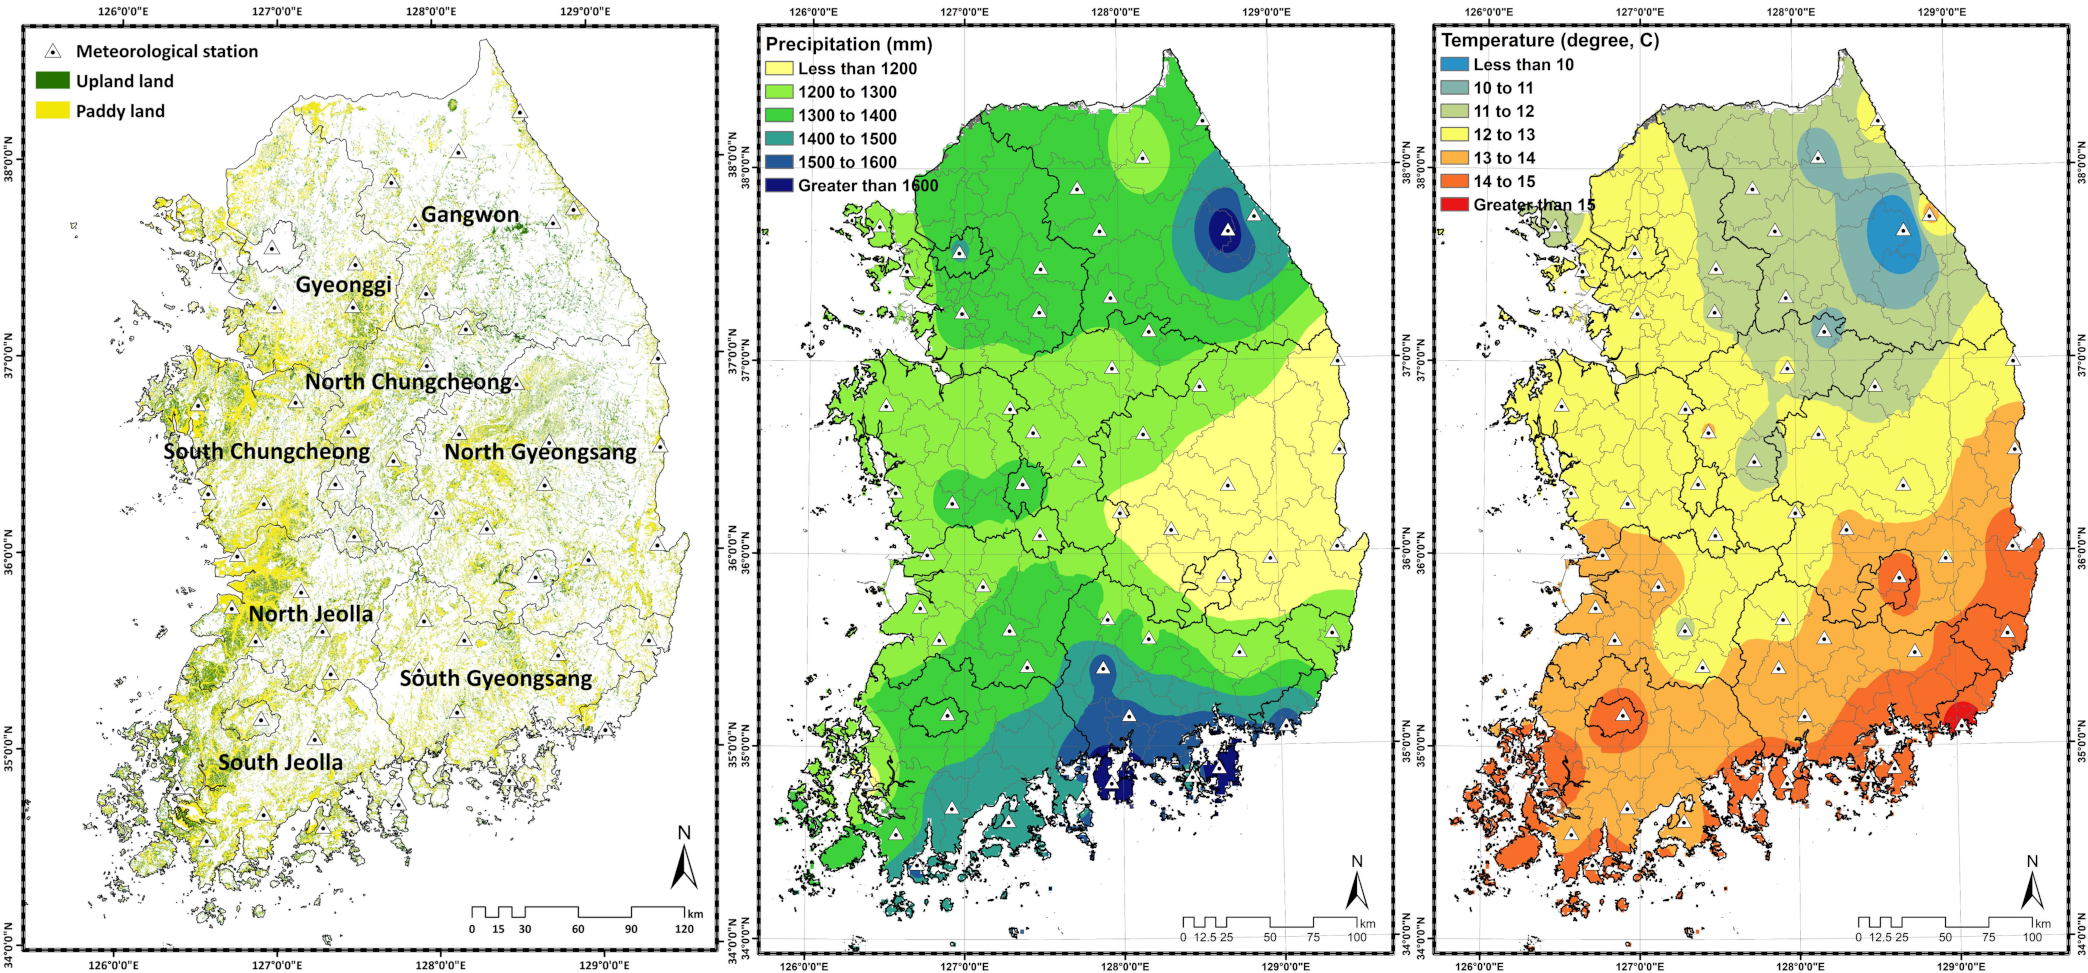
Figure 3.
Standardization range for each indicator (MD: meteorological data, RD: agricultural reservoir data, SD: social data, AD: adaptability data).
Figure 3.
Standardization range for each indicator (MD: meteorological data, RD: agricultural reservoir data, SD: social data, AD: adaptability data).
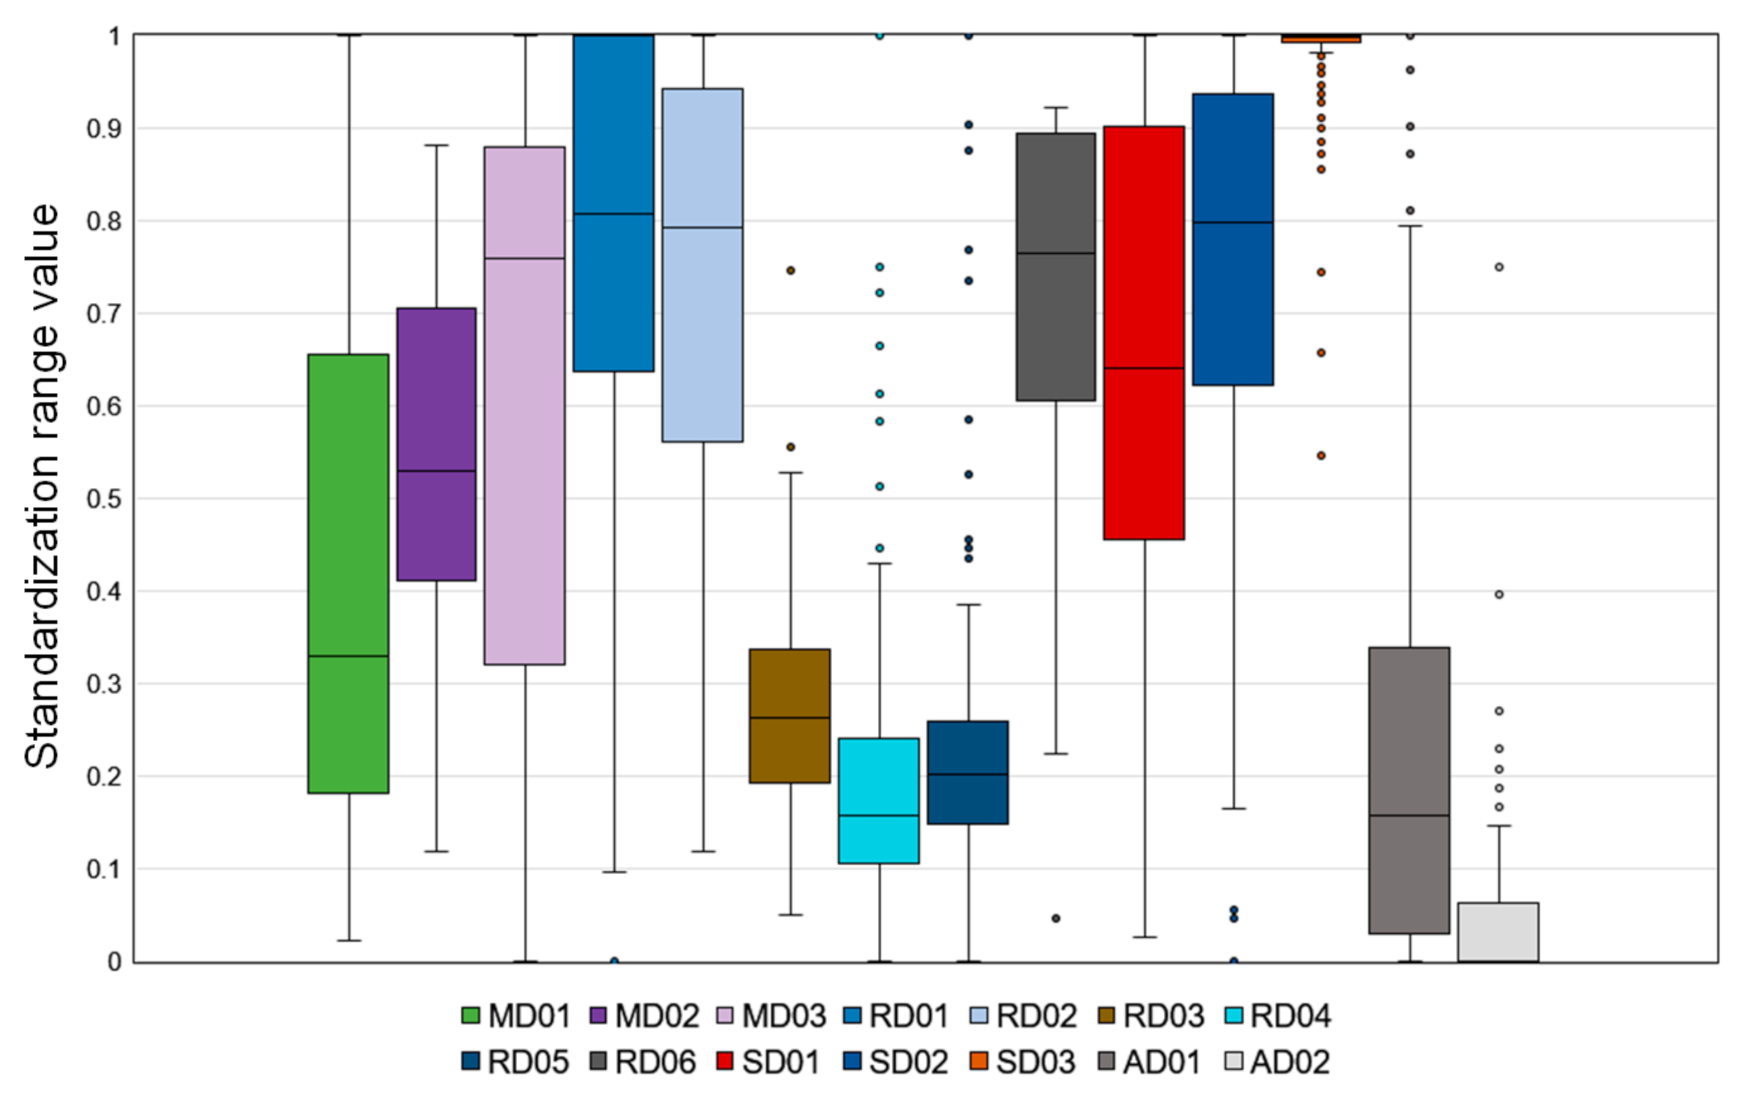
Figure 4.
Vulnerability map by factors related to vulnerability to agricultural drought ((A): meteorological vulnerability, (B): agricultural reservoir vulnerability, (C): social vulnerability, (D): adaptability vulnerability).
Figure 4.
Vulnerability map by factors related to vulnerability to agricultural drought ((A): meteorological vulnerability, (B): agricultural reservoir vulnerability, (C): social vulnerability, (D): adaptability vulnerability).
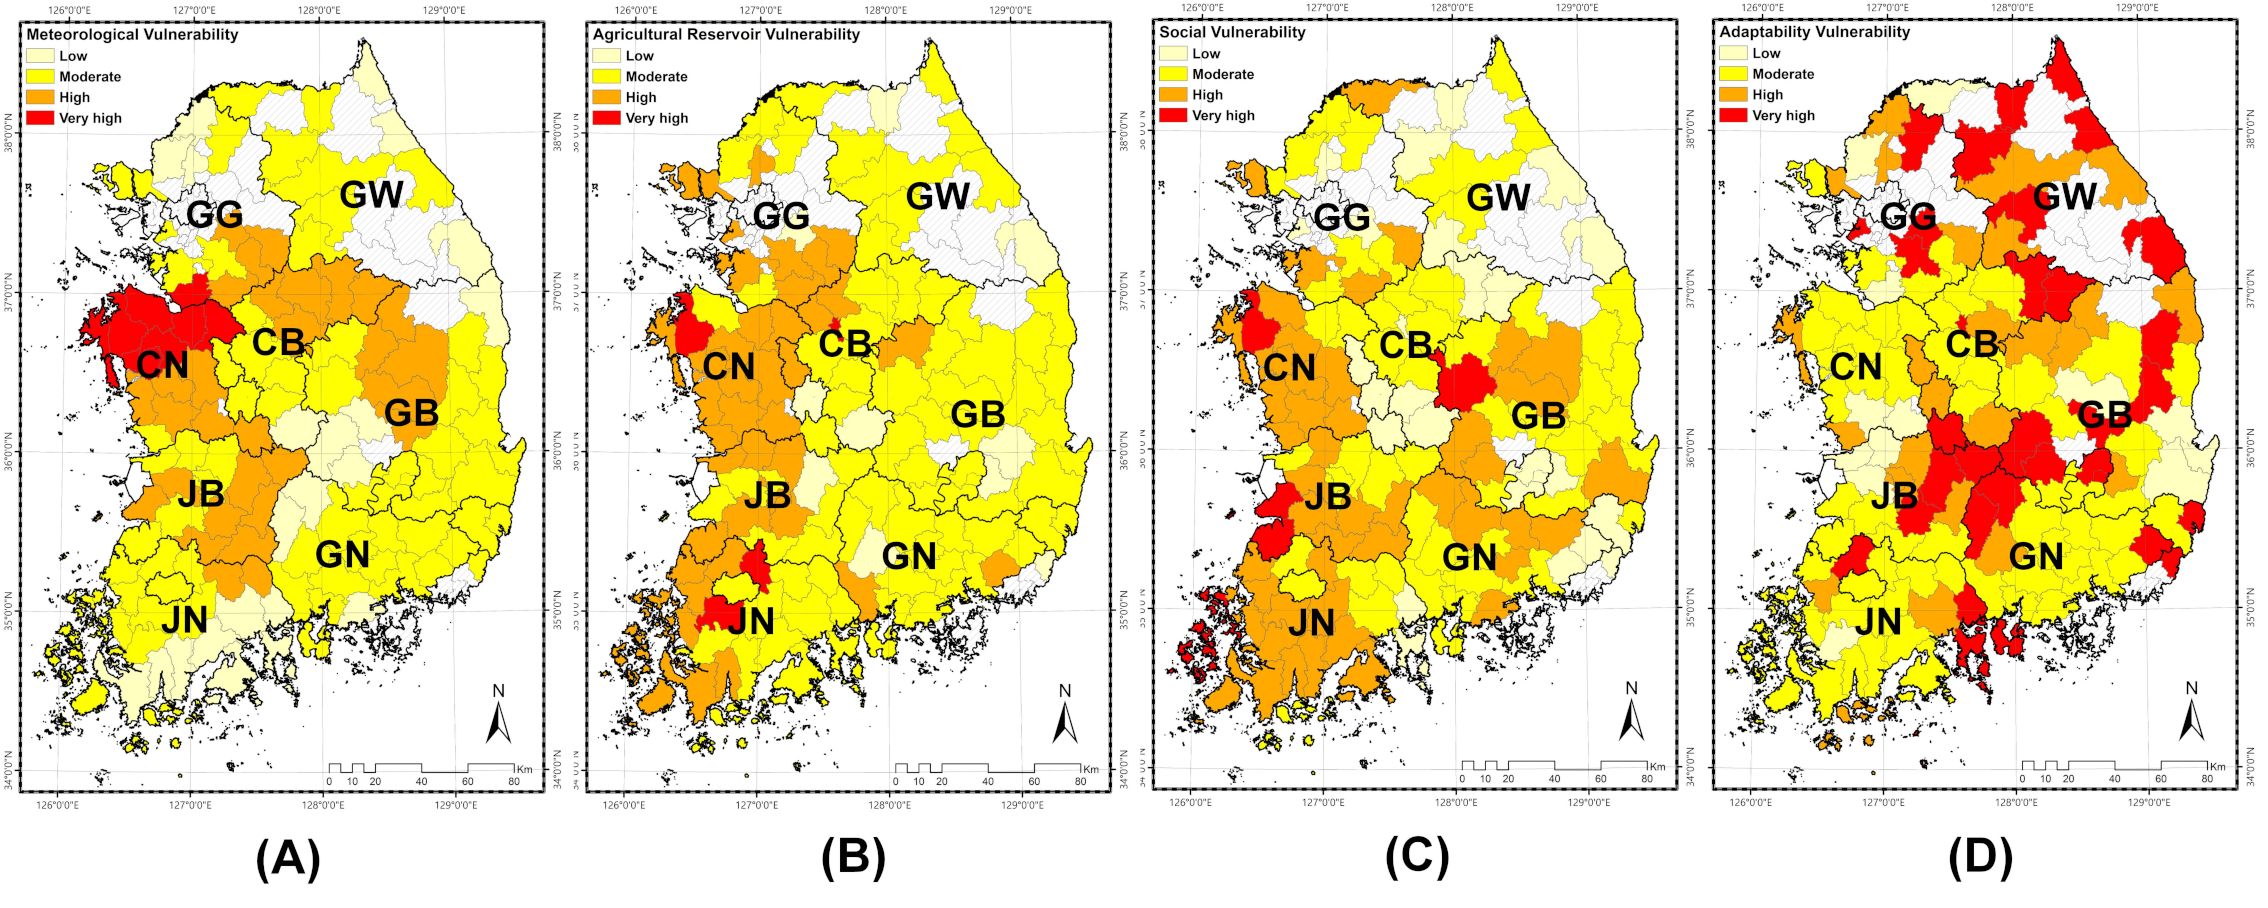
Figure 5.
Agricultural drought vulnerability map of South Korea (left: 2015–2018 vulnerability map, right: final vulnerability map).
Figure 5.
Agricultural drought vulnerability map of South Korea (left: 2015–2018 vulnerability map, right: final vulnerability map).
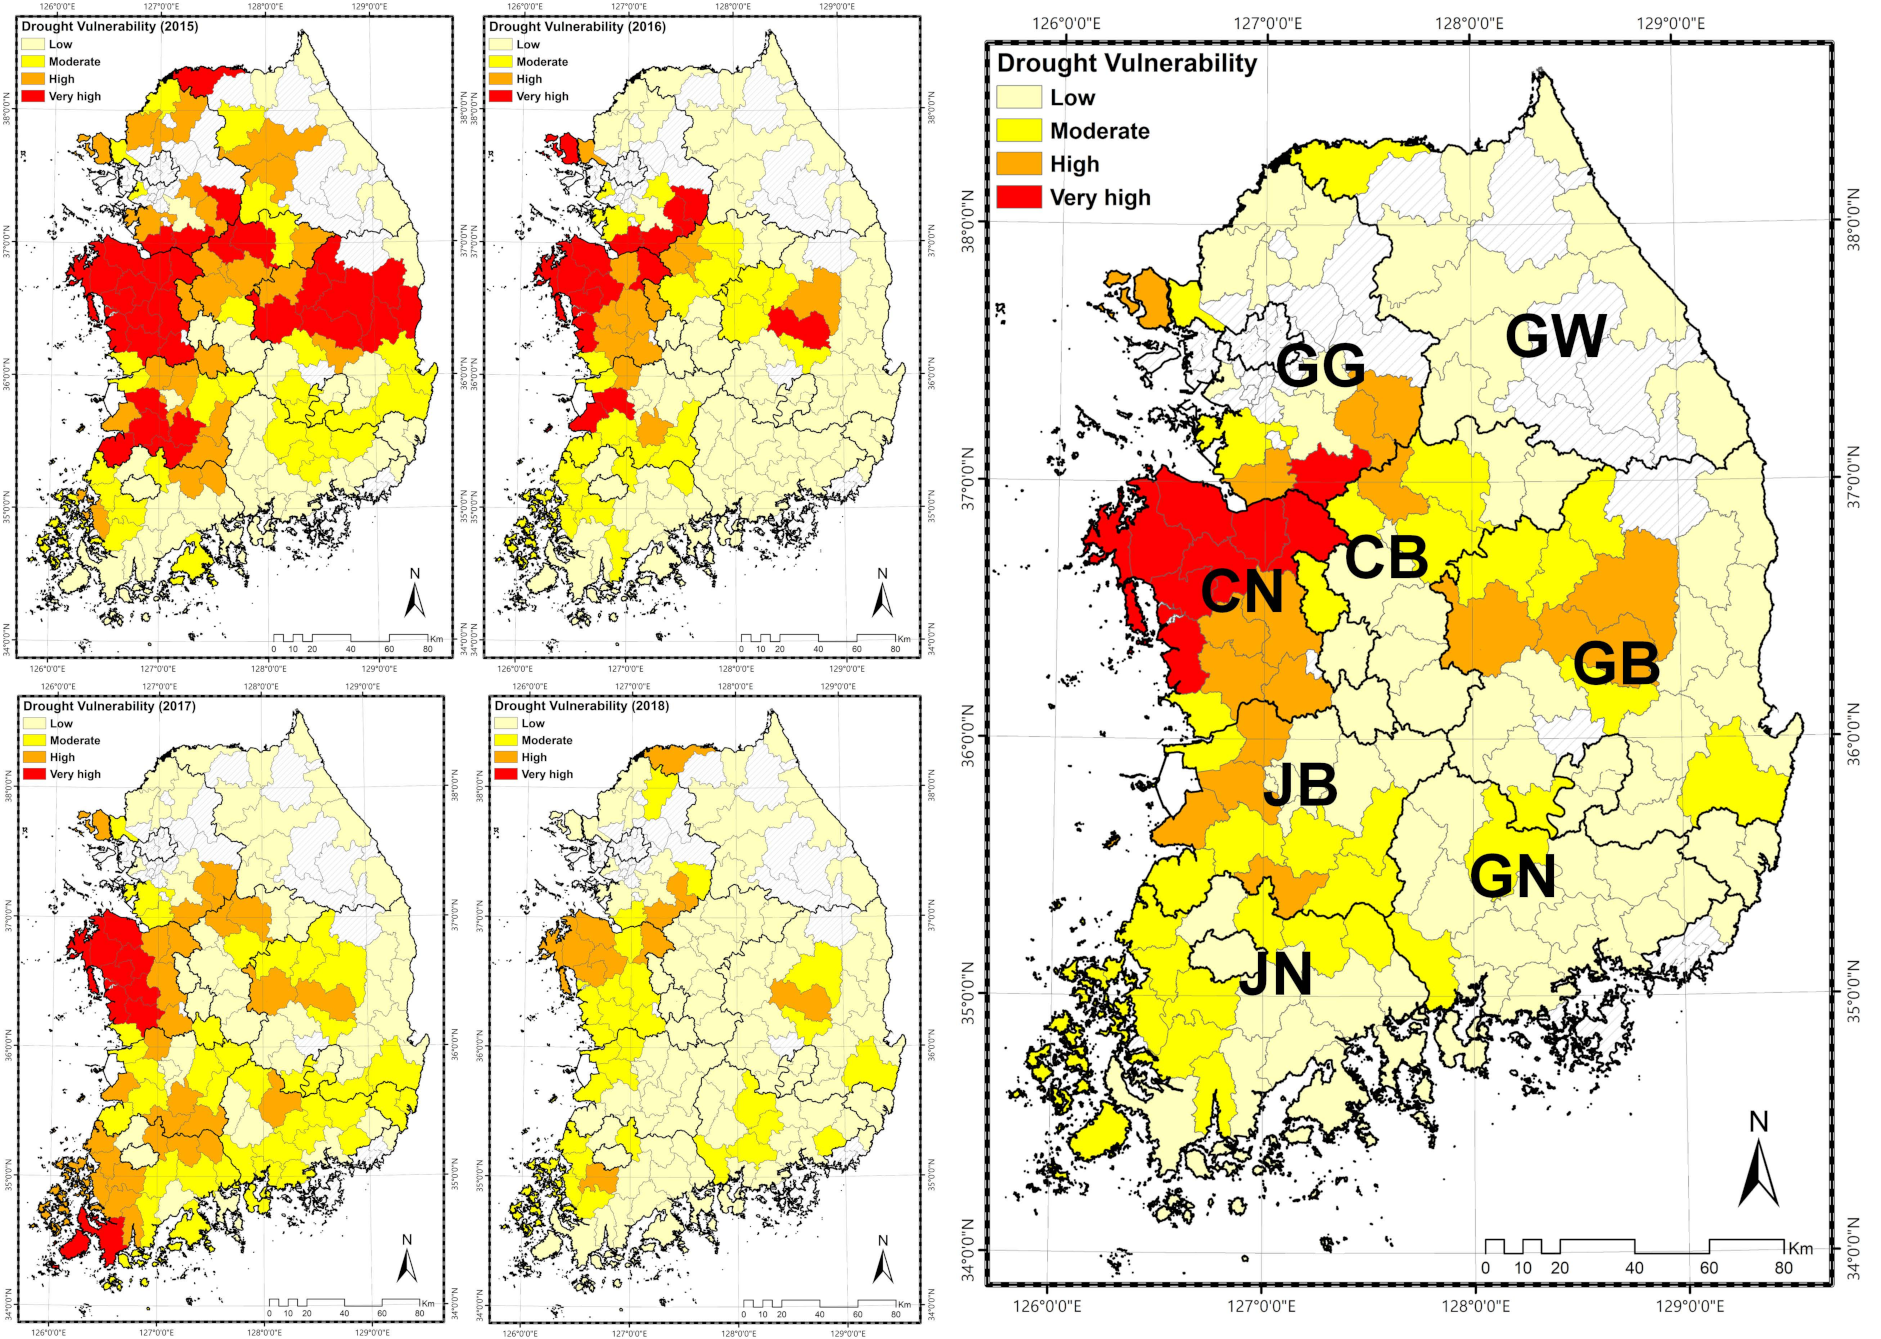
Figure 6.
Number of each small administrative boundary of the eight provinces-level across South Korea as determined by the agricultural drought vulnerability categories.
Figure 6.
Number of each small administrative boundary of the eight provinces-level across South Korea as determined by the agricultural drought vulnerability categories.


Table 1.
Meteorological data details and abbreviations.
| Category | Abbreviation | Details |
|---|---|---|
| Meteorological data | MD01 | Monthly precipitation |
| MD02 | Number of days without precipitation | |
| MD03 | Number of days having a high temperature over 33 °C |
Table 2.
Agricultural reservoir data details and abbreviations.
| Category | Abbreviation | Details |
|---|---|---|
| Agricultural reservoir data | RD01 | Number of days in which the water reserve rate was below the drought warning level of interest |
| RD02 | End-of-month water reserve ratio | |
| RD03 | Reservoir water level reduction ratio | |
| RD04 | Watershed ratio | |
| RD05 | Effective storage reserve per unit area | |
| RD06 | Irrigated paddy field |
Table 3.
Social data details and abbreviations.
| Category | Abbreviation | Details |
|---|---|---|
| Social data | SD01 | Agricultural population ratio |
| SD02 | Rice paddy ratio | |
| SD03 | Paddy water dry area |
Table 4.
Adaptability data details and abbreviations.
| Category | Abbreviation | Details |
|---|---|---|
| Adaptability data | AD01 | Assistance waterworks |
| AD02 | Pumped storage |
Table 5.
Calculation of weights for each indicator through analytical hierarchy process (AHP).
| Category | Weight | Classification | Abbreviation | Weight |
|---|---|---|---|---|
| Meteorological data | 0.498 | Monthly precipitation | MD01 | 0.54 |
| Number of days without precipitation | MD02 | 0.35 | ||
| Number of days having a high temperature over 33 °C | MD03 | 0.11 | ||
| Agricultural reservoir data | 0.286 | Number of days in which the water reserve rate was below the drought warning level of interest | RD01 | 0.32 |
| End-of-month water reserve ratio | RD02 | 0.25 | ||
| Reservoir water level reduction ratio | RD03 | 0.15 | ||
| Watershed ratio | RD04 | 0.13 | ||
| Effective storage reserve per unit area | RD05 | 0.09 | ||
| Irrigated paddy field | RD06 | 0.06 | ||
| Social data | 0.166 | Agricultural population ratio | SD01 | 0.22 |
| Rice paddy ratio | SD02 | 0.42 | ||
| Paddy water dry area | SD03 | 0.36 | ||
| Adaptability data | 0.05 | Assistance waterworks | AD01 | 0.79 |
| Pumped storage | AD02 | 0.21 |
Table 6.
Comparison of the average score for each factor related to vulnerability to agricultural drought and the national average score. Red represent lower than the standard value. Yellow represent higher than the standard value.
Table 6.
Comparison of the average score for each factor related to vulnerability to agricultural drought and the national average score. Red represent lower than the standard value. Yellow represent higher than the standard value.
| Meteorological | Agricultural Reservoir | Social | Adaptability | |||||
|---|---|---|---|---|---|---|---|---|
| Average | Standard | Average | Standard | Average | Standard | Average | Standard | |
| GG | 69.80 (+) | 69.19 | 72.93 (−) | 75.26 | 89.31 (+) | 80.57 | 49.33 (−) | 59.27 |
| GW | 71.56 (+) | 82.12 (+) | 88.86 (+) | 46.43 (−) | ||||
| CB | 65.25 (−) | 77.07 (+) | 86.83 (+) | 60.95 (+) | ||||
| CN | 57.96 (−) | 69.27 (−) | 71.50 (−) | 69.19 (+) | ||||
| JB | 65.60 (−) | 74.38 (−) | 72.35 (−) | 66.91 (+) | ||||
| JN | 73.09 (+) | 71.76 (−) | 72.41 (−) | 66.70 (+) | ||||
| GB | 68.07 (−) | 78.40 (+) | 77.40 (−) | 64.71 (+) | ||||
| GN | 73.87 (+) | 77.63 (+) | 81.80 (+) | 63.45 (+) | ||||
Table 7.
Frequency of agricultural drought vulnerabilities.
| Rate (%) | Low (D) | Moderate (C) | High (B) | Very High (A) | Blank |
|---|---|---|---|---|---|
| 2015 | 24.55 | 17.94 | 15.57 | 18.56 | 2.34 |
| 2016 | 44.91 | 14.97 | 7.78 | 8.98 | 2.34 |
| 2017 | 29.34 | 24.55 | 16.77 | 5.99 | 2.34 |
| 2018 | 53.29 | 16.77 | 6.59 | 0.00 | 2.34 |
| Total | 41.91 | 19.76 | 9.58 | 5.39 | 2.34 |
Publisher’s Note: MDPI stays neutral with regard to jurisdictional claims in published maps and institutional affiliations. |
© 2020 by the authors. Licensee MDPI, Basel, Switzerland. This article is an open access article distributed under the terms and conditions of the Creative Commons Attribution (CC BY) license (http://creativecommons.org/licenses/by/4.0/).
Share and Cite
MDPI and ACS Style
Mun, Y.-S.; Nam, W.-H.; Jeon, M.-G.; Bang, N.-K.; Kim, T. Assessment of Vulnerability to Drought Disaster in Agricultural Reservoirs in South Korea. Atmosphere 2020, 11, 1244. https://doi.org/10.3390/atmos11111244
AMA Style
Mun Y-S, Nam W-H, Jeon M-G, Bang N-K, Kim T. Assessment of Vulnerability to Drought Disaster in Agricultural Reservoirs in South Korea. Atmosphere. 2020; 11(11):1244. https://doi.org/10.3390/atmos11111244
Chicago/Turabian StyleMun, Young-Sik, Won-Ho Nam, Min-Gi Jeon, Na-Kyoung Bang, and Taegon Kim. 2020. "Assessment of Vulnerability to Drought Disaster in Agricultural Reservoirs in South Korea" Atmosphere 11, no. 11: 1244. https://doi.org/10.3390/atmos11111244
Note that from the first issue of 2016, this journal uses article numbers instead of page numbers. See further details here.