1. Introduction
Explosive volcanic eruption is one of the major unavoidable natural disasters in human society. Modern observational systems and urgent numerical simulations of airborne ashes are desirable tools to prevent the natural hazard of volcanic eruptions. A number of volcanic hazard assessment tools have been developed since the late 1980s, such as PUFF [
1], VAFTAD [
2], Tephra2 [
3], and Ash3d [
4]. Among those, the PUFF model was developed in 1990 to simulate the airborne ash plume from Redoubt volcano using a real-time upper air weather data available by the internet link in early time (e.g., [
1,
5,
6]). The real-time weather data were downloaded using the satellite parabola antenna because the internet link to Alaska was still a developing stage. The beginning of eruption was monitored using seismic data operated by the Alaska Volcano Observatory (AVO) in the Geophysical Institute, University of Alaska Fairbanks (e.g., [
7,
8,
9]). The PUFF model predicted the movement of ash plume, and the result of the numerical simulation was distributed from the AVO to all related aviation agencies by FAX at that time. The performance of the ash plume prediction was confirmed by satellite data for Alaskan volcanos (e.g., [
8,
9,
10]). Later, the performance of the PUFF model was examined by ground fallout observation for Usu volcano [
11]. The performance is further confirmed for the Kelud volcano in Indonesia, using Himawari-8 satellite monitoring [
12], and the Kuchinoerabujima volcano in Japan [
13].
Among many volcanoes, Sakurajima in Japan is a unique volcano in that the most advanced monitoring systems have been established, for a long time, to prevent volcanic disaster in the nearby cities of Tarumizu, Aira, Kirishima, and Kagoshima, and the Kagoshima Regional Airport. There are a number of monitoring stations of ash fallout around the volcano. The volcanic activity is monitored by seismic record and ground deformation record 24 h a day. Iguchi [
14,
15] developed a method for real-time estimation of emission of volcanic ash from the source based on the long-term records of the rich observational network around the Sakurajima volcano. Using those real-time observations, the volcanic ash emission was expressed by linear combinations of seismic amplitude and ground deformation. By combining the real-time discharge rate with the PUFF model, we developed a new PUFF system to predict the total amount of ash fallout accumulated over a wide area immediately after the eruption [
16]. Moreover, it is possible to predict the airborne ash density and three-dimensional (3D) distribution of ash plume dispersal in a real-time base. Although the new PUFF system is quite useful, the estimated emission rate and plume height must be validated by direct observation of the airborne ash plume using a remote sensing technique.
In this study, the observational result by the newly established multi-parameter (MP) radar system is applied to the PUFF system to correct the predicted airborne ash plume. The X-band (3 cm wavelength) MP radar, called polarimetric radar, installed by Japan’s Ministry of Land, Infrastructure, Transport and Tourism (MLIT), became operational in 2013 at Tarumizu, 15 km south of Sakurajima volcano. MLIT set up 39 of MP radars in major cities in Japan and provides rainfall information every one min within 60 km radius. The radar’s dual polarization function is used to estimate rainfall amounts and precipitation particle size distribution. The operational MP radar can provide information of three-dimensional ash fall amount distribution in the air, as reported by [
17]. A small X-band MP radar was installed at the Sakurajima Volcano Research Center (SVRC), Kyoto University, located 3.6 km west of the Minami-dake summit crater of Sakurajima volcano in August 2017 [
18]. Therefore, the MP radar at SVRC is applicable to the PUFF system to calibrate the model predictions.
The purpose of this study is to incorporate the observational result by MP radar to the real-time PUFF system. This is a kind of data assimilation that combines the observational data to the model prediction in order to improve the numerical model prediction skill. Although the MP radar observation is a valuable ground truth of the airborne ash plume, the data provide only a snapshot of the ash dispersal. The radar echo often contains large noise for a weak signal of reflection from the ash particles. For this reason, a simple nudging of the model prediction to the observation is inadequate. It is instead desirable to pursue a data assimilation approach in which the observational data provided by the radar are combined with the PUFF model predictions. By comparing the 3D distributions and temporal variation of airborne ash plume before and after the data assimilation of the MP radar data, we can assess the improvement of the new PUFF model predictions.
2. Description of the PUFF Model Using the Emission Rate
The volcanic plume prediction model PUFF was developed by Tanaka [
1] in 1991, and reported in detail by [
5,
6] as an application of pollutant dispersion models. Some modifications on initial plume shape and diffusion parameters were documented by [
12,
13]. Therefore, only a brief description is presented here.
The model is based on a 3D Lagrangian form of the fluid mechanics. In the Lagrangian form, material transport is represented by the fluid motion, and diffusion is parameterized by a stochastic process of random walk (e.g., [
19]). Here, the model is constructed by a sufficiently large number of random variables
ri, = (
x,y,z),
i = 1~M which represent position vectors of
particles from the origin of the ash source.
The initial location of a particle is represented by a source term
S, Wind field
V = (u, v, w) transports the particles, diffusion vector
Z = (ch, ch, cv) is generated by Gaussian random numbers, and gravitational fallout velocity
G = (0, 0, −
wt) is represented by extended Stokes Law. The default values by [
16] are used for the numerical simulations in this study.
In this study, the wind velocity
V is obtained from the real-time Grid Point Values (GPV) data provided by the global spectral model (GSM) of the Japan Meteorological Agency (JMA).
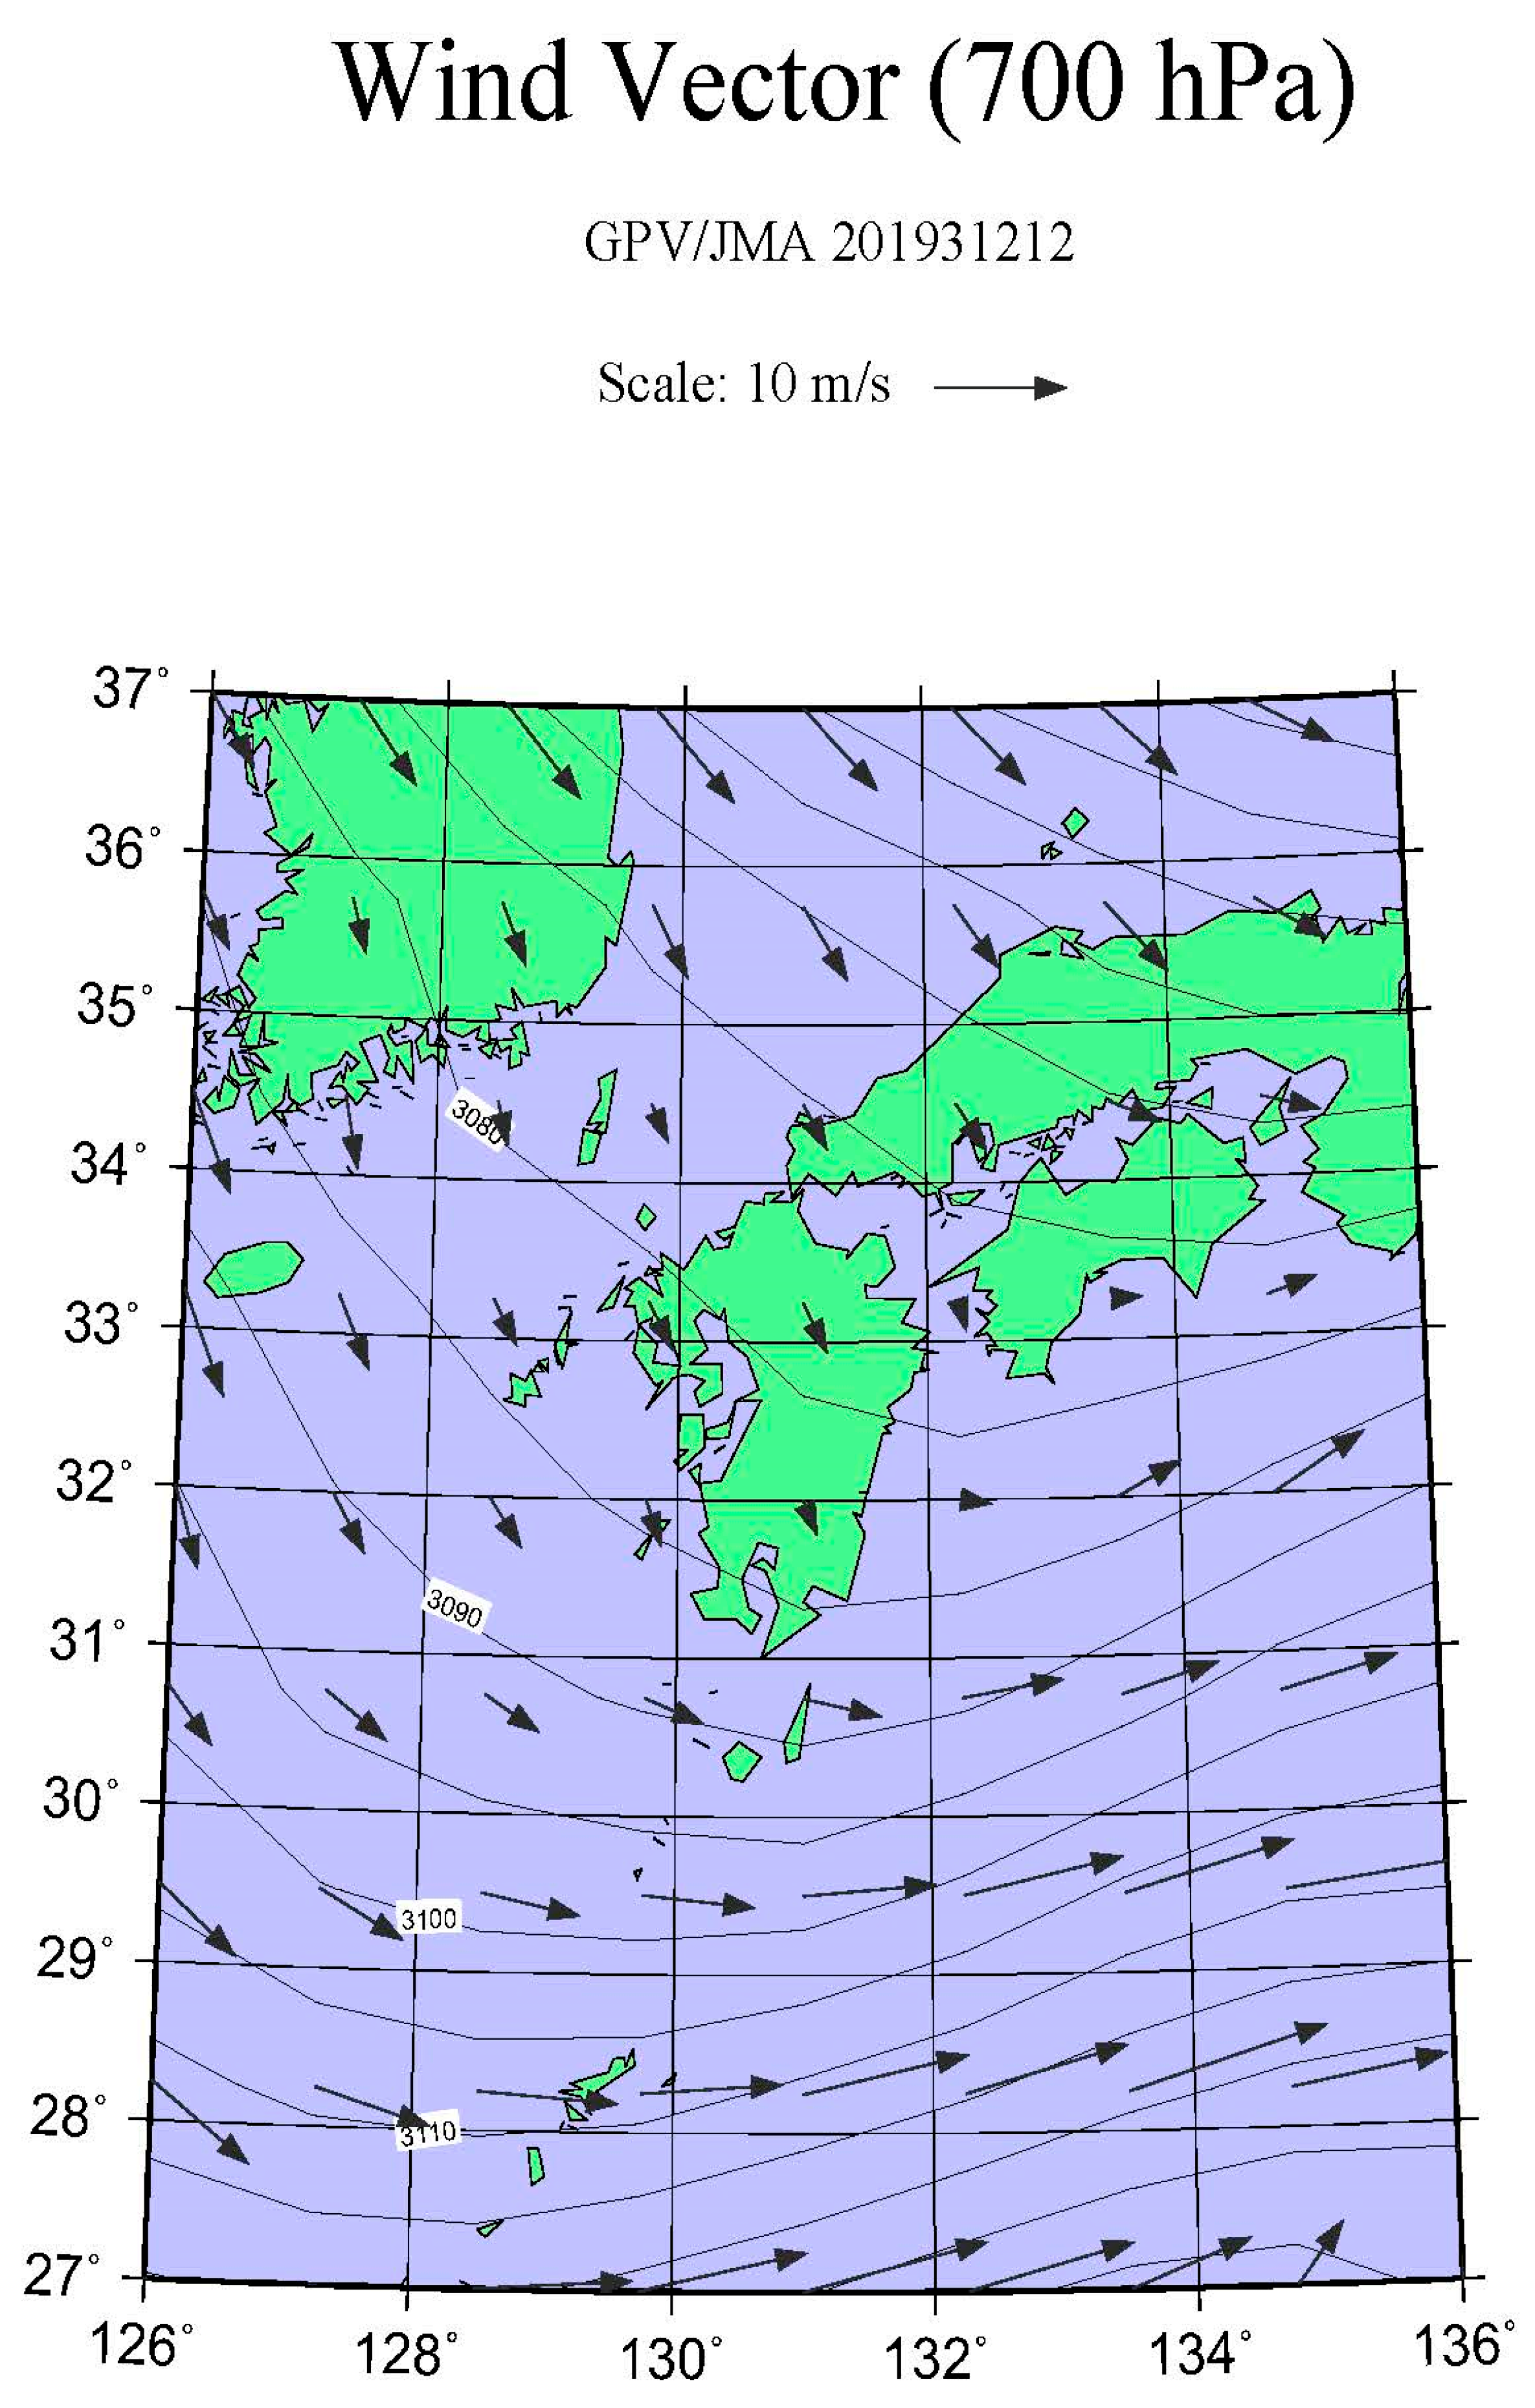
Figure 1 illustrates the geopotential height and wind vectors of 700 hPa at 12:00 UTC (21:00 Japan Standard Time, JST) on 8 November, 2019. The real-time GPV data are provided by the JMA through the portal site at the Center for Computational Sciences of the University of Tsukuba. There is a northwesterly wind about 5 m/s at 700 hPa over the Sakurajima volcano. The wind at 500 hPa is westerly, and that at 925 hPa is northerly, indicating a large wind shear. The performance of the PUFF model simulation relies totally on the accuracy of the wind data.
The model Equation (1) is integrated in time, and the distributions of the particles in the air are plotted in various mapping projections by GMT [
20]. The total number of ash particles,
M, increases with each time step for a continuous eruption.
The real-time emission rate
ε (ton/min) is estimated using seismic data and tilt and strain record provided by the observational network for Sakurajima volcano [
14,
15]. The thermal energy of eruption is proportional to the fourth power of the plume height by the Spark–Mastin formula [
21]. Thus, the plume height
z2 is estimated from the emission rate
ε as:
where
z1 is the height of the vent and
b (= 400) is an empirical coefficient obtained by Iguchi [
15] using long-time observations at Sakurajima. It appears that the coefficient is only a half of the expected value by the observation. The coefficient is not accurate enough for an individual eruption event, but is a first approximation by energy consideration.
3. Results of the PUFF Model Simulation Using the Emission Rate
The PUFF model simulation is conducted using the real-time emission rate estimated for the eruption event on 8 November 2019.
Figure 2 shows the time series of the emission rate (ton/5 min) and the corresponding plume height (m) estimated by Equation (2) starting from 17:00 to 23:00 in local time. The total amount of emission was estimated as 8800 tons for this specific event. The simulation interval is noted from 0 to 6 h in the abscissa. The emission started at 17:24 and lasted for 20 min, indicating a peak value of 3000 ton/5 min at 17:30. M
0 = 3000 particles are generated for △
t = 5 min when the peak emission rate is 3000 ton/5min. The corresponding plume height indicates 4000 m a.s.l., which is lower than the visual observation of 5500 m (i.e., 6500 m a.s.l.) reported by JMA in Kagoshima [
22].
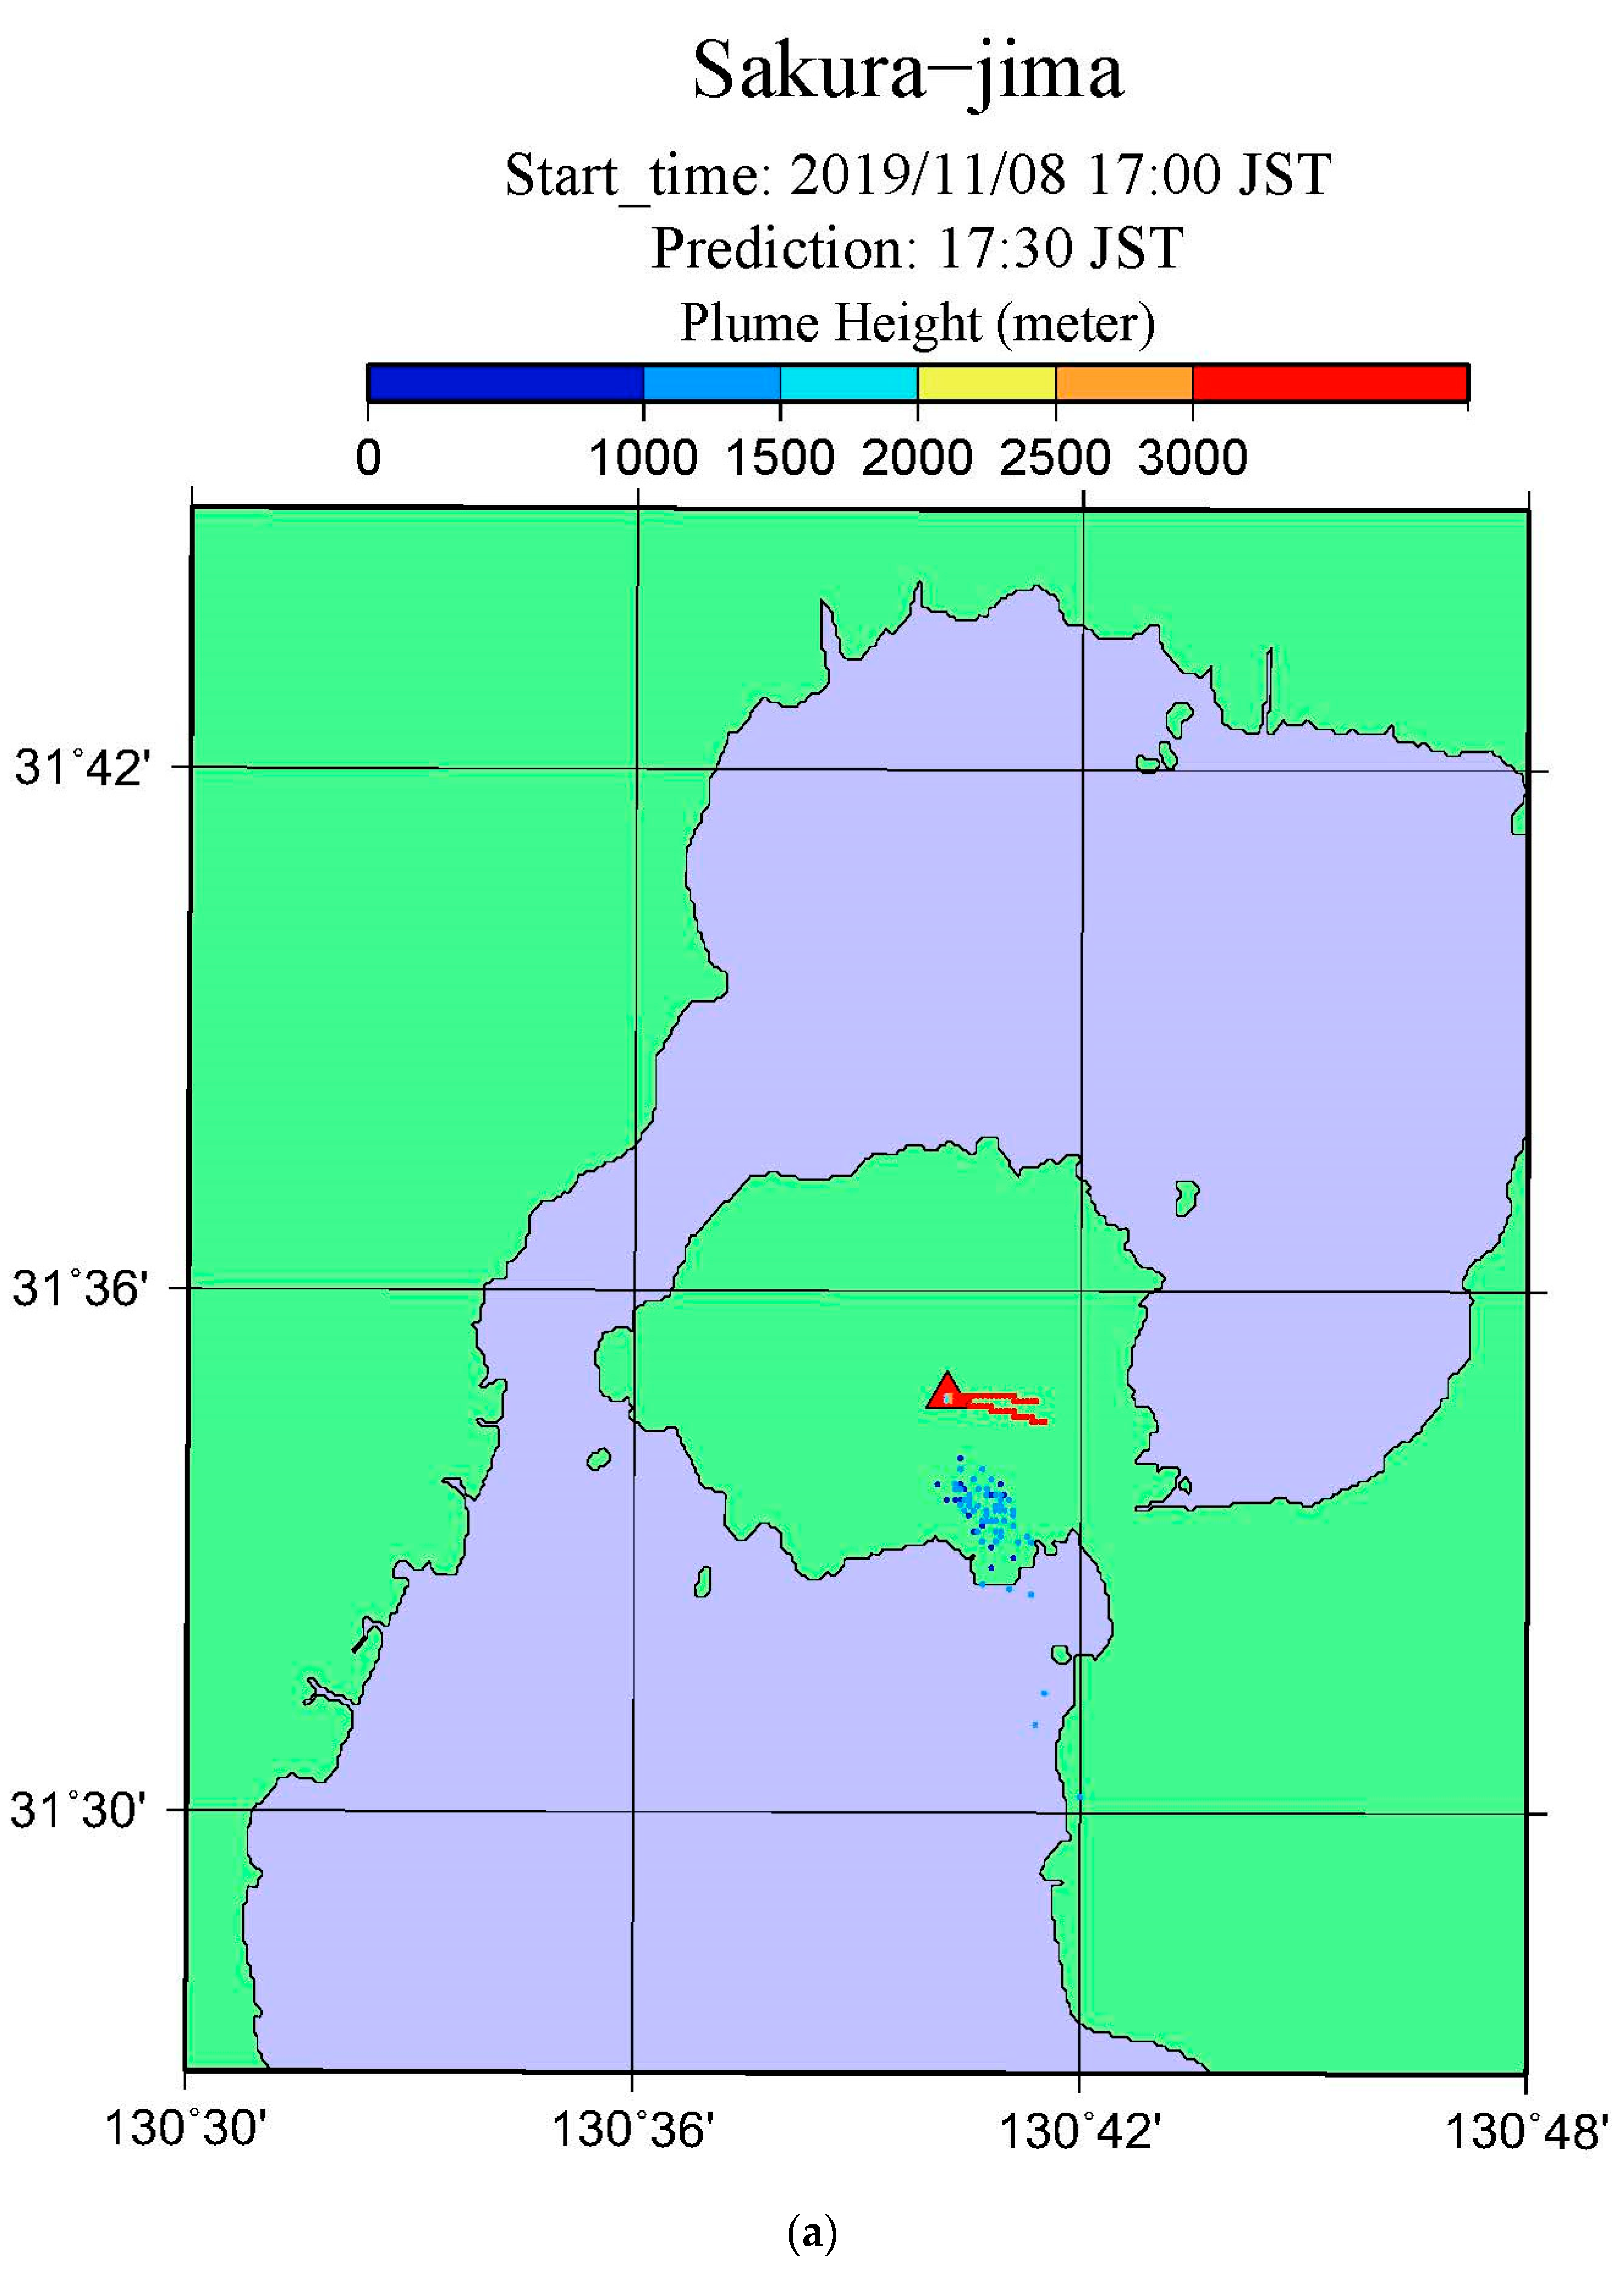
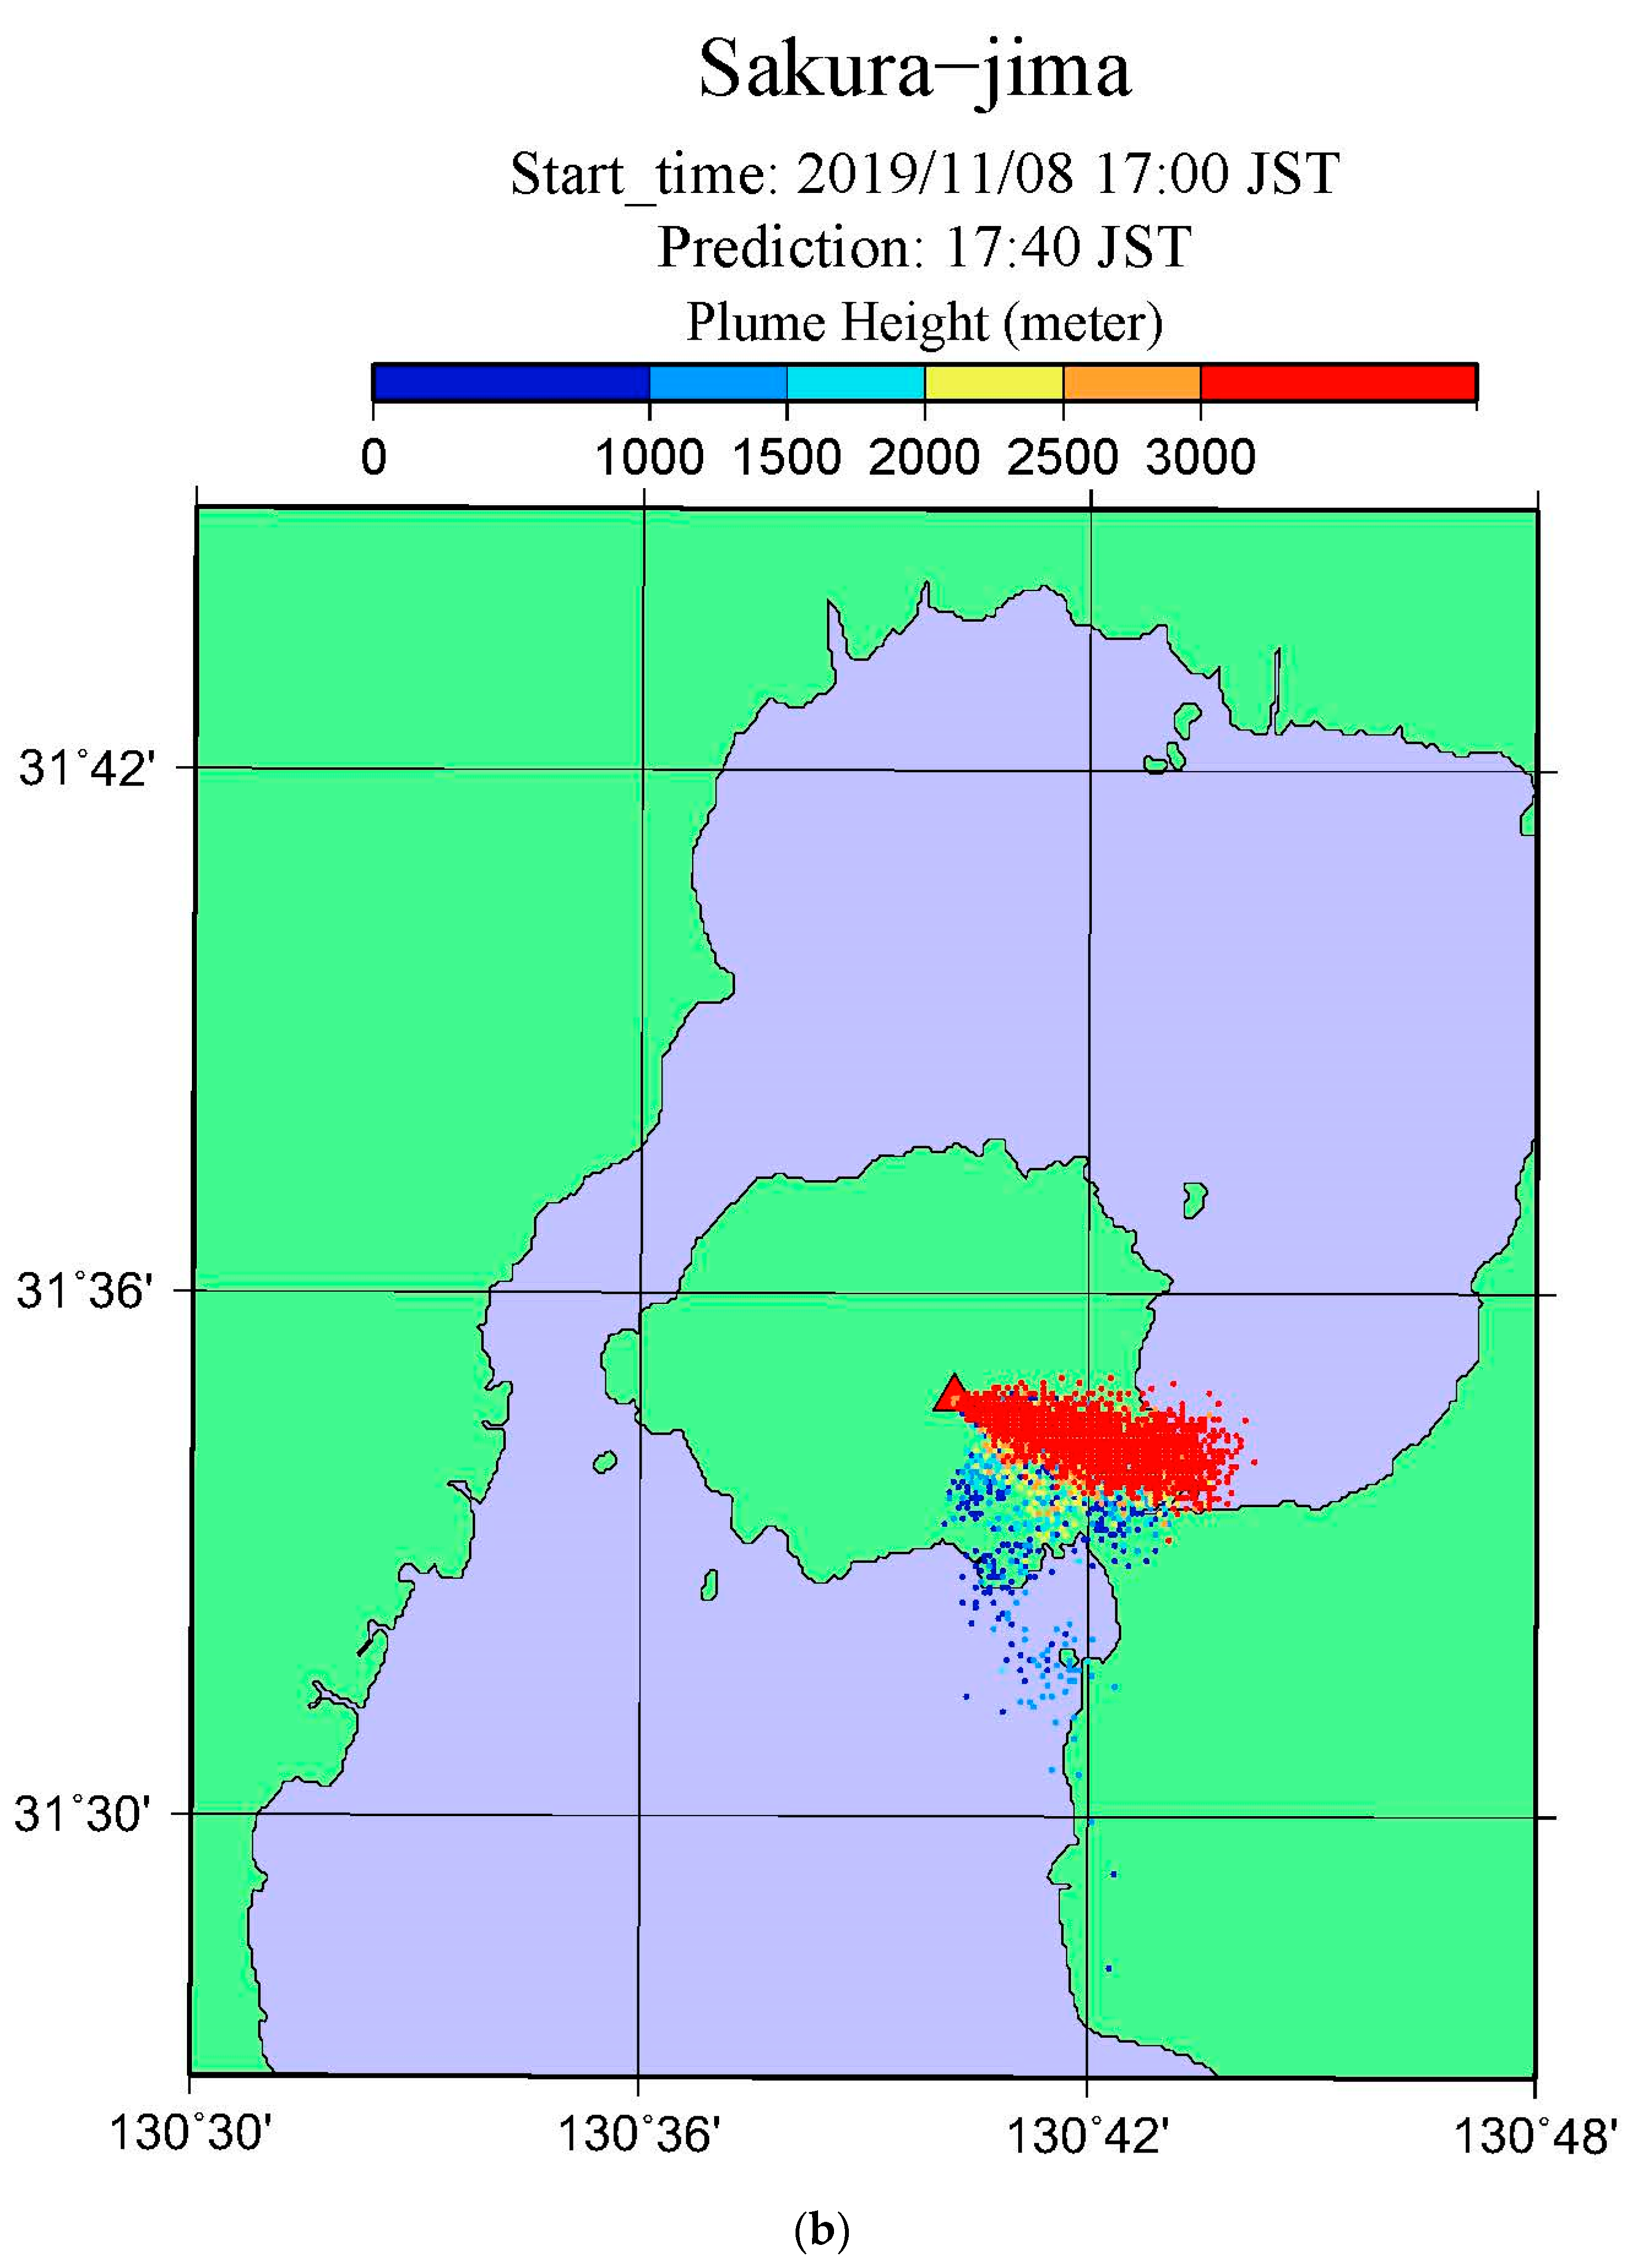
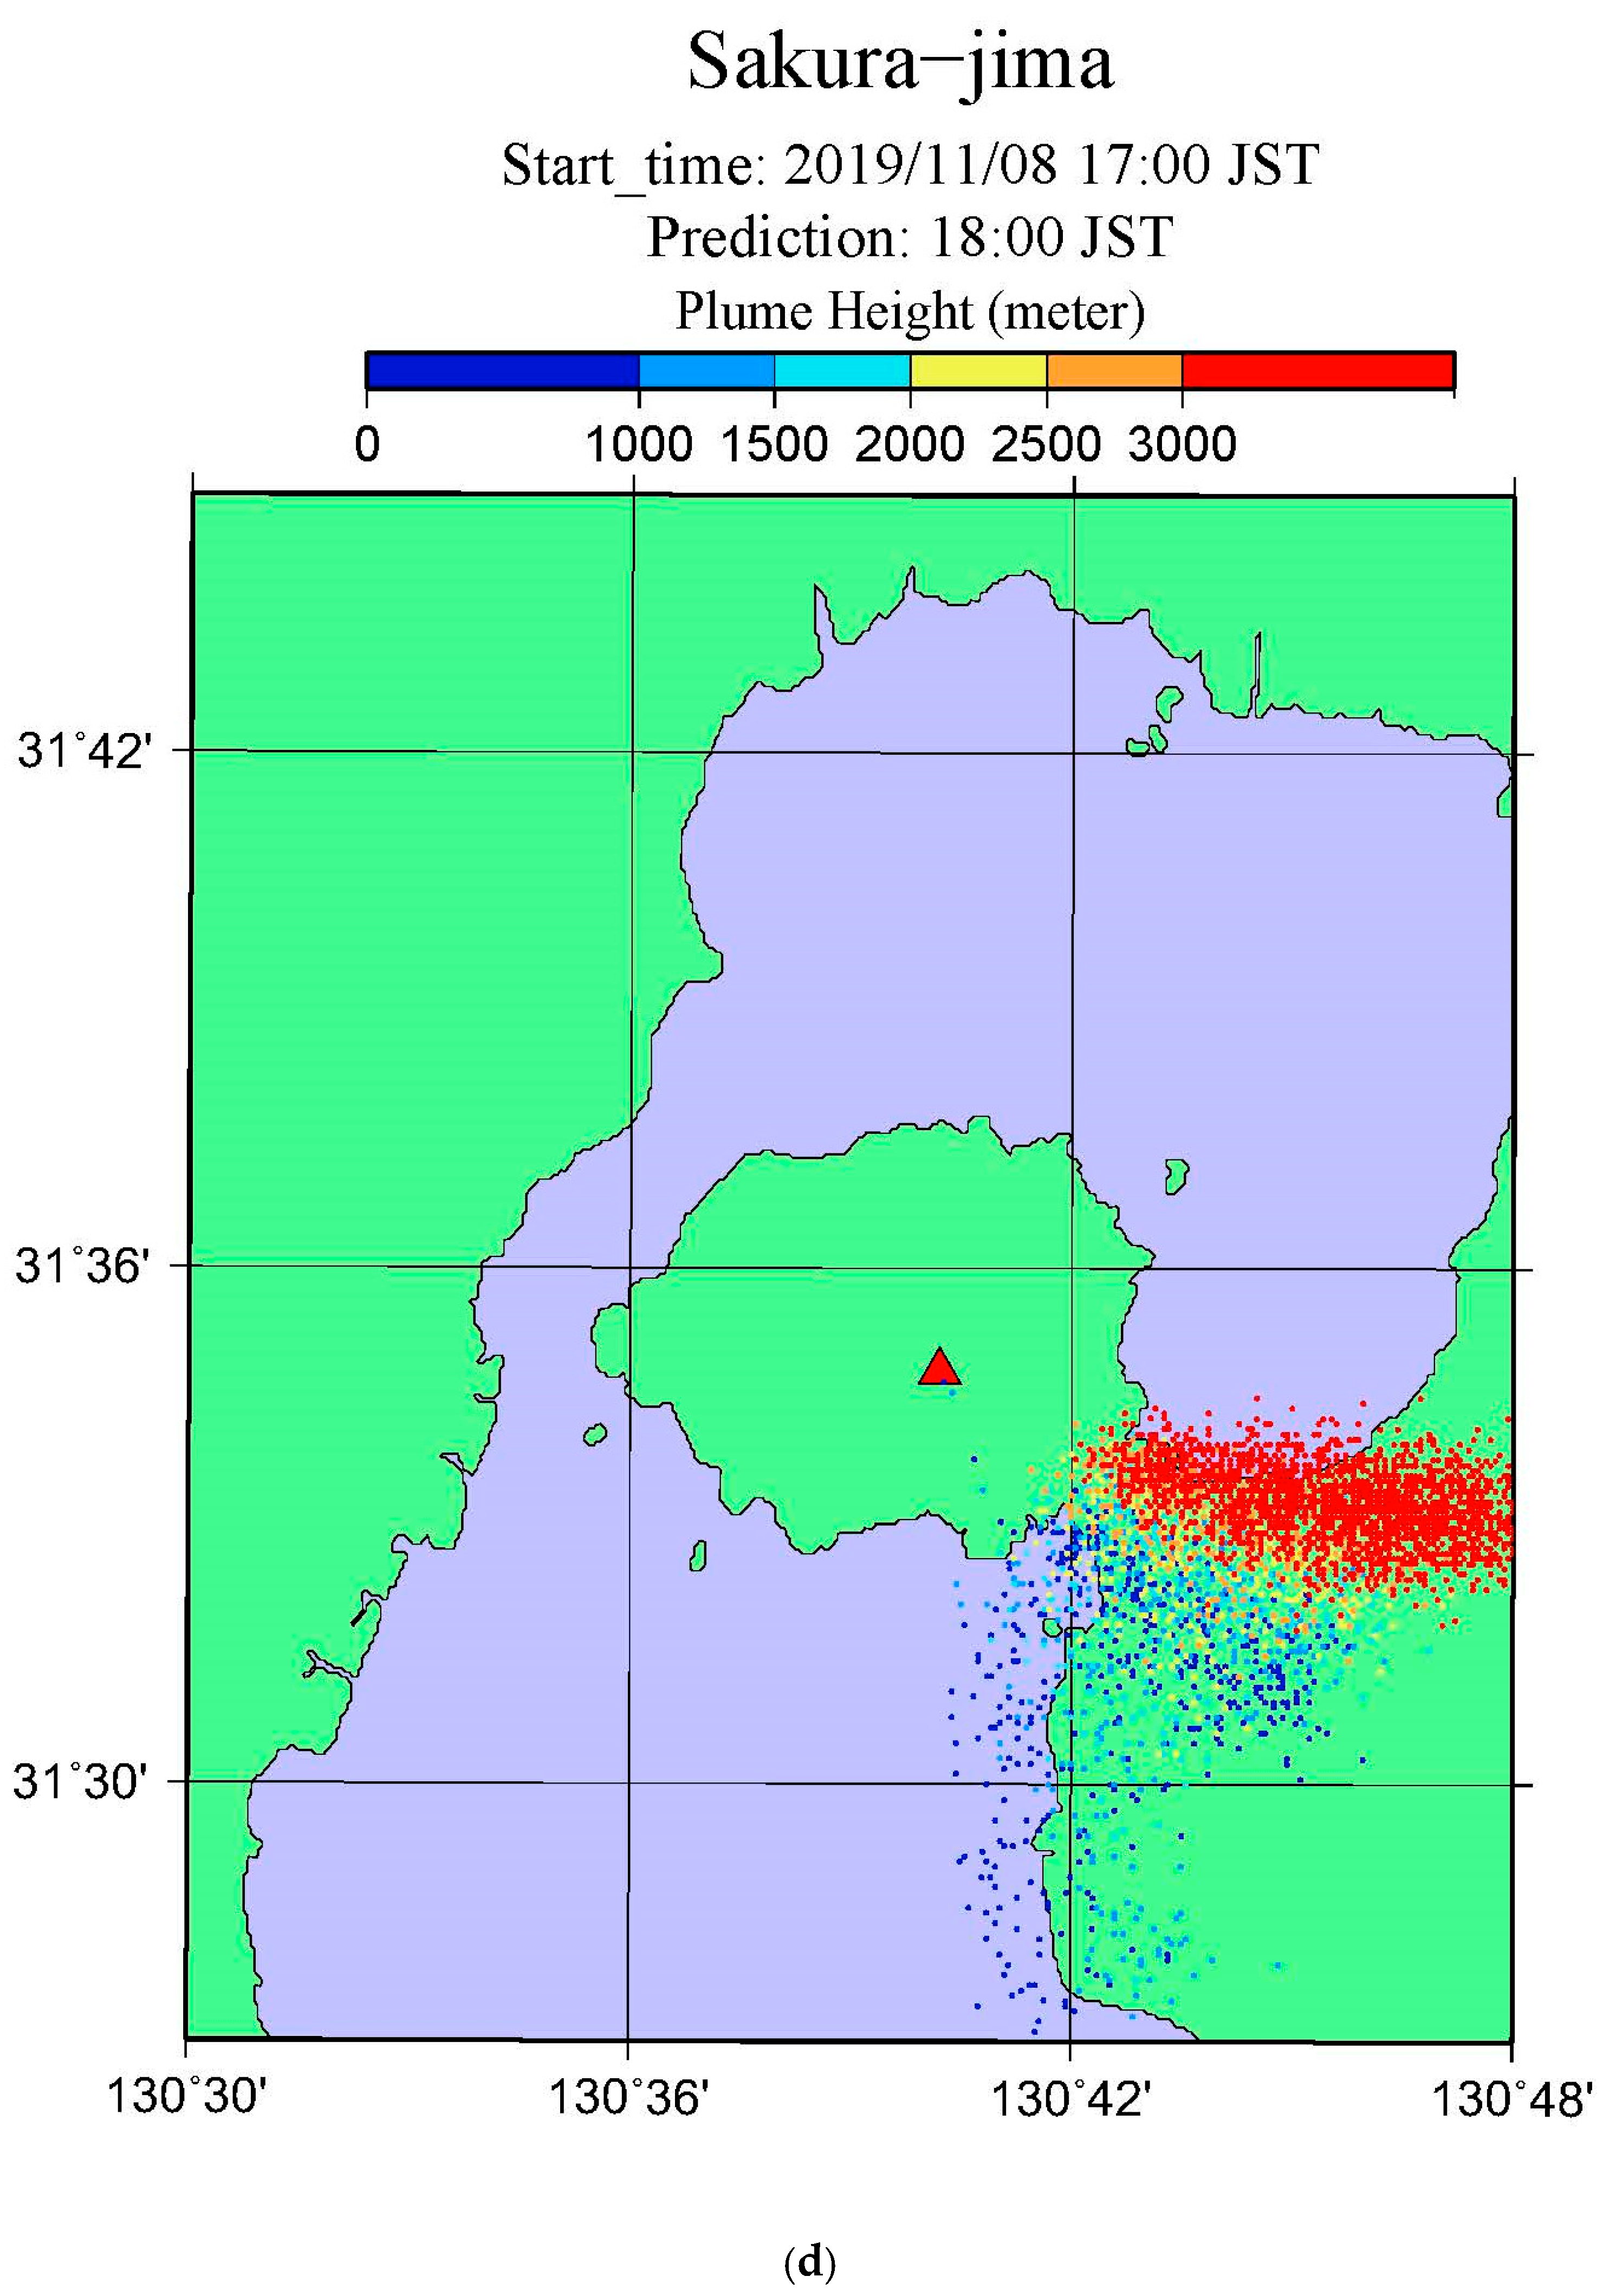
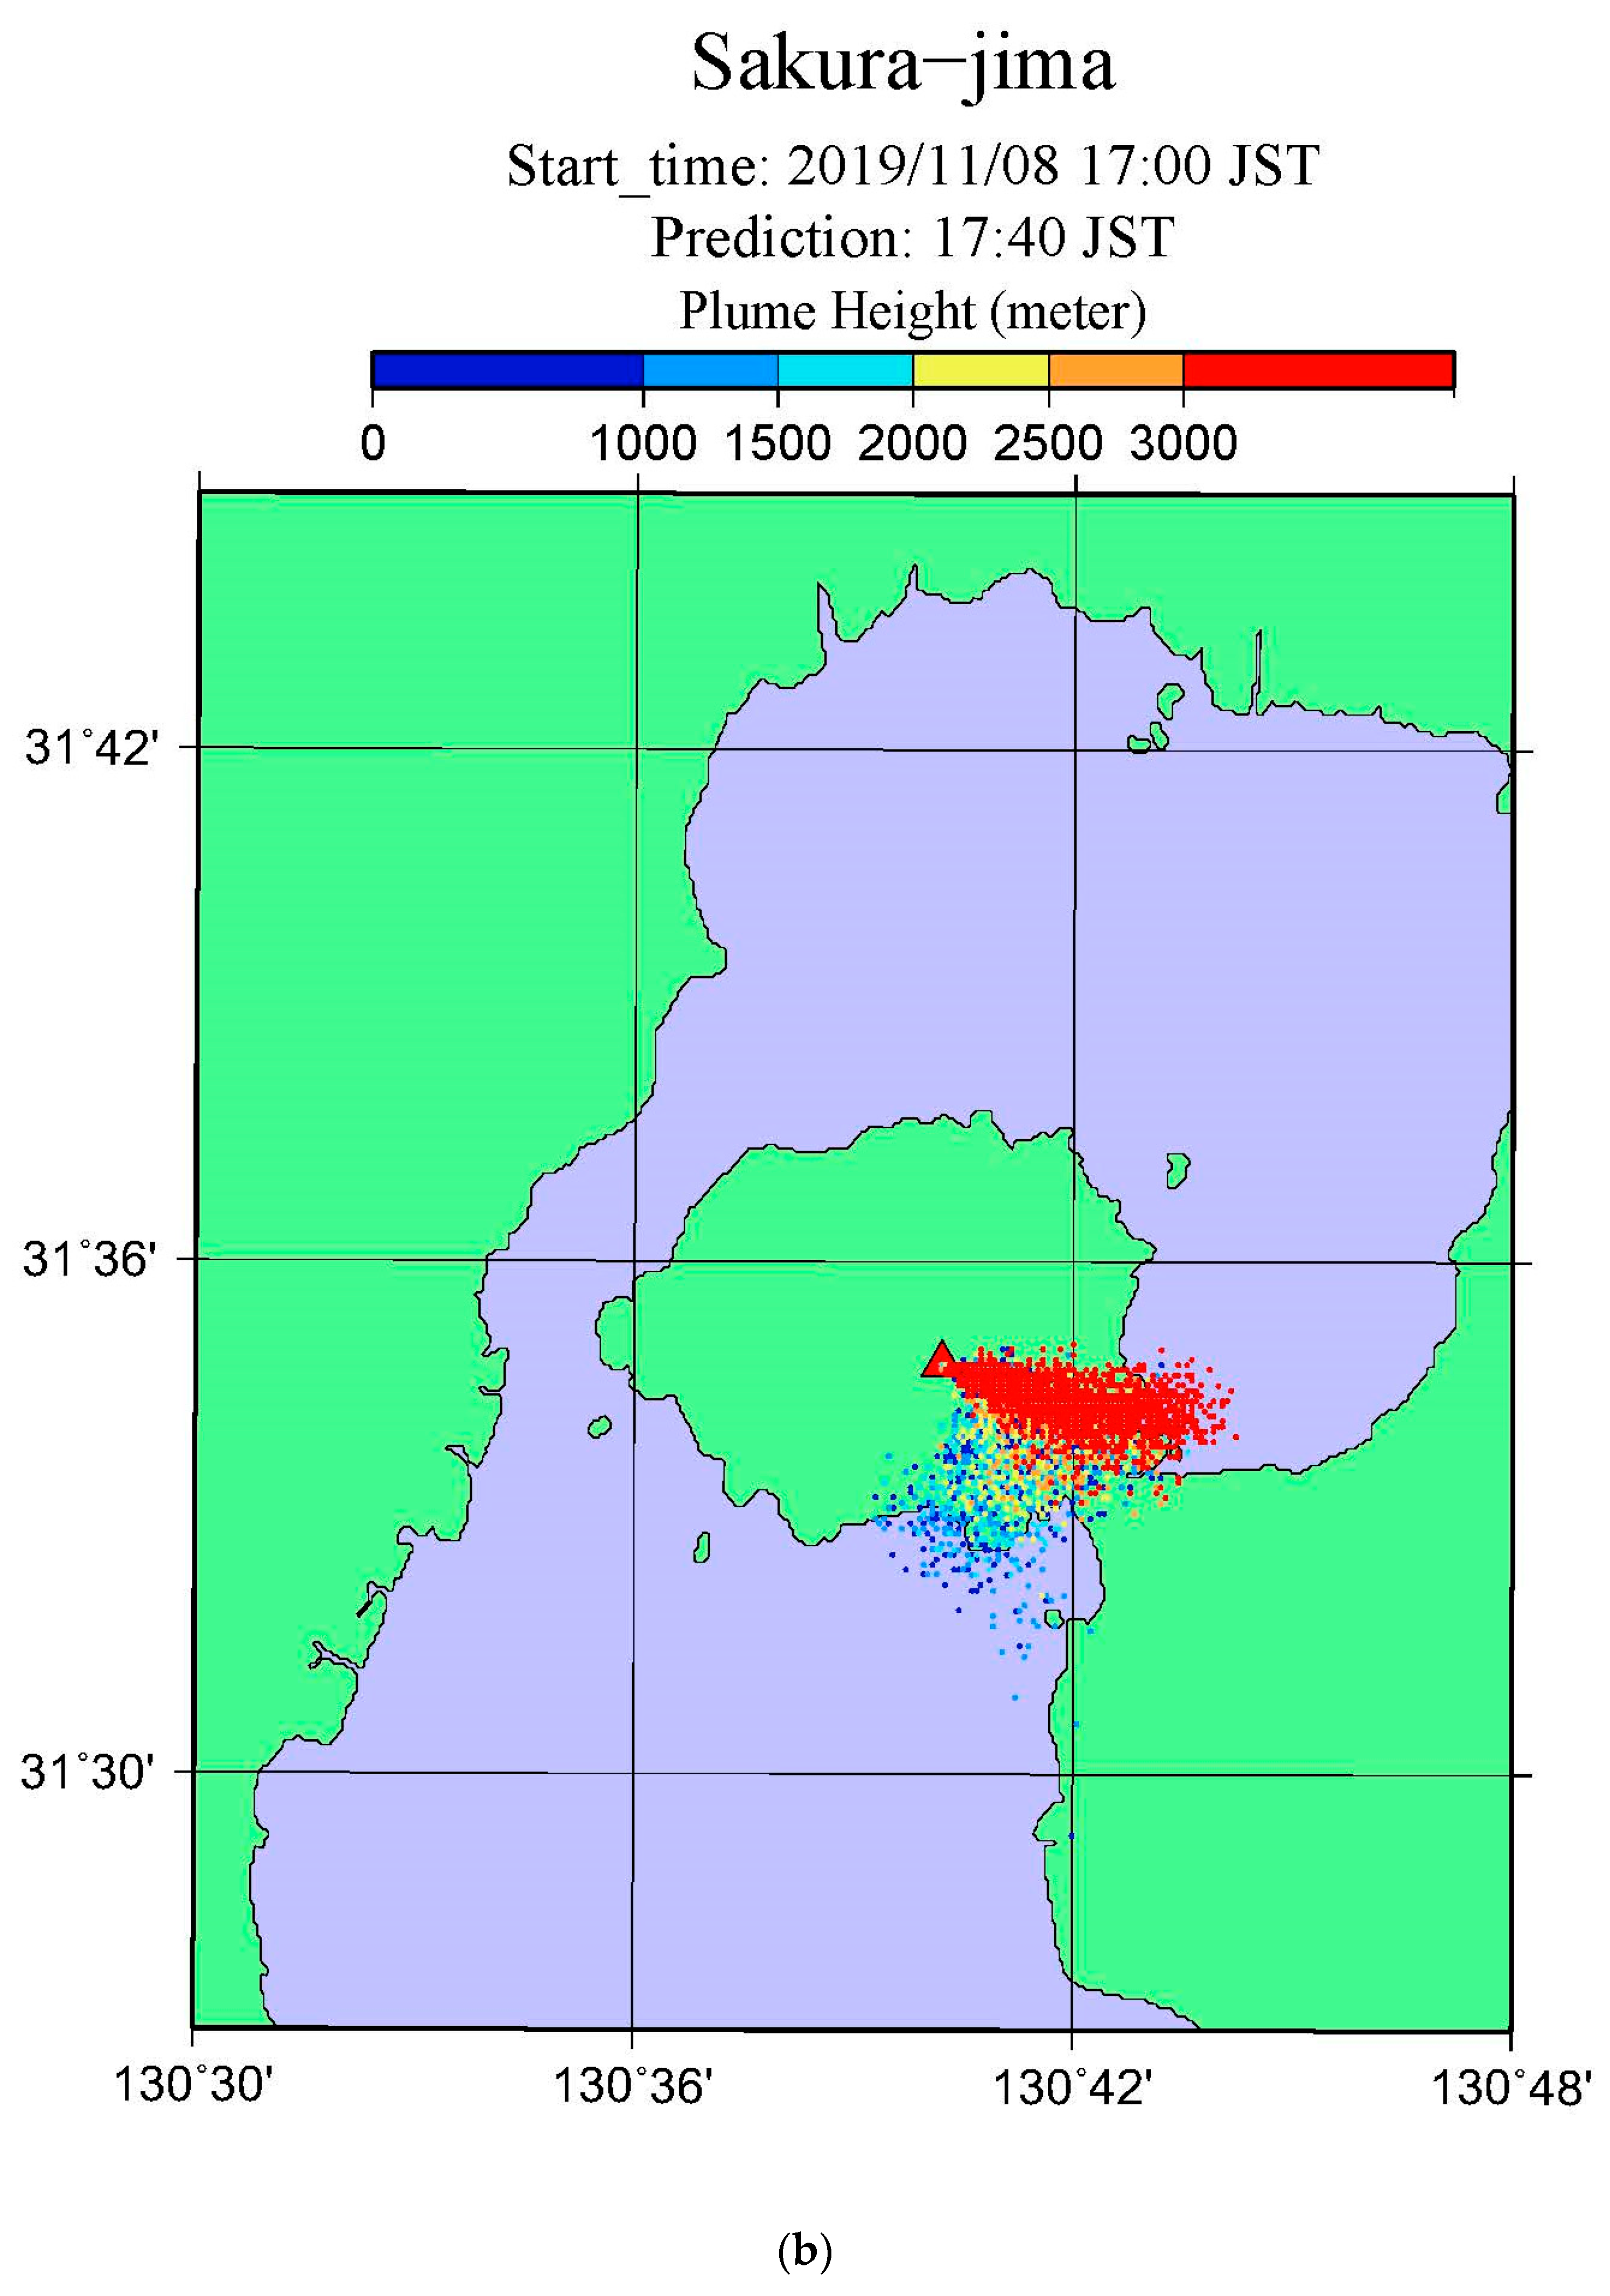
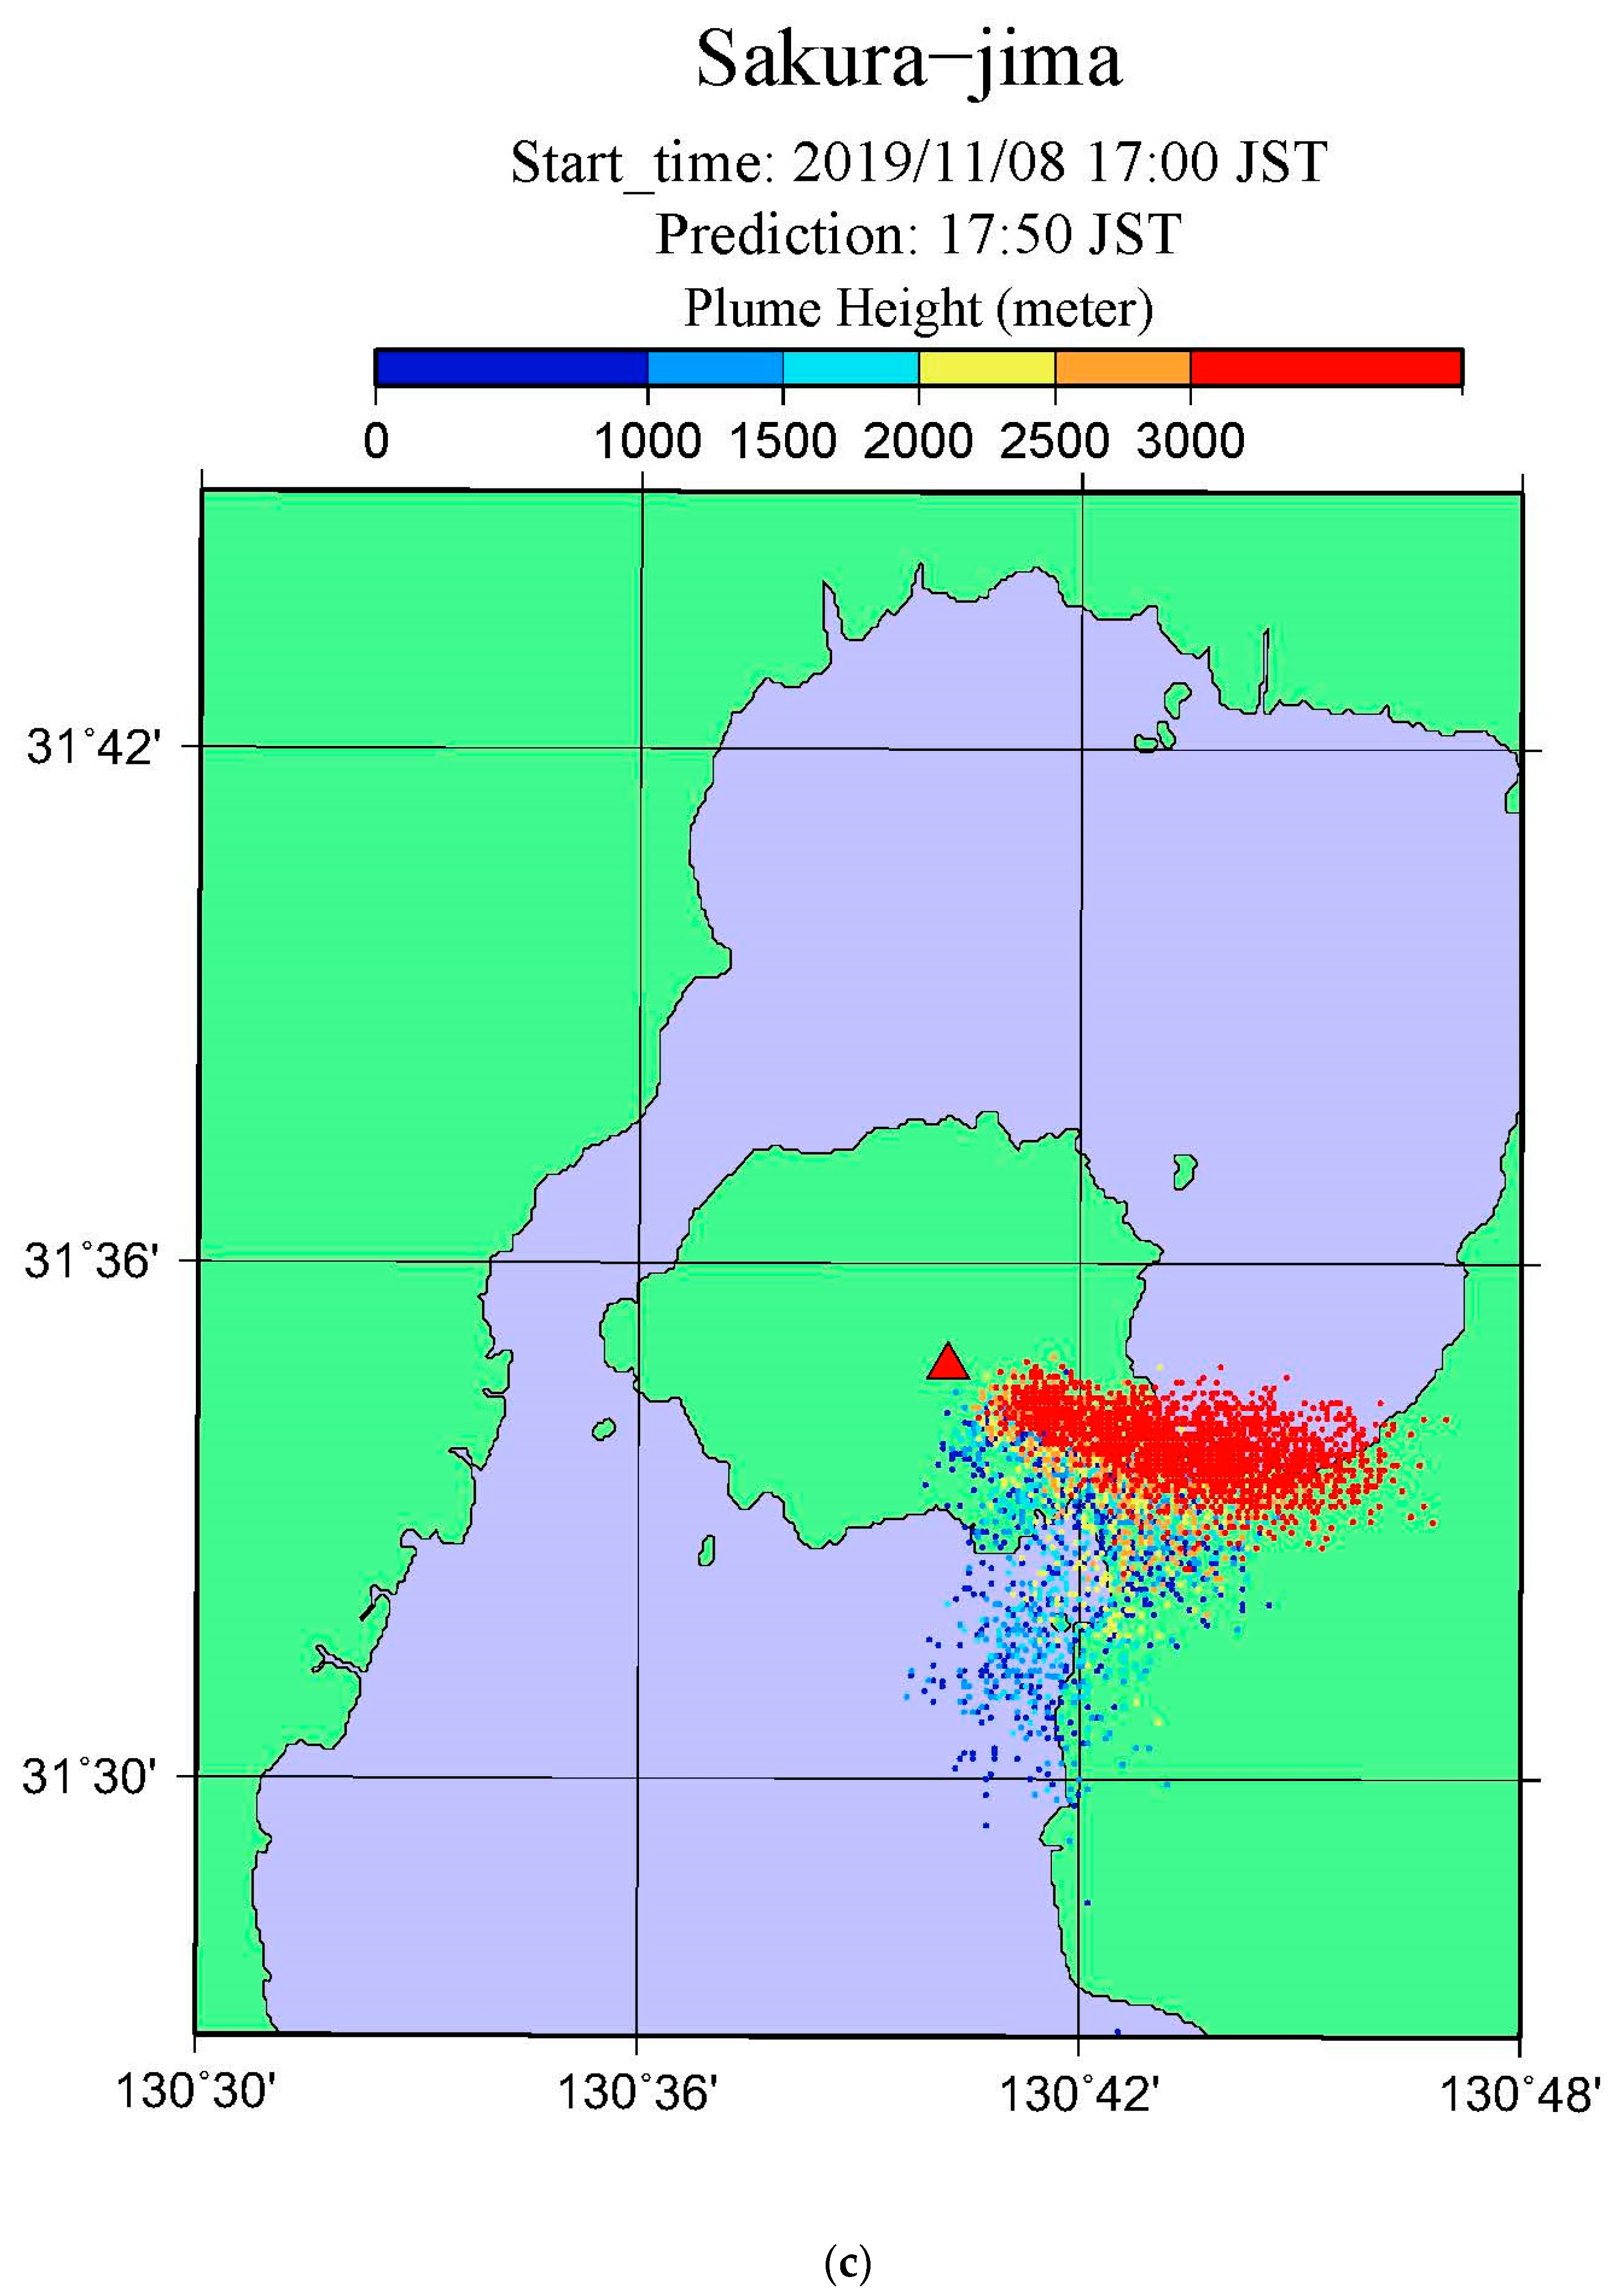
Figure 3 illustrates the results of the PUFF model simulation of the ash plume dispersal on the (X-Y) plane for (a) 17:30, (b) 17:40, (c) 17:50, and (d) 18:00 JST, respectively. The colors indicate different plume heights. The result for 17:30 shows almost a point source of the ash plume drifting to the east by the westerly wind. Some of the lower particles moved south. At 17:40, 10 min after the eruption, the ash plume at the altitude of 3 km and above (red) started to drift eastward, indicating some spread due to the imposed diffusion, while the lower level ash particles (blue) were moving to the south. The result for 17:50, 20 min after, shows further eastward drift, indicating the terminating eruption near the vent. The lower part of the plume (blue) moves south, reaching the coast of Tarumizu. The result for 18:00, 30 min after, shows that the ash plume was already out of Sakurajima. The movement of the ash plume is very different for the lower and upper parts of the ash clouds due to the large wind shear.
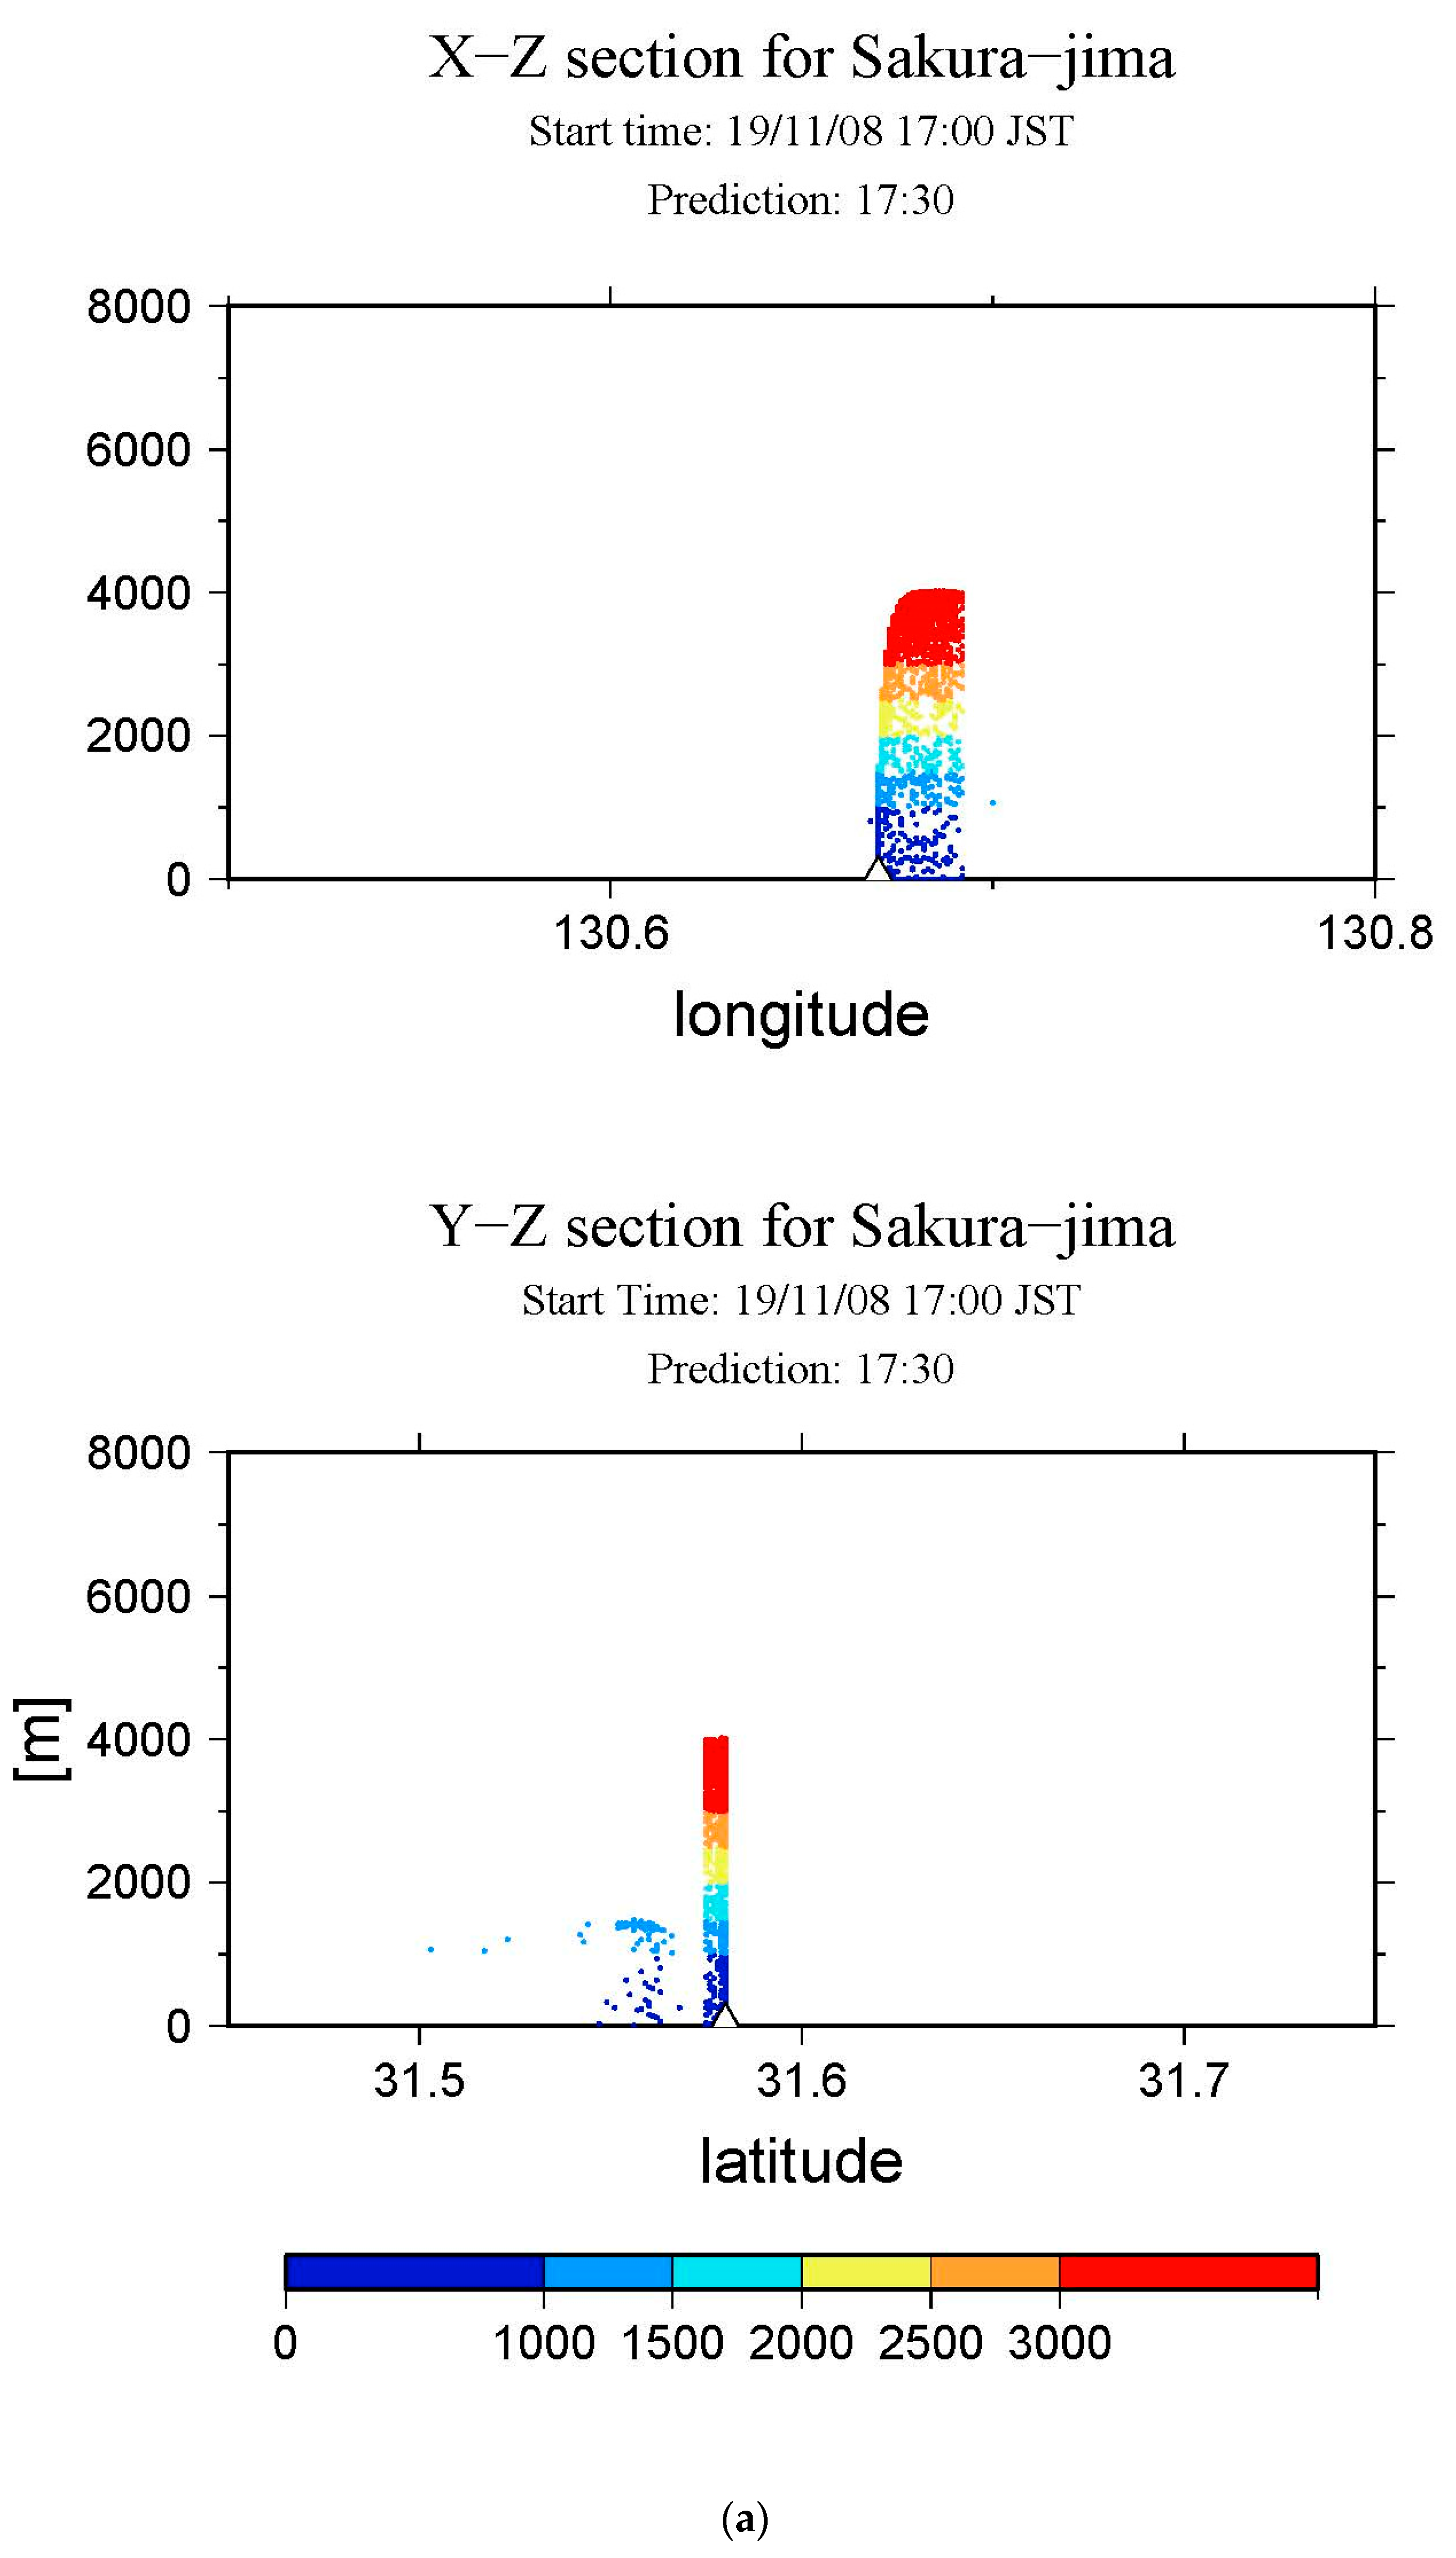
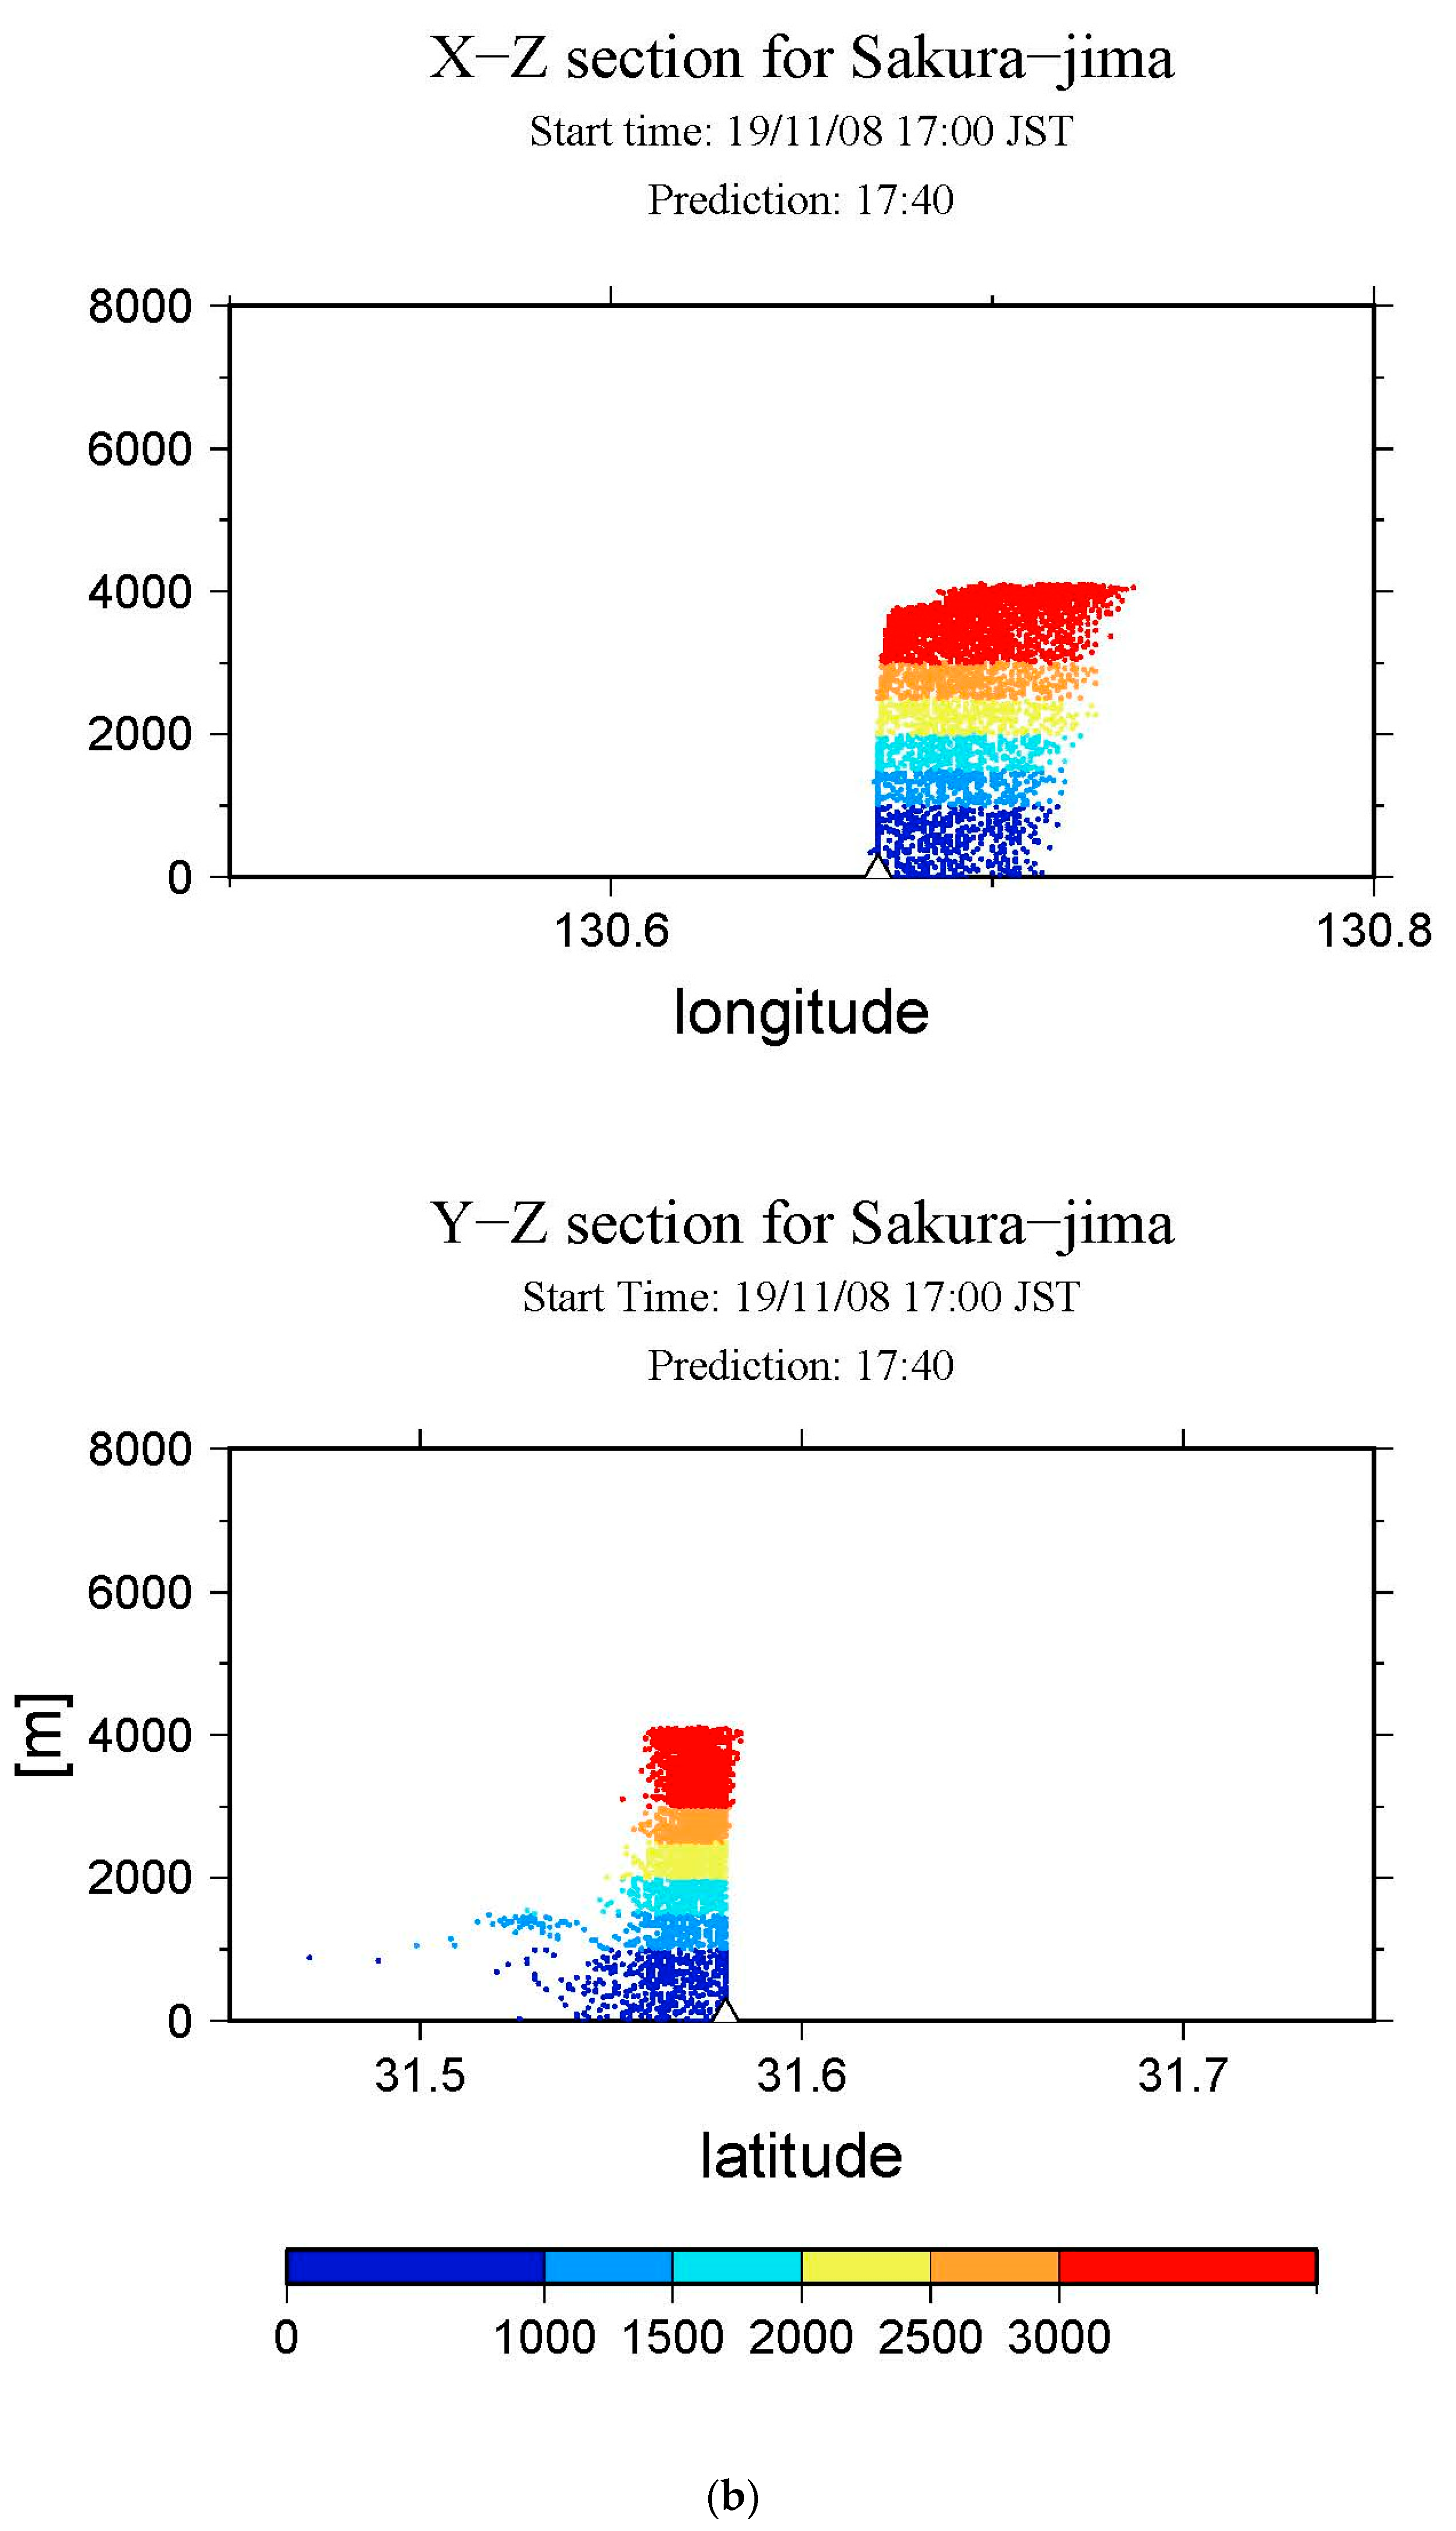
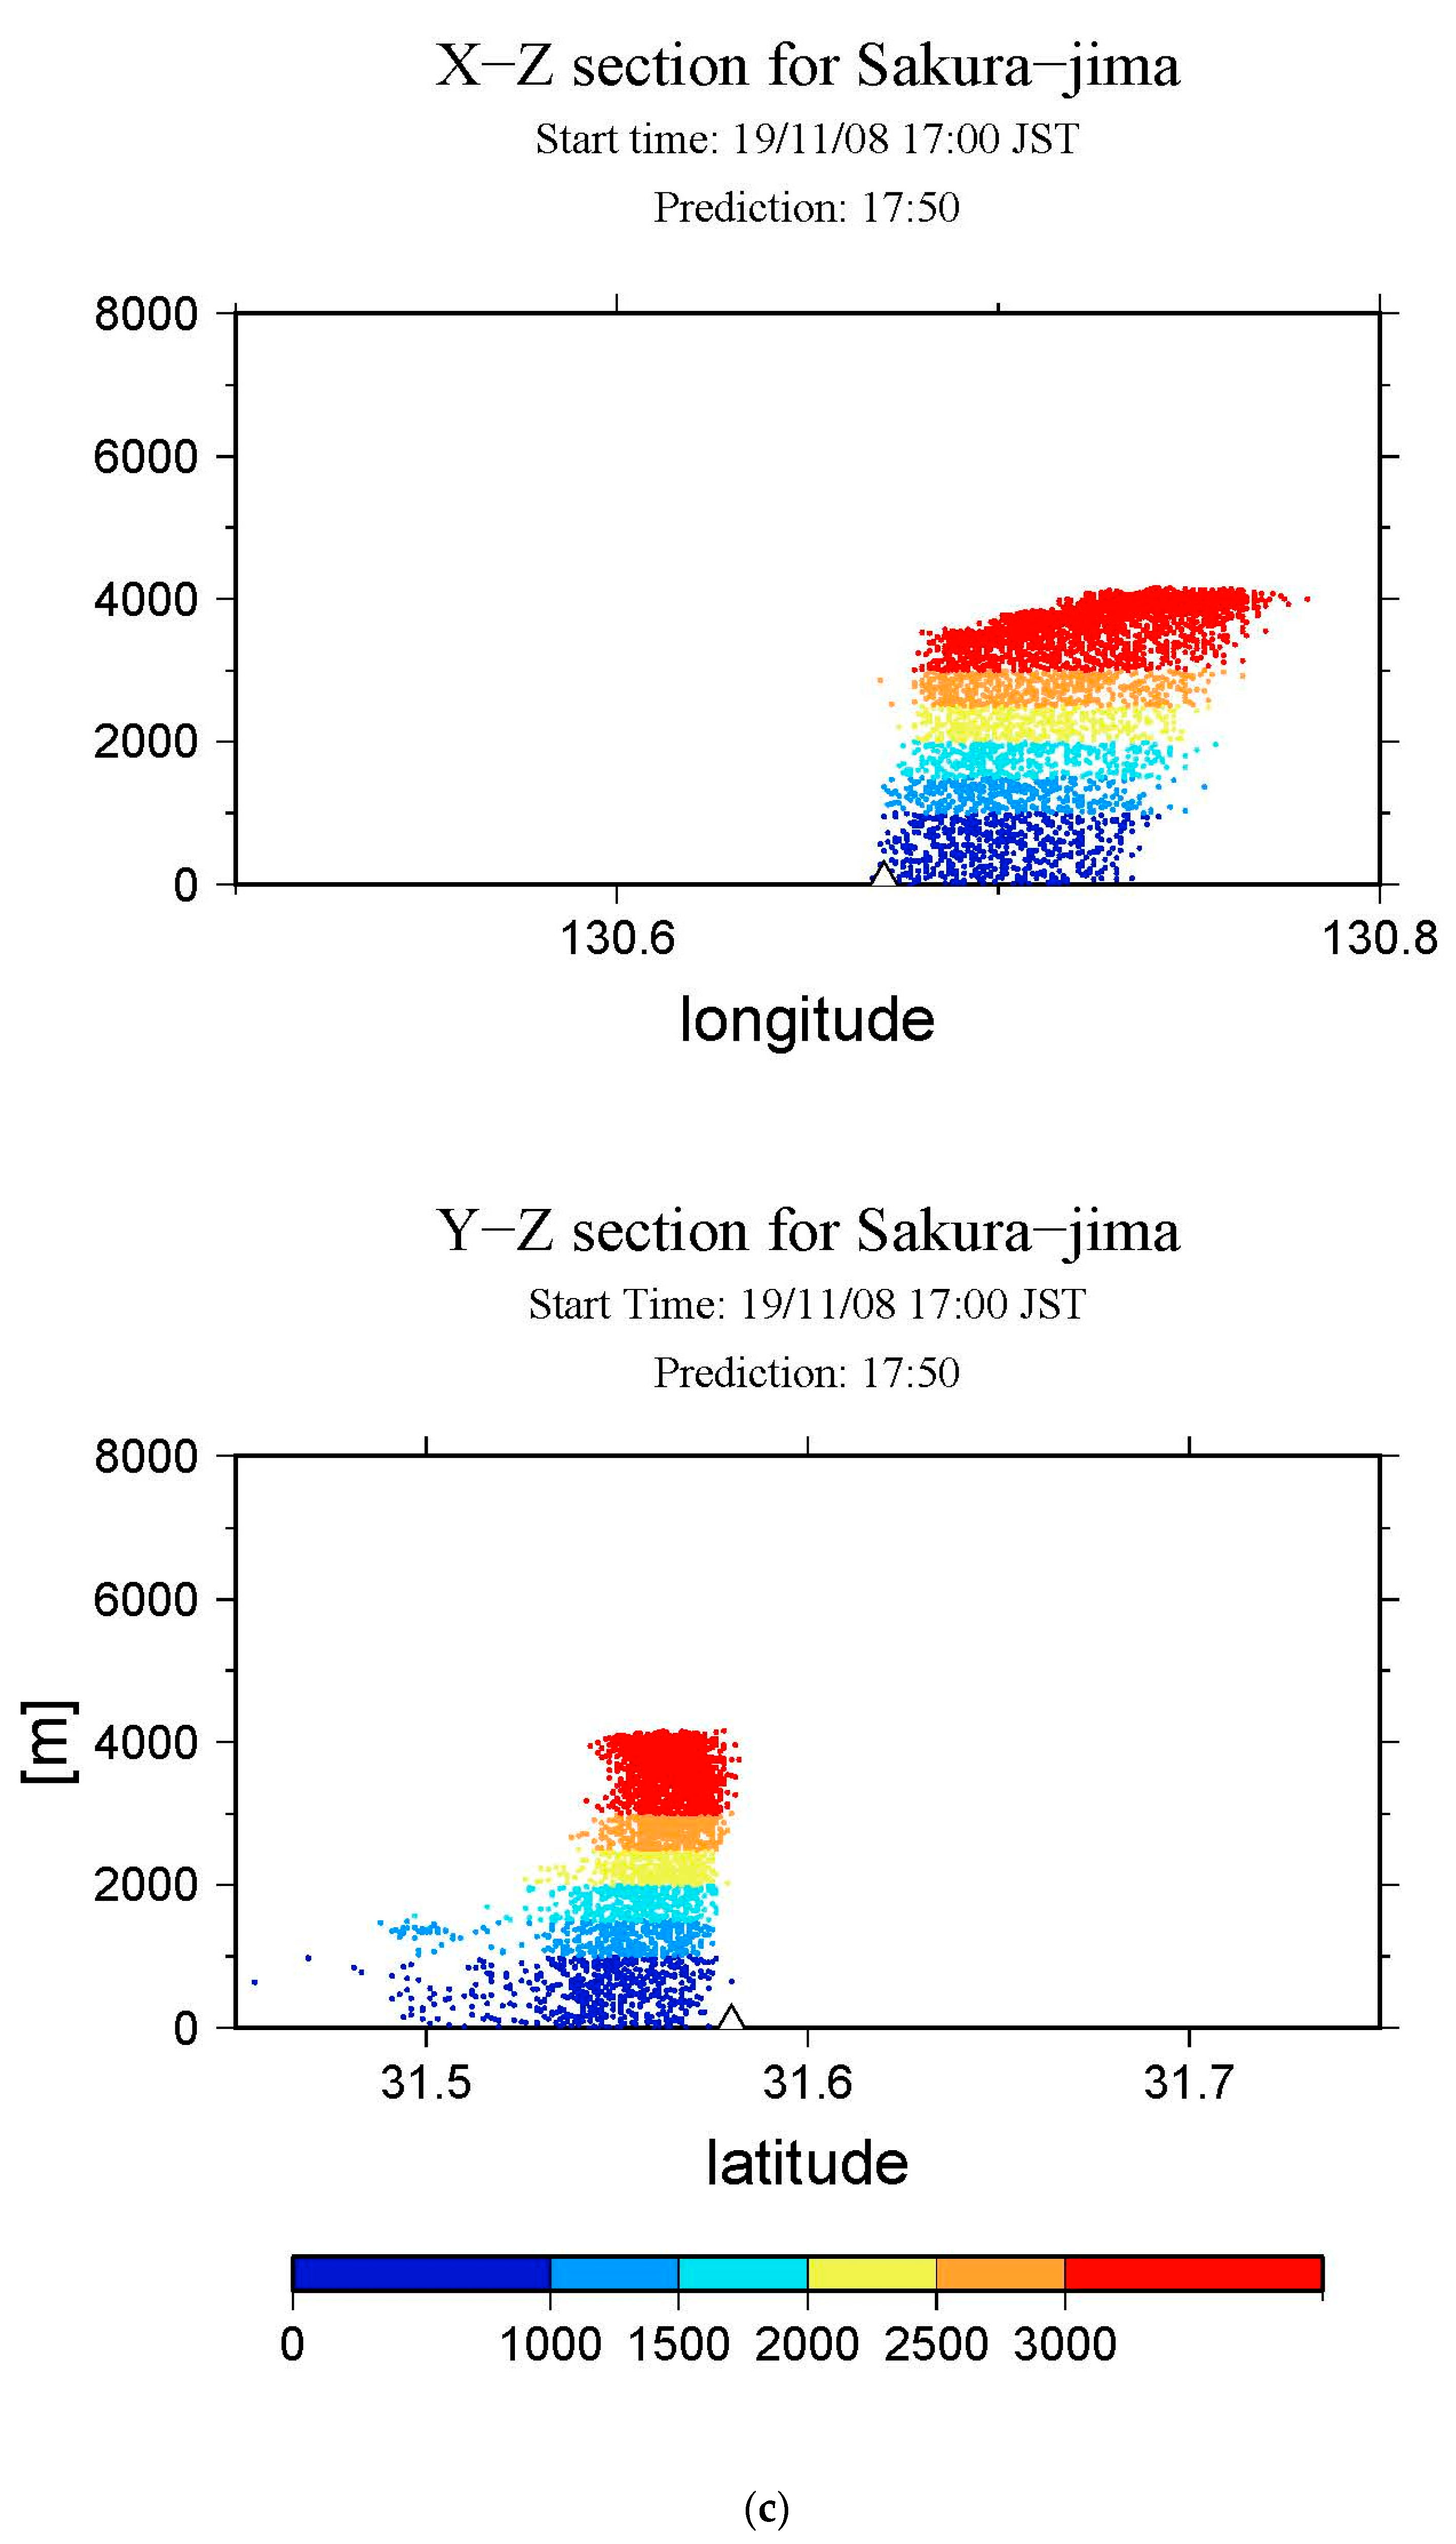
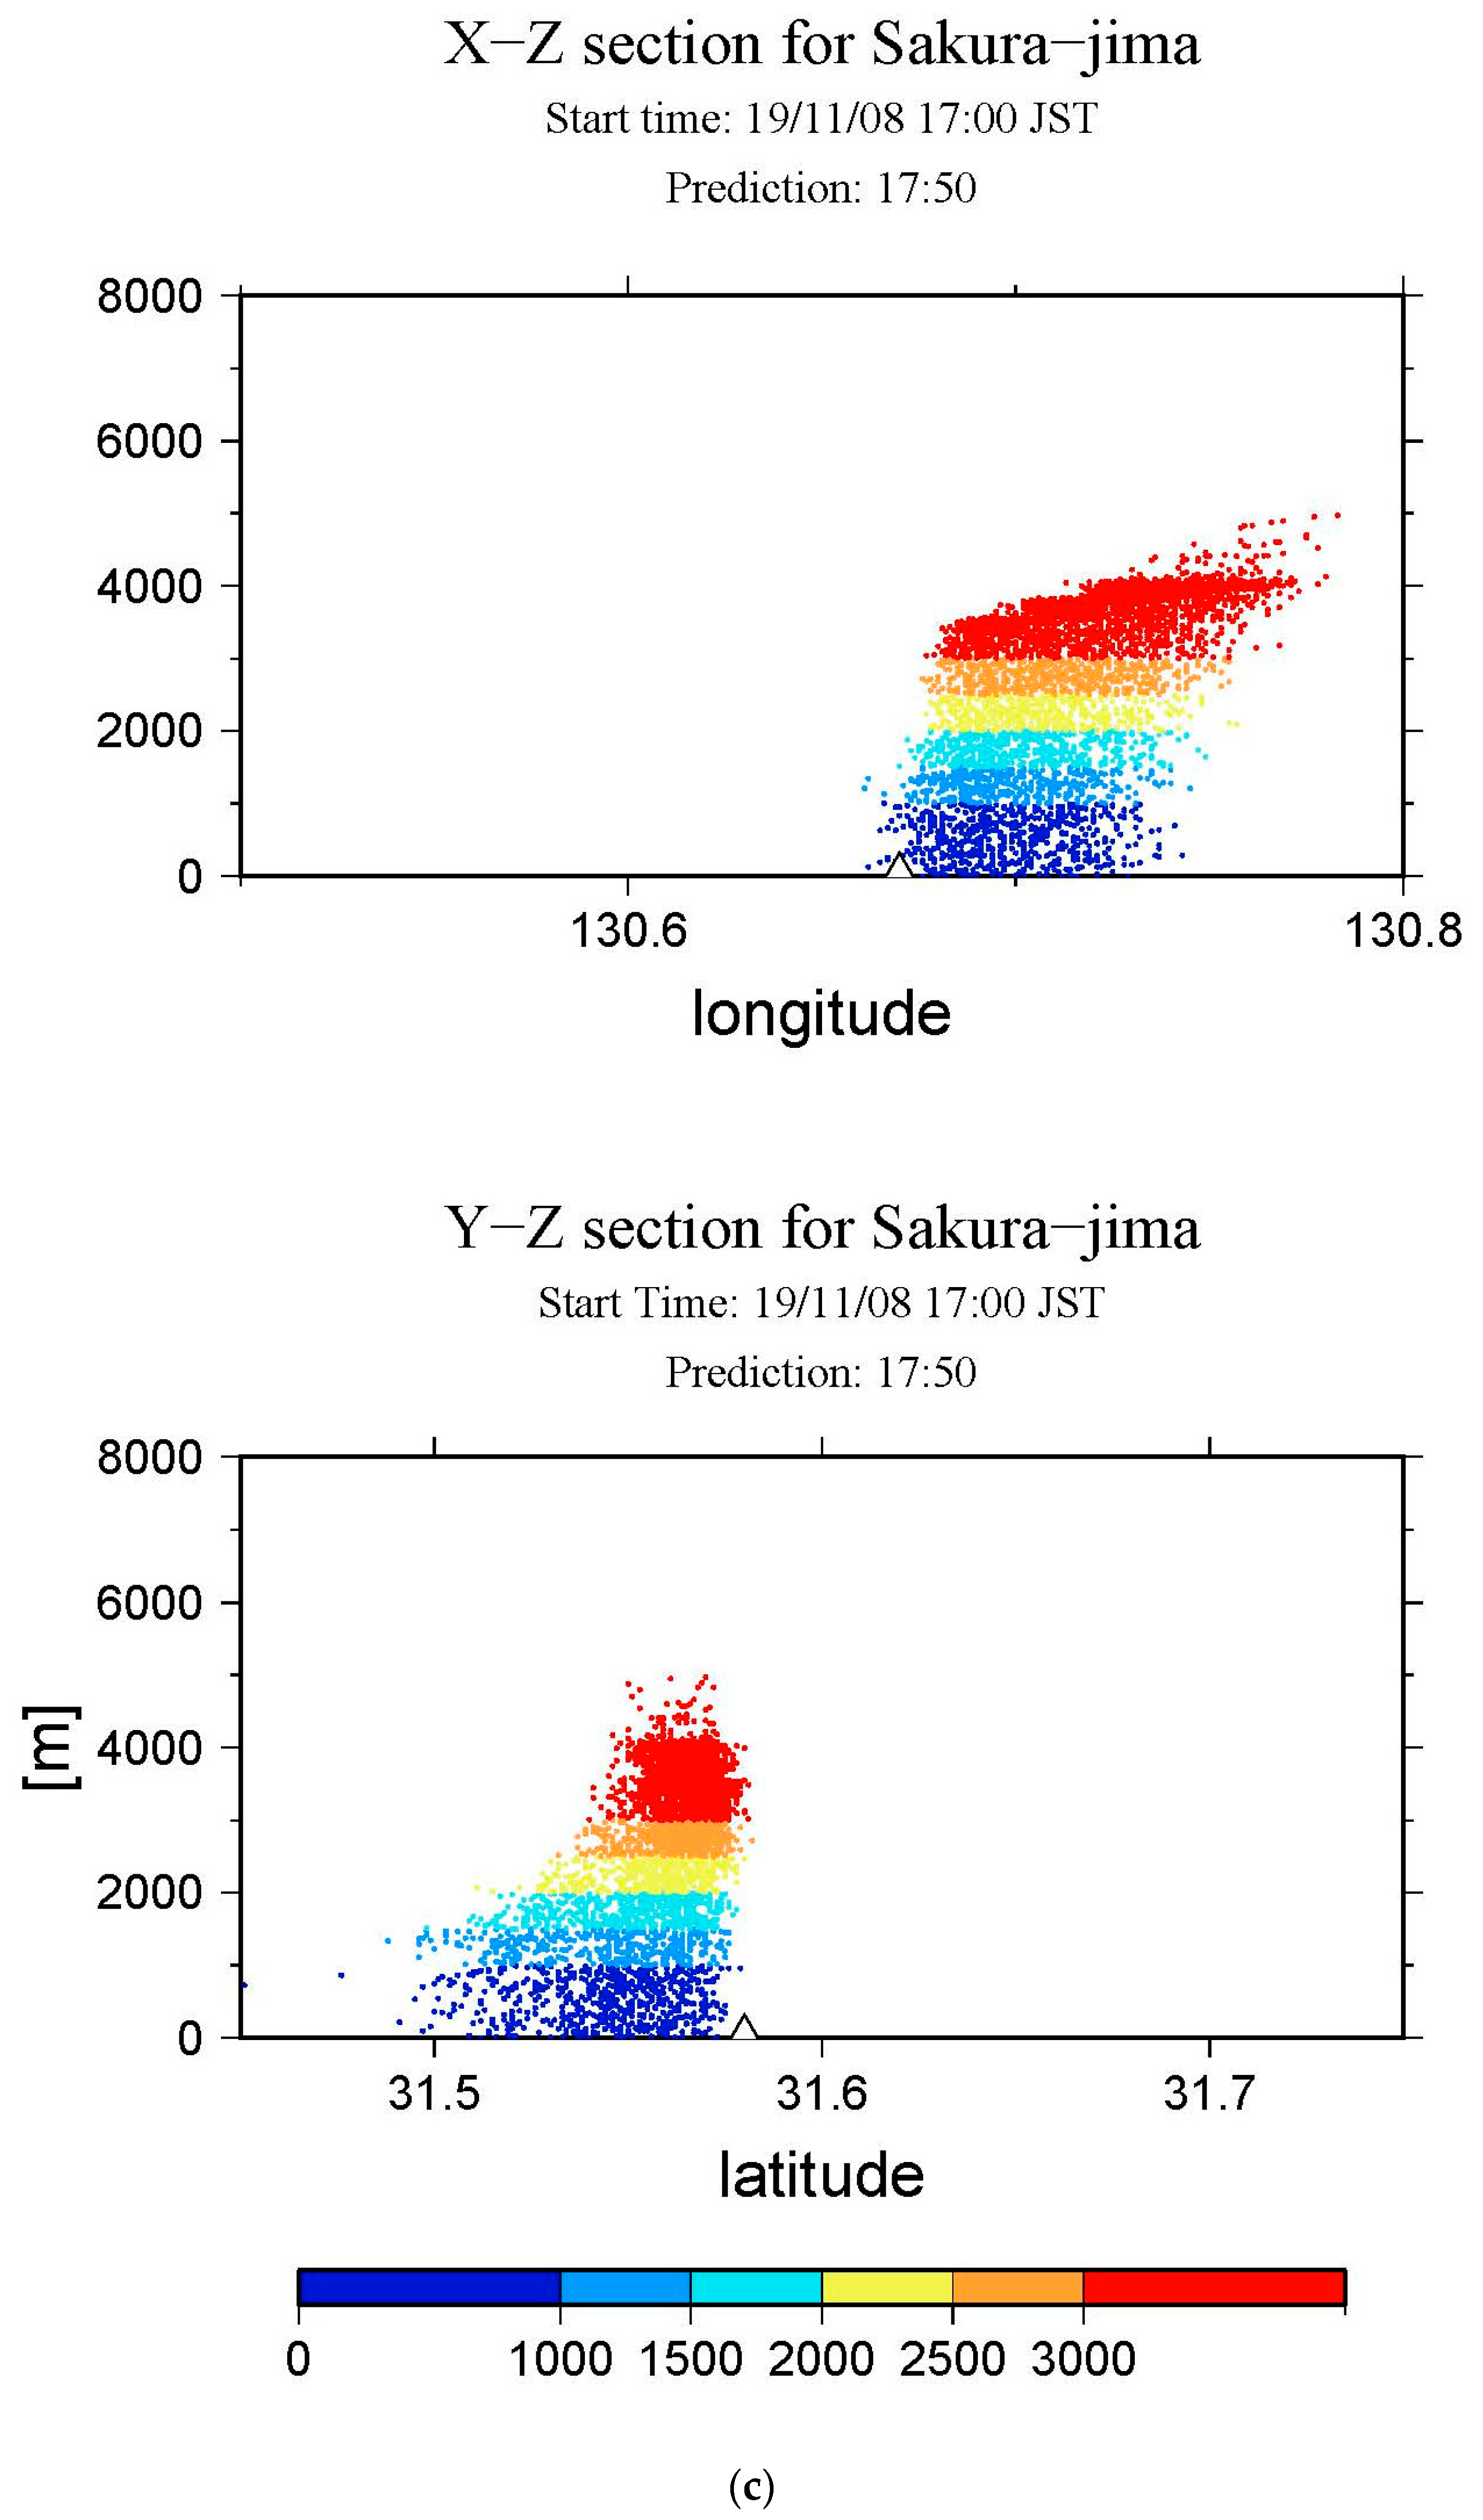
Figure 4 plots longitude-height (X-Z) and meridional-height (Y-Z) cross sections of ash plume dispersal for (a) 17:30, (b) 17:40, (c) 17:50, and (d) 18:00 JST, respectively. The colors of particles indicate a different plume height. At 17:30, the ash plume reached 4000 m a.s.l indicating wider spread in the X-Z plot drifted by the westerly wind. In the Y-Z plot, the plume shows no drift indicating a narrow vertical column. Part of the low-level particles below 1500 m moves faster to south. The eruption continued about 20 min, and terminated by 17:50. By analyzing the series of the plots, it is clear that the ash plume moved to the southwest of the volcano.
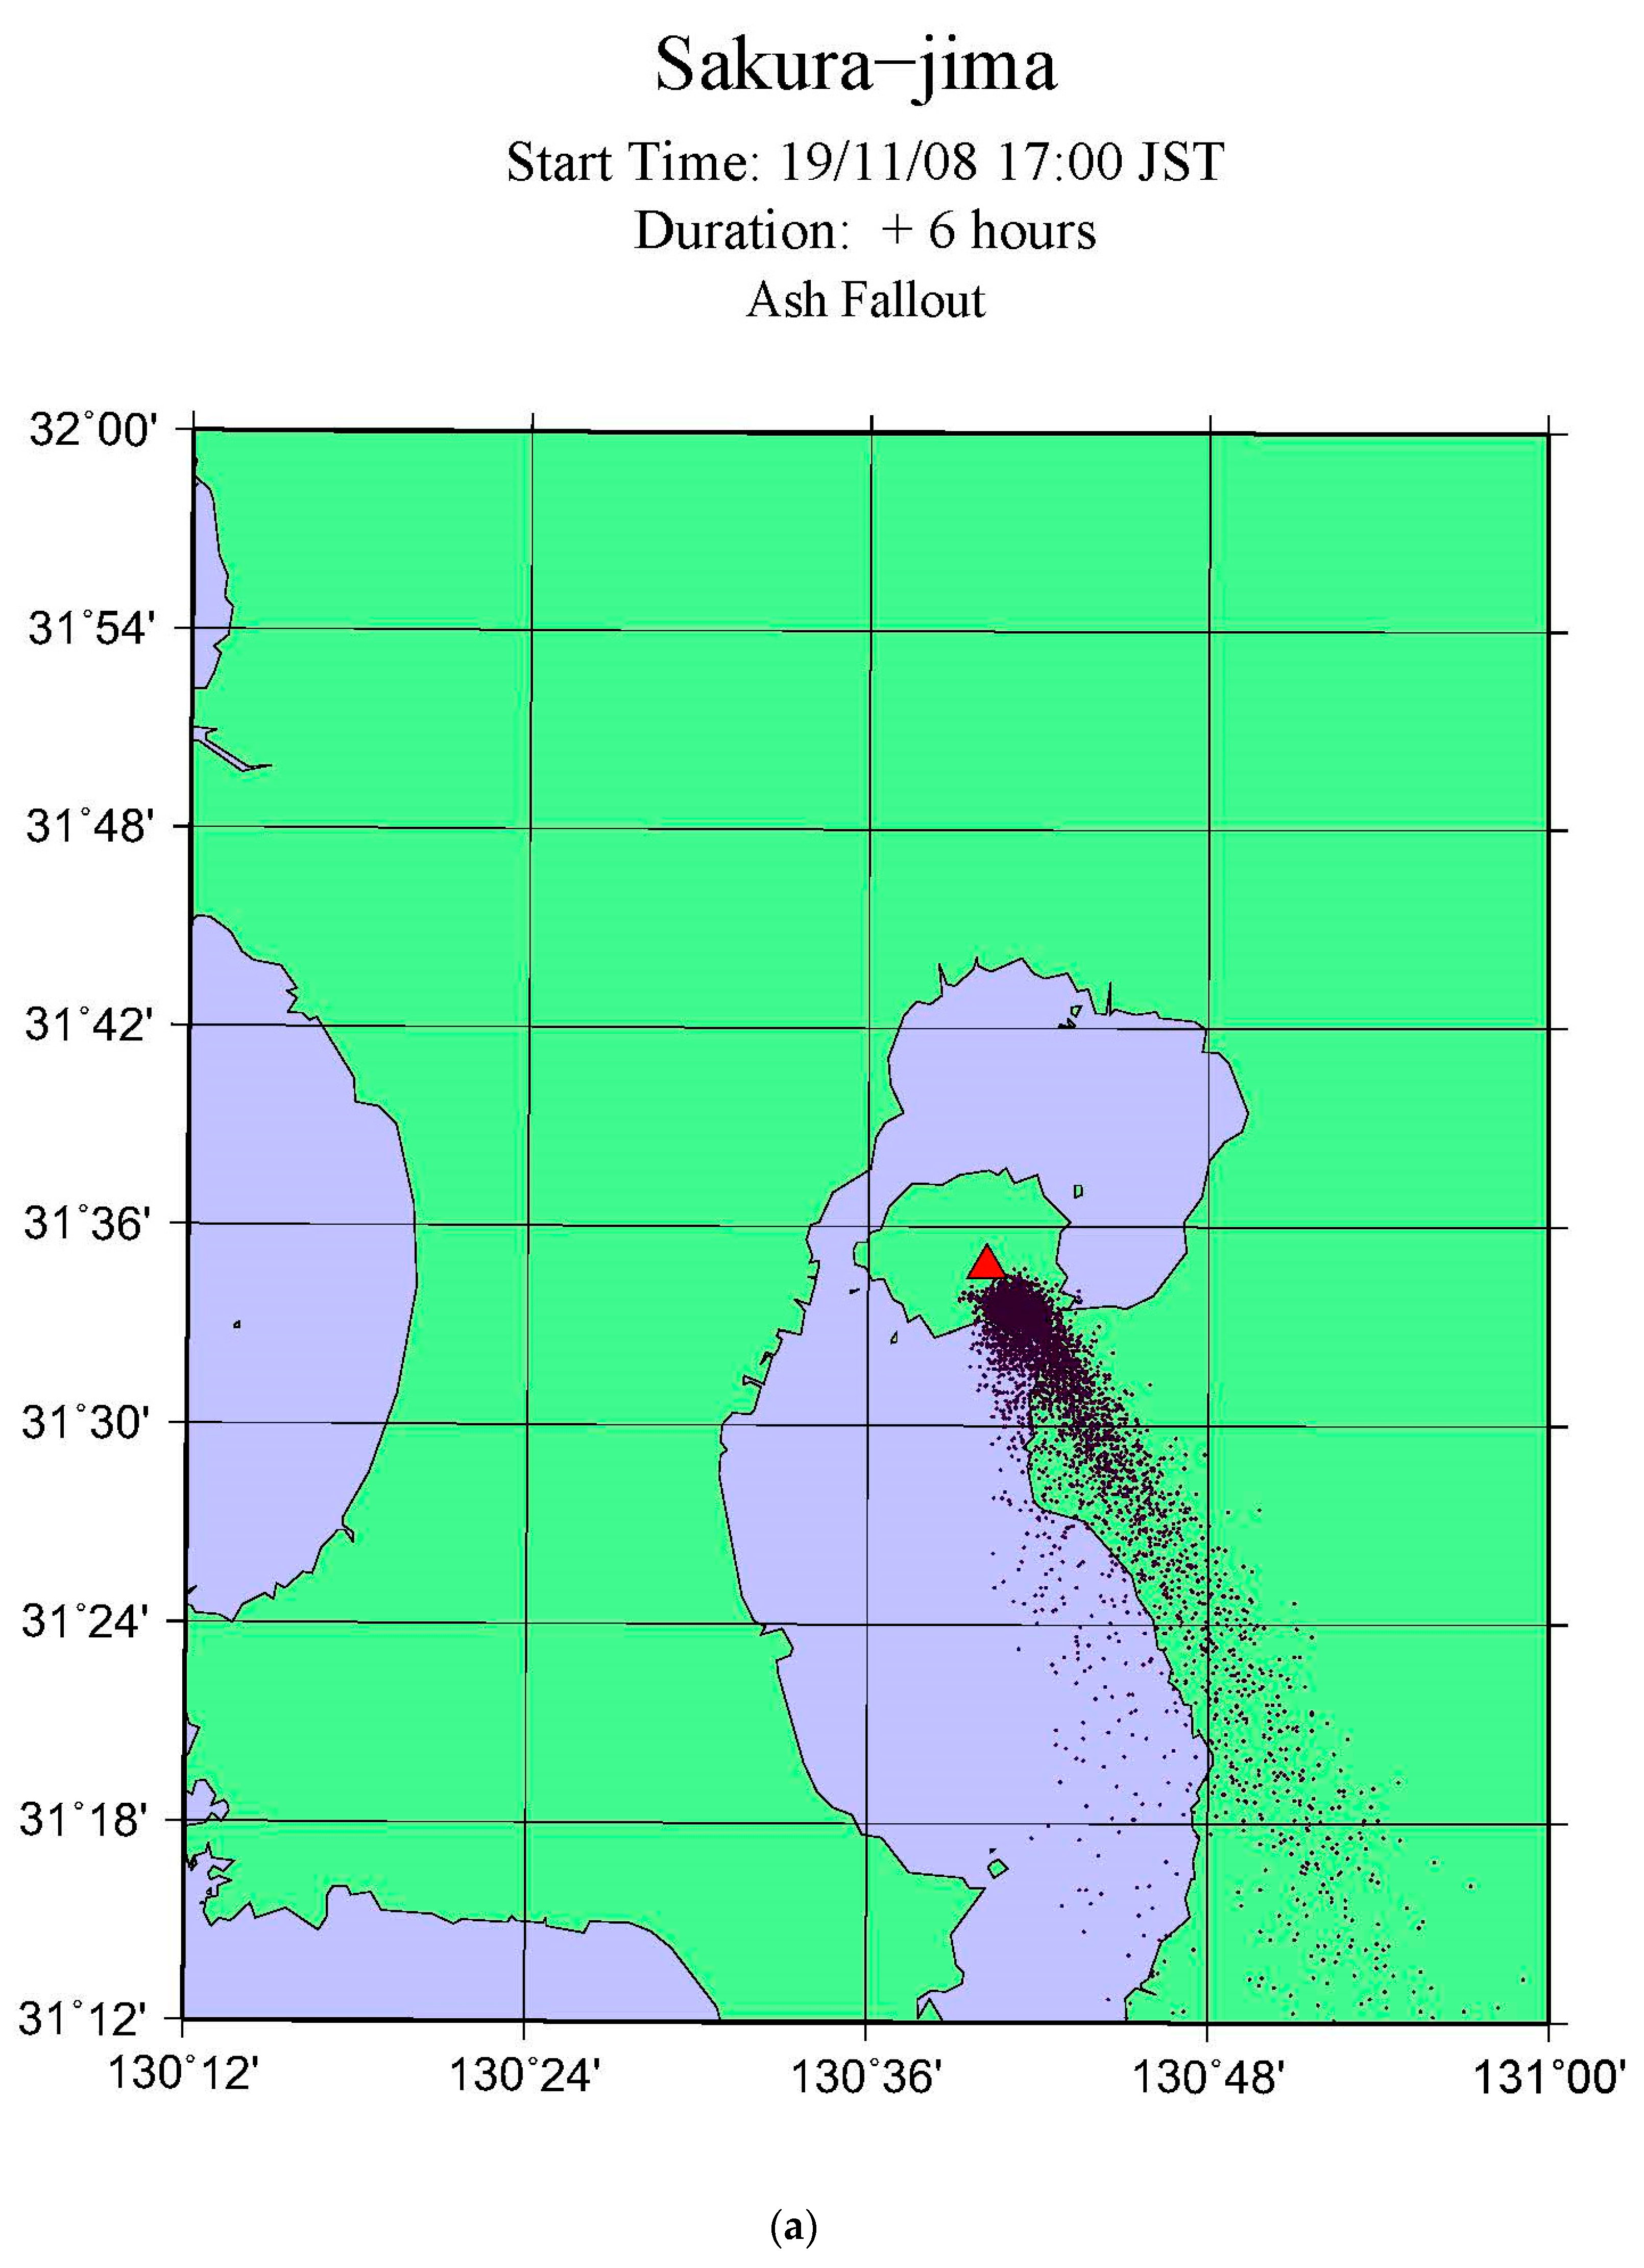
Figure 5a plots the particle distribution for ash fallout accumulated during the 6 h following the eruption. The fallout covers the southeast slope of the Sakurajima volcano extending to Tarumizu city.
Figure 5b plots the ash fallout distribution evaluated from
Figure 5a in the units of g/m
2 with a common log-scale, i.e., 1.0 denotes 10 g/m
2. The contours are calculated by counting the number of fallout particles using 100 m grid meshes. The contours were calibrated using the ground observations as discussed by [
16]. The disdrometer observations indicate ash fallout of 400 g/m
2 at Arimura station (ART) and 100 g/m
2 at Nabeyama station (NAB). Considering the in situ observation, we set the contour adjusting parameter to 3.0 in this study [
16]. According to the results, the ash fallout of 10 g/m
2 extends along major axis of fallout, and 100 g/m
2 appears at Tarumizu area. By applying an appropriate spatial average after taking a common log-scale for the total mass of each grid, we can present the horizontal distribution of ash fallout as in the case of Eulerian model based on a grid system.
4. Result of the PUFF Model Simulation Using the MP Radar Data
In this section, the PUFF model simulation is conducted using the MP radar data observed at 17:28 JST. The X-band MP radar newly installed at SVRC (location: 31.589 N, 130.60 E, elevation: 44 m) provides information of three-dimensional ash dispersal. Antenna scan mode is based on a Plan Position Indicator (PPI) scan at an elevation angle of 16 degrees to observe the horizontal section, and Range Height Indicator (RHI) scan for observing the vertical structure. One scan series took about 2 min within 30 km distance. Spatial resolution of observed data is 75 m in a range direction. The beam width is about 20 m if the antenna elevation angle is 16 degrees over the crater and about 40 m if this angle is 60 degrees. There are 4 ranges of the reflectivity factor Zhh larger than 10 dBZ, 20 dBZ, 30 dBZ, and 40 dBZ, respectively.
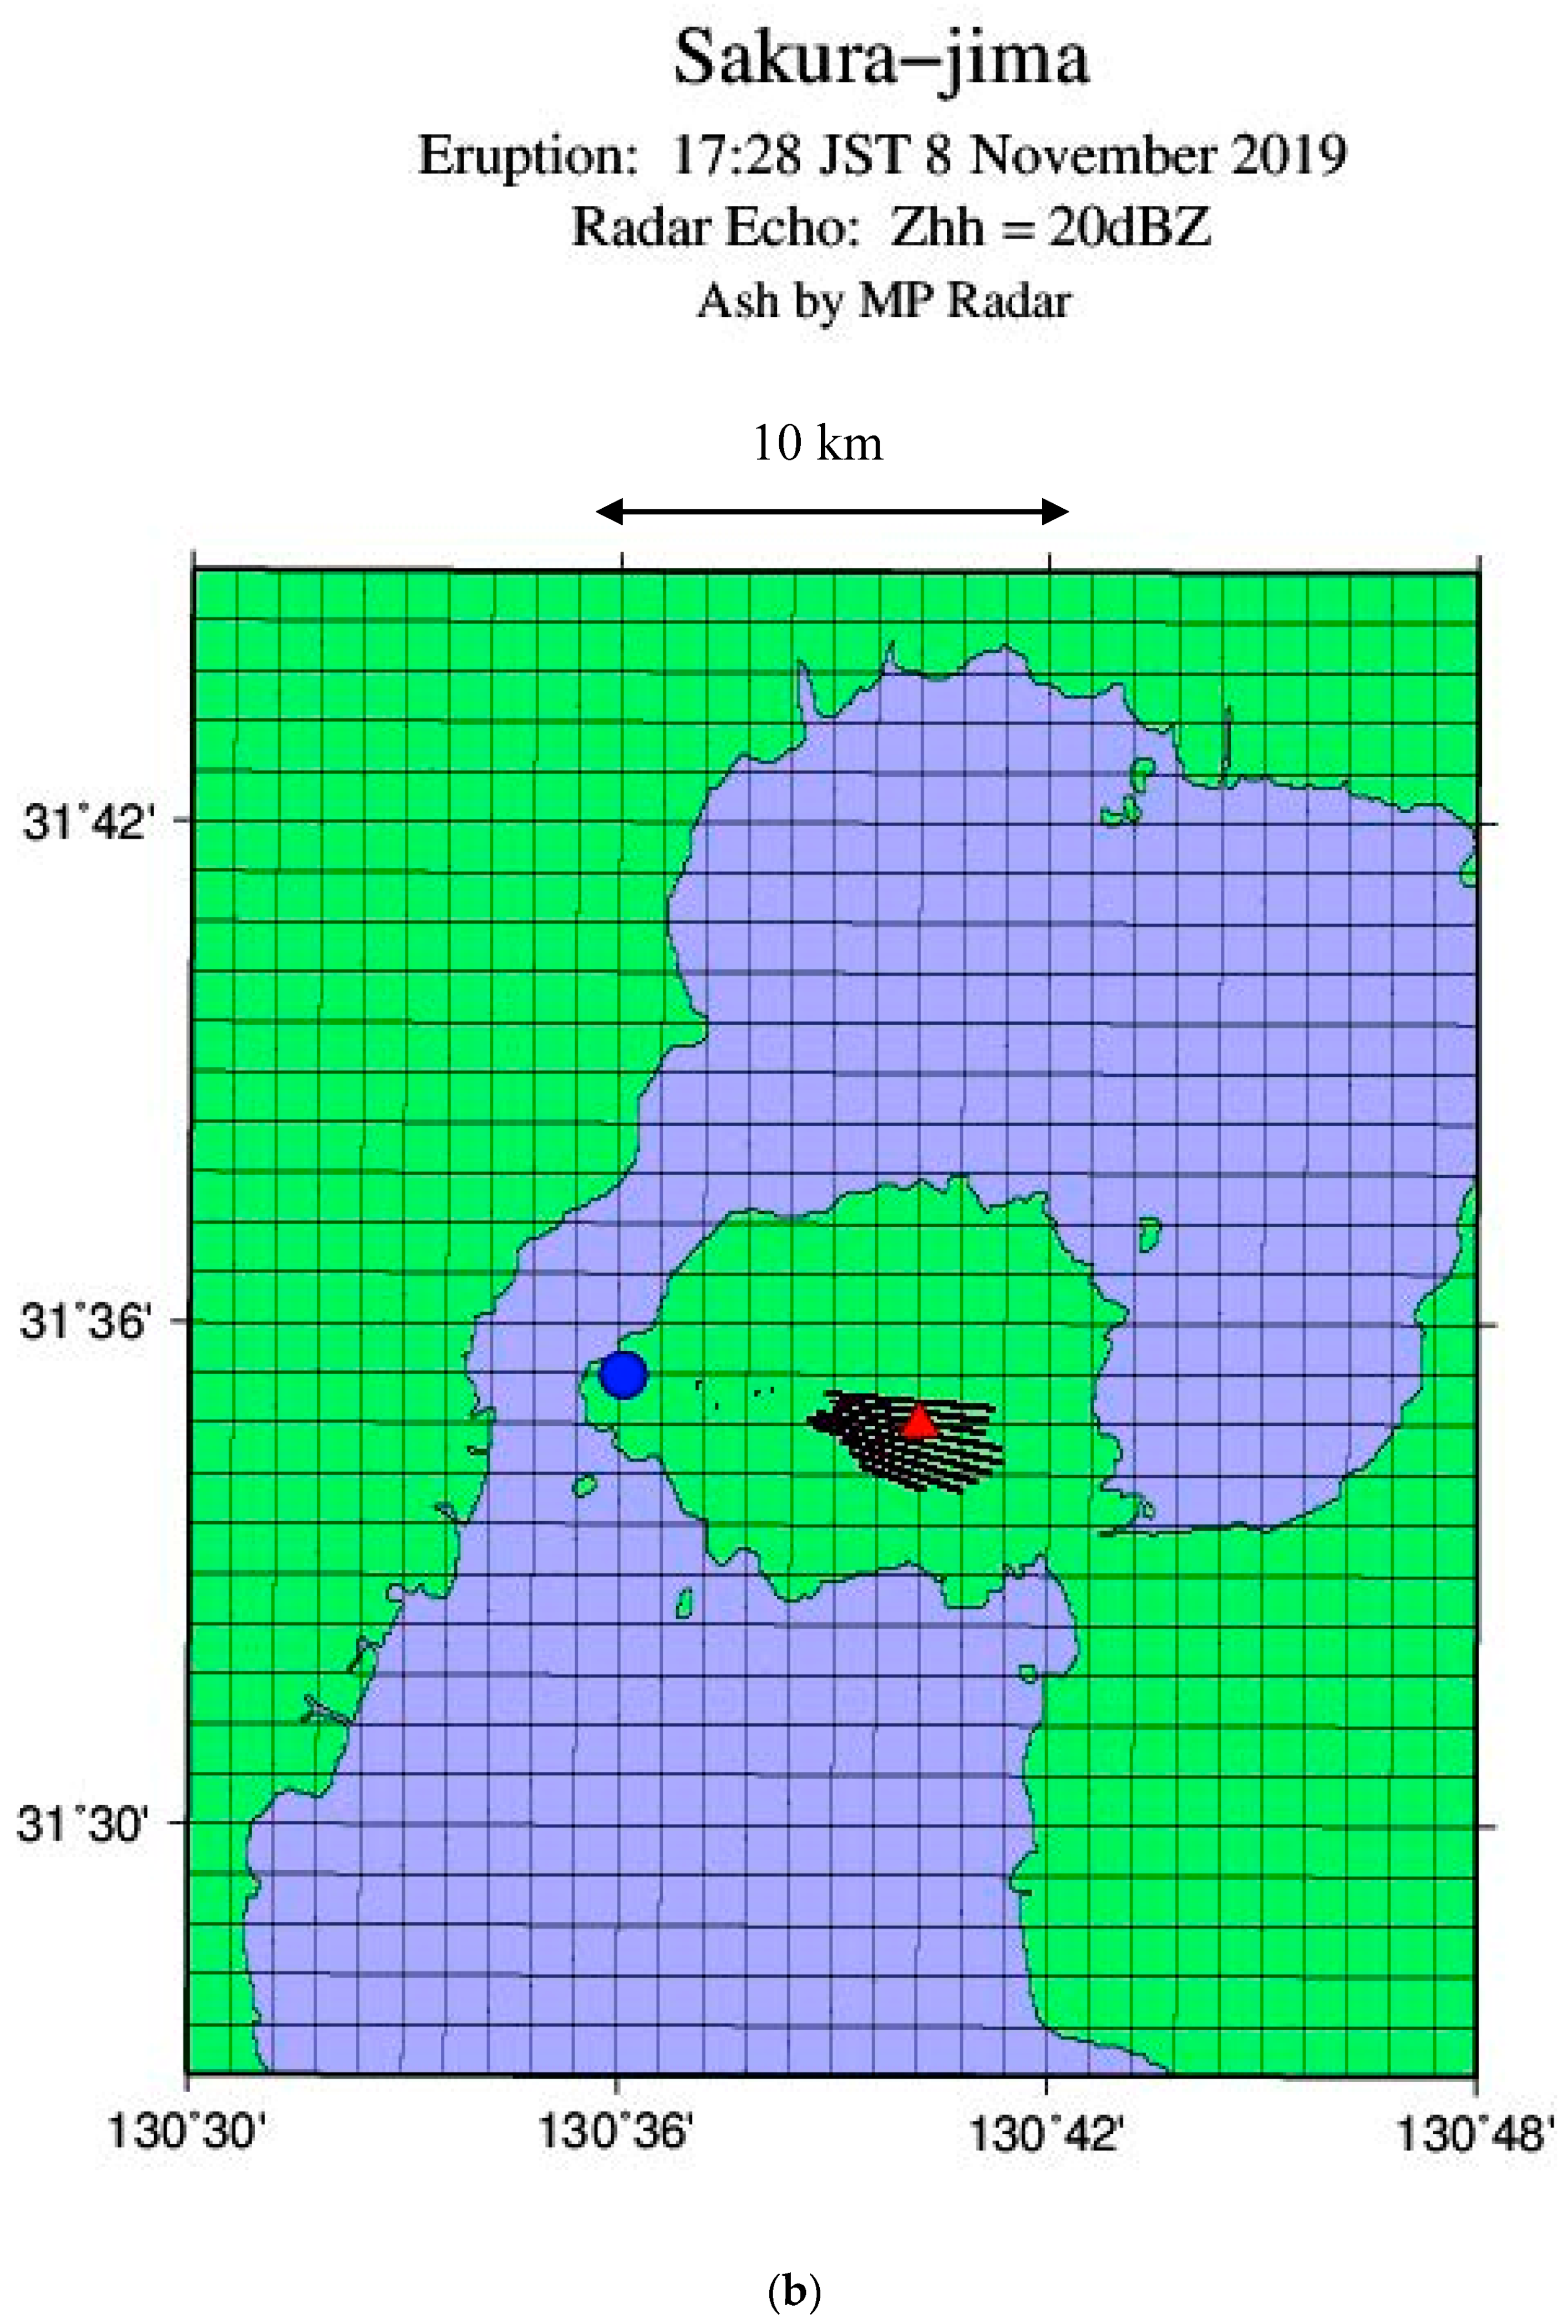
Figure 6 shows horizontal distributions of all ash particles projected onto the ground for the reflectivity factors larger than 10 dBZ and 20 dBZ at 17:28 JST. The figures for 30 dBZ and 40 dBZ are similar to that of 20 dBZ, but show narrower areas. A fan shape of ash dispersal is plotted for 10 dBZ centered at the SVRC radar site, whereas the distribution is restricted around the crater for 20 dBZ and no particle is detected near the SVRC radar site. Ash particles are scattered along the line segments of the radar observation.
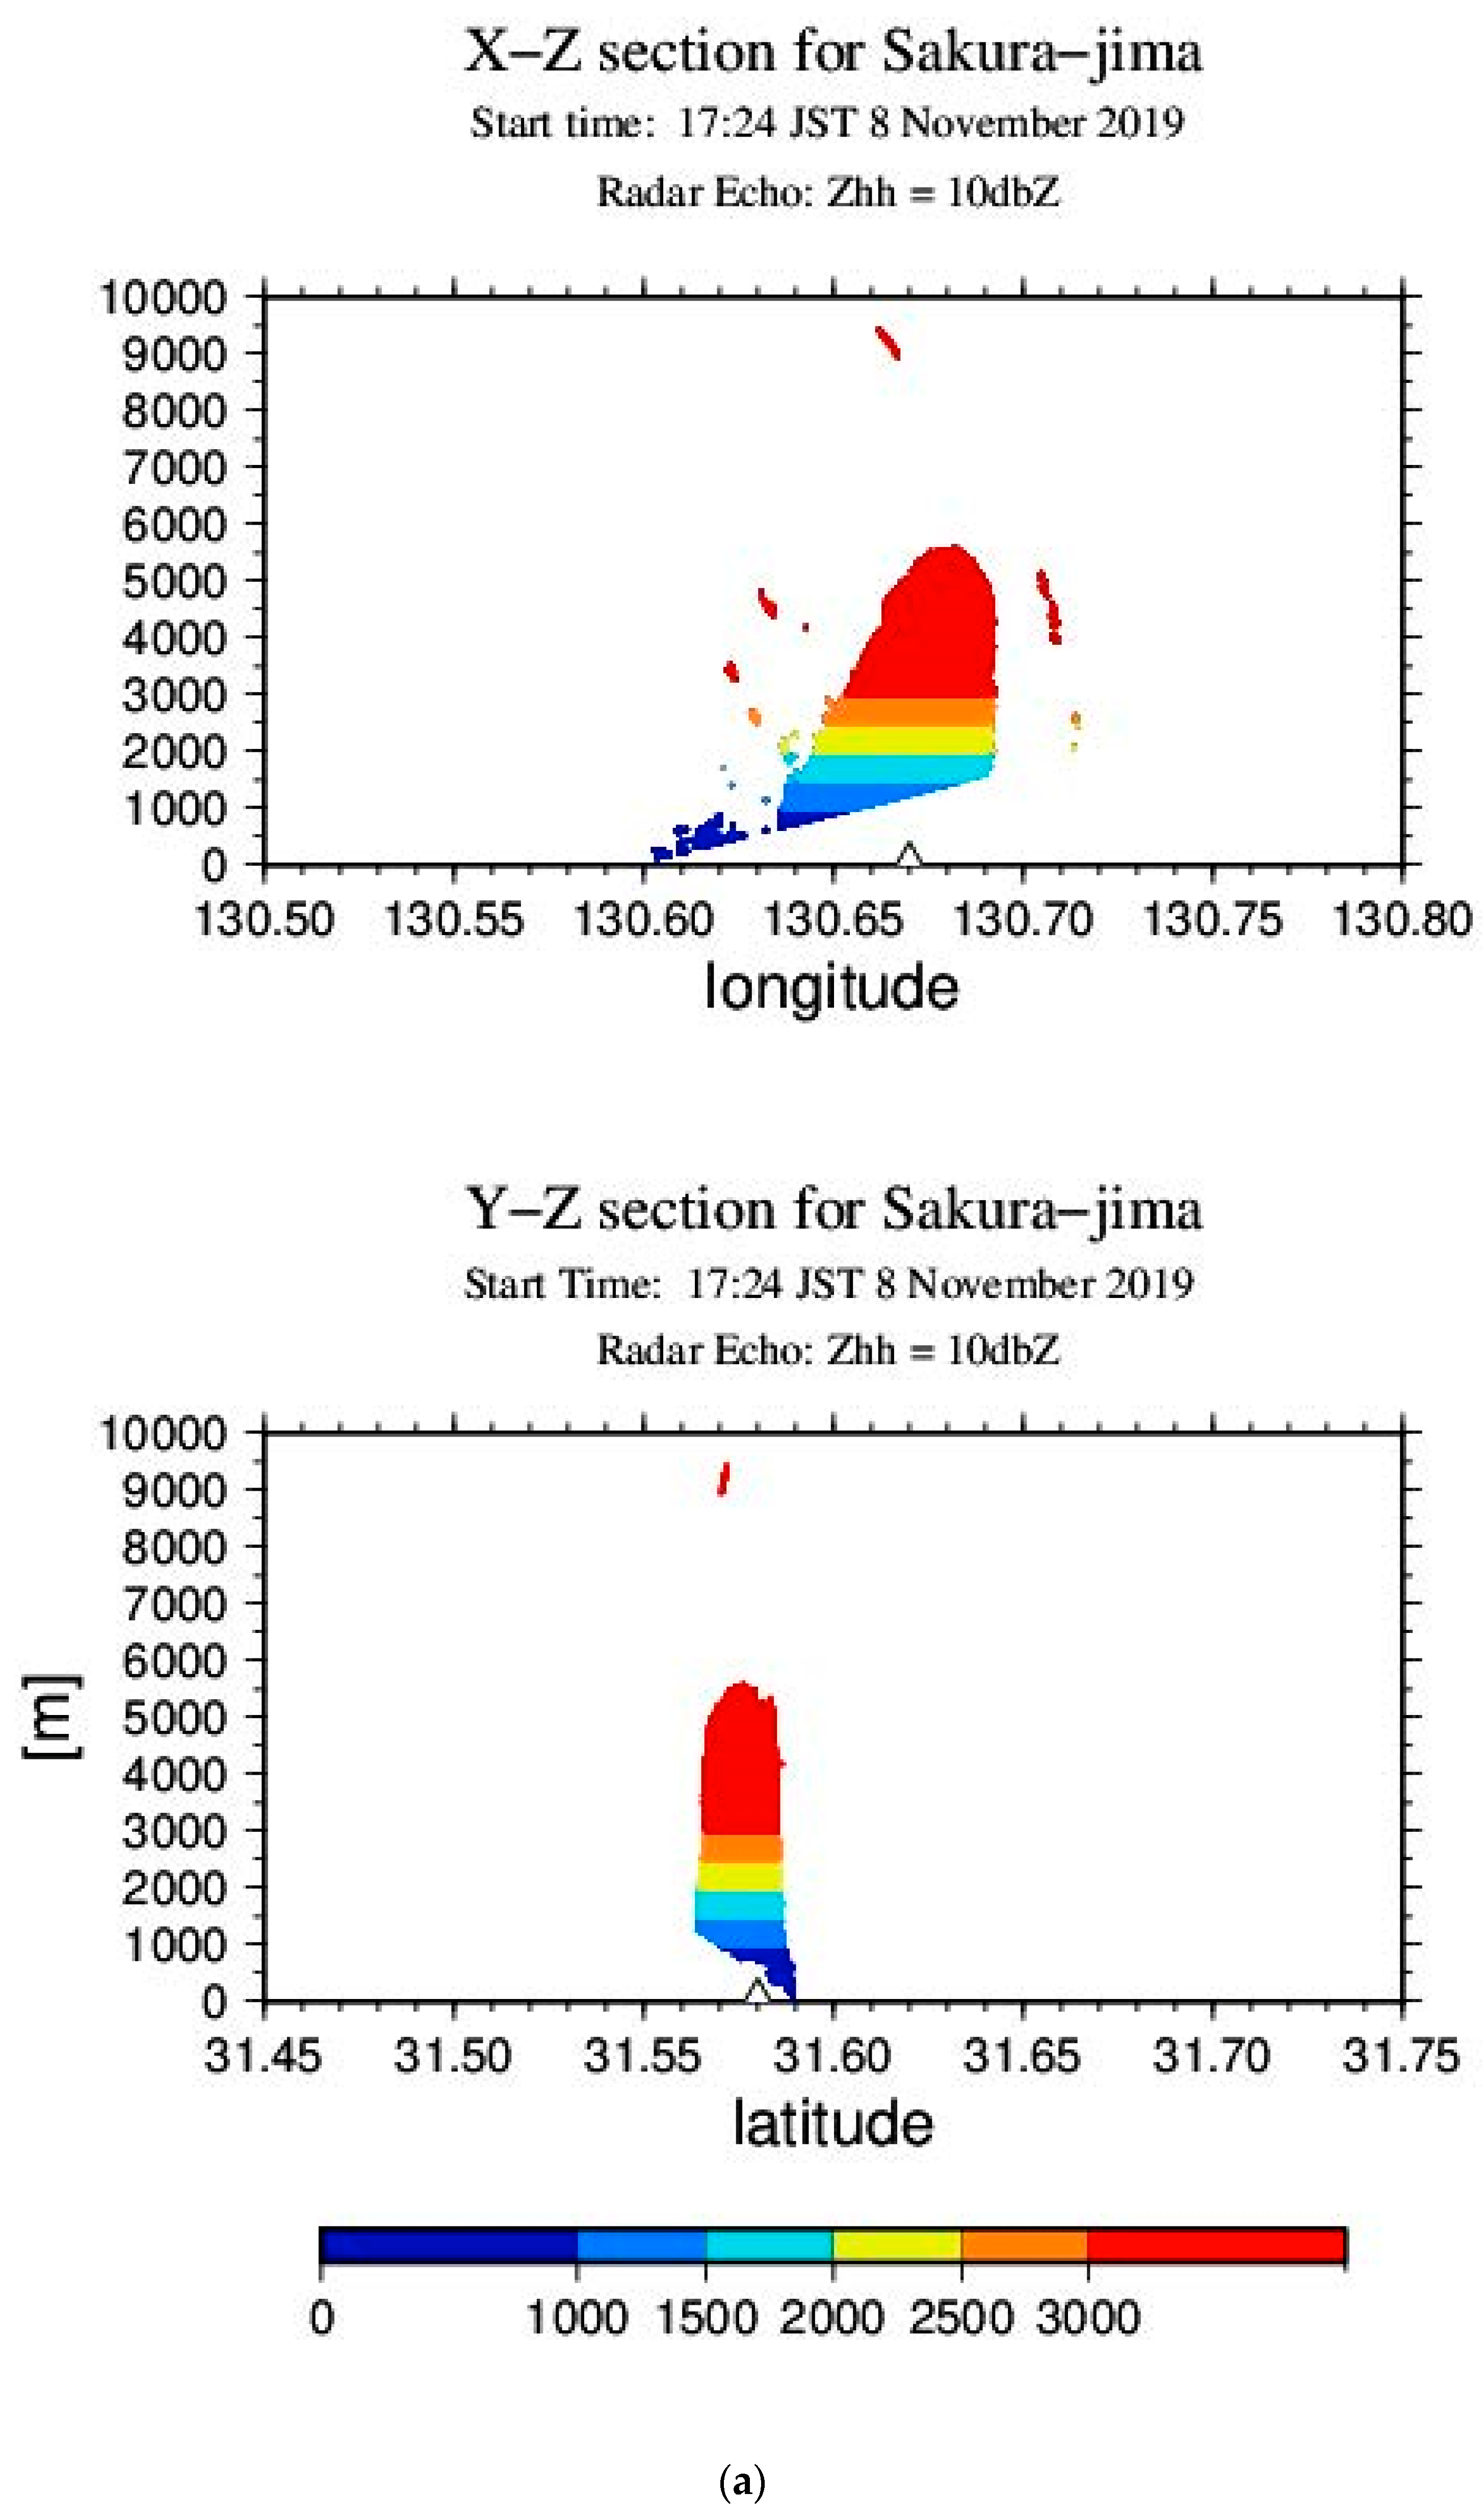
Figure 7 shows vertical cross sections of X-Z and Y-Z for the reflectivity factors of 10 dBZ and 20 dBZ at 17:28 JST. The colors of particles indicate a different plume height. A round shape of plume top is seen at 5500 m. The bottom of the ash cloud is cut by the lowest elevation angle of the radar. There are some noise in 10 dBZ showing isolated particles around the plume even at 10,000 m height. Since these noises are difficult to remove from the actual ash plume in the automated numerical model, we decided to use the data for 20 dBZ and above for the initial data of the PUFF model simulation. Compared to the PUFF model simulation in
Figure 4, the actual plume top of 5500 m is higher than 4000 m of the model result in
Section 3. The plume top by the default PUFF model is inaccurate because the height is estimated from emission rate using Equation (2), and the emission rate is evaluated empirically from seismic data and tilt meter. It appears that the coefficient
b is only a half of the expected value by the observation. In contrast, the plume top by the MP radar is very accurate because it is a direct observation. It spreads wider than the model simulation in
Figure 4, extending east and west sides of the volcano.
We can run the PUFF model using those particles by MP radar as an initial condition. However, the simulation result is not perfect because the MP radar observation is not perfect. The radar echo often contains large noise for a weak signal of reflection. The goal of the present study is to combine the observed ash particles by MP radar with that of the PUFF model simulation as presented in
Figure 3 and
Figure 4, because the model predictions also have important information of the emission rate by ground observations. It is a kind of data assimilation of the forecasting model to improve the model prediction skill. Some quality check is needed for the radar data before using as the input for the PUFF model. Suppose that we have
M particles in the prediction model at the time of snap shot of MP radar observation. We add new
M particles from the MP radar observation so that the total number of particles in the model becomes 2
M. Then we reduce the total number of particles to
M in order to conserve total mass of airborne ash plume in the model. We use a random number to pick up
M particles from 2
M.
The ratio of mixing the observation data with the forecasted data depends on the ratio of observation error and forecasting error. When the observation is accurate enough with no error, the mixing ratio is 1.0, and the observation data in
Figure 6 would be used for the calculation. Conversely, when the forecasting data is perfect with no error, the mixing ratio would be 0.0 and the forecasting data in
Figure 3 would be used for the calculation. The optimal value is somewhere in the middle of 0.0 and 1.0, and is referred to as Kalman gain in the study of data assimilation. In the present model, we used 0.5 for the mixing ratio as a first attempt of the data assimilation, because the optimal ratio is unknown at this state. It is a future subject to find the optimal value by the quantitative analysis of the errors in the data assimilation.
Figure 8 illustrates the results of the modified PUFF model simulation of the ash plume dispersal using the MP radar data for (a) 17:30, (b) 17:40, (c) 17:50, and (d) 18:00 JST, respectively. The result for 17:30 in
Figure 8 is a superposition of those in
Figure 3 and
Figure 6. The plume dispersal by the original PUFF model in
Figure 3 has been corrected by the MP radar data in
Figure 6 indicating much wider spread around the volcano.
The spread is clearly modified by the radar data compared to
Figure 3a. At 17:40, 10 min after, the continuous emission shows dispersal in the east direction. Although the dispersal is almost the same as
Figure 3b, part of the ashes is for MP radar data. At 17:50, 20 min after, the emission has terminated, and the upper part of ash plume moved to the east and the lower part moved to the southeast. At 8:00, 30 min after, the ash plume has drifted further to east for upper level, and to southeast for the lower level as in
Figure 3d.
Figure 9 plots longitude-height (X-Z) and meridional-height (Y-Z) cross sections of ash plume dispersal using the MP radar data for (a) 17:30, (b) 17:40, (c) 17:50, and (d) 18:00 JST, respectively, as in
Figure 4. At 17:30, the ash plume reached 5500 m a.s.l indicating a round top shape as observed by MP radar in X-Z plot centered at the volcano. The plume top of 4000 m by the model is detectable within the ash dispersal. In the Y-Z plot, the particles show no drift indicating a wider vertical column compared to that in
Figure 4. Part of the low-level particles below 1500 m moves faster to the south—characteristics of the model seen in
Figure 4. Obviously, the dispersal is a mixture of observation and model data, showing how the model data are improved by the MP radar observation. At 17:40, 10 min after, the taller particles by the MP radar observation can be separated from the lower dense particles by the model. We can confirm that the distribution is a mixture of the model and observation data. The eruption continued about 20 min, and terminated by 17:50. By analyzing the series of the plots, it is clear that the PUFF model simulation is improved by assimilating the MP radar observation.
Figure 10a plots the particle distribution for ash fallout as in
Figure 5a. These two fallout distributions are almost identical.
Figure 10b illustrates the ash fallout distribution in the units of g/m
2 as in
Figure 5b. According to the result, the ash fallout of 10 g/m
2 extends along major axis of fallout, and 100 g/m
2 appears at Tarumizu area. Although the detail is different from that in
Figure 5b, these two fallout distributions are indistinguishable. The simulation result is consistent with the ground observations for this case.
5. Concluding Summary
The volcanic ash plume prediction system PUFF developed at SVRC by [
16] used the real-time emission rate and plume height, estimated by the seismic monitoring and ground deformation data. Although the current PUFF system is useful for the real-time prediction of the airborne ash plume and ash fallout, the estimated emission rate and plume height must be validated by direct observations. The X band MP radar recently installed at SVRC can offer the important direct observation of the airborne ash plume in a real-time base. Therefore, by combining the MP radar data with the current PUFF system, we can establish a new prediction system with improved accuracy and more reliability. In this study, a real-time volcanic ash plume prediction by PUFF system is applied to the Sakurajima volcano, which erupted on 8 November 2019, using the direct observation of the MP radar data at SVRC.
The PUFF model simulation without the MP radar data showed the plume height of 4000 m and the Vulcanian eruption continued for 20 min starting from 17:24 JST. The ash plume drifted to the east for upper level, but it moved to the southeast for the lower level by the large wind shear. The ash fallout extended from the vent to southeast direction, and agreed well with in situ observations of 400 g/m2 at Arimura station (ART) and 100 g/m2 at Nabeyama station (NAB).
On the other hand, the MP radar at SVRC was operational for this eruption event, showing clearly the plume height of 5500 m a.s.l. and dispersal around the volcano. The plume height by the MP radar was higher than the 4000 m by the PUFF system, but was lower than the observational report of 6500 m by JMA in Kagoshima. As noted earlier, the plume top by the default PUFF model is inaccurate because the height is estimated from emission rate using Equation (2), and the emission rate is evaluated empirically from seismic data and tilt meter. It appears that the coefficient b is only a half of the expected value by the observation. In contrast, the plume top by the MP radar is much accurate because it is a direct observation. The ash plume extended only in the east side of the volcano by the PUFF system. However, the ash was detected even upstream of the volcano in the west side as well as the east lee side of the volcano by the MP radar observation.
In this study, the ash particles by the snapshot of the MP radar observation were combined with the running PUFF model operated by the real-time emission rate and plume height. This is a kind of data assimilation that combines the observational data with the model prediction data so that the model prediction is improved. According to the simulation result, the predicted distribution of the ash plume was updated by the new MP radar observation in the course of time integration. The plume top is adjusted from 4000 m to 5500 m a.s.l., and the initial ash dispersal is adjusted from the point source to surrounding area of the volcano. The direct observation obviously improved the model simulation, and enhanced the reliability of the model prediction.
In the new PUFF model system, both of the emission data by the ground observation and MP radar observation of airborne ash are used to compensate the merit and defect. The result of the new PUFF model prediction can be validated by the in situ fallout observation network nearby Sakurajima volcano.
It was demonstrated by this study that the new PUFF model system, combined with the real-time MP radar data, is much reliable and useful for the purpose of aviation safety as well as ground transportation and human health around the active volcanos. Further improvement is needed for the new PUFF model system to assimilate many snapshots of the MP radar data. It is expected to apply this new PUFF model system to many other active volcanoes in Japan.
