Towards an Improved Inventory of N2O Emissions Using Land Cover Maps Derived from Optical Remote Sensing Images


Abstract
:1. Introduction
2. Experiments
2.1. Study Area
2.2. In Situ Data—Registre Parcellaire Graphique (RPG)
2.3. Satellite Data
2.3.1. Spot Data
2.3.2. Landsat-8 Data
2.3.3. Processing of Optical Images
2.4. Methodology
2.4.1. Land Use Classification
2.4.2. Mapping of N2O Emissions
2.4.3. Errors on N2O Emissions Derived from the Confusion Matrix
2.4.4. Errors on N2O Emissions from Emission Factor
3. Results
3.1. Accuracy of 10 Years of Land Use Classification
3.1.1. Overall Performances
3.1.2. Variation of the Inter-Annual Crop Classes Abundance
3.1.3. Main Confusions between the Classes of Interest
3.1.4. Consistency of Satellite-Derived Classifications with Departmental Statistics
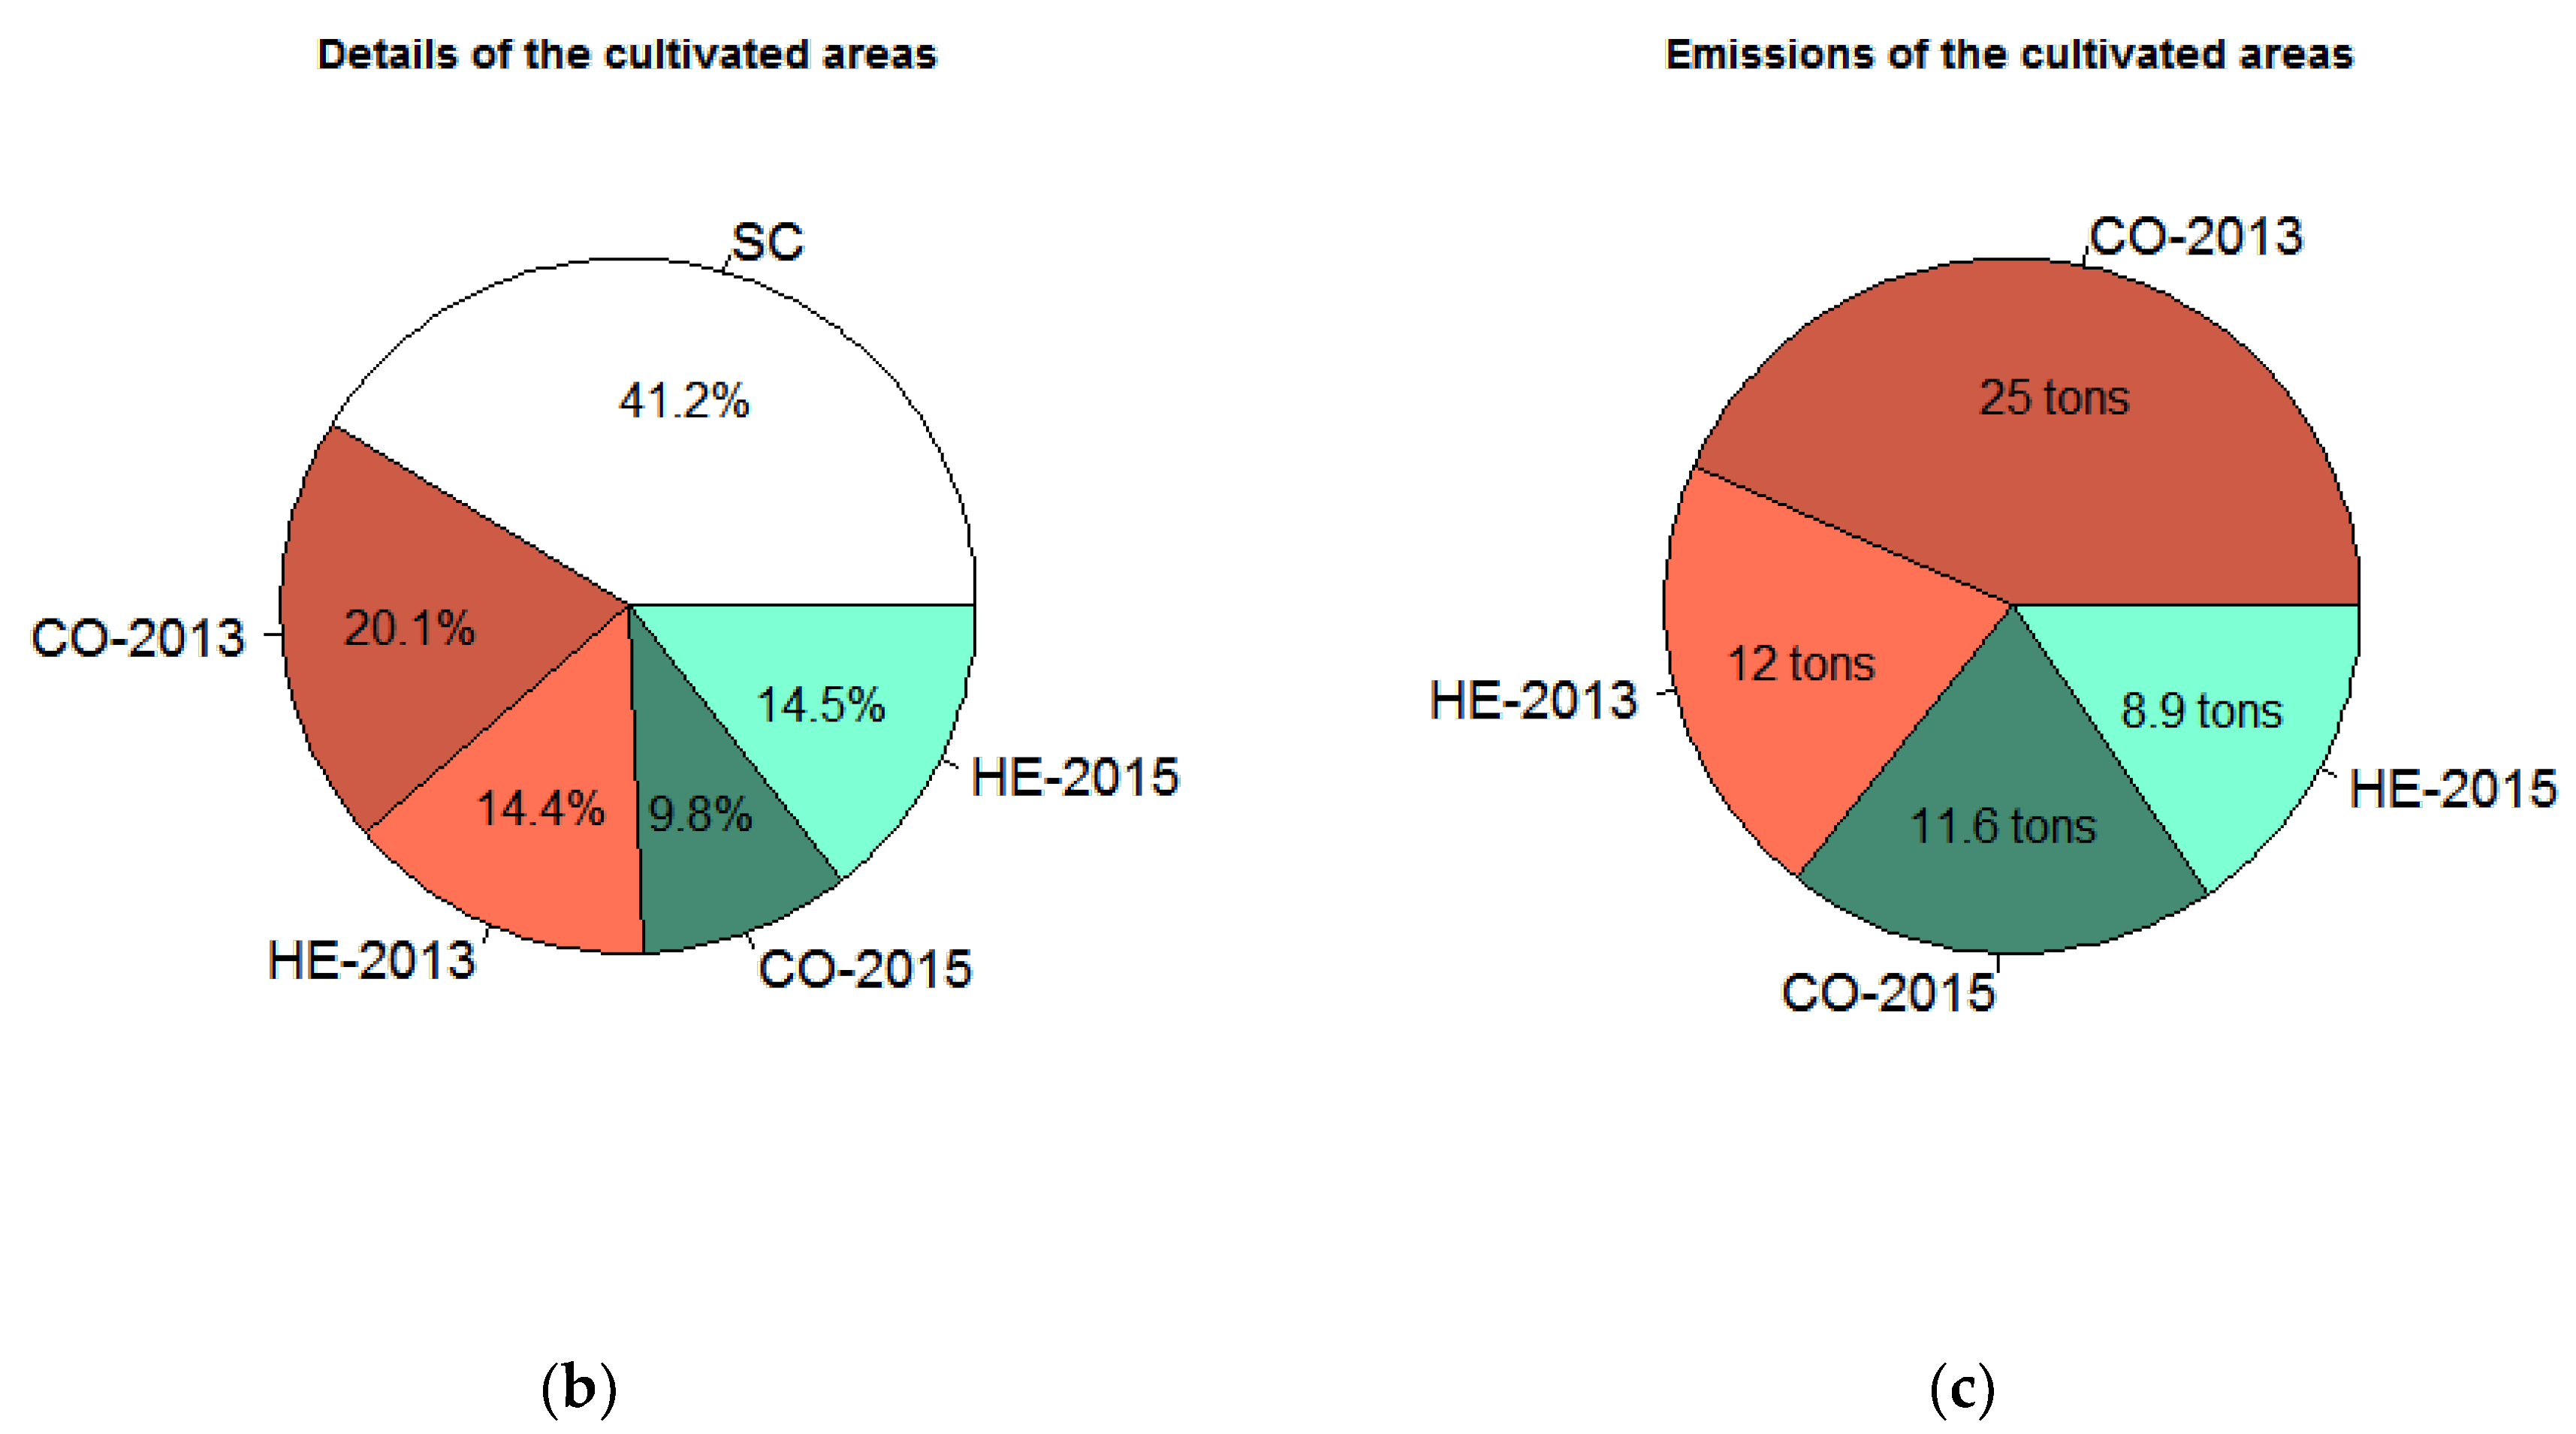
3.2. Analysis of the Maps of N2O Emissions
3.2.1. Analysis of the Yearly Potential Budgets
3.2.2. Variation of the Inter-Annual Relative Emission
3.2.3. Overview of 10-Years of the Potential N2O Budget
4. Discussion
5. Conclusions
Author Contributions
Funding
Acknowledgments
Conflicts of Interest
References
- Montzka, S.A.; Dlugokencky, E.J.; Butler, J.H. Non-CO2 greenhouse gases and climate change. Nat. Cell Biol. 2011, 476, 43–50. [Google Scholar] [CrossRef] [PubMed]
- Davidson, E.A.; Kanter, D. Inventories and scenarios of nitrous oxide emissions. Environ. Res. Lett. 2014, 9, 105012. [Google Scholar] [CrossRef]
- Kristell, H.; Hiroko, A.; Martial, B.; Ngonidzashe, C.; del Agustin, P.; Åsa, K.; James, D.M.; Stephen, M.; Kristiina, R.; van der Weerden, T.J. N2O Emissions from Managed Soils, and CO2 Emissions from Lime and Urea Application. In IPCC 2019, 2019 Refinement to the 2006 IPCC Guidelines for National Greenhouse Gas Inventories; IPCC: Geneva, Switzerland, 2019. [Google Scholar]
- Viard, A.; Hénault, C.; Rochette, P.; Kuikman, P.; Flenet, F.; Cellier, P. Le protoxyde d’azote (N2O), puissant gaz à effet de serre émis par les sols agricoles: Méthodes d’inventaire et leviers de réduction. Oléagineux Corps Gras Lipides 2013, 20, 108–118. [Google Scholar] [CrossRef] [Green Version]
- Wysocka-Czubaszek, A.; Czubaszek, R.; Roj-Rojewski, S.; Banaszuk, P. Methane and Nitrous Oxide Emissions from Agriculture on a Regional Scale. J. Ecol. Eng. 2018, 19, 206–217. [Google Scholar] [CrossRef]
- Prather, M.J.; Holmes, C.D.; Hsu, J. Reactive greenhouse gas scenarios: Systematic exploration of uncertainties and the role of atmospheric chemistry. Geophys. Res. Lett. 2012, 39, 09803. [Google Scholar] [CrossRef] [Green Version]
- Xiang, B.; Miller, S.M.; Kort, E.A.; Santoni, G.W.; Daube, B.C.; Commane, R.; Angevine, W.M.; Ryerson, T.B.; Trainer, M.K.; Andrews, A.E.; et al. Nitrous oxide (N2O) emissions from California based on 2010 CalNex airborne measurements. J. Geophys. Res. Atmos. 2013, 118, 2809–2820. [Google Scholar] [CrossRef]
- Del Grosso, S.J.; Wirth, T.; Ogle, S.M.; Parton, W.J. Estimating Agricultural Nitrous Oxide Emissions. EOS Trans. Am. Geophys. Union. 2008, 89, 529. [Google Scholar] [CrossRef]
- Lugato, E.; Zuliani, M.; Alberti, G.; Vedove, G.D.; Gioli, B.; Miglietta, F.; Peressotti, A. Application of DNDC biogeochemistry model to estimate greenhouse gas emissions from Italian agricultural areas at high spatial resolution. Agric. Ecosyst. Environ. 2010, 139, 546–556. [Google Scholar] [CrossRef]
- Olander, L.P.; Haugen-Kozyra, K. Using Biogeochemical Process to Models to Quantify Greenhouse Gas Mitigation from Agricultural Management Projects; Technical Working Group on Agricultural Greenhouse Gases (T-AGG) Supplemental Report; Duke University: Durham, NC, USA, 2011. [Google Scholar]
- US EPA 2014. Inventory of U.S. Greenhouse Gas Emissions and Sinks: 1990-2012 Report EPA 430-R-14–003; U.S. Environmental Protection Agency: Washington, DC, USA, 2014.
- Kasper, M.; Foldal, C.; Kitzler, B.; Haas, E.; Strauss, P.; Eder, A.; Zechmeister-Boltenstern, S.; Amon, B. N2O emissions and NO3− leaching from two contrasting regions in Austria and influence of soil, crops and climate: A modelling approach. Nutr. Cycl. Agroecosyst. 2018, 113, 95–111. [Google Scholar] [CrossRef] [Green Version]
- Gaillardet, J.; Braud, I.; Hankard, F.; Anquetin, S.; Bour, O.; Dorfliger, N.; de Dreuzy, J.R.; Galle, S.; Galy, C.; Gogo, S.; et al. OZCAR: The French Networkof Critical Zone Observatories. Vadose Zone J. 2018, 17, 1–24. [Google Scholar] [CrossRef] [Green Version]
- Sicre, C.M.; Baup, F.; Fieuzal, R. Determination of the crop row orientations from Formosat-2 multi-temporal and panchromatic images. ISPRS J. Photogramm. Remote Sens. 2014, 94, 127–142. [Google Scholar] [CrossRef] [Green Version]
- Arnaud, M.; Leroy, M. SPOT 4: A new generation of SPOT satellites. ISPRS J. Photogramm. Remote Sens. 1991, 46, 205–215. [Google Scholar] [CrossRef]
- Roy, D.P.; Wulder, M.A.; Loveland, T.R.; Woodcock, C.E.; Allen, R.G.; Anderson, M.C.; Helder, D.; Irons, J.R.; Johnson, D.M.; Kennedy, R.S.H.; et al. Landsat-8: Science and product vision for terrestrial global change research. Remote Sens. Environ. 2014, 145, 154–172. [Google Scholar] [CrossRef] [Green Version]
- Hagolle, O.; Huc, M.; Pascual, D.V.; Dedieu, G. A Multi-Temporal and Multi-Spectral Method to Estimate Aerosol Optical Thickness over Land, for the Atmospheric Correction of FormoSat-2, LandSat, VENμS and Sentinel-2 Images. Remote Sens. 2015, 7, 2668–2691. [Google Scholar] [CrossRef] [Green Version]
- Breiman, L. Random forests. Mach. Learn. 2001, 45, 5–32. [Google Scholar] [CrossRef] [Green Version]
- Gislason, P.O.; Benediktsson, J.A.; Sveinsson, J.R. Random Forests for land cover classification. Pattern Recognit. Lett. 2006, 27, 294–300. [Google Scholar] [CrossRef]
- Loosvelt, L.; Peters, J.; Skriver, H.; Lievens, H.; Van Coillie, F.M.; De Baets, B.; Verhoest, N.E. Random Forests as a tool for estimating uncertainty at pixel-level in SAR image classification. Int. J. Appl. Earth Obs. Geoinf. 2012, 19, 173–184. [Google Scholar] [CrossRef]
- Van Rijsbergen, C.J. Information Retrieval; Butterworths: London, UK, 1979. [Google Scholar]
- Powers, D.M.W. Evaluation: From Precision, Recall and F-Factor to ROC, Informedness, Markedness & Correlation. J. Mach. Learn. Technol. 2011, 2, 37–63. [Google Scholar]
- Agreste—La Statistique, L’évaluation et la Prospective Agricole. Ministère de L’agriculture et de L’alimentation. Available online: https://agreste.agriculture.gouv.fr/agreste-web/ (accessed on 2 November 2020).
- Inglada, J.; Arias, M.; Tardy, B.; Hagolle, O.; Valero, S.; Morin, D.; Dedieu, G.; Sepulcre, G.; Bontemps, S.; Defourny, P.; et al. Assessment of an Operational System for Crop Type Map Production Using High Temporal and Spatial Resolution Satellite Optical Imagery. Remote Sens. 2015, 7, 12356–12379. [Google Scholar] [CrossRef] [Green Version]
- Sicre, C.M.; Fieuzal, R.; Frappart, F. Contribution of multispectral (optical and radar) satellite images to the classification of agricultural surfaces. Int. J. Appl. Earth Obs. Geoinf. 2020, 84, 101972. [Google Scholar] [CrossRef]
- Inglada, J.; Vincent, A.; Arias, M.; Marais-Sicre, C. Improved Early Crop Type Identification by Joint Use of High Temporal Resolution SAR And Optical Image Time Series. Remote Sens. 2016, 8, 362. [Google Scholar] [CrossRef] [Green Version]
- Marais, S.C.; Inglada, J.; Fieuzal, R.; Baup, F.; Valero, S.; Cros, J.; Huc, M.; Demarez, V. Early detection of summer crops using high spatio-temporal resolution optical images time series. Remote Sens. 2016, 8, 591. [Google Scholar] [CrossRef] [Green Version]
- Fieuzal, R.; Baup, F.; Marais-Sicre, C. Monitoring Wheat and Rapeseed by Using Synchronous Optical and Radar Satellite Data—From Temporal Signatures to Crop Parameters Estimation. Adv. Remote Sens. 2013, 2, 162–180. [Google Scholar] [CrossRef] [Green Version]
- Fieuzal, R.; Baup, F. Estimation of leaf area index and crop height of sunflowers using multi-temporal optical and SAR satellite data. Int. J. Remote Sens. 2016, 37, 2780–2809. [Google Scholar] [CrossRef]
- McNairn, H.; Champagne, C.; Shang, J.; Holmstrom, D.; Reichert, G. Integration of optical and Synthetic Aperture Radar (SAR) imagery for delivering operational annual crop inventories. ISPRS J. Photogramm. Remote Sens. 2009, 64, 434–449. [Google Scholar] [CrossRef]
- Inglada, J.; Vincent, A.; Arias, M.; Tardy, B.; Morin, D.; Rodes, I. Operational High Resolution Land Cover Map Production at the Country Scale Using Satellite Image Time Series. Remote Sens. 2017, 9, 95. [Google Scholar] [CrossRef] [Green Version]
- Zimmermann, J.; Carolan, R.; Forrestal, P.; Harty, M.; Lanigan, G.; Richards, K.; Roche, L.; Whitfield, M.; Jones, M. Assessing the performance of three frequently used biogeochemical models when simulating N2O emissions from a range of soil types and fertiliser treatments. Geoderma 2018, 331, 53–69. [Google Scholar] [CrossRef]
- Yang, T.; Li, F.; Zhou, X.; Xu, C.; Feng, J.; Fang, F. Impact of nitrogen fertilizer, greenhouse, and crop species on yield-scaled nitrous oxide emission from vegetable crops: A meta-analysis. Ecol. Indic. 2019, 105, 717–726. [Google Scholar] [CrossRef]
- Ball, B.C.; Scott, A.; Parker, J.P. Field N2O, CO2 and CH4 fluxes in relation to tillage, compaction and soil quality in Scotland. Soil Tillage Res. 1999, 53, 29–39. [Google Scholar] [CrossRef]
- Franco-Luesma, S.; Cavero, J.; Plaza-Bonilla, D.; Cantero-Martínez, C.; Tortosa, G.; Bedmar, E.J.; Álvaro-Fuentes, J. Irrigation and tillage effects on soil nitrous oxide emissions in maize monoculture. Agron. J. 2020, 112, 56–71. [Google Scholar] [CrossRef]
- Sanz-Cobena, A.; Lassaletta, L.; Aguilera, E.; Del Prado, A.; Garnier, J.; Billen, G.; Iglesias, A.; Sánchez-Jimeno, B.; Guardia, G.; Abalos, D.; et al. Strategies for greenhouse gas emissions mitigation in Mediterranean agriculture: A review. Agric. Ecosyst. Environ. 2017, 238, 5–24. [Google Scholar] [CrossRef] [Green Version]
- Lognoul, M.; Theodorakopoulos, N.; Hiel, M.-P.; Regaert, D.; Broux, F.; Heinesch, B.; Bodson, B.; Vandenbol, M.; Aubinet, M. Impact of tillage on greenhouse gas emissions by an agricultural crop and dynamics of N2O fluxes: Insights from automated closed chamber measurements. Soil Tillage Res. 2017, 167, 80–89. [Google Scholar] [CrossRef]
- Sánchez, C.; Minamisawa, K. Nitrogen Cycling in Soybean Rhizosphere: Sources and Sinks of Nitrous Oxide (N2O). Front. Microbiol. 2019, 10, 1943. [Google Scholar] [CrossRef] [PubMed]
- Yang, L.; Cai, Z. The effect of growing soybean (Glycine max. L.) on N2O emission from soil. Soil Biol. Biochem. 2005, 37, 1205–1209. [Google Scholar] [CrossRef]
- Senbayram, M.; Chen, R.; Budai, A.; Bakken, L.; Dittert, K. N2O emission and the N2O/(N2O+N2) product ratio of denitrification as controlled by available carbon substrates and nitrate concentrations. Agric. Ecosyst. Environ. 2012, 147, 4–12. [Google Scholar] [CrossRef]
- Mary, B.; Clivot, H.; Blaszczyk, N.; Labreuche, J.; Ferchaud, F. Soil carbon storage and mineralization rates are affected by carbon inputs rather than physical disturbance: Evidence from a 47-year tillage experiment. Agric. Ecosyst. Environ. 2020, 299, 106972. [Google Scholar] [CrossRef]
- Pique, G.; Fieuzal, R.; Al Bitar, A.; Veloso, A.; Tallec, T.; Brut, A.; Ferlicoq, M.; Zawilski, B.; Dejoux, J.-F.; Gibrin, H.; et al. Estimation of daily CO2 fluxes and of the components of the carbon budget for winter wheat by the assimilation of Sentinel 2-like remote sensing data into a crop model. Geoderma 2020, 376, 114428. [Google Scholar] [CrossRef]
- Vaudour, E.; Gomez, C.; Fouad, Y.; Lagacherie, P. Sentinel-2 image capacities to predict common topsoil properties of temperate and Mediterranean agroecosystems. Remote Sens. Environ. 2019, 223, 21–33. [Google Scholar] [CrossRef]
- Bigaignon, L.; Le Dantec, V.; Delon, C.; Brut, A.; Ceschia, E.; Mordelet, P.; Zawilski, B.; Granouillac, F.; Claverie, N.; Fieuzal, R.; et al. N2O budget from 10 site-years measurement on two crop fields in southwestern France: Impact of agricultural practices and calculation methodology. Agric. For. Manag. 2020. under review. [Google Scholar]


| Crop Species | Agreste 2006 | Agreste 2011 | ||
|---|---|---|---|---|
| Mineral Nitrogen Input | Annual N2O Emissions | Mineral Nitrogen Input | Annual N2O Emissions | |
| kg of N.ha−1 | kg of N2O.ha−1 | kgN.ha−1 | kg of N2O.ha−1 | |
| Wheat | 149 | 2.34 | 149 | 2.34 |
| Barley | 100 | 1.57 | 81 | 1.27 |
| Rapeseed | 165 | 2.59 | 158 | 2.48 |
| Corn | 190 | 2.98 | 184 | 2.89 |
| Sunflower | 53 | 0.83 | 54 | 0.85 |
| Sorghum | 56 | 0.88 | 59 | 0.93 |
| Soybean | 0 | 0 | 0 | 0 |
| Years | 2006 | 2007 | 2008 | 2009 | 2010 | 2011 | 2012 | 2013 | 2014 | 2015 |
|---|---|---|---|---|---|---|---|---|---|---|
| Kappa | 0.83 | 0.79 | 0.78 | 0.79 | 0.83 | 0.83 | 0.84 | 0.86 | 0.86 | 0.87 |
| Overall Accuracy | 0.85 | 0.82 | 0.81 | 0.82 | 0.85 | 0.85 | 0.86 | 0.88 | 0.88 | 0.89 |
Publisher’s Note: MDPI stays neutral with regard to jurisdictional claims in published maps and institutional affiliations. |
© 2020 by the authors. Licensee MDPI, Basel, Switzerland. This article is an open access article distributed under the terms and conditions of the Creative Commons Attribution (CC BY) license (http://creativecommons.org/licenses/by/4.0/).
Share and Cite
Fieuzal, R.; Sicre, C.M.; Tallec, T. Towards an Improved Inventory of N2O Emissions Using Land Cover Maps Derived from Optical Remote Sensing Images. Atmosphere 2020, 11, 1188. https://doi.org/10.3390/atmos11111188
Fieuzal R, Sicre CM, Tallec T. Towards an Improved Inventory of N2O Emissions Using Land Cover Maps Derived from Optical Remote Sensing Images. Atmosphere. 2020; 11(11):1188. https://doi.org/10.3390/atmos11111188
Chicago/Turabian StyleFieuzal, Rémy, Claire Marais Sicre, and Tiphaine Tallec. 2020. "Towards an Improved Inventory of N2O Emissions Using Land Cover Maps Derived from Optical Remote Sensing Images" Atmosphere 11, no. 11: 1188. https://doi.org/10.3390/atmos11111188
APA StyleFieuzal, R., Sicre, C. M., & Tallec, T. (2020). Towards an Improved Inventory of N2O Emissions Using Land Cover Maps Derived from Optical Remote Sensing Images. Atmosphere, 11(11), 1188. https://doi.org/10.3390/atmos11111188