Article

Multi-Weather Evaluation of Nowcasting Methods Including a New Empirical Blending Scheme

1
National Science and Technology Center for Disaster Reduction, New Taipei City 23143, Taiwan
2
Department of Atmospheric Sciences, National Central University, Taoyuan City 32001, Taiwan
*
Author to whom correspondence should be addressed.
Atmosphere 2020, 11(11), 1166; https://doi.org/10.3390/atmos11111166
Submission received: 26 September 2020 / Revised: 18 October 2020 / Accepted: 27 October 2020 / Published: 29 October 2020

Abstract

:
This study utilized a radar echo extrapolation system, a high-resolution numerical model with radar data assimilation, and three blending schemes including a new empirical one, called the extrapolation adjusted by model prediction (ExAMP), to carry out 150 min reflectivity nowcasting experiments for various heavy rainfall events in Taiwan in 2019. ExAMP features full trust in the pattern of the extrapolated reflectivity with intensity adjustable by numerical model prediction. The spatial performance for two contrasting events shows that the ExAMP scheme outperforms the others for the more accurate prediction of both strengthening and weakening processes. The statistical skill for all the sampled events shows that the nowcasts by ExAMP and the extrapolation system obtain the lowest and second lowest root mean square errors at all the lead time, respectively. In terms of threat scores and bias scores above certain reflectivity thresholds, the ExAMP nowcast may have more grid points of misses for high reflectivity in comparison to extrapolation, but serious overestimation among the points of hits and false alarms is the least likely to happen with the new scheme. Moreover, the event type does not change the performance ranking of the five methods, all of which have the highest predictability for a typhoon event and the lowest for local thunderstorm events.

1. Introduction

Meteorological hazards can lead to massive loss of life and property owing to the sustained trends of global population growth and urbanization. For risk reduction, worldwide weather service centers make unremitting efforts to develop hazard information and early warning systems, whose core technology lies in accurate weather forecasting. As the temporal and spatial scales of the hazards vary, weather forecasting is classified into seven categories according to the lead time by the World Meteorological Organization (WMO [1]): climate forecasting (>2 years), long-range forecasting (30 days–2 years), extended-range weather forecasting (10–30 days), medium-range weather forecasting (3–10 days), short-range weather forecasting (0.5–3 days), very short-range weather forecasting (2–12 h), and nowcasting (0–2 h). Some studies, e.g., [2,3], define the lead time of nowcasting as 0–6 h instead. The targets of very short-range weather forecasting and nowcasting are usually severe weather systems at a meso-beta or -gamma scale, such as tornadoes, thunderstorms, and flash floods. The goal is to provide a detailed description of their current states as well as an accurate prediction about intensity and position variations in a few hours [4]. Besides forecast accuracy, fast computing, frequent updates, and high spatial resolution are also required to issue warnings or watches for severe weather. With limited meteorological observations and computational resources, a comprehensive consideration of these four requirements to develop an efficient nowcasting system is undoubtedly a big challenge. In terms of meteorological observations, traditional surface and sounding measurements play an important role, but only Doppler weather radars can observe three-dimensional wind and hydrometeor information on precipitation systems at the highest temporal and spatial resolution. Therefore, many countries have built upon networks of Doppler weather radars, partially upgraded to dual-polarization radars that observe more cloud microphysical information [5,6], to surveil high-risk areas for severe weather and seek the optimal use of radar data in nowcasting systems.
As radar echoes serve as the best indicator of precipitation intensity and positions, the most intuitive and long established nowcasting method is extrapolating the latest tendency of echo variations to the future [7]. Follow-up extrapolation studies have developed two major approaches to the tracking of radar echoes: cell tracking and area tracking. For cell tracking, [8] proposed a technique to isolate the echoes of convective cells in plan position indicator (PPI) scans and calculate their centroids, and then two consecutive PPI scans (whose interval must be less than the lifetime of the cells) were matched to derive the velocities of the centroids for predicting future positions. Modifying this technique, [9] suggested a procedure to constrain the motion of each cell within a certain tolerance of the objectively derived mean cell motion, which could suppress spurious cell motion. After robust radar networks and sufficient computational resources were available, many weather research and operational units have developed nowcasting systems which utilize cell tracking, such as Thunderstorm Identification, Tracking, Analysis, and Nowcasting (TITAN [10]), Storm Cell Identification and Tracking (SCIT [11]), Thunderstorms Radar Tracking (TRT [12]), and the Fuzzy Logic Algorithm for Storm Tracking (FAST [13]). In contrast to cell tracking, which focuses on predicting cell positions, the approach of area tracking considers the entire echo variations and thus has an advantage in quantitative forecasting. There are two major methods for area tracking: Tracking Radar Echoes by Correlation (TREC [14,15]) and Variational Echo Tracking (VET [16]). The former divides the whole radar coverage area into small overlapping squares at the targeted scale and then pairs the most correlated squares from two consecutive scans to derive the velocity of each square. The latter uses a moving reference frame and seeks its optimal velocity by variational analysis, which can be iterated as the reference frame sequentially splits into many small frames at the targeted scale. Both area tracking methods have been utilized by several nowcasting systems as well, such as the Continuity of TREC Vectors (COTREC [17]), the McGill Algorithm for Precipitation Nowcasting by Lagrangian Extrapolation (MAPLE [18]), the Optical Flow Scheme for the Gandolf System [19], and the Collaborative Adaptive Sensing of the Atmosphere (CASA [20]). It is noteworthy that, trying to grasp high reflectivity signatures within the radar coverage area and meet the demand for fast computing, almost all radar echo extrapolation methods perform the horizontal extrapolation of composite reflectivity rather than three-dimensional reflectivity.
In addition to the advantage of fast computing, radar echo extrapolation has very high forecast accuracy in the first 30–60 min when existing convective cells have not yet dissipated. However, the accuracy rapidly declines afterward because the formation of new cells is unpredictable with extrapolation. Instead, new cells could possibly be predicted by the dynamic, thermodynamic, and cloud microphysical processes of numerical models, and the predictability largely depends on the quality of convective-scale initial conditions. For this reason, a high-resolution numerical model prediction with radar data assimilation has been regarded as another key nowcasting method despite high computational costs and widely proved beneficial for severe weather forecasting, e.g., [21,22,23,24,25,26,27,28]. In contrast to extrapolation that excels at a very short lead time, numerical models usually require an integration period to spin up the foregoing processes and thus excel at longer lead time. In consequence, modern nowcasting systems mostly blend both methods with adjustable weights based on lead time. This blending concept originated from [29], which developed the Nowcasting and Initialization of Modeling Using Regional Observation Data (NIMROD) system that blended the rainfall predicted by extrapolation and the Met Office Unified Model (MetUM [30]); the 1 year statistics from March 1996 to February 1997 in the United Kingdom showed that the NIMROD system outperformed either extrapolation or MetUM in 6 h nowcasts. In [2], more blending studies were reviewed following [29] and reached similar positive conclusions. In recent years, research topics have been focused on evaluating different blending schemes and extended to downstream hydrological applications. For example, [31] used a hyperbolic tangent weight scheme to blend the reflectivity predicted by extrapolation and the Advanced Regional Prediction System (ARPS [32]) with radar data assimilation for a tornado case, which outperformed either extrapolation or ARPS. The authors in [33] utilized salient cross dissolve (Sal CD [34]), an image morphing scheme, to blend the 18 dBZ echo-top heights predicted by extrapolation and the High-Resolution Rapid Refresh (HRRR [35]) model; the 24 day statistics from mid-May to mid-June 2013 in the contiguous United States showed that Sal CD significantly improved 2–5 h nowcasts in comparison to either the approach of linear cross dissolve (Lin CD) or HRRR. This result indicates the importance to retain high reflectivity signatures without being oversmoothed during the merging process of blending schemes. Apart from blending reflectivity or rainfall, [3] employed a variational scheme to incorporate wind information from the Weather Research and Forecasting (WRF [36]) model into the motion field of MAPLE for 16 typhoon cases, which helped MAPLE maintain the rotation of typhoon rainbands and extend the nowcasting skill to 3 h. With respect to hydrological applications, [37] developed a real-time adaptive blending scheme with the harmony search algorithm to blend the rainfall predicted by three extrapolation and two numerical model systems, which was subsequently input into hydraulic models for urban flood forecasting; experiment results for three heavy rainfall cases in South Korea in July 2016 showed that the water depth in pipe and spatial extent simulated by this scheme were most similar to observed inundated areas. The authors in [38] incorporated the rainfall volume trend predicted by a numerical model (Moloch [39]) into an extrapolation system (PhaSt [40]) and then blended the rainfall predicted by PhaSt and Moloch, which was subsequently input into a hydrological model (Continuum [41]) for streamflow forecasting; experiment results for three flood events in Italy in fall 2014 also demonstrated the superior performance of the blending scheme.
Inspired by the aforementioned successes, this study utilized the MAPLE system, the WRF model with radar data assimilation, and three blending schemes including a new empirical one to carry out a series of reflectivity nowcasting experiments for four major types of heavy rainfall events in Taiwan in 2019. The purpose is to evaluate the overall nowcasting capabilities of the five methods for various precipitation systems and investigate the advantage of the new scheme, which can be guidance for local early warning systems. Section 2 describes the features and configurations of MAPLE and WRF as well as the three blending schemes used in this study. Section 3 classifies the sampled heavy rainfall events and plans the details of the reflectivity nowcasting experiments. Section 4 shows the results of spatial performance for two contrasting events and statistical skill for all the events. Section 5 is devoted to the summary and future prospect.

2. Methodology

2.1. MAPLE and WRF

The MAPLE system is developed by the J. S. Marshall Radar Observatory of McGill University, and its complete algorithm for VET and semi-Lagrangian extrapolation was first documented in [18]. As mentioned in the introduction, VET seeks the optimal velocity of the moving reference frame by variational analysis, which in MAPLE minimizes a cost function as
J V E T ( u ) = J Ψ + J 2 ,
where u is the optimal velocity to seek; J Ψ is the sum of the squares of residuals in the reflectivity conservation equation; J 2 is a smoothness penalty function that sums the squares of the second derivatives of the motion field with respect to space, as
J Ψ = Ω β ( x ) [ Ψ ( t 0 ,   x ) Ψ ( t 0 Δ t ,   x u Δ t ) ] 2 d x d y ,
J 2 = γ Ω [ ( 2 u x 2 ) 2 + ( 2 u y 2 ) 2 + 2 ( 2 u x y ) 2 + ( 2 v x 2 ) 2 + ( 2 v y 2 ) 2 + 2 ( 2 v x y ) 2 ] d x d y ,
where Ψ is composite reflectivity; t 0 and Δ t are the current observation time and the interval between consecutive observations, respectively; x and y are the components of the position vector x ; u and v are the components of u ; β is a weight for radar data quality; γ is a weight for the penalty function; Ω represents the domain of the reference frame. Moreover, MAPLE employs a scaling-guess procedure [16] that iteratively retrieves the motion field with increasing grid resolution, which mitigates the risk of convergence toward secondary minima. With the retrieved motion field, a semi-Lagrangian backward scheme [42] is then used to advect reflectivity, whose displacement vector is determined as
α = t u ( t 0 ,   x α 2 ) .
This advection process is divided into many small time steps, which enable a curved path to capture rotational features in precipitation systems. Referring to [3], the configuration of MAPLE in this study includes the use of three consecutive radar maps at a 20 min interval, a 5 dBZ reflectivity threshold, a 3 × 3 smoothing window, five scaling guesses, a 72 × 72 vector density, and the values of β and γ at 0.5 and 1000, respectively.
The WRF model is a well known numerical model developed by the National Center for Atmospheric Research (NCAR), which comprises the Advanced Research WRF (ARW) and the Nonhydrostatic Mesoscale Model (NMM) dynamical solvers, a rich collection of physics schemes, a WRF preprocessing system (WPS), and a WRF data assimilation (WRFDA) system. The main prognostic state variables contain the three-dimensional wind components, perturbation potential temperature, perturbation geopotential, perturbation surface pressure of dry air, and the mixing ratios of water vapor and various hydrometeors. In this study, WRF-ARW V3.3.1 was employed by use of the Morrison cloud microphysical parameterization scheme [43], RRTM longwave radiation scheme [44], Goddard shortwave radiation scheme [45], MM5 surface layer scheme [46], Noah land surface model [47], Yonsei University planetary boundary layer scheme [48], and Kain–Fritsch cumulus parameterization scheme [49]. For data assimilation, the three-dimensional variational (3DVar [50]) component of WRFDA V3.4.1 is employed by the use of the control variable option 7 (CV7 [51]) background error covariance. The assimilated observations include data from the Global Telecommunications System (GTS), Global Positioning System (GPS) Radio Occultation (RO), and Doppler weather radars.

2.2. Three Blending Schemes

In this study, the 150 min nowcasting performance of utilizing either MAPLE or WRF was evaluated for four major types of heavy rainfall events in comparison to utilizing three different blending schemes: Lin CD, Sal CD, and a new empirical blending scheme. Referring to the aforementioned [33], the cross dissolve ( C ) of two images ( I 1 and I 2 ) can be expressed as
C ( x , y ) = w I 1 ( x , y ) + ( 1 w ) I 2 ( x , y ) ,
where w is a weight between 0 and 1. If I 1 and I 2 , respectively, represent the reflectivity predicted by MAPLE and WRF, w ought to decrease from 1 to 0 with increasing lead time for the declining predictability of extrapolation. For the Lin CD experiment in this study, the weight w ( t ) linearly decreases from 1 to 0 during the first 120 min of the nowcast period and then stays at 0 during 120–150 min. For the Sal CD experiment, the salience of reflectivity difference is considered to retain high reflectivity signatures, and consequently the weight w S ( x , y , t ) is a function of w ( t ) and the ranked salience r ( x , y ) as
w S = 1 2 [ w r w r + ( 1 w ) ( 1 r ) + w 2 + r 2 w 2 + r 2 + ( 1 w ) 2 + ( 1 r ) 2 ] ,
where r ( x , y ) is a cumulative distribution function ( Φ ) of the difference of normalized reflectivity ( N ) as
r ( x , y ) = Φ [ N 1 ( x , y ) N 2 ( x , y ) ] .
Besides, the authors suggest an empirical blending scheme called the extrapolation adjusted by model prediction (ExAMP), which has full trust in the pattern of reflectivity predicted by extrapolation but allows the intensity to be adjusted by numerical model prediction to a limited extent. This concept originates from the authors’ operational experience that, within the very short lead time of nowcasting, the positions of new convective cells predicted by numerical models during the spin-up period are often erroneous. Nevertheless, the predictability for the intensity variations of existing cells, which can be analyzed by radar data assimilation, is relatively higher in model predictions. The composite reflectivity ( Ψ ) predicted by the ExAMP scheme is formulated as
Ψ N = { Ψ M A P L E + ( Ψ W R F Ψ M A P L E ) ( 1 w )                 i f   Ψ M A P L E > 0   dB Z , 0   dB Z                                                                                                                                   i f   Ψ M A P L E 0   dB Z ,
where the innovation Ψ W R F Ψ M A P L E has upper and lower limits of 0.5 Ψ M A P L E and 0.3 Ψ M A P L E , respectively. Innovations beyond these limits are truncated to the limits to mitigate the possible impact from excessive cell growth or dissipation simulated by WRF. Here, 0.5 and −0.3 are empirical coefficients, the former of which has a larger magnitude to consider the possibility of rapid intensification in the aspect of early warning. It is to be emphasized that this scheme aims at further improvement over extrapolation before the extrapolation loses efficacy. However, there could also be limitations about this newly suggested blending scheme on occasion. In case the new cell positions predicted by models during the spin-up period are correct (with less chance), ExAMP will unfortunately miss them. Another limitation lies in a problem of spatial discontinuity between the ExAMP nowcast and other longer-range model forecasts, for example, at the lead time of 150 min in this study. If a seamless forecast that merges the scales of very short-range weather forecasting and nowcasting is demanded, a further step of blending the ExAMP nowcast and longer-range model forecast to smooth the discontinuity can be taken into account.

3. Reflectivity Nowcasting Experiments

As a mountainous island situated in the warm, moist East Asian monsoon region, Taiwan has a variety of precipitation systems all year round, especially during the flood period from May to November. Mei-yu fronts (occurring from mid-May to mid-June) and typhoons (mostly occurring from July to September) are usually the weather systems that bring heavy rainfall of long duration and massive disasters. At smaller scales, local thunderstorms and convective systems near the periphery of low pressure can also induce heavy rainfall of shorter duration. This study samples 43 three-hour periods from 10 heavy rainfall events in 2019 with at least one rain gauge measurement exceeding 100 mm in the three hours, which refers to the level of extremely heavy rain defined by the Central Weather Bureau (CWB). These sampled events are classified into the four major types, including the local thunderstorm (LT), Mei-yu front (MF), convective system near the periphery of low pressure (PL), and typhoon (TY), as listed in Table 1.
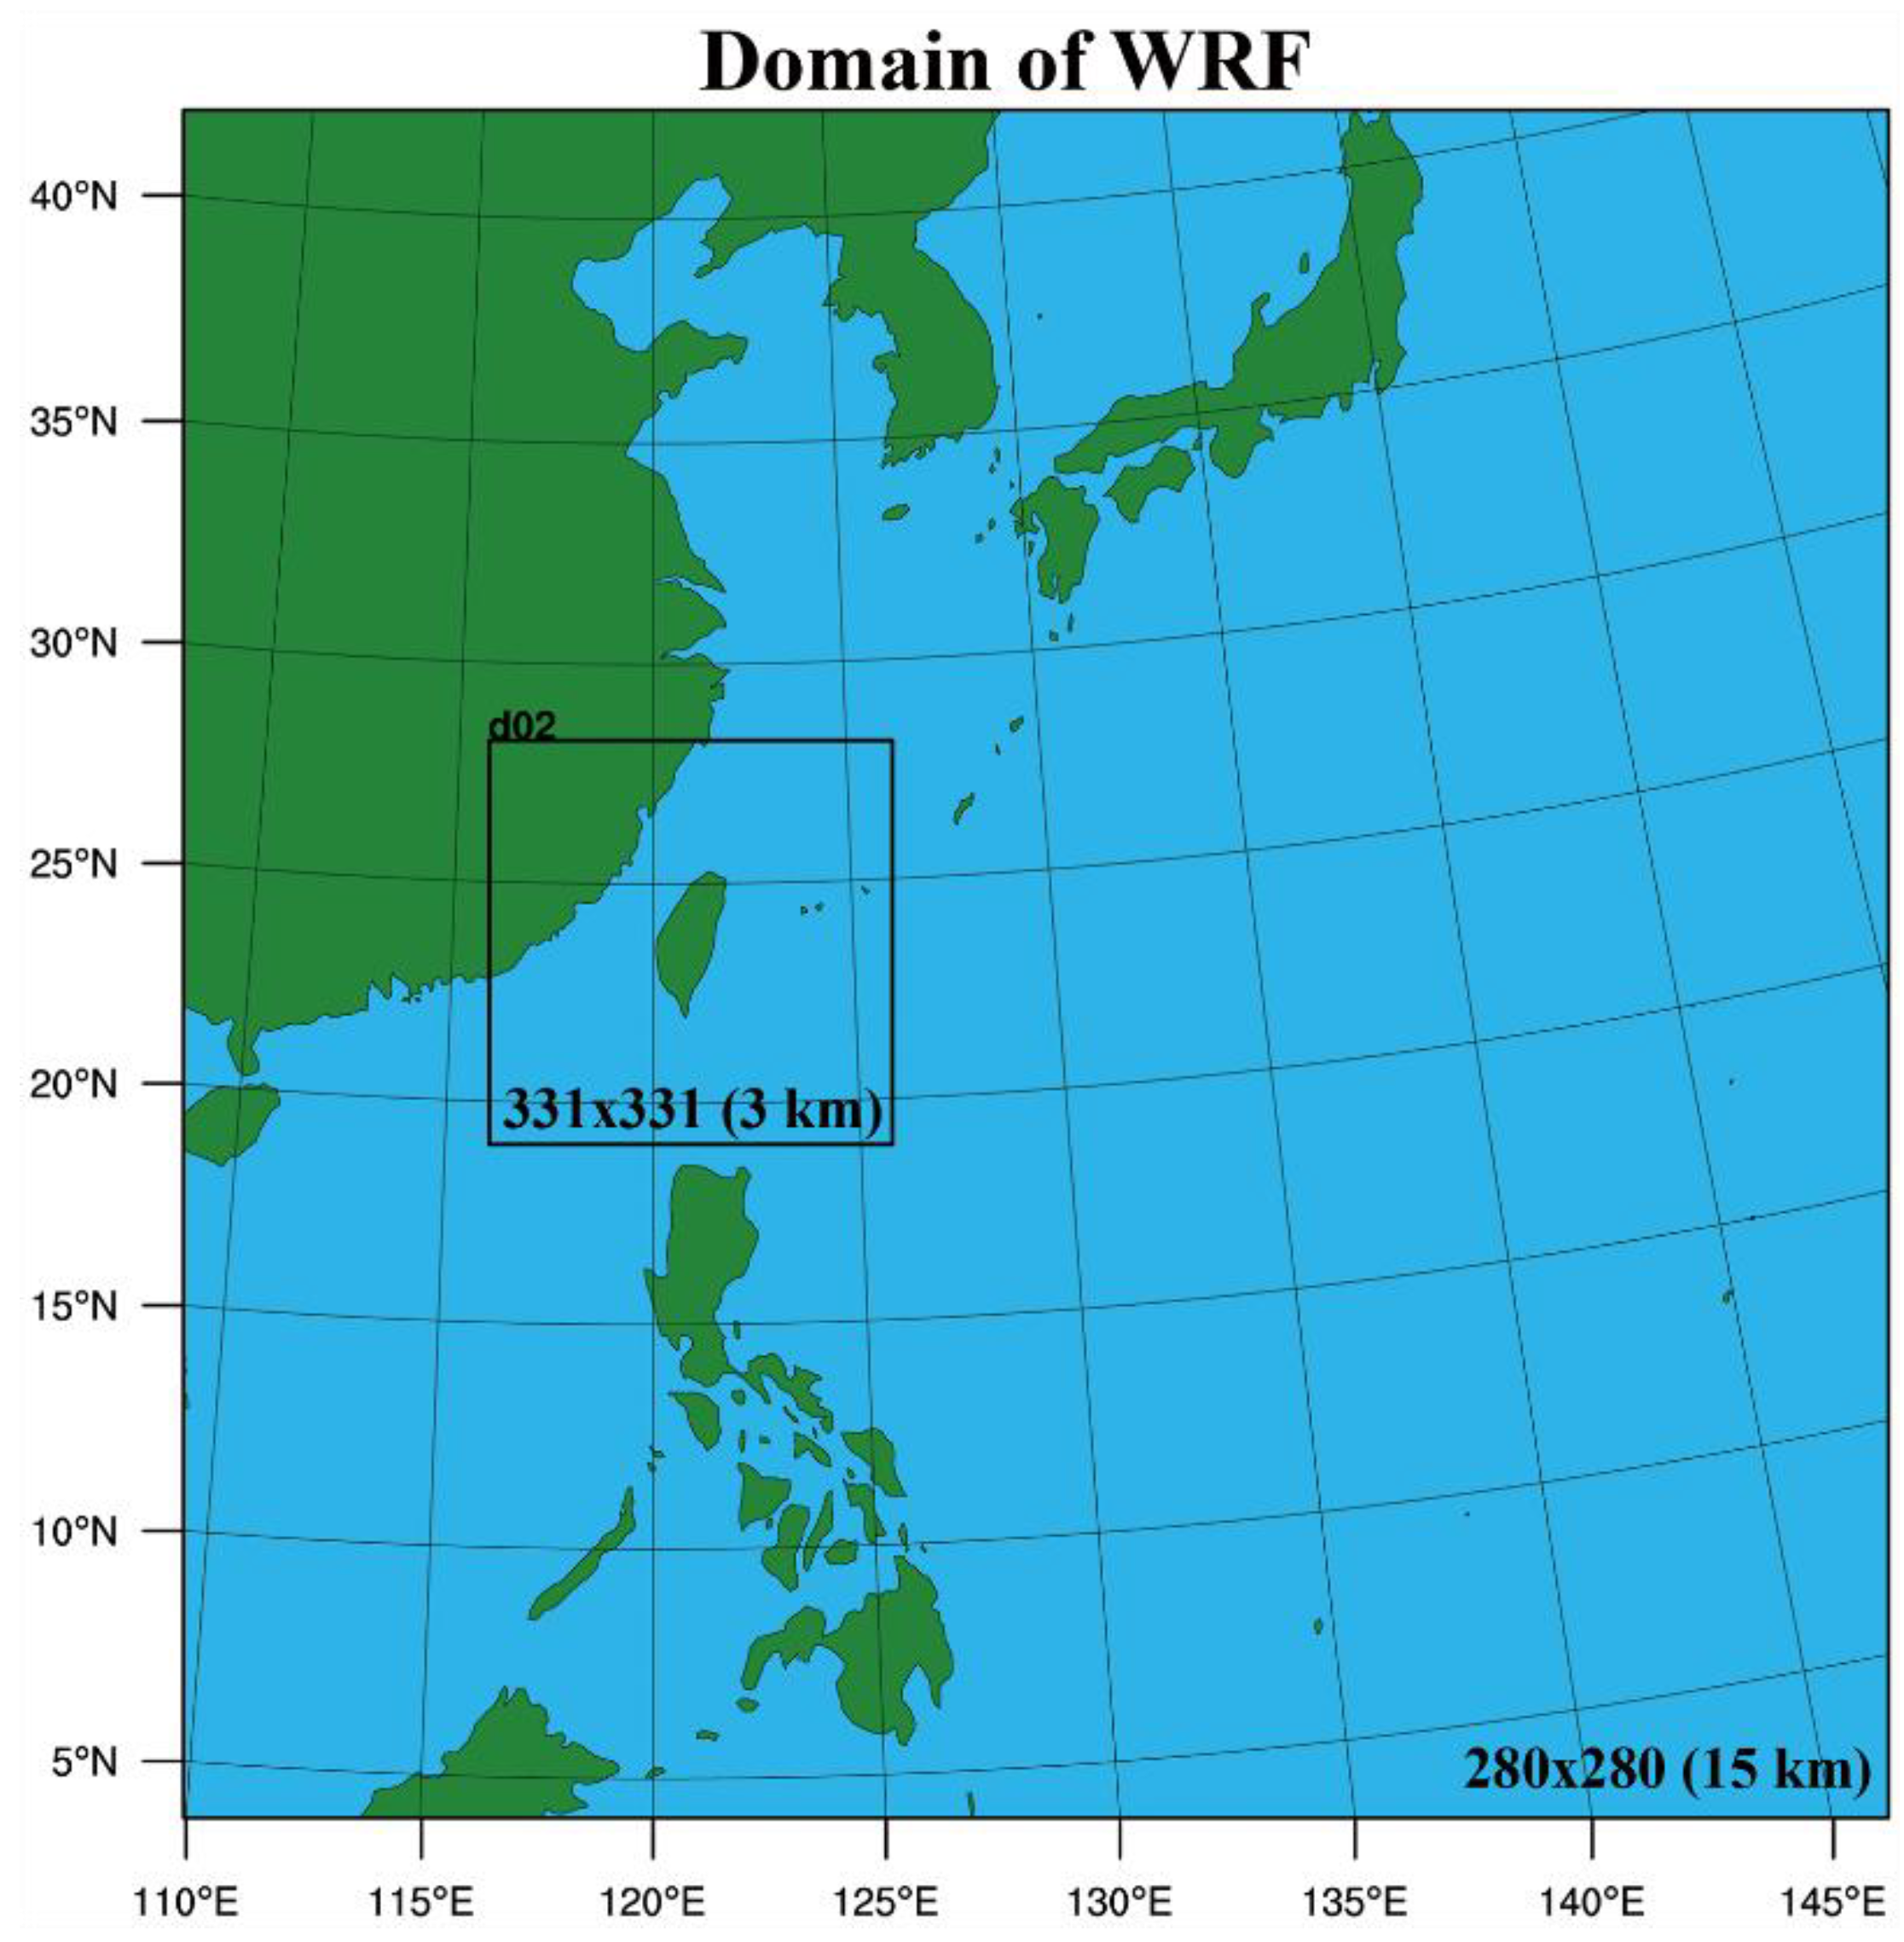
Regarding all the 43 periods, MAPLE, WRF, and the Lin CD, Sal CD, and ExAMP schemes that blend MAPLE and WRF were utilized to perform 150 min reflectivity nowcasts for comparison as stated above. Figure 1 shows the simulation domain of MAPLE as well as the reflectivity coverage area of nine Doppler weather radars used by MAPLE, including four S-band/pol (RCHL, RCWF, RCKT, and RCCG) and five C-pol (RCMK, RCCK, RCGR, RCLY, and RCNT) radars in Taiwan. Their volume scan observations are operationally preprocessed and meshed into composite reflectivity at 921 × 881 horizontal grid points with 0.0125° spacing every 10 min by the Quantitative Precipitation Estimation and Segregation Using Multiple Sensor (QPESUMS; [52]) system of CWB. The composite reflectivity data serve as both the input of MAPLE and the observations against which the five nowcasting experiments are verified. As for the WRF experiment, two-way interactive, double-nested simulation domains with 45 vertical eta levels are used as in Figure 2. Domains 1 and 2 have 280 × 280 and 331 × 331 horizontal grid points with 15 and 3 km spacing, respectively. The initial and boundary conditions were generated from the National Centers for Environmental Prediction (NCEP) Global Forecast System (GFS) 0.5° forecast, and then the GTS data, the refractivity of GPS-RO, and the radial velocity and reflectivity of five radars (RCHL, RCWF, RCKT, RCCG, and RCMK; Figure 1) are assimilated via the 3DVar component of the WRFDA. The GTS and GPS-RO data are assimilated in both domains 1 and 2 at the initial time of the GFS forecast. The radar data are assimilated later in domain 2 for three analysis cycles at 30 min intervals, as analysis increments can be fed back to domain 1 by two-way interaction. Lastly, the predicted three-dimensional reflectivity in domain 2 is converted to composite reflectivity and interpolated to the QPESUMS grid. It is noteworthy that, to mimic the data latency resulting from computing and transmission in the operational situation, the beginning 10 min of the MAPLE nowcast and 30 min of the WRF nowcast are truncated. For example, if the time of the five verified nowcasts is 10:00–12:30 UTC, the time of the last radar data input into MAPLE and assimilated into WRF will be 09:50 and 09:30 UTC, respectively.

4. Results

4.1. Spatial Performance for Two Contrasting Events

Prior to evaluating the statistical skill of the five methods for all the events, the spatial performance for two contrasting events that, respectively, stand for the developing and dissipating scenarios of convective systems was investigated. Figure 3 shows the reflectivity of the observations and five nowcasts at different lead times for a PL event at 10:00 UTC 2 July. The corresponding rainfall rate converted by a reflectivity–rainfall rate (Z–R) relation:
Z = 32.5 R 1.65 ,
which is employed by the QPESUMS system referring to [53], is also shown for reference. In this developing event, multiple convective lines (area A) north of a tropical depression on the South China Sea strengthened and approached the land of Taiwan during the 150 min when the tropical depression was moving northward. Meanwhile, a convective system (area B) in northern Taiwan was weakening. Neither the strengthening in area A nor the weakening in area B were captured by the MAPLE nowcast because extrapolation itself can hardly evolve intensity variations. For the WRF nowcast, serious overestimation was widespread around the area A, mainly resulting from the initial wet bias (not shown) of the NCEP GFS moisture field and its error growth during the spin-up period, but the weakening trend in area B was better predicted. With respect to the blending schemes, the reflectivity maps of Lin CD and ExAMP at 0 min are identical to that of MAPLE, which owns an initial weight of 1 for both schemes ( w in Equations (5) and (8)). The initial weight of MAPLE for Sal CD ( w S in Equation (6)) is slightly smaller than 1 as Equation (6) becomes:
w S = 1 2 [ 1 + 1 + r 2 1 + r 2 + 1 r ]
with w = 1 . This is why the reflectivity pattern of WRF is vaguely visible in Sal CD at 0 min. As the lead time increases, the Lin CD and Sal CD nowcasts gradually approximate the WRF nowcast and thus inherit the serious overestimation around area A and predicted weakening trend in area B. Instead of approximating the WRF at final moments, ExAMP follows the reflectivity pattern of MAPLE all the way but successfully captures both the strengthening in area A and the weakening in area B via moderate intensity adjustment referring to WRF. This makes ExAMP the best nowcasting method among the five for this event.
Figure 4 shows the reflectivity and corresponding rainfall rate in the other event at 10:30 UTC 2 August which stands for the scenario of dissipating local thunderstorms (LT). From the observations, the thunderstorms (area C) around the land and offshore areas of central and southern Taiwan continuously dissipated during the 150 min. The MAPLE nowcast fails in evolving the weakening trend again, and the reflectivity pattern and intensity look stationary owing to a very weak motion field. For the WRF nowcast, the positions of convective cells at 0 min were deviated from the observations. Although these initial cells dissipate as the simulation proceeds, there were two spurious cells (areas D and E) strengthening instead near the eastern coast. With respect to the blending schemes, the characteristics of Lin CD and Sal CD are analogous to those in the previous event, resembling MAPLE in the beginning and gradually approximating WRF. By contrast, ExAMP retrieves the weakening trend in area C to a certain extent and successfully avoids the two spurious cells in WRF, which makes ExAMP the best again. As a concluding remark, the WRF nowcasts in both developing and dissipating scenarios reflect the aforementioned experience that the variations of existing cells analyzed by radar data assimilation are more predictable than the positions of new cells while the model has not spun up. According to this reason and the experiment results, the ExAMP scheme is certainly advantageous to nowcasting within very short lead time.

4.2. Statistical Skill for All the Events

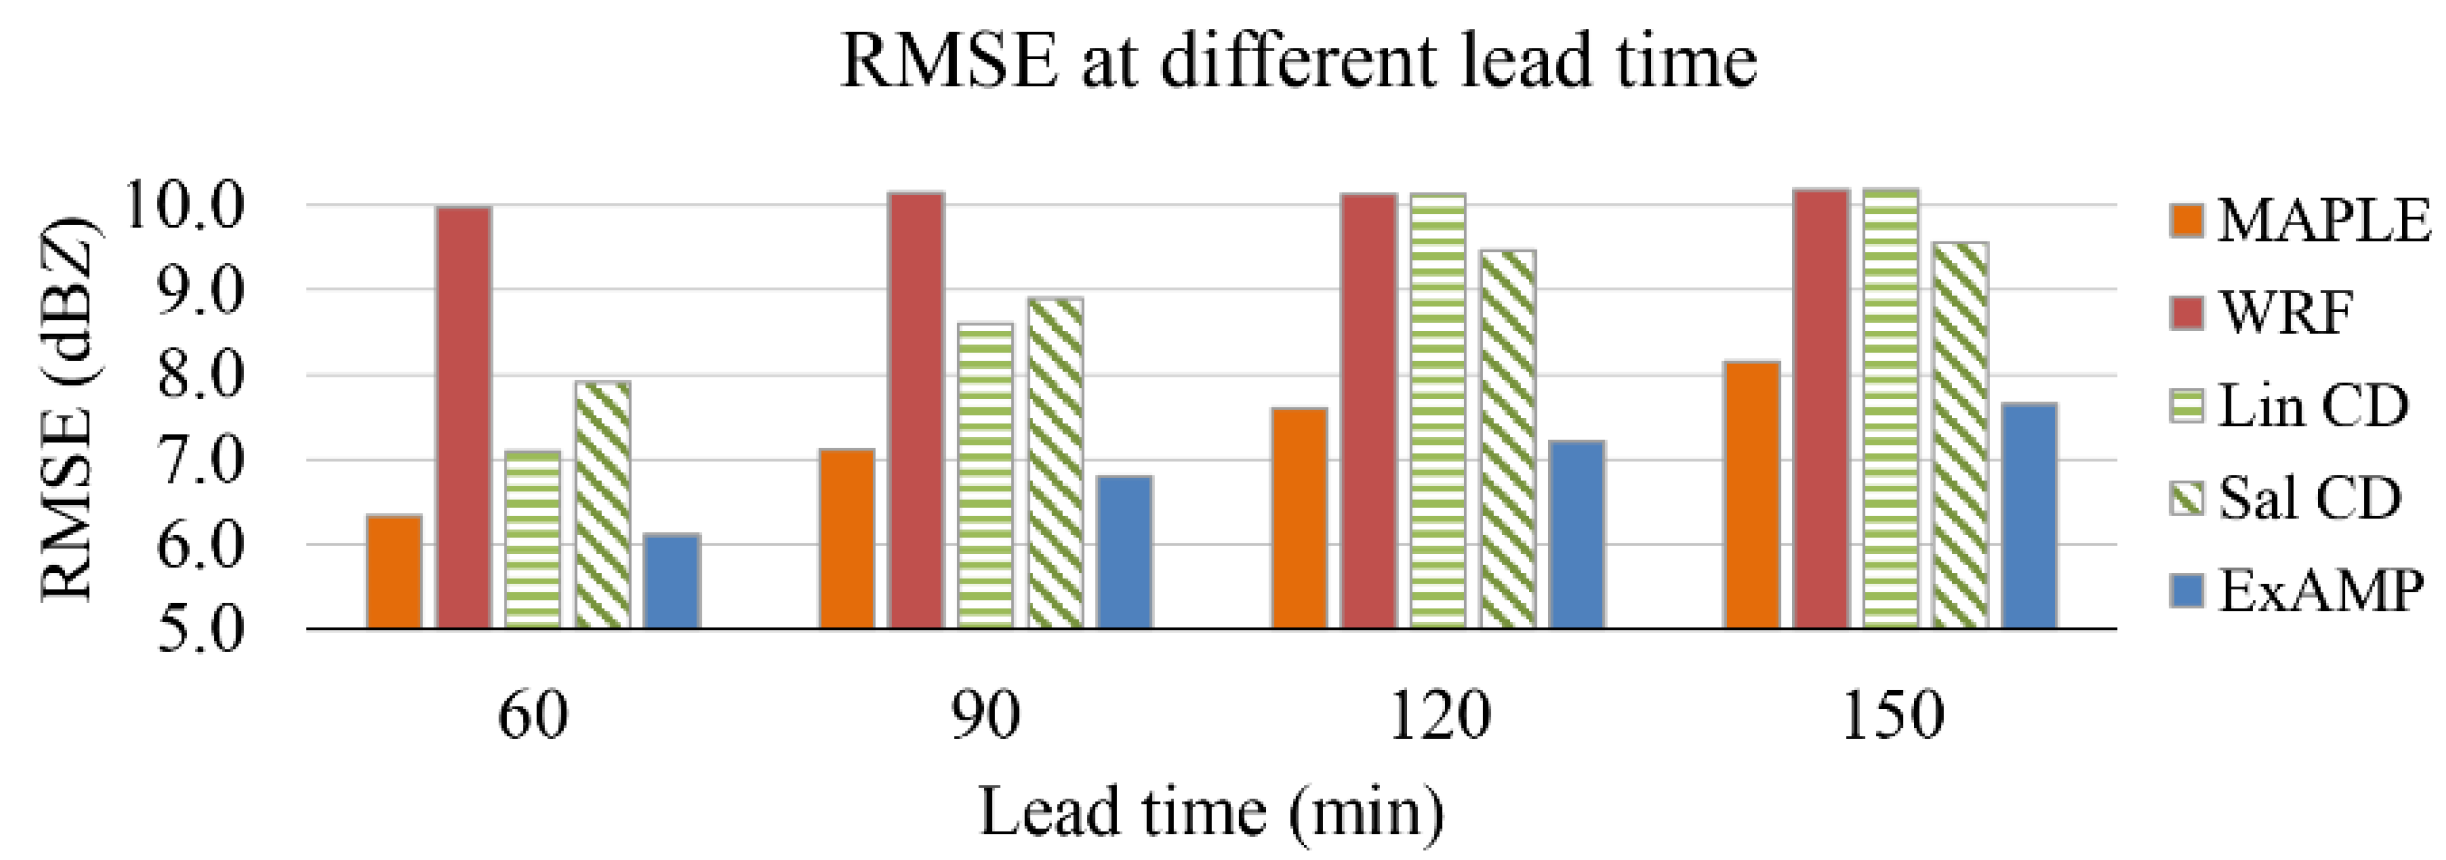
For the more systematic evaluation of the five methods, statistical skill scores are calculated for all the sampled heavy rainfall events. To examine the overall performance first, the root mean square errors (RMSEs) of the reflectivity predicted by the five methods at different lead times, computed over the grid points with observed reflectivity exceeding 0 dBZ for the 43 periods, are compared in Figure 5. It is obvious that ExAMP has the lowest RMSEs and MAPLE takes second place at all the lead times. Their error values reasonably grow as the lead time increases because of the declining predictability. On the contrary, the RMSEs of WRF seem saturated all the way at the worst value of 10 dBZ, which the RMSEs of Lin CD and Sal CD, respectively, equal and approximate after 120 min. The RMSEs of Lin CD are lower at 60 and 90 min but higher at 120 and 150 min than those of Sal CD, which echoes the superior performance of Sal CD to Lin CD within the lead time of 2–5 h in [33]. Besides the overall performance, the threat scores (TSs) and bias scores (BSs) that exhibit the nowcasting skill above certain reflectivity thresholds are also compared, defined as
T S = H H + F + M ,
B S = H + F H + M ,
where H, F, and M are, respectively, the grid point numbers of hits, false alarms, and misses above the threshold. Figure 6 and Figure 7, respectively, show the TSs and BSs of the five methods above 10, 20, and 30 dBZ thresholds at different lead times. Unlike the distinguishable RMSEs, the TSs of MAPLE and ExAMP draw above all the reflectivity thresholds at all the lead time. This indicates that both schemes have equivalent skill in predicting whether the reflectivity will exceed a certain threshold. The TSs of WRF, Lin CD, and Sal CD are obviously lower as expected, except those above the 30 dBZ threshold at the lead time of 150 min. The BSs of MAPLE and ExAMP approach the ideal value of 1 above the 10 and 20 dBZ thresholds, but those of ExAMP above the 30 dBZ threshold are smaller than 1. This indicates that ExAMP, in comparison to MAPLE, may have more grid points of misses above high reflectivity thresholds. Nevertheless, it can be asserted that serious overestimation among the grid points of hits and false alarms is the least likely to happen in the ExAMP nowcasts for its lowest RMSEs. On the contrary, almost all the BSs of WRF, Lin CD, and Sal CD are much larger than 1 particularly at longer lead times, representing serious overestimation.
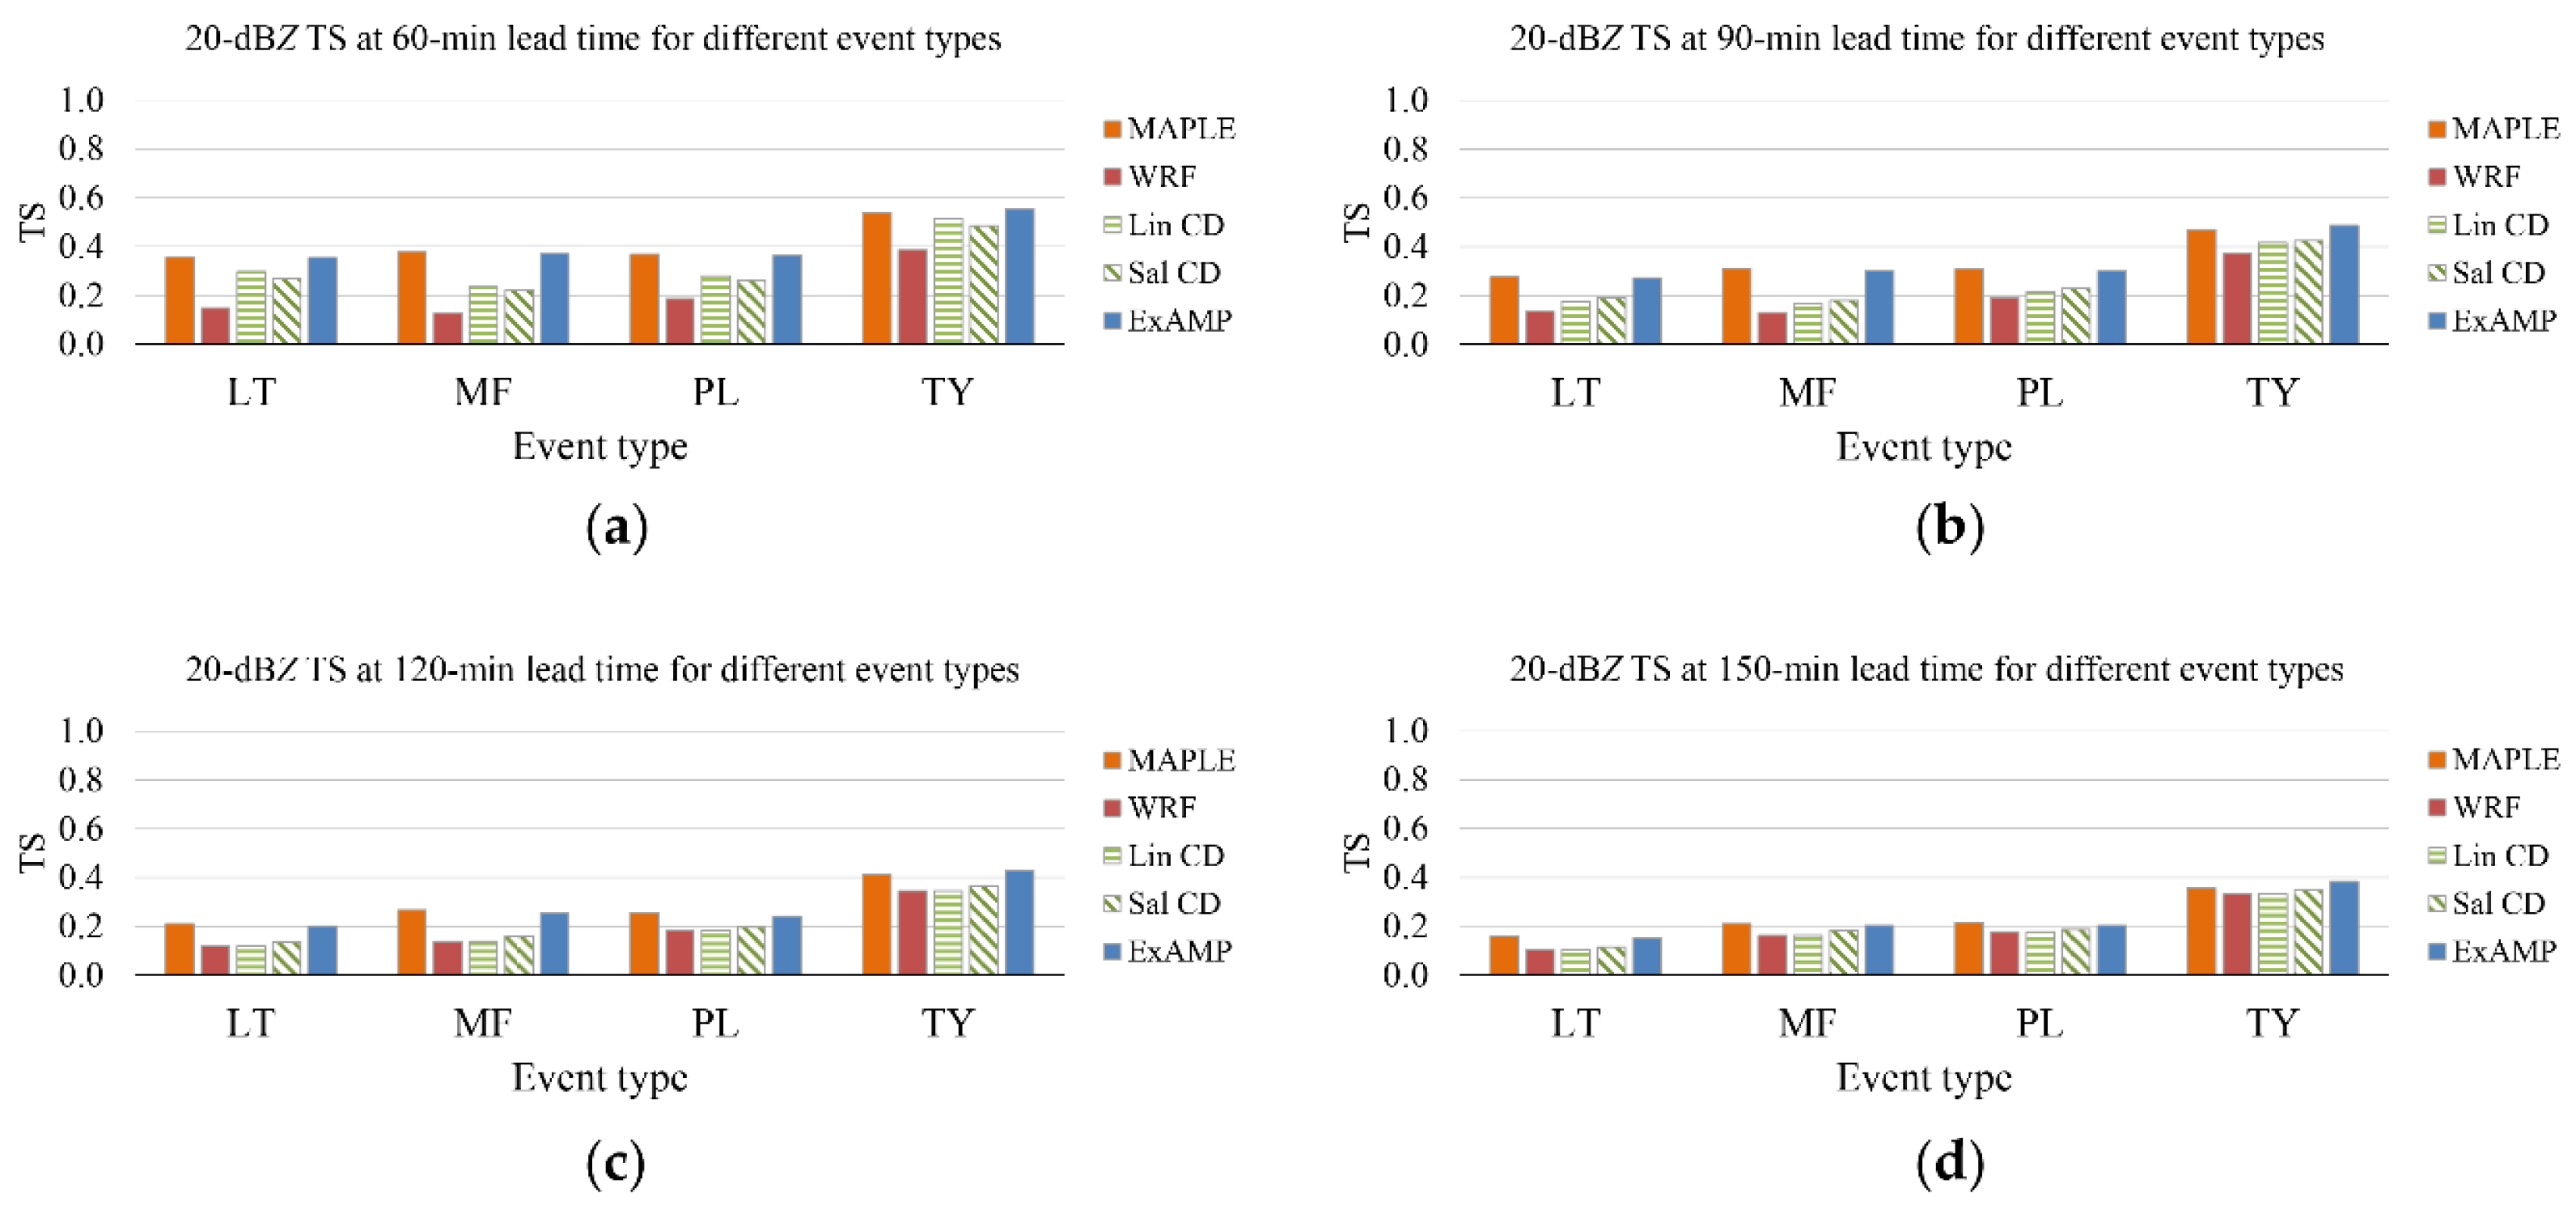
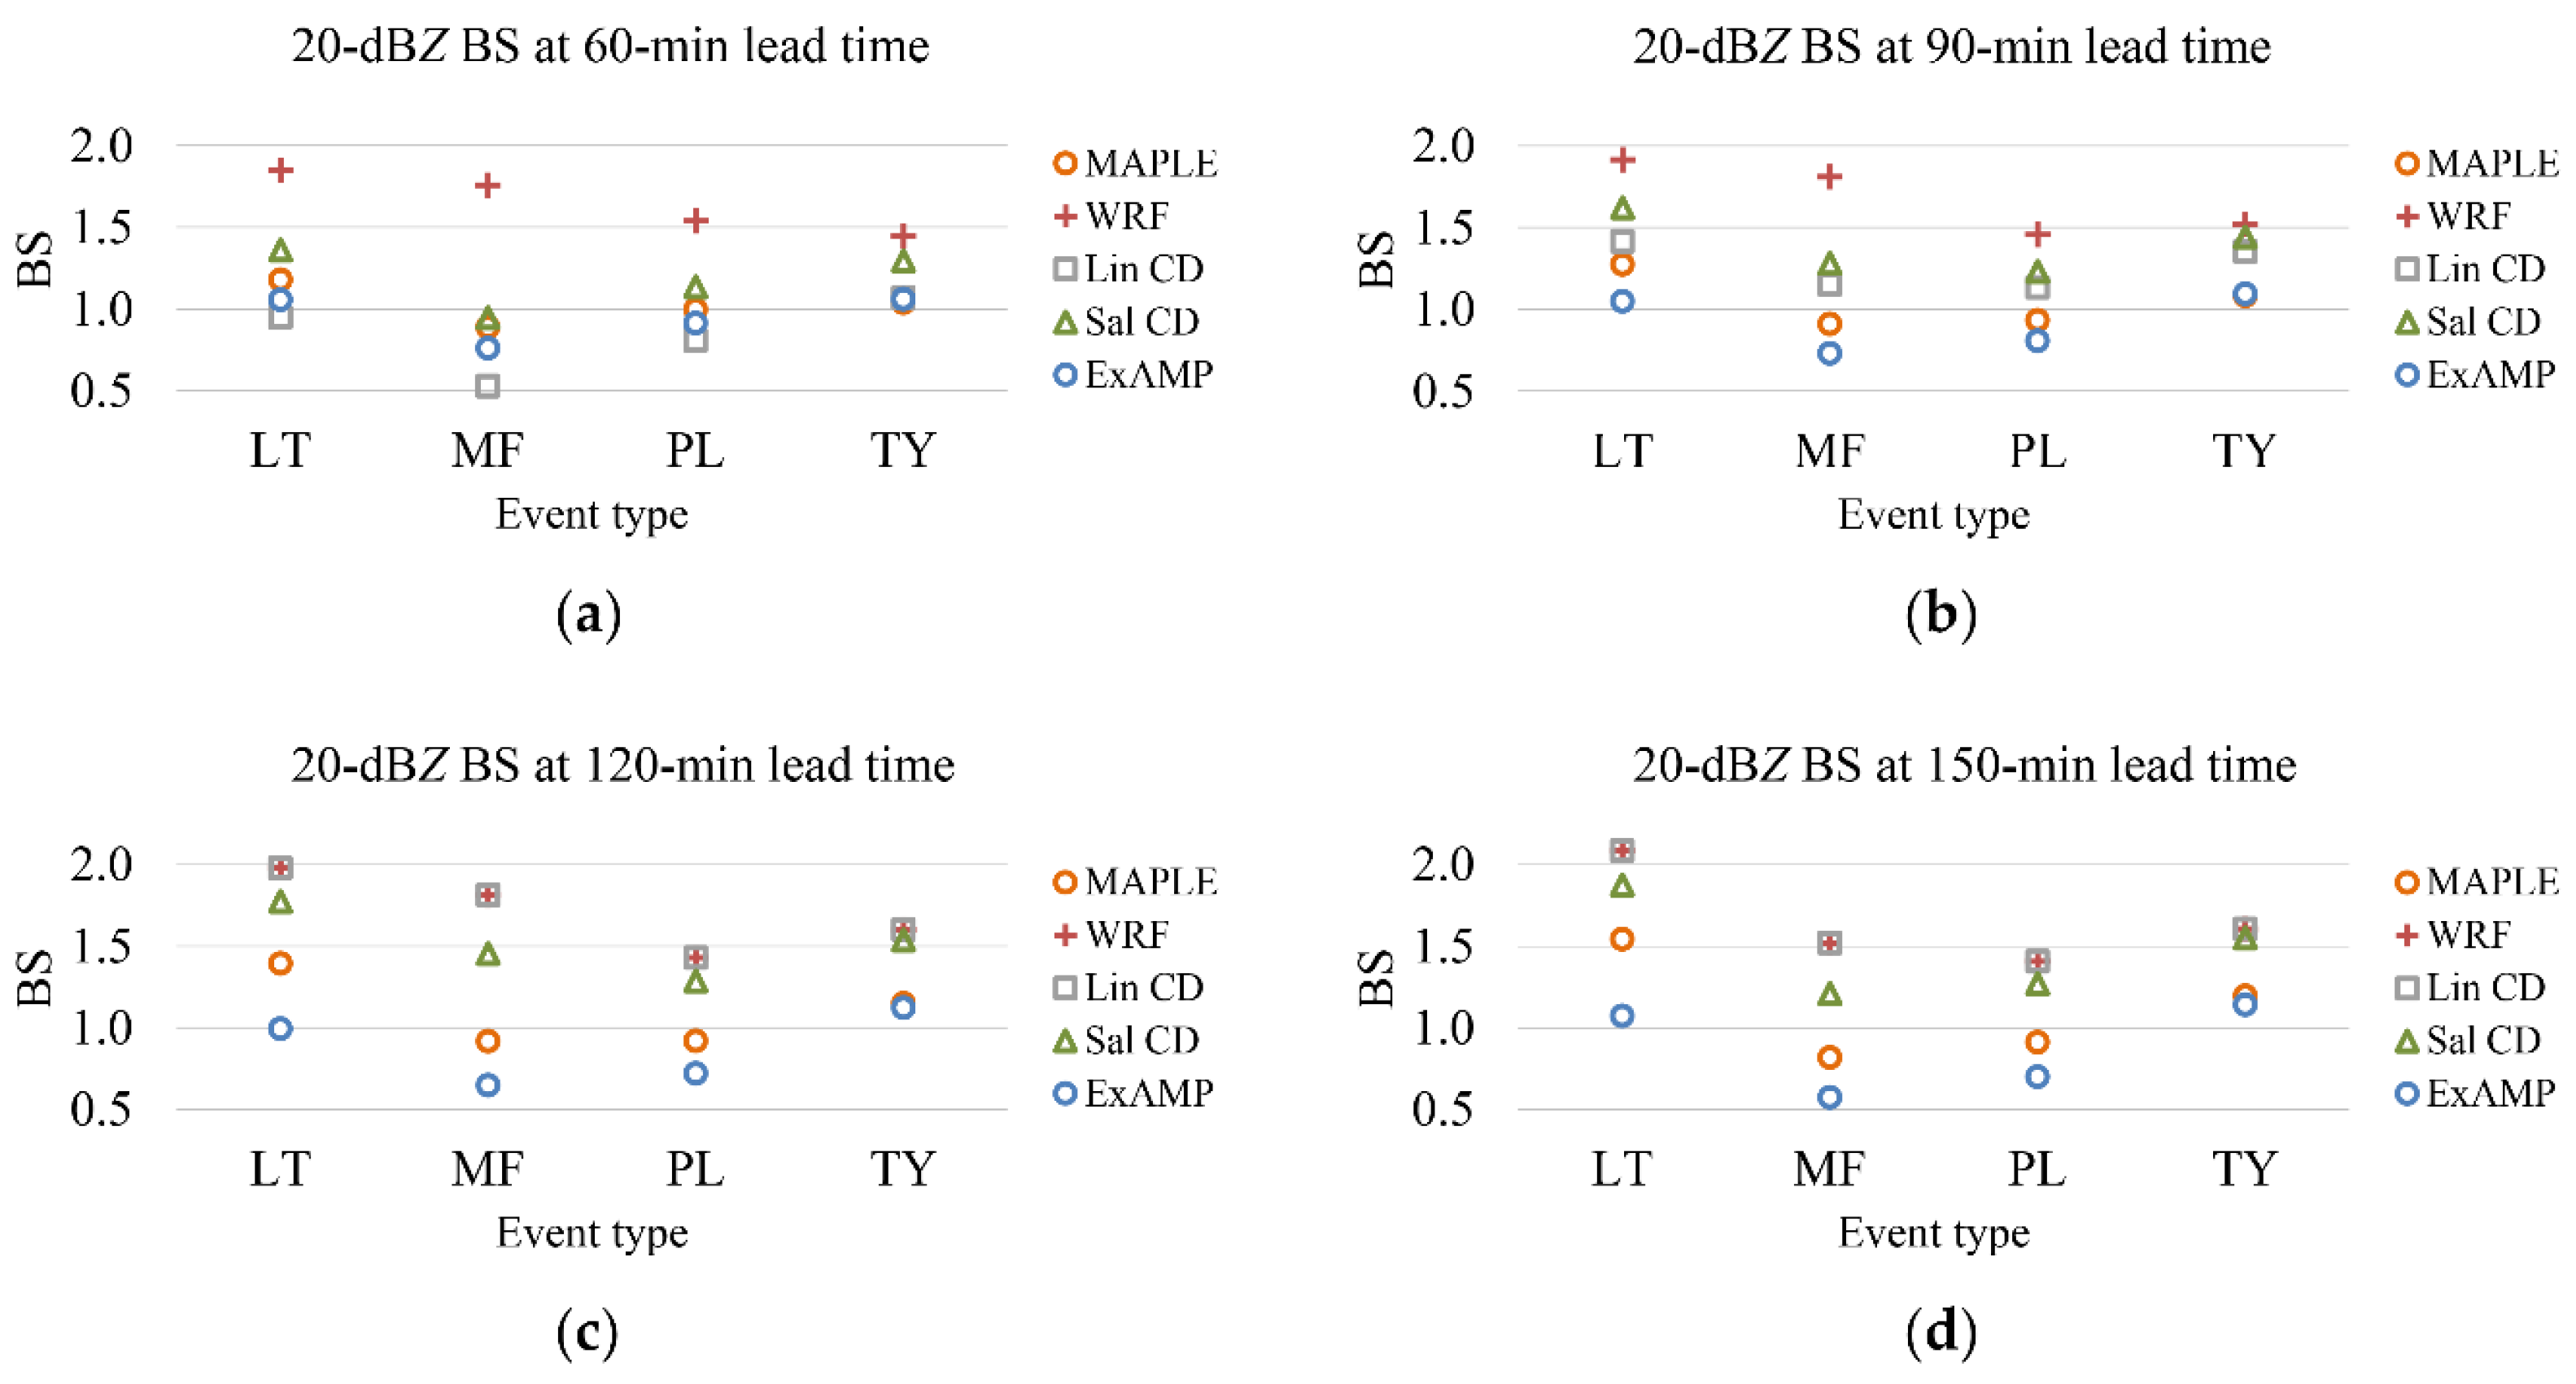
To further evaluate the performance for different types of heavy rainfall events, the TSs and BSs of the five methods for the LT, MF, PL, and TY event types above the 20 dBZ threshold at different lead times are compared in Figure 8 and Figure 9, respectively. From the TS results, the event type does not change the performance ranking of the five methods revealed in the previous overall statistics. This implies the consistent advantage of the ExAMP scheme for various severe weather systems. Comparing the TSs of the same method for different event types, TY and LT are the highest and lowest, respectively. This makes sense because typhoons have well organized, horizontally advected rainbands while the evolution of local thunderstorms is relatively vertical with high nonlinearity and unpredictable. The BS results keep the same conclusion as in the overall statistics that MAPLE and ExAMP are the only two methods immune to serious overestimation. In terms of different event types, the BSs of MAPLE and ExAMP equivalently approach the ideal value of 1 for TY, but the former is too large for LT while the latter is too small for MF and PL.

5. Summary and Future Prospect

Accurate nowcasting is the core technology of early warning for severe weather systems, such as tornadoes, thunderstorms, and flash floods. A long history of Doppler weather radar studies has revealed that radar echo extrapolation and high-resolution numerical model prediction with radar data assimilation are two major nowcasting methods, which excel at very short lead times and longer lead times, respectively. To take advantage of both, many blending schemes have been designed and evaluated in recent years. This study uses MAPLE, WRF, and three blending schemes, including Lin CD, Sal CD, and the new empirical ExAMP scheme, to perform 150 min reflectivity nowcasting experiments for the 43 periods of 10 heavy rainfall events in Taiwan in 2019. The concept of ExAMP, which has full trust in the pattern of reflectivity predicted by MAPLE but allows the intensity to be adjusted by WRF, is motivated by the authors’ experience that the variations of existing cells analyzed by radar data assimilation are more predictable than the positions of new cells. The spatial performance for two contrasting events, which respectively stand for developing and dissipating scenarios, shows that ExAMP outperforms the others with more accurate prediction of both strengthening and weakening trends. The statistical skill for all the events shows that the nowcasts by ExAMP and MAPLE obtain the lowest and second lowest RMSEs at all the lead times, respectively. Further examination of TSs and BSs implies that ExAMP may have more grid points of misses above high reflectivity thresholds in comparison to MAPLE, but serious overestimation among hits and false alarms is the least likely to happen in the ExAMP nowcasts. Moreover, the type of heavy rainfall events does not change the performance ranking of the five methods, all of which have the highest predictability for a typhoon event and the lowest for local thunderstorm events.
As this study focuses on reflectivity nowcasting, rainfall nowcasting is the one more practical and applicable to downstream water hazard information for early warning systems. For future prospects, the skill of the ExAMP scheme in blending the rainfall predicted by extrapolation and numerical model systems can also be explored and verified by rain gauge measurements. In this case, the approach of quantitative precipitation estimation (QPE) that empirically converts reflectivity to the rainfall rate such as the aforementioned Z–R relation [53] must be utilized if the extrapolation system only predicts reflectivity like MAPLE. Another approach is to directly extrapolate rainfall, which can be estimated from either reflectivity or more advanced dual-polarization radar variables for higher accuracy, e.g., [5,54]. No matter which approach is adopted, the uncertainty embedded in the empirical relations between the radar variables and rainfall rate needs to be investigated in advance. Afterward, the ExAMP scheme can hopefully benefit rainfall nowcasting as well.

Author Contributions

Conceptualization, H.-H.L., C.-C.T. and L.-Y.L.; methodology, C.-C.T., J.-C.L., Y.-C.C. and C.-Y.L.; software, H.-H.L., J.-C.L., Y.-C.C. and K.-S.C.; validation, H.-H.L. and J.-C.L.; formal analysis, H.-H.L., C.-C.T. and J.-C.L.; writing—original draft preparation, H.-H.L. and C.-C.T.; supervision, L.-Y.L. and K.-S.C.; funding acquisition, C.-C.T. All authors have read and agreed to the published version of the manuscript.

Funding

This research was funded by Taiwan’s National Science and Technology Center for Disaster Reduction (NCDR).

Acknowledgments

The authors are grateful to the editor and peer reviewers for all the comments.

Conflicts of Interest

The authors declare no conflict of interest.

References

  1. World Meteorological Organization. Manual on the Global Data-Processing and Forecasting System: Annex IV to the WMO Technical Regulations; WMO: Geneva, Switzerland, 2019; p. 148. Available online: https://library.wmo.int/doc_num.php?explnum_id=10164 (accessed on 28 October 2020).
  2. Sun, J.; Xue, M.; Wilson, J.W.; Zawadzki, I.; Ballard, S.P.; Onvlee-Hooimeyer, J.; Joe, P.; Barker, D.; Li, P.-W.; Golding, B.; et al. Use of NWP for nowcasting convective precipitation: Recent progress and challenges. Bull. Am. Meteorol. Soc. 2014, 95, 409–426. [Google Scholar] [CrossRef] [Green Version]
  3. Chung, K.-S.; Yao, I.-A. Improving radar echo Lagrangian extrapolation nowcasting by blending numerical model wind information: Statistical performance of 16 typhoon cases. Mon. Weather Rev. 2020, 148, 1099–1120. [Google Scholar] [CrossRef]
  4. Browning, K.A. Nowcasting; Academic Press: Cambridge, MA, USA, 1982; p. 256. [Google Scholar]
  5. Cunha, L.K.; Smith, J.A.; Baeck, M.L.; Krajewski, W.F. An early performance evaluation of the NEXRAD dual-polarization radar rainfall estimates for urban flood applications. Weather Forecast. 2013, 28, 1478–1497. [Google Scholar] [CrossRef]
  6. Huuskonen, A.; Saltikoff, E.; Holleman, I. The operational weather radar network in Europe. Bull. Am. Meteorol. Soc. 2014, 95, 897–907. [Google Scholar] [CrossRef]
  7. Ligda, M.G.H. The Horizontal Motion of Small Precipitation Areas as Observed by Radar; MIT: Cambridge, MA, USA, 1953; p. 60. [Google Scholar]
  8. Barclay, P.A.; Wilk, K.E. Severe Thunderstorm Radar Echo Motion and Related Weather Events Hazardous to Aviation Operations; ESSA, Tech. Memo. ERLTM-NSSL 46: Norman, OK, USA, 1970; p. 63. Available online: http://library.nwc.ou.edu/library/reports/OCRd_reports/NSSLtechnicalReport46.pdf (accessed on 28 October 2020).
  9. Browning, K.A.; Collier, C.G.; Larke, P.R.; Menmuir, P.; Monk, G.A.; Owens, R.G. On the forecasting of frontal rain using a weather radar network. Mon. Weather Rev. 1982, 110, 534–552. [Google Scholar] [CrossRef] [Green Version]
  10. Dixon, M.; Wiener, G. TITAN: Thunderstorm identification, tracking, analysis, and nowcasting—A radar-based methodology. J. Atmos. Ocean. Technol. 1993, 10, 785–797. [Google Scholar] [CrossRef]
  11. Johnson, J.T.; MacKeen, P.L.; Witt, A.; Mitchell, E.D.; Stumpf, G.J.; Eilts, M.D.; Thomas, K.W. The storm cell identification and tracking algorithm: An enhanced WSR-88D algorithm. Weather Forecast. 1998, 13, 263–276. [Google Scholar] [CrossRef] [Green Version]
  12. Hering, A.M.; Morel, C.; Galli, G.; Senesi, S.; Ambrosetti, P.; Boscacci, M. Nowcasting thunderstorms in the Alpine region using a radar based adaptive thresholding scheme. In Proceedings of the Third European Conference on Radar Meteorology, Visby, Sweden, 6–10 September 2004. [Google Scholar]
  13. Jung, S.-H.; Lee, G. Radar-based cell tracking with fuzzy logic approach. Meteorol. Appl. 2015, 22, 716–730. [Google Scholar] [CrossRef] [Green Version]
  14. Austin, G.L.; Bellon, A. The use of digital weather radar records for short-term precipitation forecasting. Q. J. R. Meteorol. Soc. 1974, 100, 658–664. [Google Scholar] [CrossRef]
  15. Rinehart, R.E.; Garvey, E.T. Three-dimensional storm motion detection by conventional weather radar. Nature 1978, 273, 287–289. [Google Scholar] [CrossRef]
  16. Laroche, S.; Zawadzki, I. A variational analysis method for retrieval of three-dimensional wind field from single-Doppler radar data. J. Atmos. Sci. 1994, 51, 2664–2682. [Google Scholar] [CrossRef] [Green Version]
  17. Li, L.; Schmid, W.; Joss, J. Nowcasting of motion and growth of precipitation with radar over a complex orography. J. Appl. Meteorol. Climatol. 1995, 34, 1286–1300. [Google Scholar] [CrossRef] [Green Version]
  18. Germann, U.; Zawadzki, I. Scale-dependence of the predictability of precipitation from continental radar images. Part I: Description of the methodology. Mon. Weather Rev. 2002, 130, 2859–2873. [Google Scholar] [CrossRef]
  19. Bowler, N.E.H.; Pierce, C.E.; Seed, A. Development of a precipitation nowcasting algorithm based upon optical flow techniques. J. Hydrol. 2004, 288, 74–91. [Google Scholar] [CrossRef]
  20. Ruzanski, E.; Chandrasekar, V.; Wang, Y. The CASA Nowcasting System. J. Atmos. Ocean. Technol. 2011, 28, 640–655. [Google Scholar] [CrossRef]
  21. Sun, J. Initialization and numerical forecasting of a supercell storm observed during STEPS. Mon. Weather Rev. 2005, 133, 793–813. [Google Scholar] [CrossRef]
  22. Xiao, Q.; Kuo, Y.-H.; Sun, J.; Lee, W.-C.; Lim, E.; Guo, Y.-R.; Barker, D.M. Assimilation of Doppler radar observations with a regional 3DVAR system: Impact of Doppler velocities on forecasts of a heavy rainfall case. J. Appl. Meteorol. Climatol. 2005, 44, 768–788. [Google Scholar] [CrossRef]
  23. Xiao, Q.; Sun, J. Multiple-radar data assimilation and short-range quantitative precipitation forecasting of a squall line observed during IHOP_2002. Mon. Weather Rev. 2007, 135, 3381–3404. [Google Scholar] [CrossRef]
  24. Sun, J.; Zhang, Y. Analysis and prediction of a squall line observed during IHOP using multiple WSR-88D observations. Mon. Weather Rev. 2008, 136, 2364–2388. [Google Scholar] [CrossRef]
  25. Sugimoto, S.; Crook, N.A.; Sun, J.; Xiao, Q.; Barker, D.M. An examination of WRF 3DVAR radar data assimilation on its capability in retrieving unobserved variables and forecasting precipitation through Observing System Simulation Experiments. Mon. Weather Rev. 2009, 137, 4011–4029. [Google Scholar] [CrossRef]
  26. Tai, S.-L.; Liou, Y.-C.; Sun, J.; Chang, S.-F.; Kuo, M.-C. Precipitation forecasting using Doppler radar data, a cloud model with adjoint, and the Weather Research and Forecasting model: Real case studies during SoWMEX in Taiwan. Weather Forecast. 2011, 26, 975–992. [Google Scholar] [CrossRef]
  27. Tsai, C.-C.; Yang, S.-C.; Liou, Y.-C. Improving quantitative precipitation nowcasting with a local ensemble transform Kalman filter radar data assimilation system: Observing system simulation experiments. Tellus A 2014, 66, 21804. [Google Scholar] [CrossRef] [Green Version]
  28. Yang, S.-C.; Huang, Z.-M.; Huang, C.-Y.; Tsai, C.-C.; Yeh, T.-K. Convective-scale assimilation with the GNSS-ZTD and radar data and its impact on heavy rainfall prediction in Taiwan. Mon. Weather Rev. 2020, 148, 1075–1098. [Google Scholar] [CrossRef]
  29. Golding, B.W. Nimrod: A system for generating automated very short range forecasts. Meteorol. Appl. 1998, 5, 1–16. [Google Scholar] [CrossRef]
  30. Cullen, M.J.P. The unified forecast/climate model. Meteor Mag. 1993, 122, 81–94. Available online: https://www.ecmwf.int/en/elibrary/8836-unified-forecast-climate-model (accessed on 28 October 2020).
  31. Wang, G.; Wong, W.-K.; Hong, Y.; Liu, L.; Dong, J.; Xue, M. Improvement of forecast skill for severe weather by merging radar-based extrapolation and storm-scale NWP corrected forecast. Atmos. Res. 2015, 154, 14–24. [Google Scholar] [CrossRef]
  32. Hu, M.; Xue, M.; Brewster, K. 3DVAR and cloud analysis with WSR-88D level-II data for the prediction of the Fort Worth, Texas, tornadic thunderstorms. Part I: Cloud analysis and its impact. Mon. Weather Rev. 2006, 134, 675–698. [Google Scholar] [CrossRef]
  33. Hwang, Y.; Clark, A.J.; Lakshmanan, V.; Koch, S.E. Improved nowcasts by blending extrapolation and model forecasts. Weather Forecast. 2015, 30, 1201–1217. [Google Scholar] [CrossRef]
  34. Grundland, M.; Vohra, R.; Williams, G.P.; Dodgson, N.A. Cross dissolve without cross fade: Preserving contrast, color and salience in image compositing. Comput. Graph. Forum 2006, 25, 577–586. [Google Scholar] [CrossRef] [Green Version]
  35. Benjamin, S.G.; Weygandt, S.S.; Brown, J.M.; Hu, M.; Alexander, C.R.; Smirnova, T.G.; Olson, J.B.; James, E.P.; Dowell, D.C.; Grell, G.A.; et al. A North American hourly assimilation and model forecast cycle: The Rapid Refresh. Mon. Weather Rev. 2016, 144, 1669–1694. [Google Scholar] [CrossRef]
  36. Skamarock, W.C.; Klemp, J.B.; Dudhia, J.; Gill, D.O.; Liu, Z.; Berner, J.; Wang, W.; Powers, J.G.; Duda, M.G.; Barker, D.M.; et al. A Description of the Advanced Research WRF Model Version 4; Technical Note NCAR/TN-556+STR; NCAR: Boulder, CO, USA, 2019; p. 145. [Google Scholar] [CrossRef]
  37. Yoon, S.-S. Adaptive blending method of radar-based and numerical weather prediction QPFs for urban flood forecasting. Remote Sens. 2019, 11, 642. [Google Scholar] [CrossRef] [Green Version]
  38. Poletti, M.L.; Silvestro, F.; Davolio, S.; Pignone, F.; Rebora, N. Using nowcasting technique and data assimilation in a meteorological model to improve very short range hydrological forecasts. Hydrol. Earth Syst. Sci. 2019, 23, 3823–3841. [Google Scholar] [CrossRef] [Green Version]
  39. Malguzzi, P.; Grossi, G.; Buzzi, A.; Ranzi, R.; Buizza, R. The 1966 “century” flood in Italy: A meteorological and hydrological revisitation. J. Geophys. Res. 2006, 111, D24106. [Google Scholar] [CrossRef]
  40. Metta, S.; von Hardenberg, J.; Ferraris, L.; Rebora, N.; Provenzale, A. Precipitation nowcasting by a spectral-based nonlinear stochastic model. J. Hydrometeorol. 2009, 10, 1285–1297. [Google Scholar] [CrossRef]
  41. Silvestro, F.; Gabellani, S.; Delogu, F.; Rudari, R.; Boni, G. Exploiting remote sensing land surface temperature in distributed hydrological modelling: The example of the Continuum model. Hydrol. Earth Syst. Sci. 2013, 17, 39–62. [Google Scholar] [CrossRef] [Green Version]
  42. Robert, A. A stable numerical integration scheme for the primitive meteorological equations. Atmos. Ocean 1981, 19, 35–46. [Google Scholar] [CrossRef] [Green Version]
  43. Morrison, H.; Thompson, G.; Tatarskii, V. Impact of cloud microphysics on the development of trailing stratiform precipitation in a simulated squall line: Comparison of one- and two-moment schemes. Mon. Weather Rev. 2009, 137, 991–1007. [Google Scholar] [CrossRef] [Green Version]
  44. Mlawer, E.J.; Taubman, S.J.; Brown, P.D.; Iacono, M.J.; Clough, S.A. Radiative transfer for inhomogeneous atmosphere: RRTM, a validated correlated-k model for the longwave. J. Geophys. Res. 1997, 102, 16663–16682. [Google Scholar] [CrossRef] [Green Version]
  45. Chou, M.-D.; Suarez, M.J. An Efficient Thermal Infrared Radiation Parameterization for Use in General Circulation Models; NASA, Tech. Memo: Washington, DC, USA, 1994; p. 85.
  46. Jiménez, P.A.; Dudhia, J.; González-Rouco, J.F.; Navarro, J.; Montávez, J.P.; García-Bustamante, E. A revised scheme for the WRF surface layer formulation. Mon. Weather Rev. 2012, 140, 898–918. [Google Scholar] [CrossRef] [Green Version]
  47. Chen, F.; Dudhia, J. Coupling an advanced land surface-hydrology model with the Penn State-NCAR MM5 modeling system. Part I: Model implementation and sensitivity. Mon. Weather Rev. 2001, 129, 569–585. [Google Scholar] [CrossRef] [Green Version]
  48. Hong, S.-Y.; Noh, Y.; Dudhia, J. A new vertical diffusion package with an explicit treatment of entrainment processes. Mon. Weather Rev. 2006, 134, 2318–2341. [Google Scholar] [CrossRef] [Green Version]
  49. Kain, J.S. The Kain-Fritsch convective parameterization: An update. J. Appl. Meteorol. Climatol. 2004, 43, 170–181. [Google Scholar] [CrossRef] [Green Version]
  50. Sasaki, Y. An objective analysis based on the variational method. J. Meteorol. Soc. Japan 1958, 36, 77–88. [Google Scholar] [CrossRef] [Green Version]
  51. Sun, J.; Wang, H.; Tong, W.; Zhang, Y.; Lin, C.-Y.; Xu, D. Comparison of the impacts of momentum control variables on high-resolution variational data assimilation and precipitation forecasting. Mon. Weather Rev. 2014, 144, 149–169. [Google Scholar] [CrossRef]
  52. Zhang, J.; Howard, K.; Langston, C.; Vasiloff, S.; Kaney, B.; Arthur, A.; Van Cooten, S.; Kelleher, K.; Kitzmiller, D.; Ding, F.; et al. National Mosaic and Multi-Sensor QPE (NMQ) system: Description, results, and future plans. Bull. Am. Meteorol. Soc. 2011, 92, 1321–1338. [Google Scholar] [CrossRef] [Green Version]
  53. Xin, L.; Reuter, G.; Larochelle, B. Reflectivity-rain rate relationships for convective rainshowers in Edmonton: Research note. Atmos. Ocean 1997, 35, 513–521. [Google Scholar] [CrossRef]
  54. Wang, Y.; Chandrasekar, V. Quantitative precipitation estimation in the CASA X-band dual-polarization radar network. J. Atmos. Ocean. Technol. 2010, 27, 1665–1676. [Google Scholar] [CrossRef]
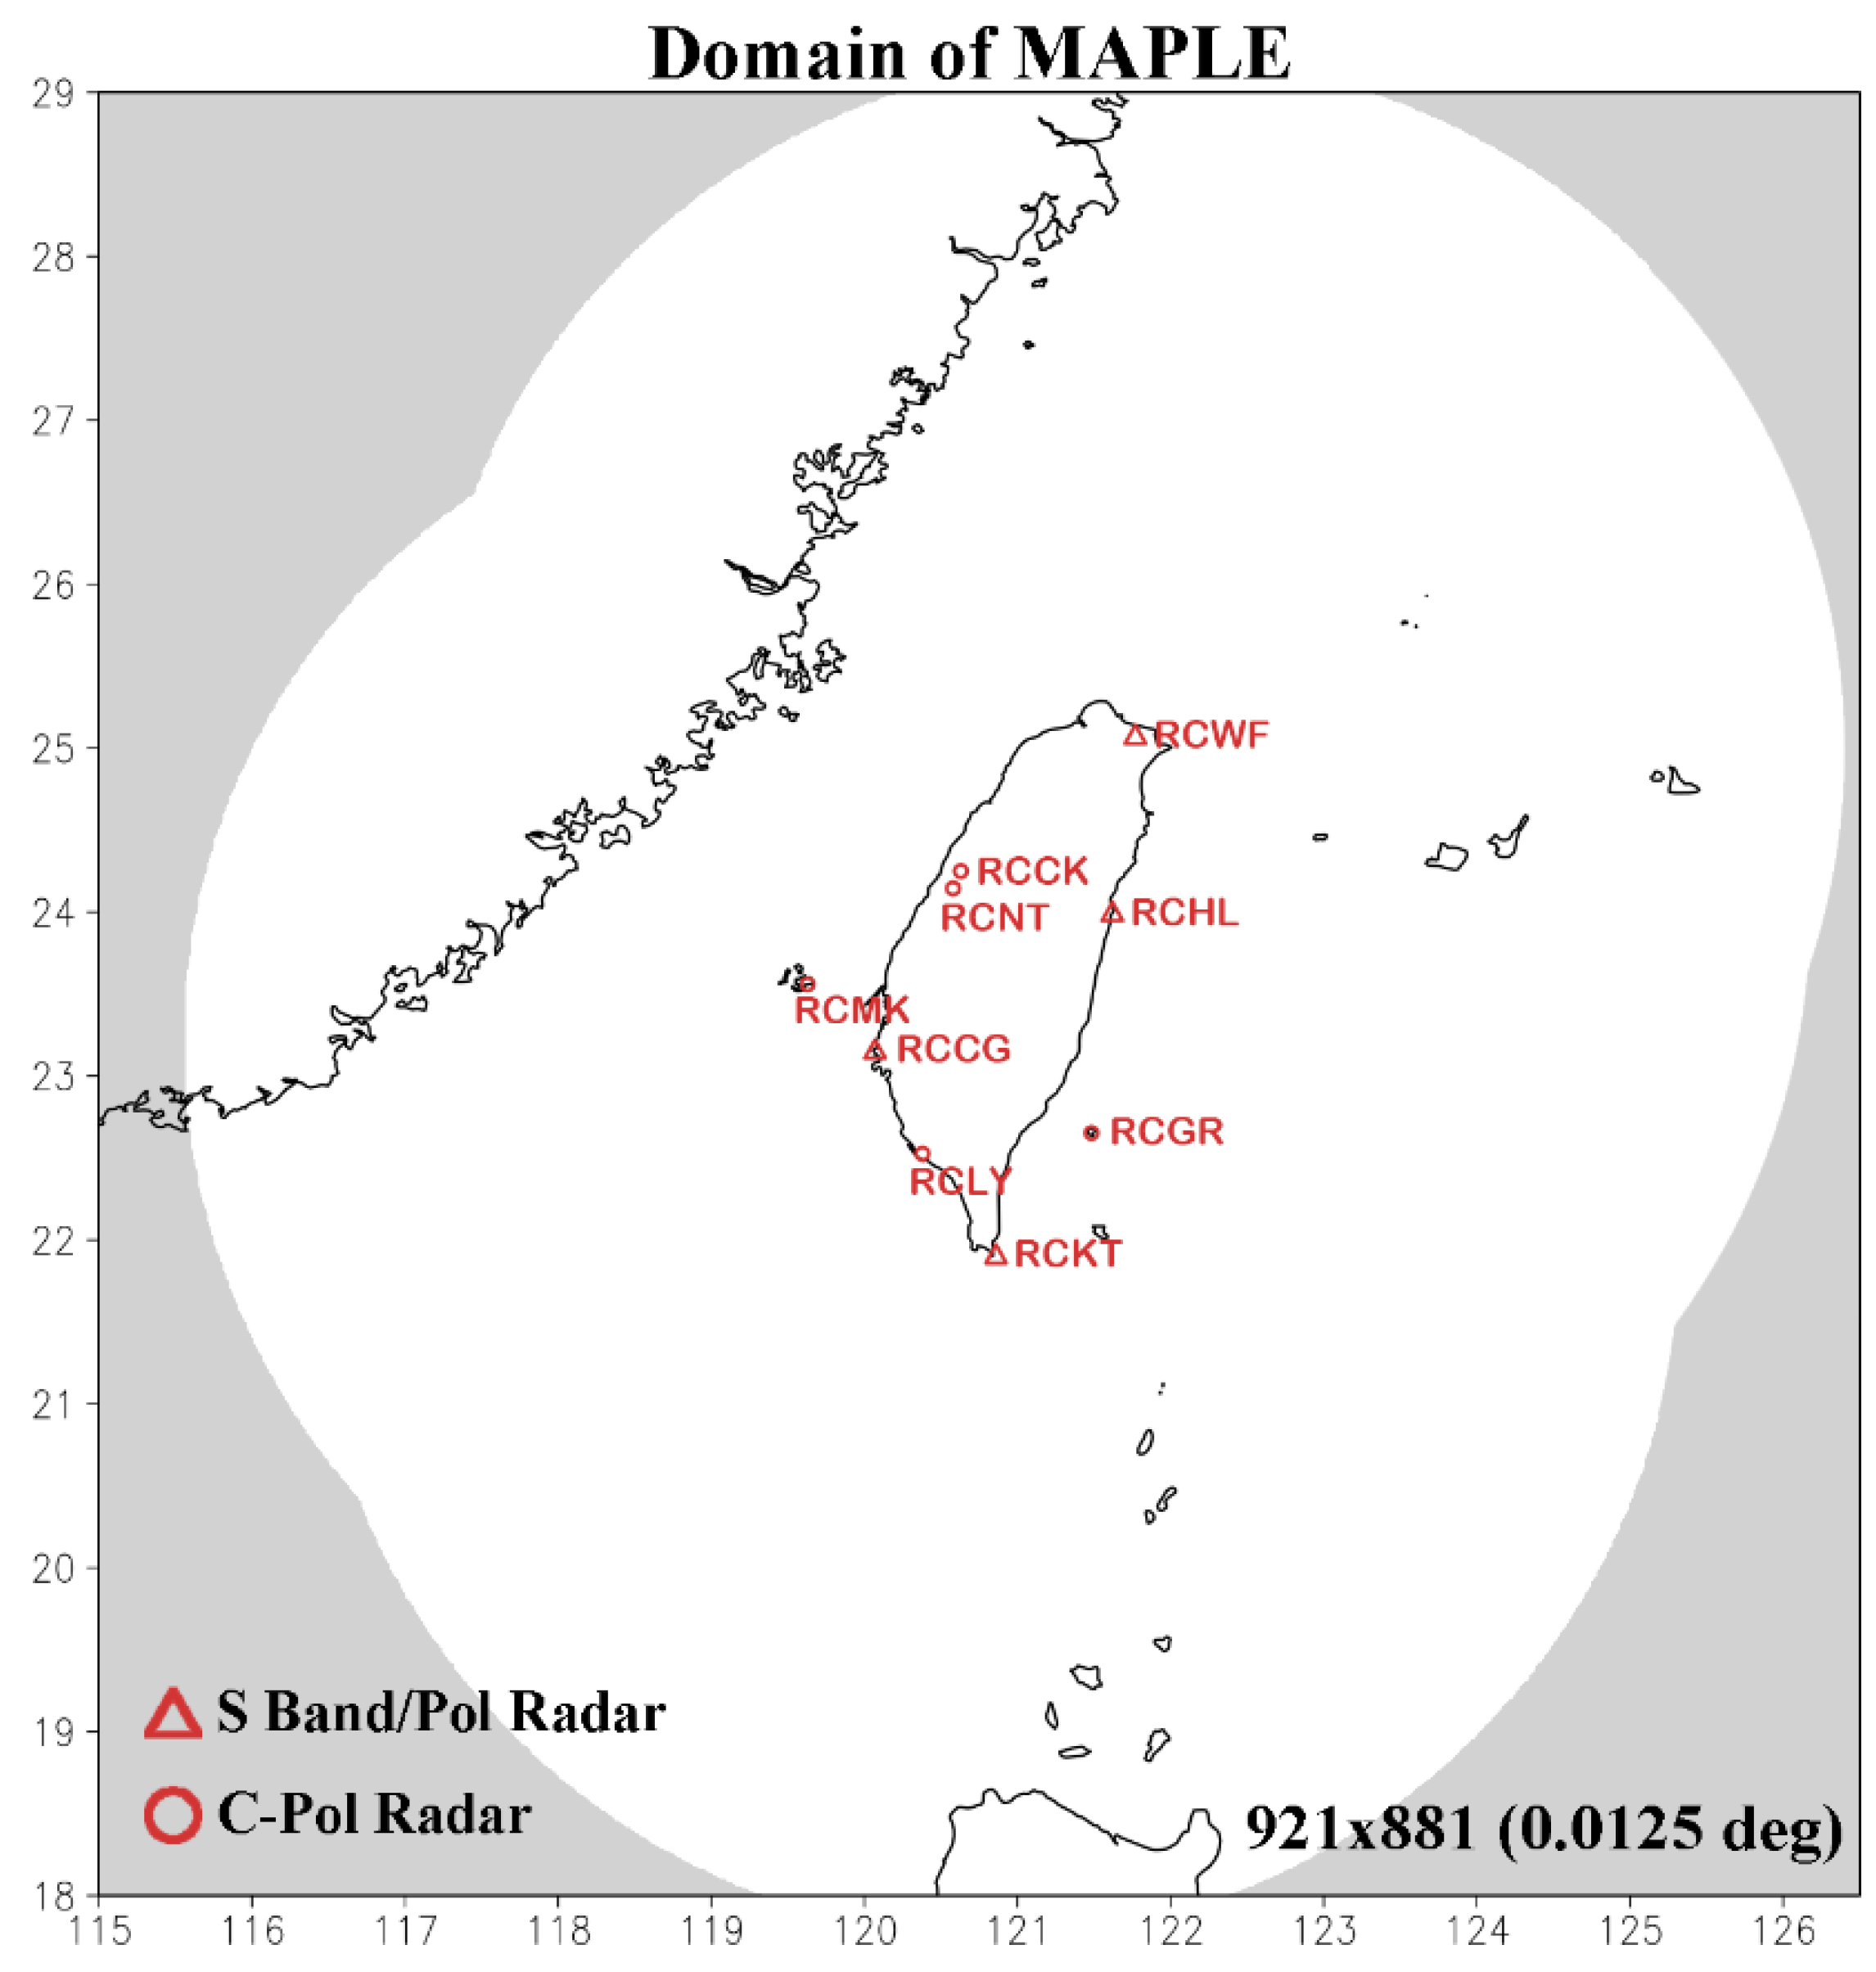
Figure 1. The simulation domain of the McGill Algorithm for Precipitation Nowcasting by Lagrangian Extrapolation (MAPLE) and the reflectivity coverage area (in white) of nine Doppler weather radars used by MAPLE. The domain has 921 × 881 horizontal grid points with 0.0125° spacing.
Atmosphere 11 01166 g001
Figure 2. The two-way interactive, double-nested simulation domains of the Weather Research and Forecasting (WRF) model. Domains 1 and 2 have 280 × 280 and 331 × 331 horizontal grid points with 15 and 3 km spacing, respectively.
Atmosphere 11 01166 g002
Figure 3. The reflectivity and corresponding rainfall rate of (from left to right) the observations and the nowcasts of MAPLE, WRF, linear cross dissolve (Lin CD), salient cross dissolve (Sal CD), and extrapolation adjusted by model prediction (ExAMP) at the lead time of (from top to bottom) 0, 60, 90, 120, and 150 min for a PL event at 10:00 UTC 2 July. Rectangles A and B highlight the discussed areas.
Atmosphere 11 01166 g003
Figure 4. As in Figure 3, but for an LT event at 10:30 UTC 2 August. Rectangles C, D and E highlight the discussed areas.
Atmosphere 11 01166 g004
Figure 5. The root mean square errors (RMSEs) of the reflectivity predicted by MAPLE, WRF, Lin CD, Sal CD, and ExAMP at the lead times of 60, 90, 120, and 150 min, computed over the grid points with observed reflectivity exceeding 0 dBZ for the 43 periods.
Atmosphere 11 01166 g005
Figure 6. The threat scores (TSs) of MAPLE, WRF, Lin CD, Sal CD, and ExAMP above (a) 10, (b) 20, and (c) 30 dBZ thresholds at the lead times of 90, 120, and 150 min, computed over the grid points with observed reflectivity exceeding 0 dBZ for the 43 periods.
Atmosphere 11 01166 g006
Figure 7. The bias scores (BSs) of MAPLE, WRF, Lin CD, Sal CD, and ExAMP above (a) 10, (b) 20, and (c) 30 dBZ thresholds at the lead times of 90, 120, and 150 min, computed over the grid points with observed reflectivity exceeding 0 dBZ for the 43 periods.
Atmosphere 11 01166 g007
Figure 8. The TSs of MAPLE, WRF, Lin CD, Sal CD, and ExAMP for the LT, MF, PL, and TY event types above the 20 dBZ threshold at the lead times of (a) 60, (b) 90, (c) 120, and (d) 150 min, computed over the grid points with observed reflectivity exceeding 0 dBZ.
Atmosphere 11 01166 g008
Figure 9. The BSs of MAPLE, WRF, Lin CD, Sal CD, and ExAMP for the LT, MF, PL, and TY event types above the 20 dBZ threshold at the lead times of (a) 60, (b) 90, (c) 120, and (d) 150 min, computed over the grid points with observed reflectivity exceeding 0 dBZ.
Atmosphere 11 01166 g009
Table 1. The classification of the sampled heavy rainfall events in 2019.
Event TypeNo. of PeriodsEvent Date
Local thunderstorm (LT)115/24 (1), 8/1 (5), 8/2 (5)
Mei-yu front (MF)45/28 (3), 5/29 (1)
Periphery of low pressure (PL)196/11 (3), 6/12 (1), 7/2 (10), 8/6 (5)
Typhoon (TY)98/24 (9)
Total4310 events
Publisher’s Note: MDPI stays neutral with regard to jurisdictional claims in published maps and institutional affiliations.