Precipitation Nowcasting with Weather Radar Images and Deep Learning in São Paulo, Brasil


1
Civil Engineering Program/COPPE, Federal University of Rio de Janeiro, Rio de Janeiro 21941-909, Brazil
2
Department of Atmospheric Sciences, University of São Paulo, São Paulo 05508-090, Brazil
*
Author to whom correspondence should be addressed.
Atmosphere 2020, 11(11), 1157; https://doi.org/10.3390/atmos11111157
Submission received: 25 September 2020
/
Revised: 6 October 2020
/
Accepted: 8 October 2020
/
Published: 27 October 2020
(This article belongs to the Section Meteorology)
Abstract
:Precipitation nowcasting can predict and alert for any possibility of abrupt weather changes which may cause both human and material risks. Most of the conventional nowcasting methods extrapolate weather radar echoes, but precipitation nowcasting is still a challenge, mainly due to rapid changes in meteorological systems and time required for numerical simulations. Recently video prediction deep learning (VPDL) algorithms have been applied in precipitation nowcasting. In this study, we use the VPDL PredRNN++ and sequences of radar reflectivity images to predict the future sequence of reflectivity images for up to 1-h lead time for São Paulo, Brazil. We also verify the feasibility for the continuous use of the VPDL model, providing the meteorologist with trends and forecasts in precipitation edges regardless of the weather event occurring. The results obtained confirm the potential of the VPDL model as an additional tool to assist nowcasting. Even though meteorological systems that trigger natural disasters vary by location, a general solution can contribute as a tool to assist decision-makers and consequently issue efficient alerts.
1. Introduction
The occurrence of severe weather events, such as storms, tornadoes, lightning, strong winds, can cause damage to human lives and social, economic and environmental assets of communities and countries [1,2,3]. According to Golnaraghi et al. [1], between 1970 and 2012, floods, mass movement, and storms accounted for 85% of disasters linked to weather, climate and water extremes, responsible for more than 1 million deaths and caused an economic loss of about USD 2 billion across the globe. Moreover, floods are expected to be more complex and affect more people with temperature rise due to climate change [4,5].
In addition to people in situations vulnerable to severe weather phenomena, floods also affect decision-makers in disaster management, energy, agriculture and aviation agencies, which are responsible for safety and administration. The possibility of obtaining accurate hazardous weather warnings at least one hour in advance could help in the planning and mobilization of the responsible agencies and may contribute to reducing losses, mitigating damage and saving lives.
Precipitation nowcasting tools have been used to forecast severe weather events. Briefly, this comprises a detailed description of the current weather to make predictions for a small range (meters to few kilometers) and for a short period of time (0 to 6 h) [6]. In general, severe storms are localized, with a small spatial area and a short duration (life cycle). One type of precipitation nowcasting is based on weather radars, due to its high spatial (~1 km) and temporal resolutions (~5 min) [6,7,8,9,10].
Several methodologies applicable to nowcasting can be found in the literature, from the analysis of meteorological variables, such as the evaluation of images from weather radars or satellites [9,11,12,13,14], evaluation of observed meteorological variables like wind and precipitation, and instability indexes from radiosonde [9,11,12,13,14], to predicting methods, such as models of Eulerian persistence [10,15], models of Lagrangian persistence (e.g., optical flow) [10,15], models of mathematical extrapolation of images from weather radars or satellites [9,10,11,15,16,17,18] and computational intelligence models [19,20,21]. Nowcasting systems can use only one of these methods or combine several of them [11,12,18].
The most-used predicting method for nowcasting is the extrapolation model: either based on cell tracking or based on area tracking. The former is principally designed to locate severe weather objects (mostly convective), while the latter is better for stratiform precipitation. These models use many radar products, such as volume scan, the definition of the movement field for system advection, fixed reflectivity, precipitation relationship, and fixed thresholds for system detection (such as size and intensity) [10,17].
Extrapolation models conserve the elements in the image and advect these elements by a motion field or vector, so they only change the position of the storm cells; taking a cloud as an example of an image element, these models cannot predict dissipation due to rain, or the formation of a new cloud where there was nothing before [22]. In addition, observed storms cannot significantly deviate from their path [13]. Pierce et al. [15] enumerated some limitations in nowcasting models. For example, a typical error is the identification of the storm, leading to tracking errors (speed and direction) and the wrong estimate of intensity. Additionally, because of mistakes in the estimation of size and lifetime, the forecast quality decrease.
Extrapolation models do not take physical processes into account, unless the nowcasting system uses a field of a numerical weather prediction model as input, the usage of this method is restricted in time (~60 min) and space, due to the nonlinearity of meteorological systems and cloud dynamics [10]. So, only very complex nowcasting systems (e.g., the Auto Nowcast system [23]), that combine many techniques and observational data, are able to predict storm initiation or decay. Furthermore, some points that limit the predictability of nowcasting are: intrinsic features of weather events [24]; model definition and parameterizations [24]; topography [24]; observational data, that may contain uncertainty, noise, spurious data, and insufficient spatial and temporal coverage [20,24]; computational resources, which are still limited to evaluate and integrate information to solve these problems in time to be used for decision-making [20].
Apart from conventional methods, recent applications of video prediction deep learning (VPDL) algorithms using weather radar images have shown good possibilities for precipitation nowcasting [25]. These are data-driven models that show promise for the building and integration of understanding the weather system [26]. VPDL combines computer vision (convolutional layers) with the memory of temporal aspects of the time series (recurrent layers) in a data-driven spatiotemporal model. Most of these solutions are not specific for precipitation nowcasting, and they have been used for diverse datasets such as moving-MNIST [27], people movement [28], and animal migration [29].
Shi et al. [27] proposed the Convolutional Long Short-Term Memory (ConvLSTM) neural network unit to model the spatiotemporal relationships between frames of a video, extending the idea of fully connected LSTM to convolutional structures. The ConvLSTM model was applied to precipitation nowcasting [27].
Wang et al. [28] proposed the Predictive Recurrent Neural Network (PredRNN) model, composed by spatiotemporal LSTM (ST-LSTM) as the basic unit. Different from the ConvLSTM unit, which has only temporal memory, the ST-LSTM unit memorizes both spatial appearances and temporal variations. As in Shi et al. [27], PredRNN was also applied to the weather radar sequences of images.
Shi et al. [30] proposed the Trajectory Gated Recurrent Unit (TrajGRU) algorithm, which learns the location-variant structure—intrinsic of natural motion, as an improvement of the ConvLSTM. Tran, and Song [31], following the suggestions of Klein et al. [32] and Mathieu et al. [33], adapted the TrajGRU model using image quality assessment metrics as the loss function for the same problem of precipitation nowcasting, in order to reduce the blurry image issue.
Franch et al. [25] presented a method to improve the nowcasting skills of VPDL models, in particular for extreme rain rates, by combining orographic features with a model ensemble. They used the TrajGRU algorithm as a baseline model to build the ensembles, where the ensemble members have different rain thresholds as input. The proposed method doubled the forecasting skill of the VPDL model in extreme precipitations.
Purely VPDL models are subject to the same restriction as any model using just mathematical extrapolation of images. Both lack the physics and dynamics behind cloud formation and dissipation that would differentiate the application of video prediction for nowcasting problems from common video prediction problems, such as the movement of digits [34]. Nevertheless, we expect the VPDL to learn the effect of the topography and dynamics of the cloud life cycle from a series of reflectivity images.
In this study, we evaluate the applicability of a VPDL model as a tool to support nowcasting. We also evaluate the feasibility of the continuous use of the VPDL model, providing the meteorologist with trends and forecasts in precipitation edges regardless of the weather event occurring. We predict reflectivity images and precipitation edges from weather radar images for up to 1-h lead time using the PredRNN++ model [35] as a VPDL model and radar reflectivity at only one level of measurement (0.5° Plan Position Indicator—PPI) as a single input. The PredRNN++ model is compared to the conventional precipitation nowcasting model, Ensemble NowCASTing (ENCAST), which is the model operationally used by the Hydraulic Technology Center Foundation (FCTH, Portuguese acronym), in three case studies. We evaluate the model’s performance and propose a number of improvements. Even though meteorological systems that trigger natural disasters vary by location, a general solution can contribute as a tool to assist decision-makers and consequently issue efficient alerts.
2. Materials and Methods
2.1. Dataset
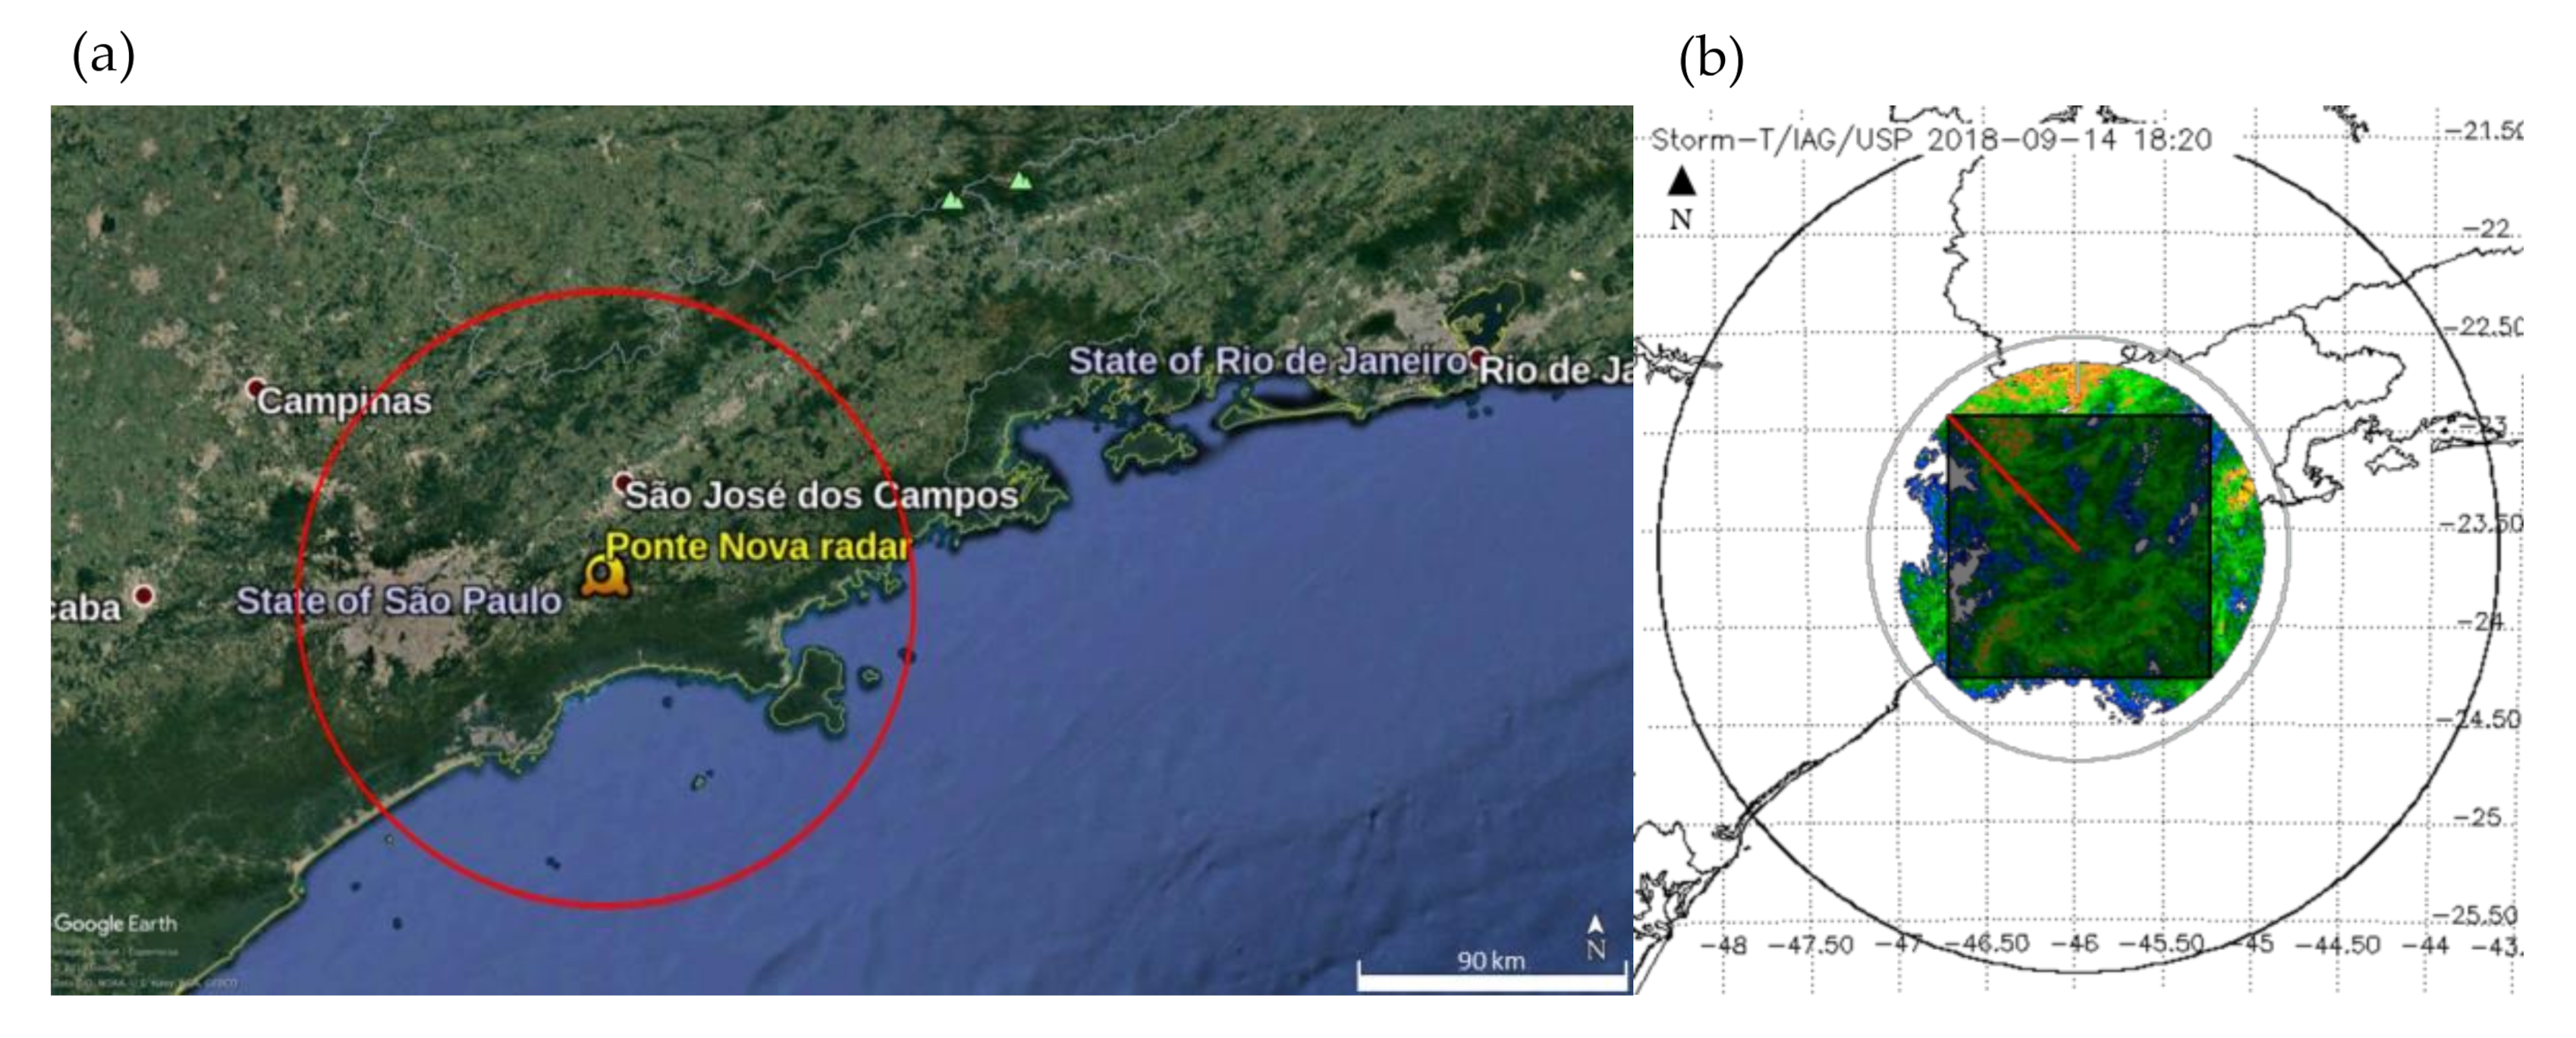
This study uses a dual-polarization S-band (SPOL) Doppler weather radar from the Department of Water and Electric Energy, DAEE (Portuguese acronym), manufacture Selex ES GmbH, installed at Ponta Nova [36], State of São Paulo, Brazil, at latitude 23°36′ S, longitude 45°58′20″ W (Figure 1a). The radar is operated by the Hydraulic Technology Center Foundation, FCTH (Portuguese acronym) and it is configured to cover a distance of 240 km with 250 m gate resolution (gate or bins are discrete illuminated volume that are sampled by pulsed weather radars). It makes measurements at eight elevation angles and completes a volume scan every 5 min. As a note, one sweep represents a Plan Position Indicator (PPI). At each sweep the radar beam rises in the atmosphere as it moves away from the radar due to Earth curvature and variation of the refractive index in the atmosphere, for example, the beam at an elevation angle of 0.5° rises to approximately 1 km about 100 km far from the radar [37].
In this study, we have used a total of 254,270 PPIs of the radar reflectivity factor. These radar measurements represent sweeps at 0.5o of elevation restricted to 100 km of range (Figure 1b) for the period of March 2015 to December 2019 with a time interval of 5 min. Each PPI has been quality controlled to avoid ground clutter and anomalous propagations by means of the coincident polarimetric measurements of this radar [38]. Based on these data, the following pre-processing steps were performed:
- Transformation from polar to Cartesian coordinates: with the objective of obtaining images on a regular grid, with a horizontal grid resolution of 4 km per pixel (the matrix had 40 × 40 pixels). Thus, each new image represents a matrix of Cartesian coordinates with 4 × 4 km2 resolution;
- Defining the boundaries: To utilize a regular square grid and eliminate the area without data as measured by radar, the images were cut into a square inscribed in a circle of 100 km (Figure 1);
- Normalization of the reflectivity values: Reflectivity values range typically from 0 to 60 dBZ. To obtain values of reflectivity in the interval (0,1), the data were divided by 60.
- Organization of datasets with a time interval of 15 min: train (2016, 2017 and 2019), validation (from March 2015 to December 2015) and test (2018).
Pre-processed dataset used in this study is available at https://doi.org/10.7910/DVN/ZADDNQ.
2.2. Models
2.2.1. ENCAST
Ensemble NowCASTing (ENCAST) [16] is the nowcasting algorithm available at SELEX weather radar and it is used operationally by SPOL-FCTH radar. The model identifies, tracks, and extrapolates rain cells by using the differences between pairs of consecutive derived images from the weather radar. The tracking algorithm is based on the cross-correlation procedure that derives one movement vector for each area of precipitation analyzed and performs cross-correlation over this area. Moreover, ENCAST converts pseudo radar reflectivity factor CAPPIs (Constant Altitude PPI, a horizontal cross-section of PPIs obtained from radar scans at different elevation angles) to the rainfall rate by using a fixed Z-R relation and uses it to represent the closest surface rainfall as the image input. It uses a rain threshold in cell identification. Based on the cell’s position in the present and previous scans a forecast is computed for a user-defined time interval.
For this study, FCTH provided the ENCAST outputs with 500-m × 500-m resolution. For each output, ENCAST forecast 7 time steps, ranging from 0 to 60 min lead time. Later, the rain fields were downscaled to a pixel of 4 km × 4 km.
2.2.2. PredRNN++
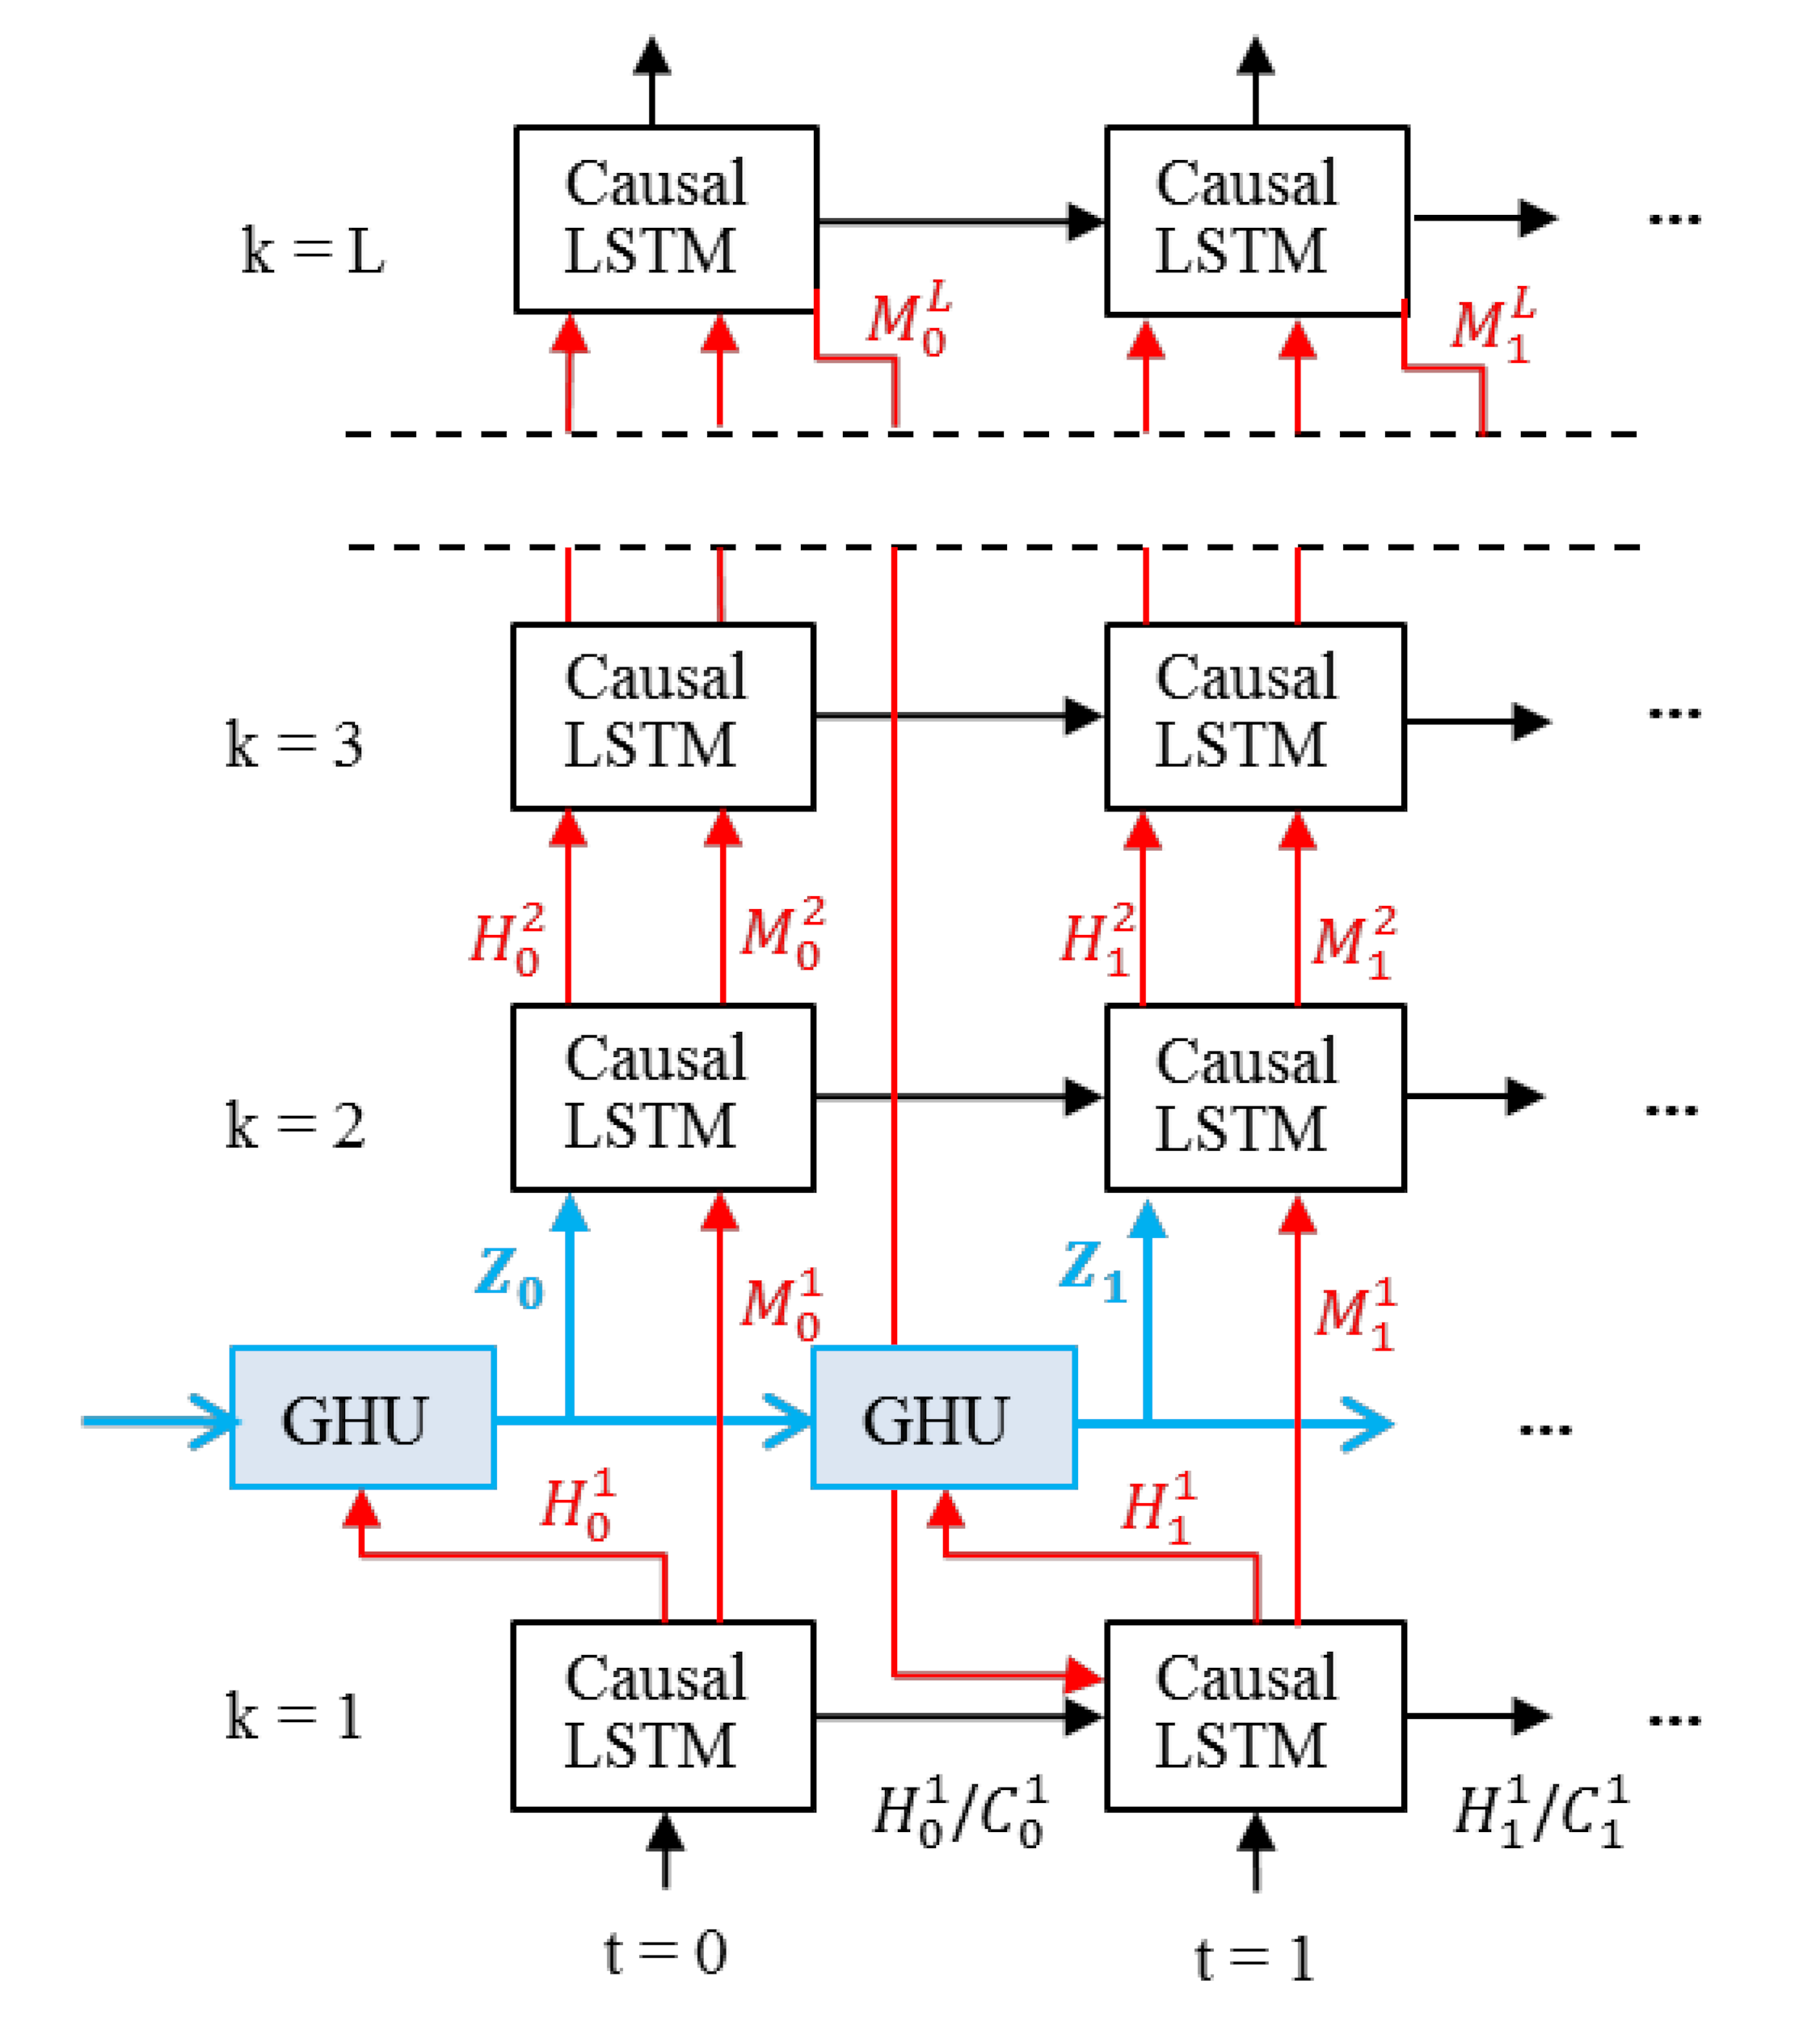
PredRNN++ is the model proposed by Wang et al. (2018) [35,39] as an improvement of PredRNN [28]. To increase the temporal and spatial long-term memory, the model utilizes two structures: “causal LSTM”, to capture complex dependencies and variations, and “gradient highway unit” (GHU), to keep the gradients during training. The Causal LSTM adopts a cascaded mechanism [40,41], where spatial memory is a function of temporal memory. Inspired by LSTM [42,43], GHU facilitates the training of deep neural networks. It uses adaptive units to regulate information flow inside the model, preventing the gradient backpropagated from quickly vanishing [35,43]. Figure 2 illustrates the PredRNN++ information flow.
The PredRNN++ model predicts 10 future frames (target) given 10 previous inputs, so each register is a sequence of 20 images. The input was organized in such a way that, between one record and the next, there is one time-step forward in the dataset.
The model architecture and the hyperparameters established by the authors were maintained [35,39]: 4 layers of causal LSTM with 128, 64, 64, 64 units in each layer, respectively, one gradient highway layer with 128 units, convolution filter of size 5. The loss function was used with ADAM optimization algorithm with a starting learning rate of 10−3, and a batch size of 8 records, also organized in sequence.
To train and test the PredRNN++ model, we considered the entire dataset, which means that we did not separate the days with and without reflectivity. Further, we considered all the reflectivity range, from 0 to 60 dBZ, but we scaled the data into the (0,1) interval. The period of data used for training includes the complete years of 2016, 2017 and 2019; the data from March 2015 to December 2015 were used as validation sets; the data from the complete year of 2018 were used as a blind test set. The time step used between images was 15 min instead of 5 min so that the training set comprises around 51,800 images, the validation set 15,800 images, and the test set 19,900 images.
The VPDL model was run on the Santos Dumont supercomputer, installed in the National Laboratory for Scientific Computing, LNCC (Portuguese acronym). The hardware used was two NVIDIA Tesla V100-16 GB with NVLink and 384 Gb of RAM.
The model was trained for 20 epochs and validated every 1 epoch (51,800 iterations). Each output comprises 10 time steps, ranging from 15 min to 150 min lead time. It should be mentioned that the training of the model is time-consuming (about 12 h/epoch) and requires computational resources to speed up the training (such as GPU) in addition to RAM and storage capacity. However, once the model is trained, the execution of the test set is fast (about 3 s/iteration).
3. Experimental Setup
To evaluate the performance of the PredRNN++ model, we calculate standard categorical statistics, enumerated below, for the test set (the year of 2018), between the results of the VPDL model and the observed reflectivity images and between the results of the ENCAST precipitation nowcasting model and the observed reflectivity images.
Different precipitation nowcasting systems cannot be compared if they are designed for different purposes [10]. However, ENCAST works with both convective and stratiform precipitation [16] and PredRNN++ is also expected to work with both types of precipitation.
It is worth mentioning that although the radar reflectivity images have been quality controlled, we observed random noise that could be attributed to anomalous propagation, especially over the metropolitan area of São Paulo, which changes the refractivity index. As an approximation, based on the Z-R relation , to avoid such spurious contamination, we considered that pixels above the threshold of 20 dBZ represent rainy pixels in the radar images, which is equivalent to approximately 0.5 mm/h. This threshold will also be compared with the ENCAST precipitation forecast.
As ENCAST predicts precipitation rate and PredRNN++ predicts radar reflectivity, we used binary metrics to evaluate the results of the VPDL model against the ENCAST results. We converted the values of the pixels into a 0/1 (e.g., no/yes) matrix using a dBZ threshold (defined below) for the observed and predicted fields of the VPDL model, and a mm/h threshold for the ENCAST forecast, where values lower than or equal these thresholds were converted to 0, and values greater than the thresholds were set to 1. As shown in the results section, some analyses of the reflectivity dataset and preliminary analysis of the results of the VPDL model reinforced the choice to evaluate the results in binary form.
We calculated the verification statistics up to 1-h lead time, using pairs of forecast and observation for second subsets and three rain cases (listed below). Pixel by pixel, the forecast hits and misses for each case or subset were accumulated in confusion matrix (Table 1), and then we calculate the statistics. The subsets are the complete test set (the year of 2018), named “All”, and the summer season set, from January to March of 2018), called “Summer”. The dates of the three rain cases are: 31 July 2018, 05 December 2018 and 22 December 2018.
The following are the forecast and observation pairs of the thresholds used to evaluate the model’s performance:
- 1 dBZ for reflectivity predicted and observed;
- 10 dBZ for reflectivity predicted and 20 dBZ for reflectivity observed (the choice of the predicted threshold is explained in the results section). These values are compared with the ENCAST forecast;
- 1 mm/h for precipitation predicted from ENCAST, and 20 dBZ for reflectivity observed.
In the analyses of the results, we refer to pixels with and without reflectivity as wet and dry pixels, respectively. In Table 1, a positive event corresponds to a wet pixel (reflectivity greater than the threshold) and a negative event corresponds to a dry pixel (reflectivity lower than or equal to the threshold).

Table 1.
Confusion matrix (a type of contingency table).
| Observed | |||
| YES | NO | ||
| Predicted | YES | TP | FP |
| NO | FN | TN | |
where:
- TP: corresponds to the number of observed positive events (yes) that were correctly predicted;
- FP: corresponds to the number of observed negative events (no) that were predicted incorrectly;
- FN: corresponds to the number of observed positive events that were not predicted;
- TN: corresponds to the number of observed negative events that were correctly predicted as negative.
Based on the confusion matrix, six standard categorical statistics were calculated:
- 1.
- The Probability Of Detection (POD) or Recall: the fraction of observed positive events that were correctly predicted. The range of possible values is 0 to 1, where the best possible POD is 1 and the worst is 0.
- 2.
- The False Alarm Rate (FAR): the fraction of predicted positive events that did not occur. The range of possible values is 0 to 1, where the best possible FAR is 0 and the worst is 1.
- 3.
- The Probability Of False Detection (POFD) or the probability of false alarm: the fraction of observed negative events that were incorrectly predicted as positive. The range of possible values is 0 to 1, where the best possible POFD is 0 and the worst is 1.
- 4.
- The Bias score: the ratio between the number of predicted positive events and the number of observed positive events. This indicates how many times the number of predicted positive events exceeds the number of observed positive events [44]. BIAS = 1 indicates unbiased forecast, BIAS > 1 overforecast and BIAS < 1 underforecast.
- 5.
- The Critical Success Index (CSI), also known as the Threat Score: the ratio of correctly predicted observed positive events by the total number of positive events, predicted or needed. The CSI is an alternative to the POD when the positive event occurs substantially less than the negative event [44]. The CSI depends on the number of TNs compared to the total number of cases [45]. The range of possible values is 0 to 1, where the best possible CSI is 1 and the worst is 0.where:
- 6.
Different from the CSI, the ETS depends directly on the TN due to the R. The frequency of observed positive events () determines how close the ETS and CSI are; so, as the positive event becomes rarer, the ETS gets closer to the CSI [45].
4. Results and Discussion
The training and test sets of PredRNN++ include both dry (without rain) and wet days (with rain). When considering wet days, all types of weather events (e.g., rain, hail) are included in the dataset and can occur anywhere in the image. We did not discriminate isolated storms from storms caused by frontal systems, for example. However, it is evident that all storms do not behave in the same way [16], and the formation of storms can be associated with diverse characteristics, such as development speed, variable intensity, atmospheric and terrain forcing (e.g., surface and ocean), and association with other weather systems.
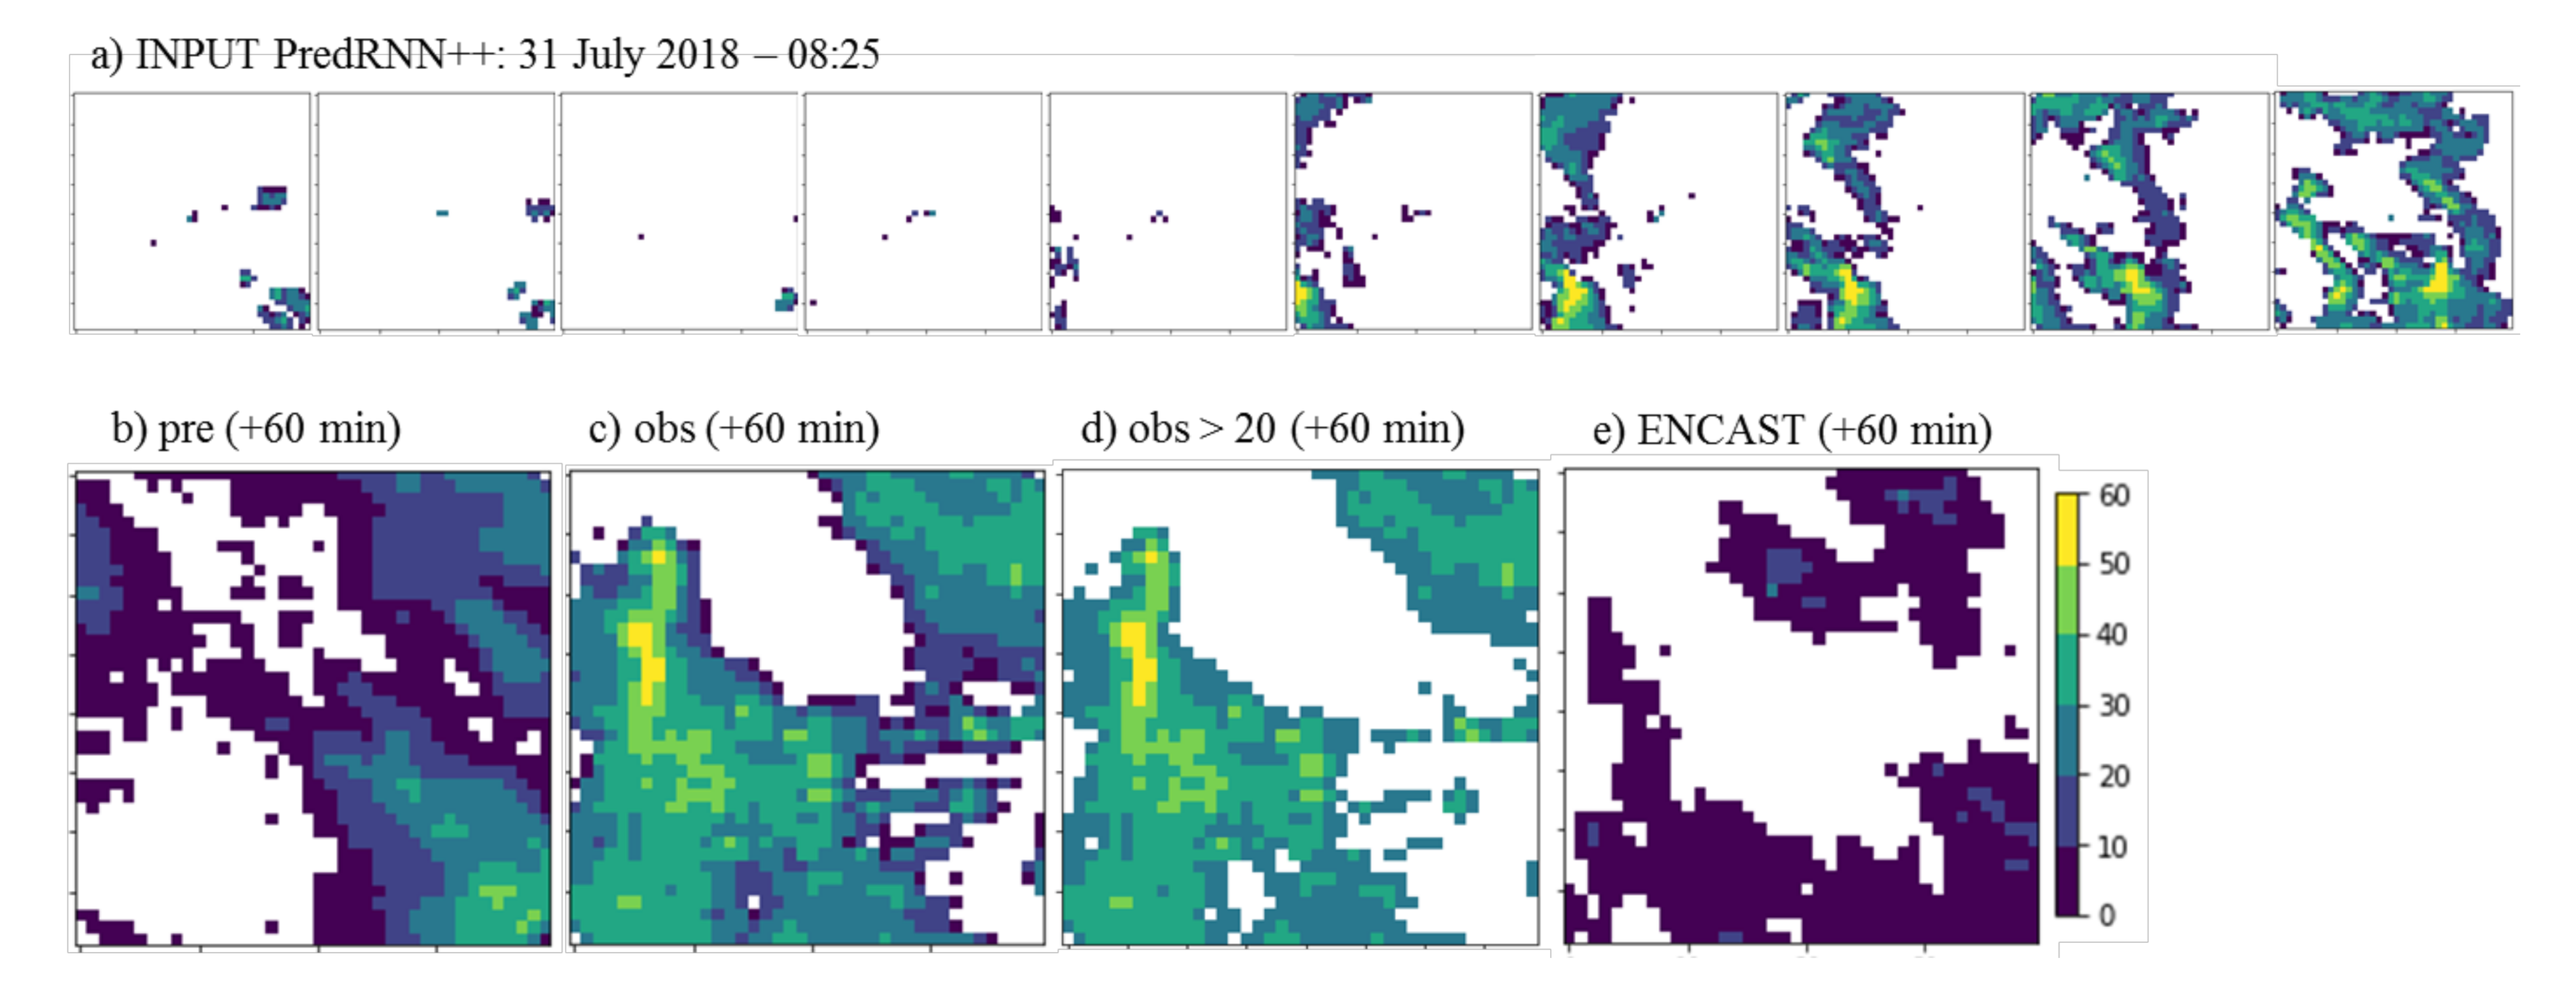
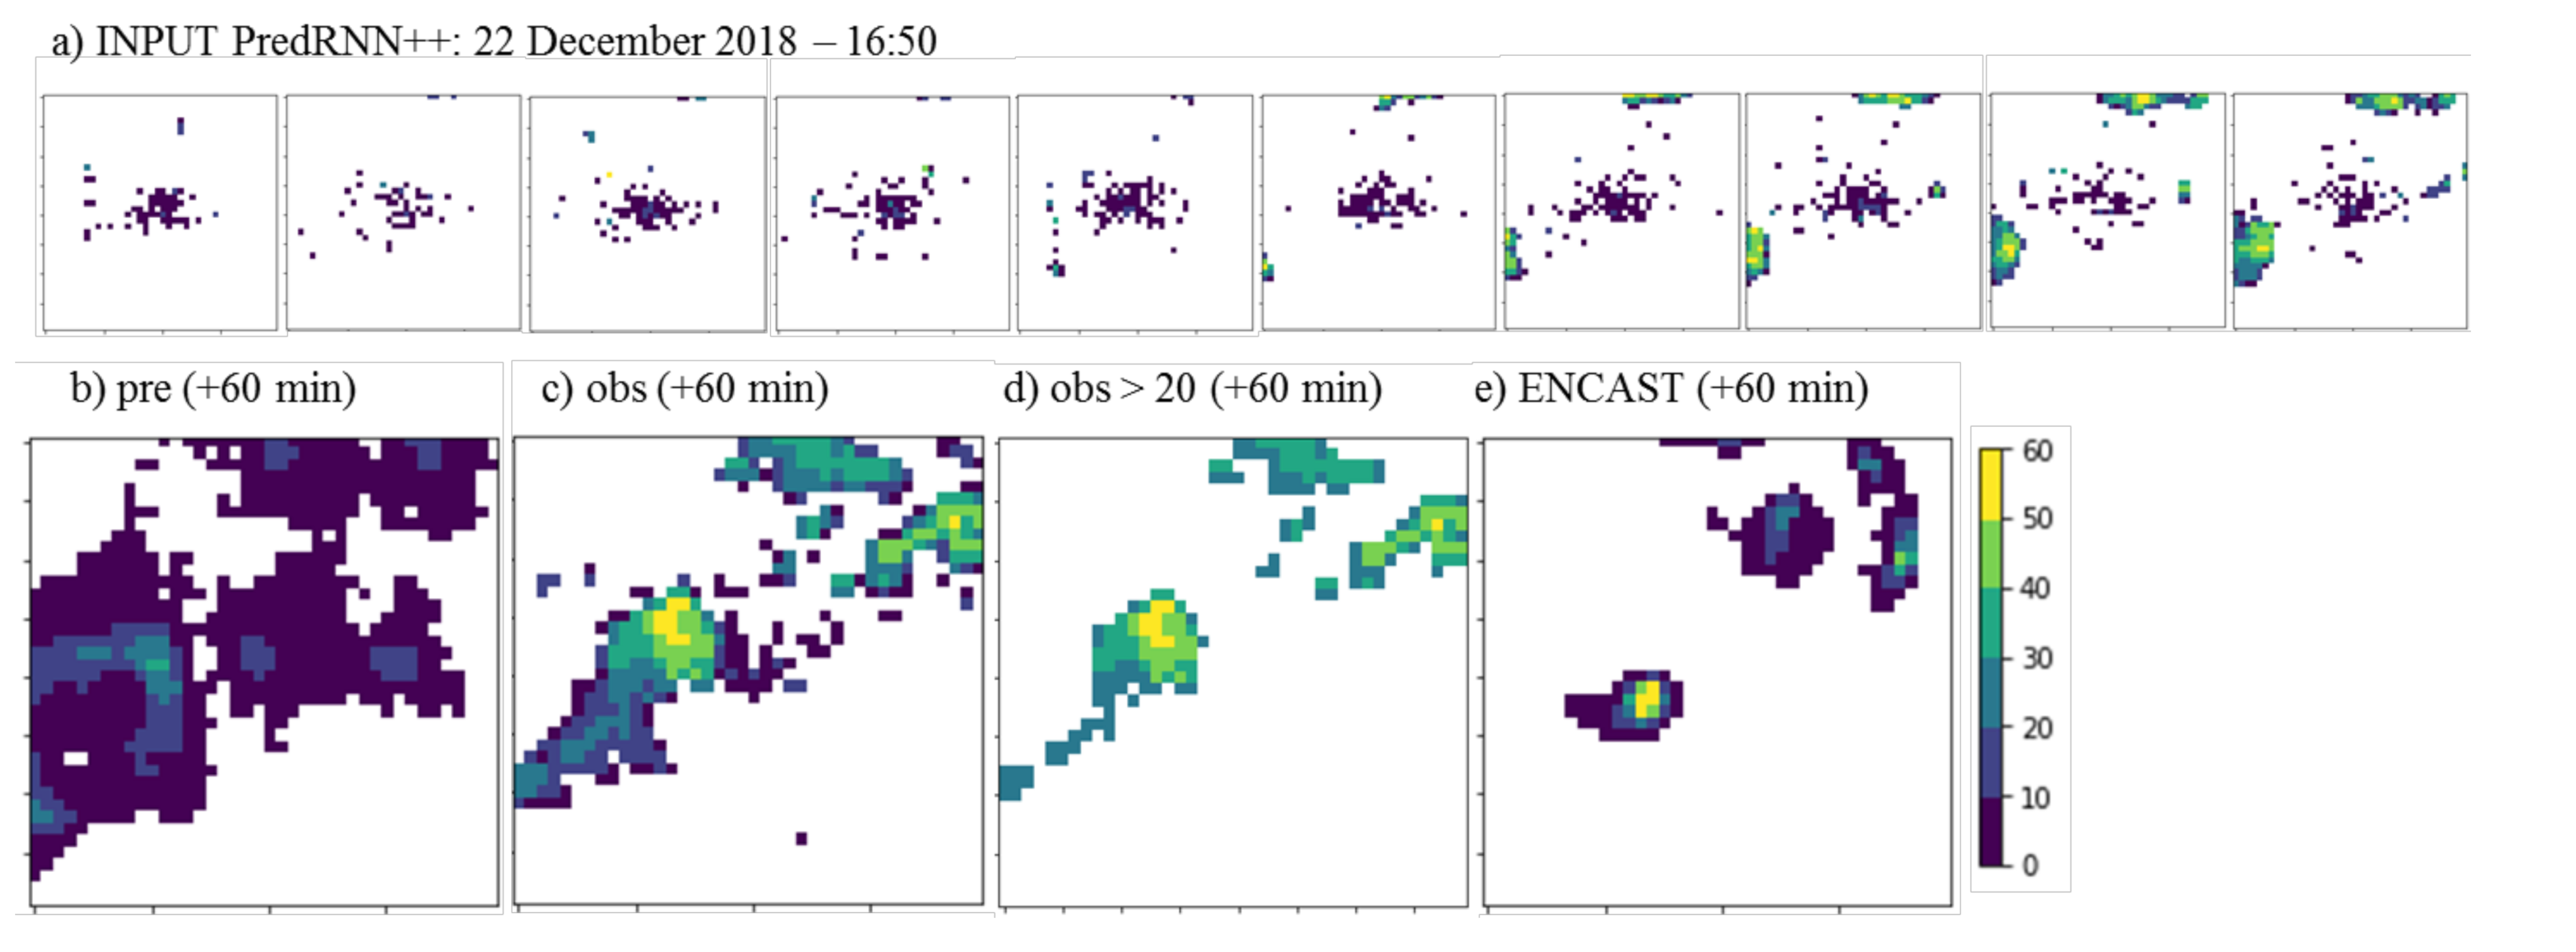
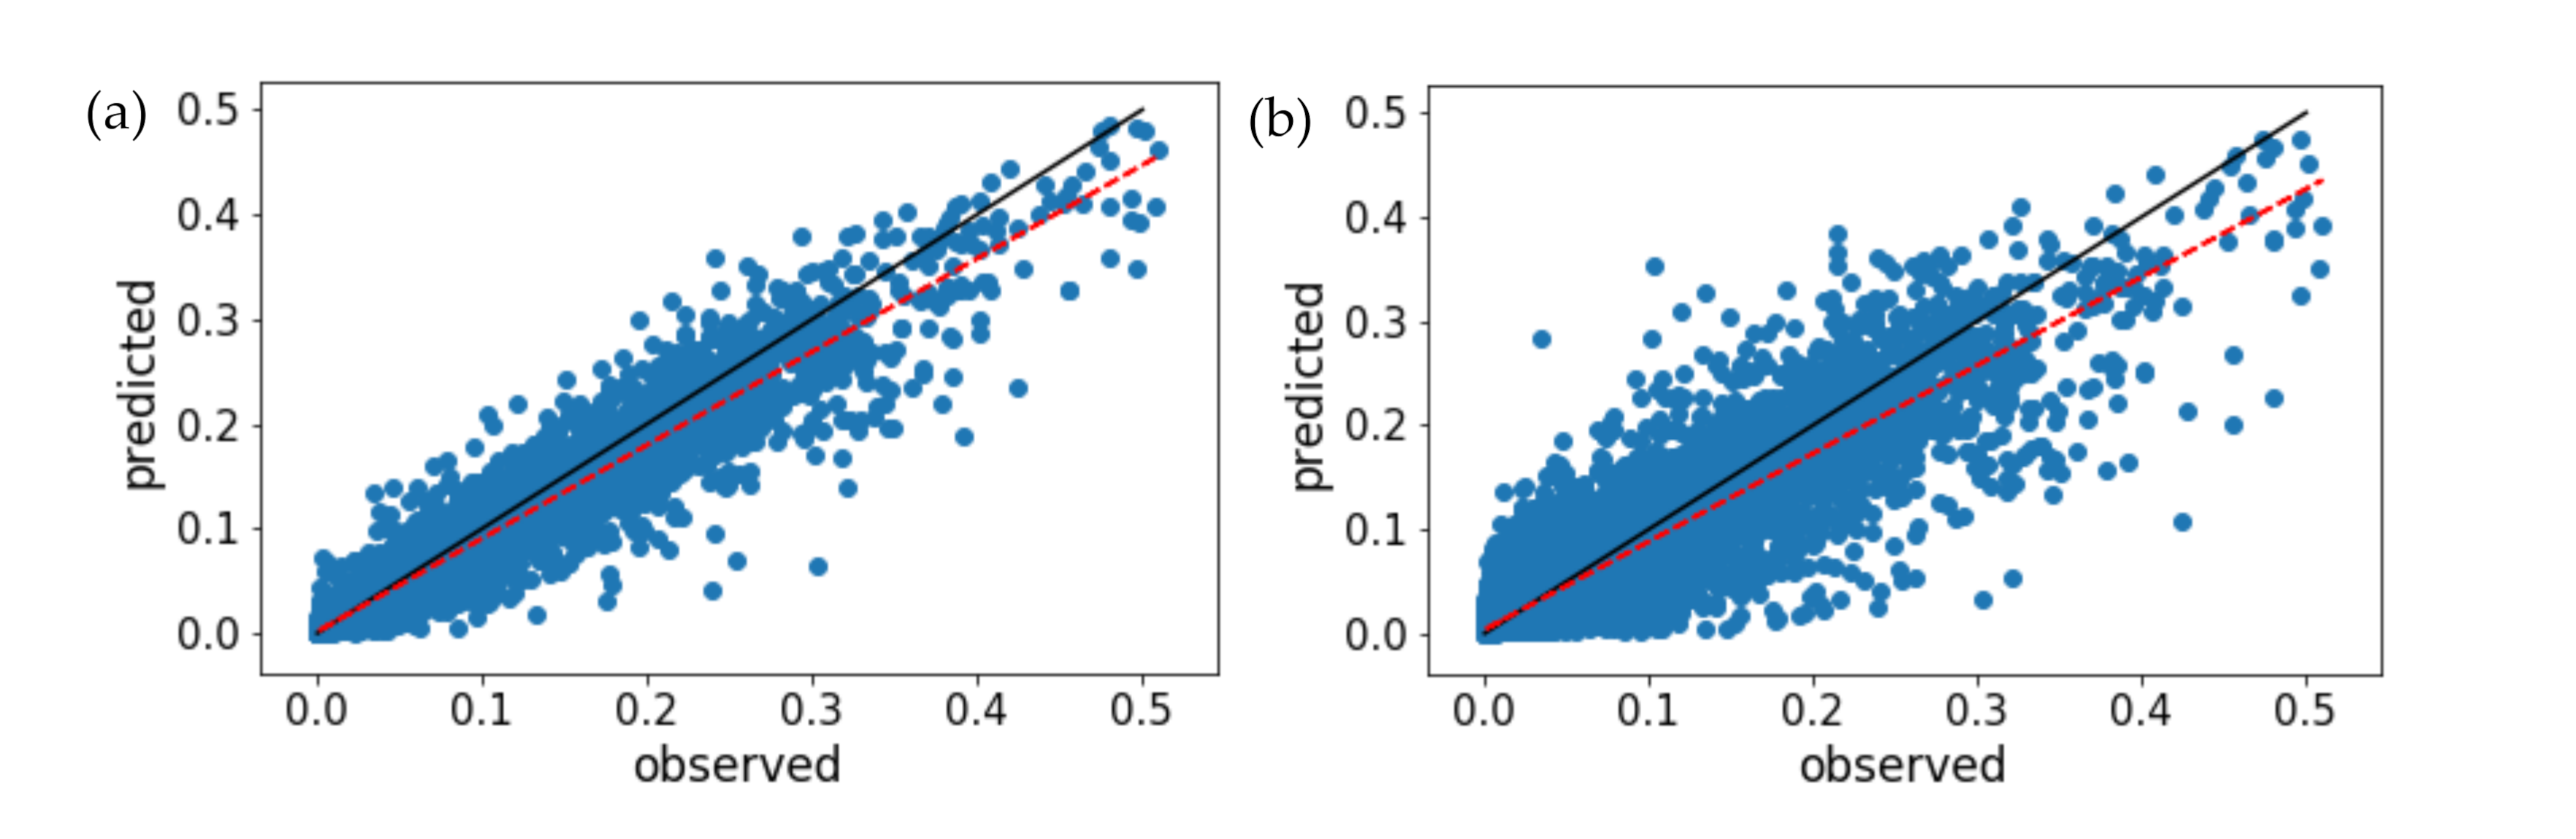
Figure 3 illustrates the prediction for 8:25 on 31 July 2018 and Figure 4 illustrates the prediction for 16:50 on 22 December 2018. As in the examples of Figure 3 and Figure 4, we observed that in general the PredRNN++ model smoothed the predicted reflectivity values; this was another reason why we chose to evaluate the results in binary form, by analyzing the occurrence and non-occurrence of reflectivity above the defined thresholds. We associate the model smoothing to a forecast error, instead of systematic bias, as shown in the scatter plot in Figure 5. As we can see by the red dashed line in the graphs of observed vs. predicted 30 min (Figure 5a) and 60 min (Figure 5b) forecasts, this behavior increases with the prediction horizon.
4.1. Evaluation of the Models
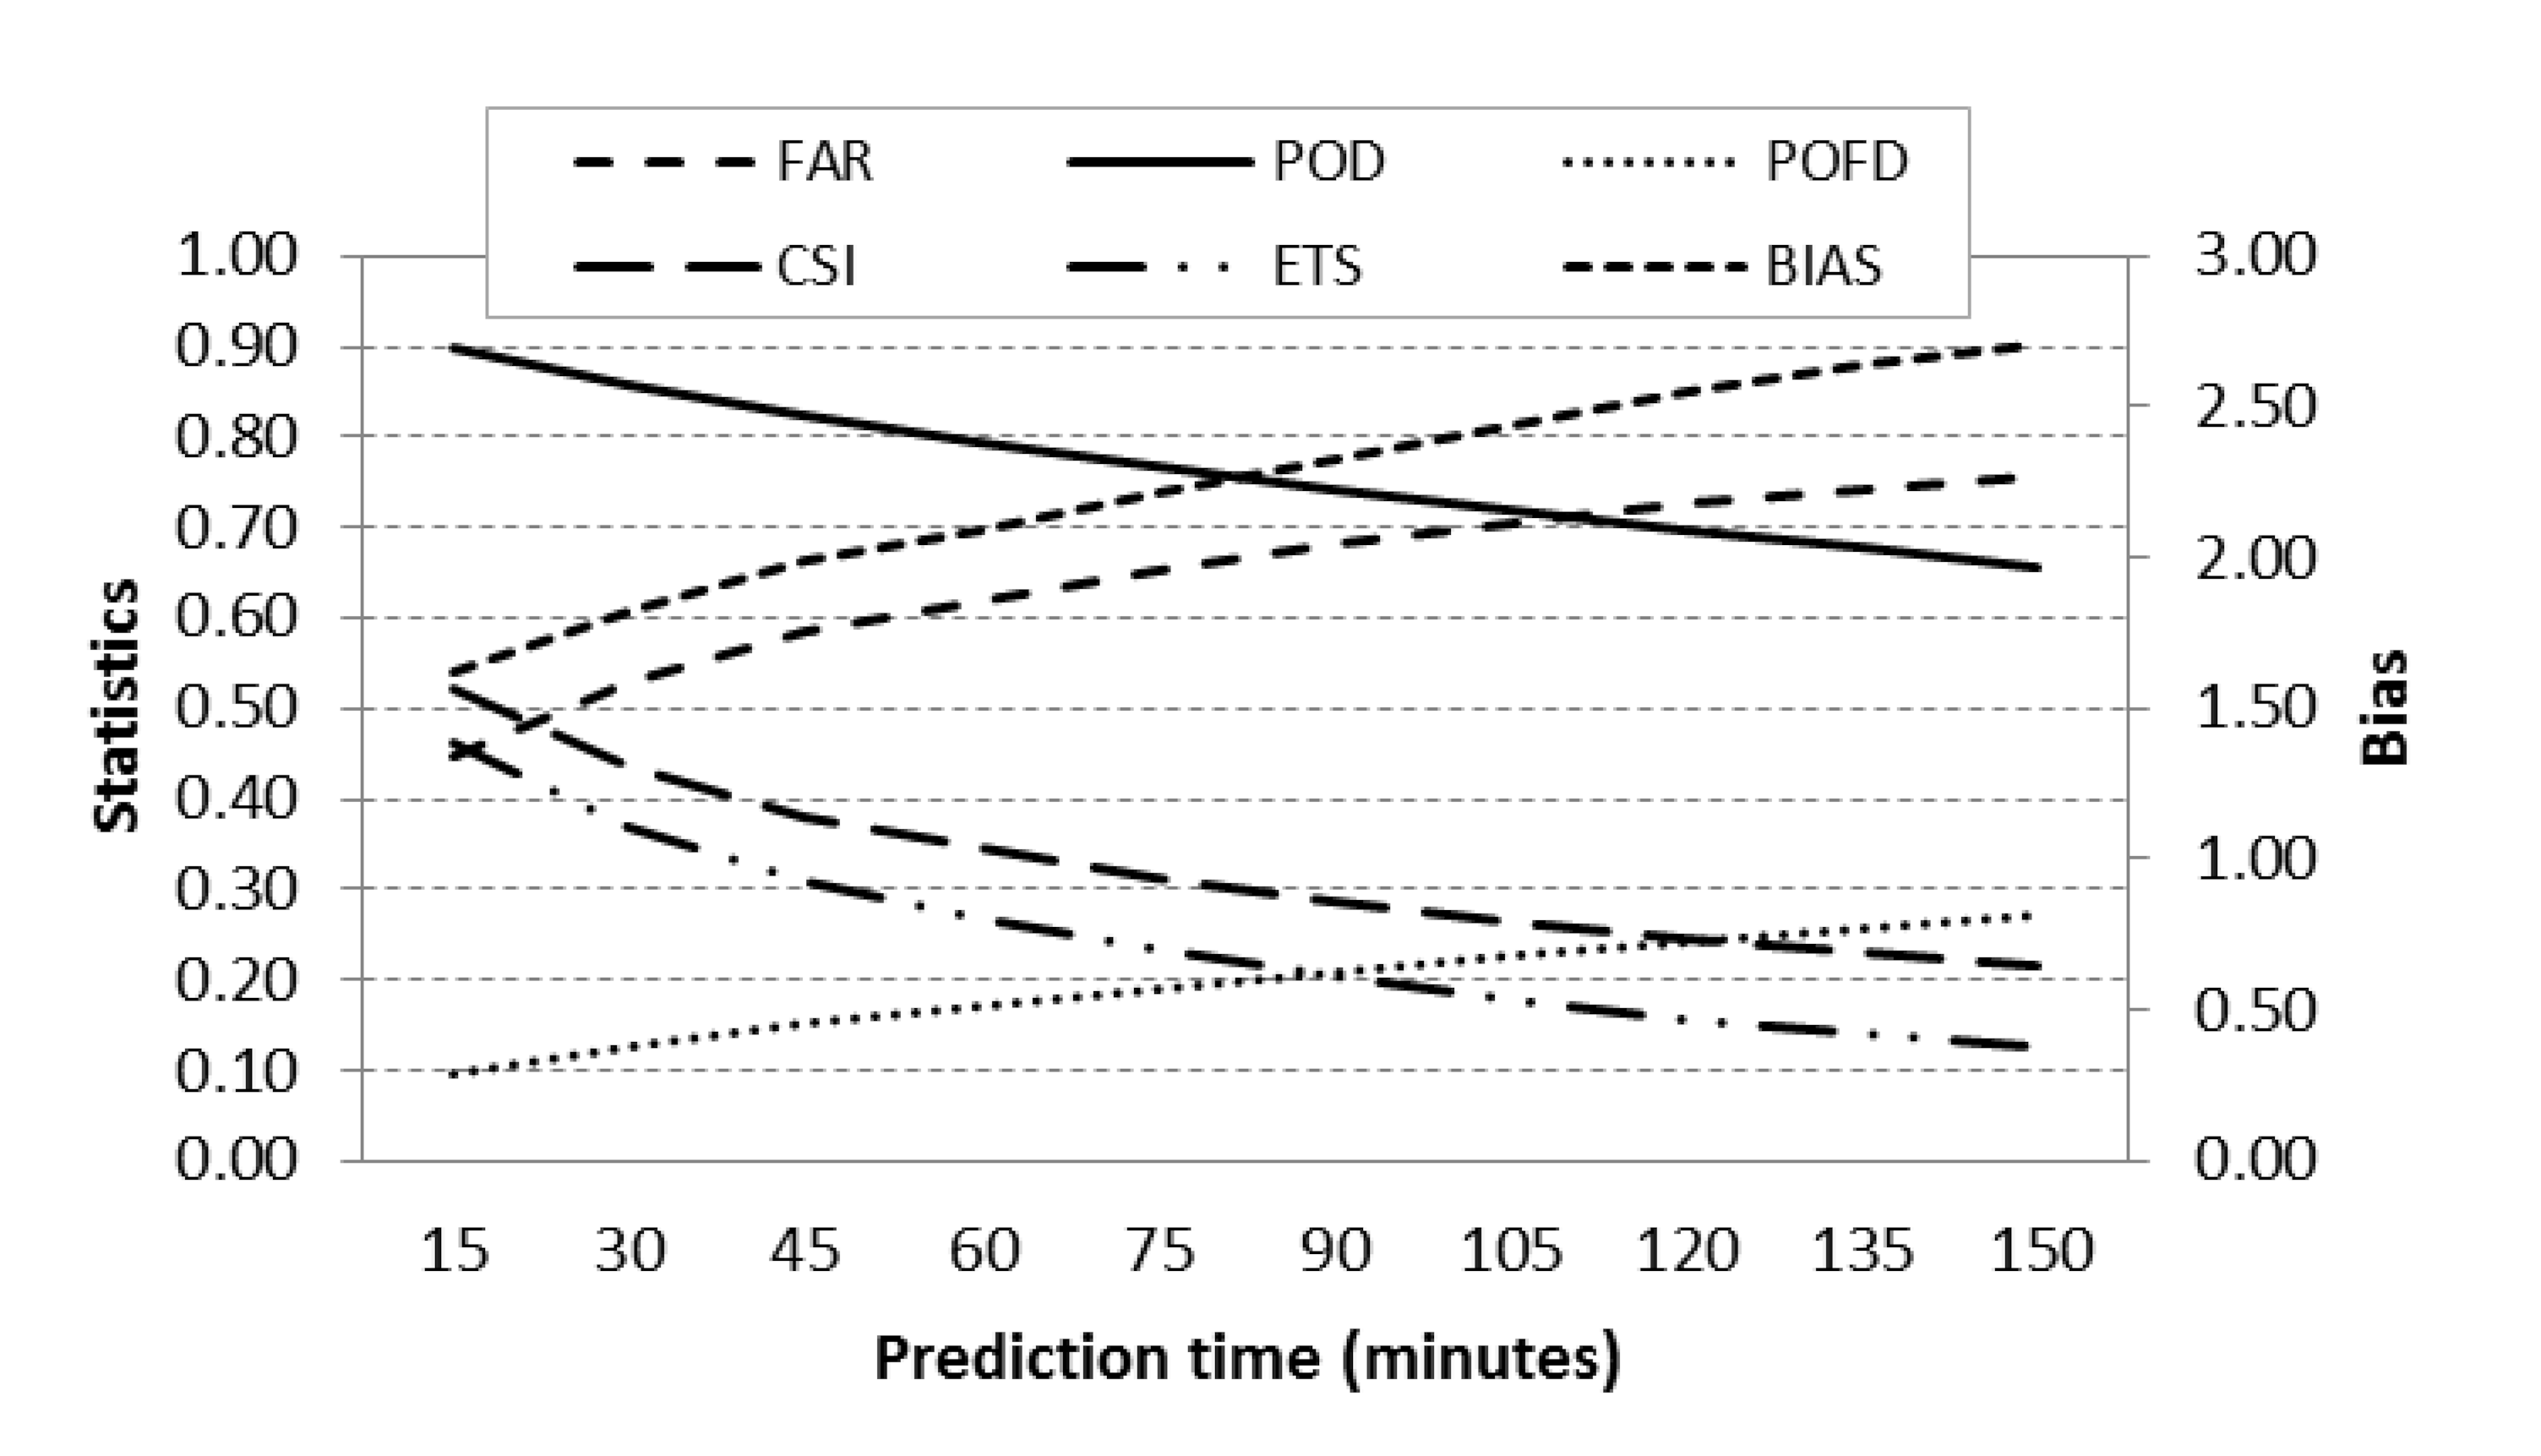
First, the performance of the PredRNN++ model was evaluated against the reflectivity image (ground truth) by calculating the following verification statistics: False Alarm Rate (FAR), Probability Of Detection (POD), Probability Of False Detection (POFD), BIAS, Critical Success Index (CSI), Equitable Threat Score (ETS). From Figure 6, we can quickly visualize the expected degradation of the forecast with increasing prediction period up to 150 min lead time. Table 2 shows these statistical values for the subsets “All” and “Summer” for 15, 30, 45 and 60-min lead times. Table 2 considers the 1 dBZ threshold for both observed and predicted reflectivity.
The 15-min lead time, the first output, has the best statistics. In general (in the “All” subset) the model overforecasts by 1.6 times the number of predicted positive events (BIAS); 90% of the observed positive events were correctly predicted (POD); 45% of the predicted positive events did not occur (FAR); and 10% of the observed negative events were predicted as positive (POFD). The frequency of observed positive events was 12% of the total, and the CSI and ETS were 0.52 and 0.46, respectively. As observed in Figure 6, as time increases, the forecast skills decrease. The statistics for 60-min lead time are: BIAS of 2.09, POD of 79%, FAR of 62%, POFD of 17%, CSI of 0.35, and ETS of 0.27.
“All” considered all dry and wet weather events in a whole year. By including dry days in statistical computations, the number of TNs increased, and the number of TPs decreased. The presence of other echoes (ground clutter for example) throughout the dataset also had an influence as this can increase the number of FPs. As a note, the return from particulates in the atmosphere is usually very similar to the return from raindrops or cloud particles; the concentration and size of these particles can be enough to give a radar detectable echo [44]. In the summer, the percentage of wet days is expected to be greater than when considering an entire year. This difference can be seen in Table 2 when comparing “All” and “Summer”. The frequency of observed positive events increased to 15% of the total.
“Summer” compared with “All” has a lower FAR (43% for 15-min, and 59% for 60-min lead time); and the number of correctly predicted positive events (POD) was also higher (91% for 15-min, and 81% for 60-min prediction). However, the number of events incorrectly predicted as positive increased to 12% for 15-min, and 21% for 60-min prediction. The BIAS, CSI and ETS showed similar values.
4.2. Case Studies
In this subsection, the results of the PredRNN++ model were compared with the precipitation nowcasting model ENCAST for three rain cases. As stated earlier, these cases were collected within the test set (the year of 2018). The cases were selected from the significant cases of the monthly bulletin published by the Center for Weather Forecasting and Climate Studies, part of the National Institute for Space Research (CPTEC/INPE, Portuguese acronym) [49]. The first case occurred on 31 July 2018, when a frontal system passed over São Paulo. The second case occurred on 5 December 2018, where the displacement of a frontal system by the ocean, associated with convection in the interior of the continent formed a moisture channel that extended over the state of São Paulo, among other regions, causing deep convection. The third case occurred on 22 December 2018, in which the passage of a frontal system, associated with high-level circulation, caused deep convection over São Paulo, among other regions. In the latter case, in addition to hail, a record number of trees were reported to have been blown down.
As stated earlier, the ENCAST model predicts precipitation and the output of the PredRNN++ model is reflectivity. To calculate the verification statistics, the outputs of the two models were compared to the observed reflectivity fields at the threshold of 20 dBZ. Additionally, from an analysis presented earlier, the PredRNN++ model smoothed the predicted reflectivity values. By evaluating the number of pixels per reflectivity range (as shown in Figure 7), we noted that the number of pixels above 10 dBZ in the predicted images is comparable to the number of pixels above 20 dBZ in the observed images. Thus, we established the threshold of 10 dBZ for predicted values and compared them to the observed values above 20 dBZ, in order to evaluate precipitation edges. Figure 3 and Figure 4 illustrate examples of the cases of 31 July 2018 and 22 December 2018, respectively. We can observe the thresholds in the color bar.
The statistics of the cases are presented in Table 3 and are organized into three blocks according to the reflectivity thresholds used in the observed (obs) and predicted (pre) data for 15, 30, 45 and 60-min lead times: Block 1 does not alter the thresholds used as input and output of the DL model, as presented in Table 2 (pre > 1 dBZ and obs > 1 dBZ); Block 2 is used to assess whether the model can generate precipitation pixels (pre > 10 dBZ and obs > 20 dBZ); Block 3 represents the statistics for comparison with Block 2, calculated on the ENCAST model (ENCAST > 1 mm/h and obs > 20 dBZ). The verification metrics are the same as shown in Table 2.
We highlight that two different variables, reflectivity and rain, were compared in Block 3. So, as shown before, we evaluated image patterns instead of numerical values. In these analyses, it is necessary to remember that not all echoes above 20 dBZ observed on the radar are equivalent to rain as predicted by ENCAST. The ENCAST model takes different radar fields when calculating precipitation.
In all cases, we can note the degradation of the forecast with an increasing prediction period, but in Block 3 this degradation is very subtle. Between Blocks 1 and 2, the degradation of certain statistics is noted, which can be explained by the decrease in the number of positive events predicted and observed (TP, FP and FN) and, consequently, the increase in TN due to the thresholds used in Block 2.
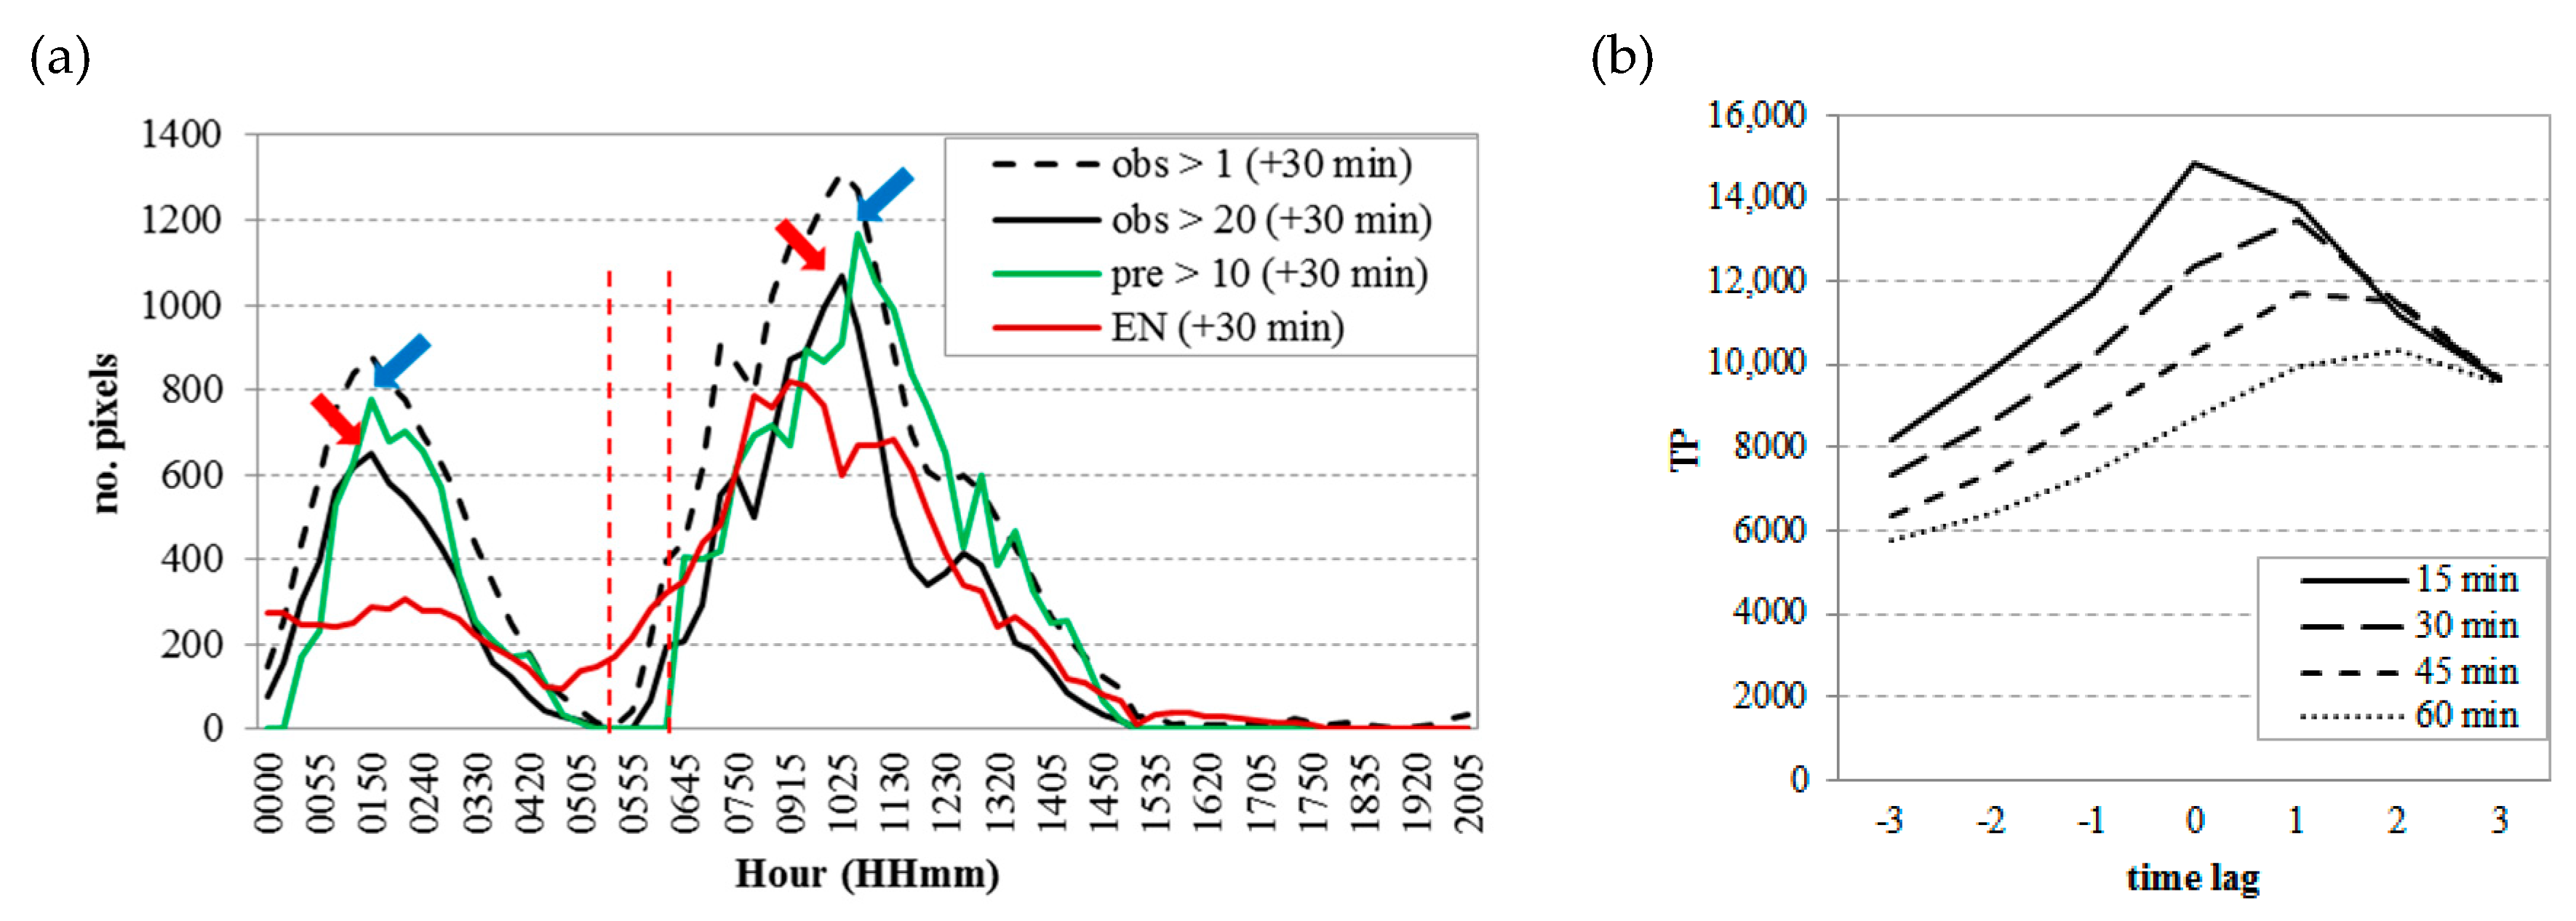
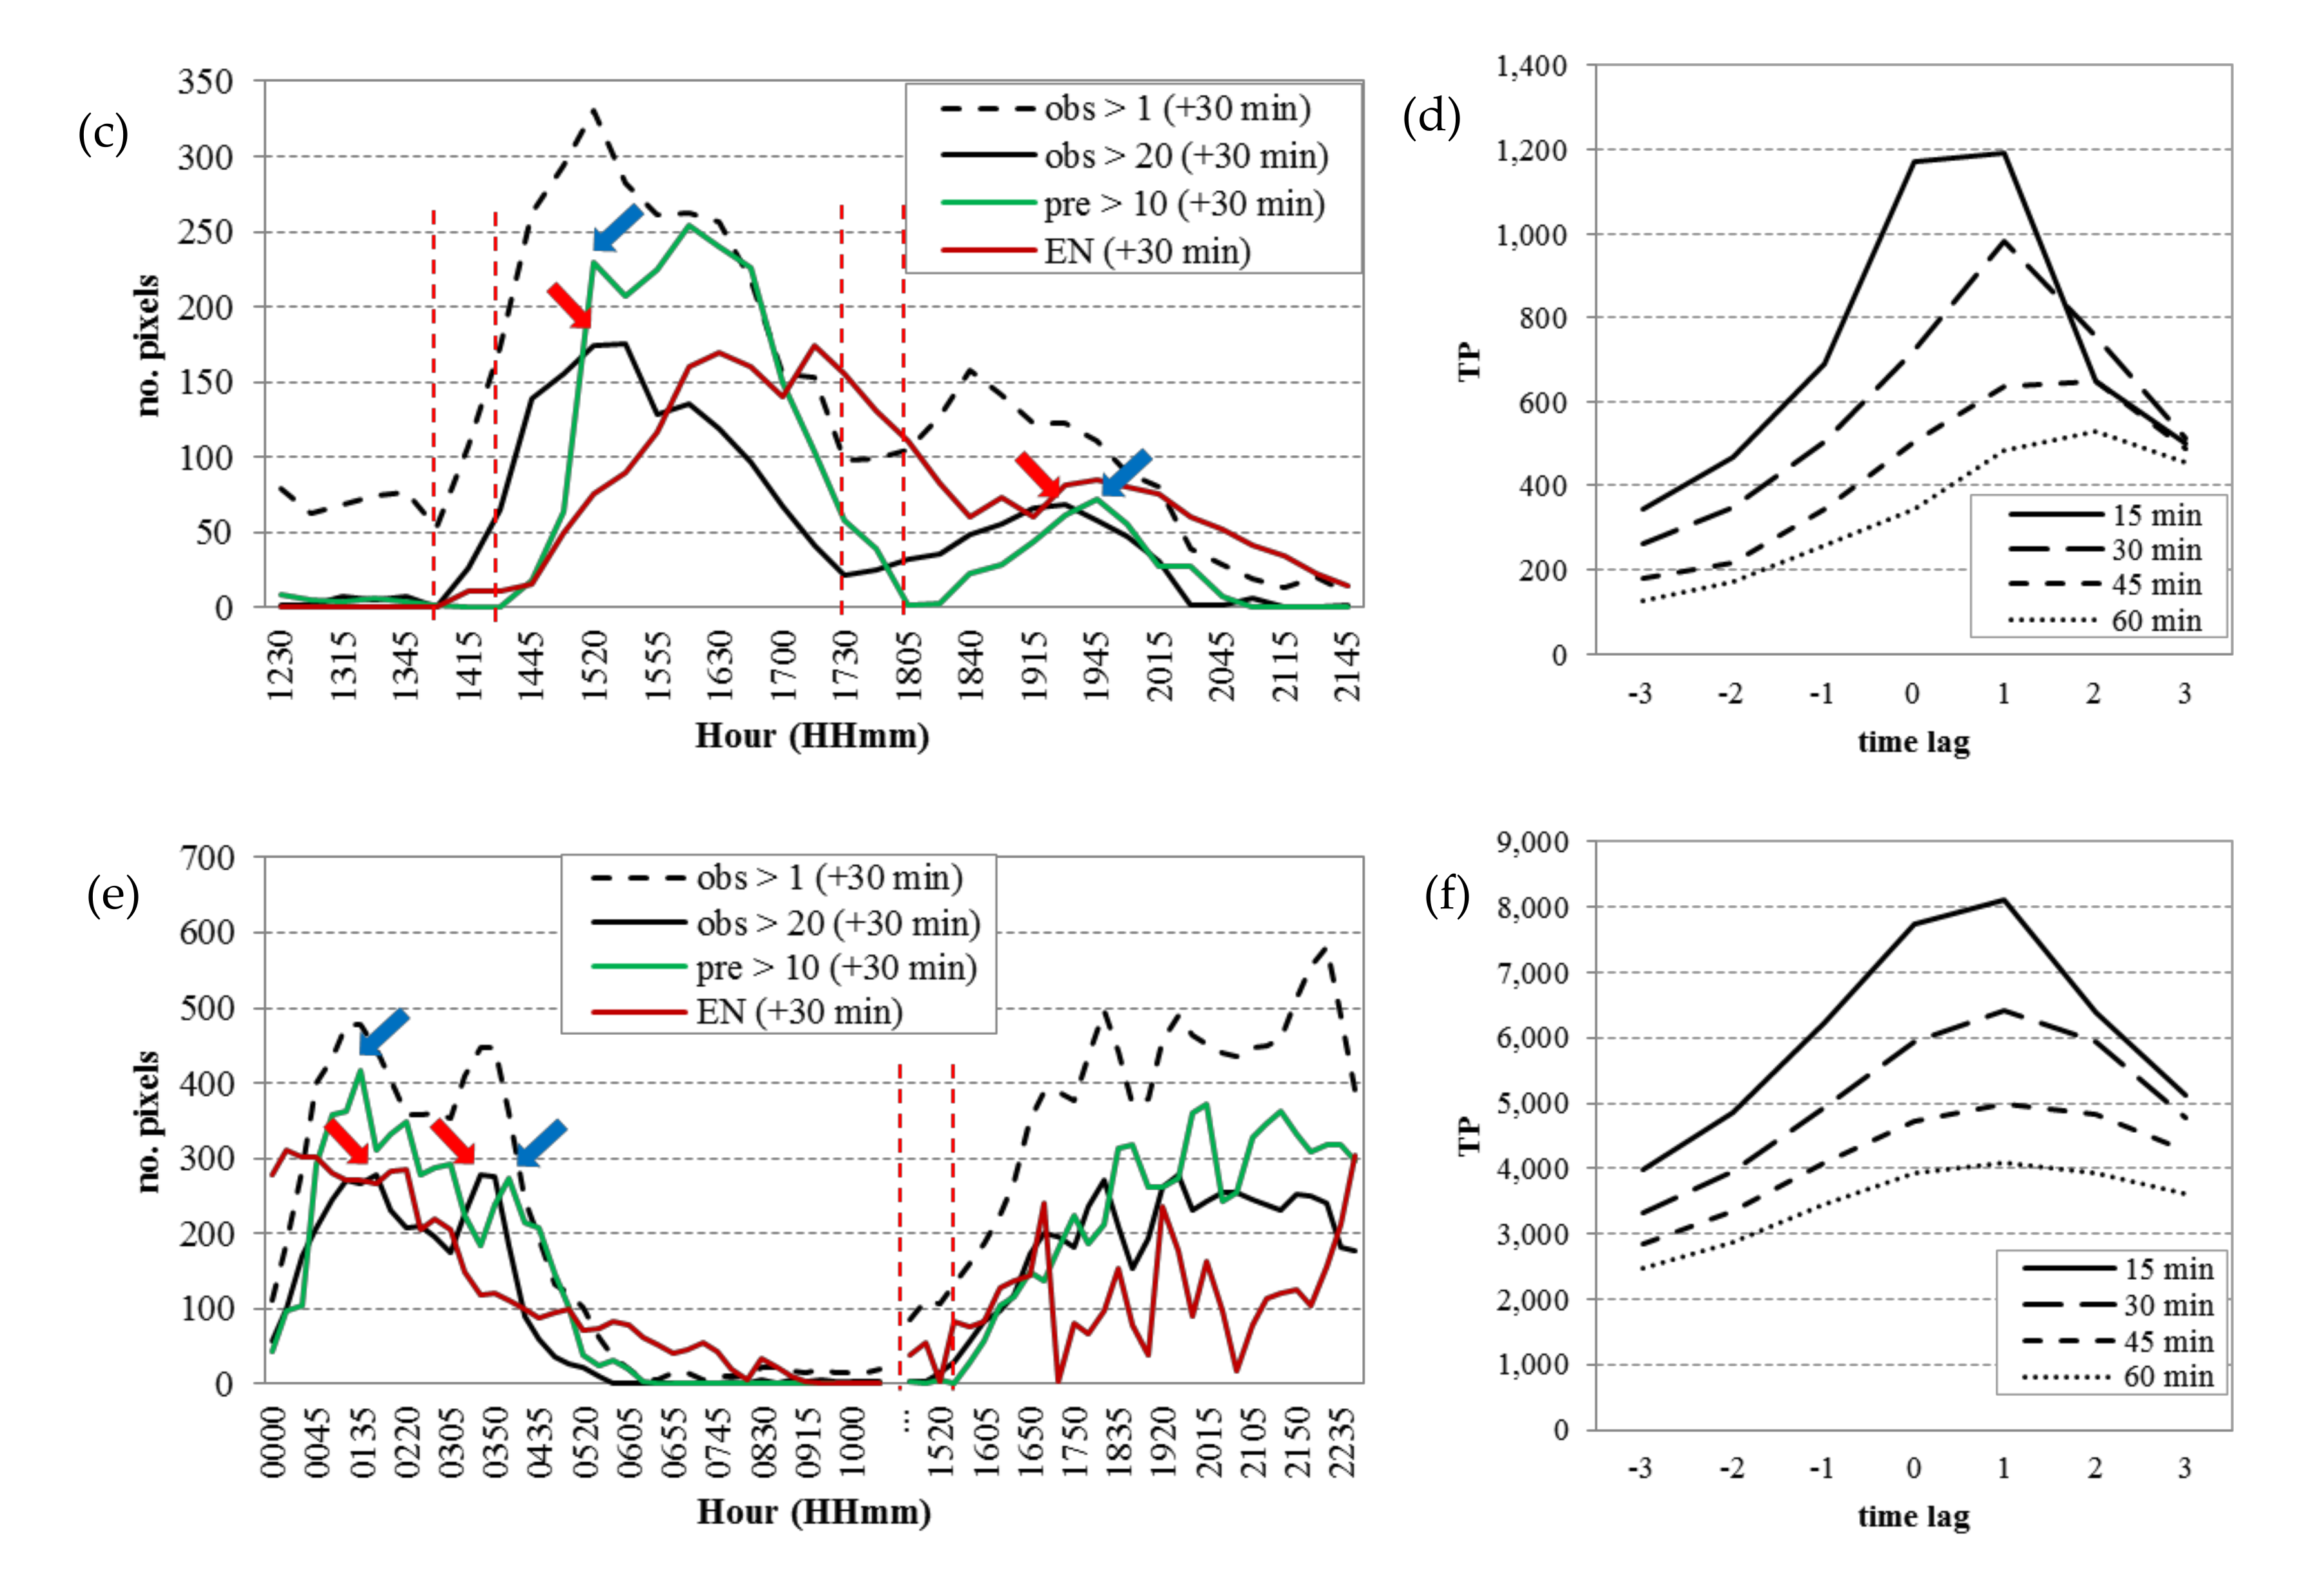
The observed variation between the cases in each Block is explained by the nature of the rainfall, which is different in each case. Figure 7a,c,e shows the time series of the number of pixels per image for 30-min lead time. We can observe the variations in the number of peaks and the number of pixels for each case, in the y-axis scale. In quantitative terms, ENCAST has fewer wet pixels compared with the other fields presented; this also has a negative effect on the calculation of verification statistics, as will be discussed below. Figure 7a,c,e also shows different delays between the time of occurrence and the forecast of the number of pixel peaks forecasted (shown by arrows); lags between the increase in the number of observed wet pixels, which can be seen as the start of the rain, and the increase in predicted wet pixels (vertical red dashed lines). Figure 7b,d,f specifically shows the time lag of TP events up to 60 min forecast for each case study. We can note that for the 30-min prediction, the lag is around 15 min, and for the 1-h prediction, between 15 and 30 min. We can also note the degradation of the results with an increasing prediction period.
Comparing the statistics obtained in Blocks 2 and 3 in Table 3, we note that within each Block the difference between cases is presented differently by the two models. Despite the thresholds used in Block 2, which reduced the observed and predicted positive areas, Block 2 performed better than ENCAST (Block 3). The fact that the verification statistics were calculated on small positive areas penalized the evaluation of the models. Although the pattern is similar between the images, if the centers are displaced and do not overlap, the forecast is given as wrong in the pixel by pixel confusion matrix [50]. Therefore, even though the number of hits (TP) was small in both models, TP of the PredRNN++ model was slightly higher than ENCAST, which improved its statistics when compared with ENCAST. The examples presented in the Figure 3 and Figure 4 show the aspect of the lack of overlap in the positive areas predicted and observed, and also that the PredRNN++ model predicts a larger positive area compared with ENCAST. This can masquerade pixel by pixel statistics.
5. Conclusions
In this study, we evaluate the usability of a video prediction deep learning (VPDL) model to support nowcasting. We use the PredRNN++ model as a VPDL model to predict reflectivity images and precipitation edges from weather radar images for up to 1-h lead time and compare the results with an extrapolation-based model used for precipitation nowcasting, ENCAST. We also evaluate the feasibility of a VPDL model for continuous use in nowcasting, as this gives the meteorologist an indication or a trend of the occurrence of localized precipitation regardless of the type of weather event.
We evaluate the model results against the ground truth images in two subsets and compare the VPDL model statistics with ENCAST statistics in three case studies: the entire test set (“All”, the entire year of 2018), the summer season set (“Summer”), and the days 31 July 2018, 5 December 2018, and 22 December 2018, as the case studies, respectively. By using pixel by pixel confusion matrix for the architecture used in the VPDL model, we find that: the VPDL model overforecasts the prediction of wet pixels; “Summer” (more homogeneous dataset) shows a better performance than “All”; and the VPDL model outperforms the ENCAST model in the three analyzed cases. We highlight that we only had access to three cases of ENCAST and to compute the ENCAST statistics we used the binary field of precipitation as prediction and the binary field of reflectivity greater than 20 dBZ as observation.
The forecast for precipitation is an important aspect of nowcasting. However, due to model architecture, the results are smoothed, which affects the analysis of predicted reflectivity instead of the analysis of pixels with rain and no rain. As a tool to assist nowcasting, this model should be used in parallel with other data and models. In fact, the model provides trends in the localization and development of rain edges of systems that can cause damage. We recommend that caution be taken in analyzing the range of predicted values since this can lead to a tendentious prediction of a strong system.
In general, the results obtained here agree with the most recent results published on the potential of the use of a VPDL model as an additional tool to assist nowcasting. We highlight certain advantages such as rapid execution (after training), 3 s/iteration, the use of a single input with little pre-processing, but a long history for training is necessary.
From other studies, we assume that training the model with events of the same type can improve the model’s performance. However, another aim of the present study is to assess the viability of a continuous execution of the VPDL model in predicting reflectivity edges regardless of the meteorological phenomena. In this respect, the model shows some lags between the “rain start” in observed images and predicted images. We assume that the addition of other variables that give an indication of the state of the atmosphere before the sudden appearance of targets in the radar image adds extra information to the model training and improves the quality of the forecast in terms of the life cycle of the weather event and even the prediction of the event.
As expected, an issue that arises in not considering physical processes is that extrapolation models are conservative: the model considers that an element will remain in the image and may only change its position (rotation and translation). Taking a cloud as an example of an image element, these models cannot predict dissipation due to rain, or the formation of a new cloud where there was nothing before. This is observed in mathematical extrapolation models as well as VPDL models. Deep learning models can fit observations very well, but only by integrating knowledge of the physical processes to train and provide constraints can the model achieve physical consistency [26].
With the addition of topography information, the model will be able to distinguish the formation of clouds by an orographic barrier, for example. It is worth mentioning that the addition of more variables to the VPDL model increases the model’s complexity, storage, processing time, among other limiting factors.
The next steps in this study, which are currently being developed, also include the evaluation of possible improvements in the architecture of the VPDL model and the running of other VPDL models.
Even though meteorological systems that trigger natural disasters vary by location, a general solution can contribute as a tool to assist decision-makers and consequently issue efficient alerts.
Author Contributions
Conceptualization, S.M.B.; methodology, S.M.B., A.E. and C.A.M.R.; software, S.M.B.; validation, S.M.B.; formal analysis, S.M.B.; investigation, S.M.B.; resources, S.M.B., A.E. and C.A.M.R.; data curation, S.M.B. and C.A.M.R.; writing—original draft preparation, S.M.B.; writing—review and editing, A.E. and C.A.M.R.; visualization, S.M.B.; supervision, A.E. and C.A.M.R.; project administration, A.E.; funding acquisition, A.E. and C.A.M.R. All authors have read and agreed to the published version of the manuscript.
Funding
This study was financed in part by the Coordenação de Aperfeiçoamento de Pessoal de Nível Superior – Brasil (CAPES) – Finance Code 001 and Program Pro-Alertas of CAPES (grant number: 88887.091742/2014-01).
Acknowledgments
This article comprises part of the doctoral thesis of the first author. The VPDL models were run on the Santos Dumont supercomputer, installed in the National Laboratory for Scientific Computing, LNCC (Portuguese acronym). The authors acknowledge the Foundation Technological Center of Hydraulics (FCTH) and the Climate Emergency Management Center (CGE) for the data provided in this study.
Conflicts of Interest
The authors declare no conflict of interest.
Data Source
The dataset used in this study is available at https://doi.org/10.7910/DVN/ZADDNQ.
References
- Golnaraghi, M.; Etienne, C.; Guha-Sapir, D.; Below, R. Atlas of Mortality and Economic Losses from Weather, Climate, and Water Extremes (1970–2012); World Meteorological Organization (WMO): Geneva, Switzerland, 2014. [Google Scholar]
- UN, ISDR. Hyogo framework for action 2005–2015: Building the resilience of nations and communities to disasters. In Proceedings of the Extract from the final report of the World Conference on Disaster Reduction (A/CONF. 206/6); Kobe, Hyogo, Japan, 18–22 January 2005, The United Nations International Strategy for Disaster Reduction: Geneva, Switzerland, 2007. [Google Scholar]
- CEPED, UFSC. Atlas Brasileiro de Desastres Naturais: 1991 a 2012; Centro Universitário de Estudos e Pesquisas sobre Desastres, Federal University of Santa Catarina: Florianópolis, Brazil, 2013. [Google Scholar]
- Asadieh, B.; Krakauer, N.Y. Global trends in extreme precipitation: Climate models vs. observations. Hydrol. Earth Syst. Sci. Discuss. 2014, 11, 11369–11393. [Google Scholar] [CrossRef] [Green Version]
- Zilli, M.T.; Carvalho, L.M.; Liebmann, B.; Silva Dias, M.A. A comprehensive analysis of trends in extreme precipitation over southeastern coast of Brazil. Int. J. Climatol. 2017, 37, 2269–2279. [Google Scholar] [CrossRef]
- WMO. Available online: http://www.wmo.int/pages/prog/amp/pwsp/Nowcasting.htm (accessed on 8 November 2017).
- Atlas, D. Radar in Meteorology; American Meteorological Society: Boston, MA, USA, 1990. [Google Scholar]
- Büyükbas, E.; Sireci, O.; Hazer, A.; Temir, I.; Macit, A.; Gecer, C. Training Materials on Weather Radar Systems. Instruments and Observing Methods; Technical Report no.88; World Meteorological Organization (WMO): Geneva, Switzerland, 2006; p. 354. [Google Scholar]
- Calheiros, A.J.P.; Enoré, D.P.; Mattos, E.V.; da Costa, I.C.; Machado, L.A.T. Sistema De Previsão Imediata: Descrição dos Produtos; Instituto Nacional de Pesquisas Espaciais (INPE): São José dos Campos, SP, Brazil, 2016. [Google Scholar]
- Reyniers, M. Quantitative Precipitation Forecasts Based on Radar Observations: Principles, Algorithms and Operational Systems; Institut Royal Météorologique de Belgique: Brussel, Belgium, 2008. [Google Scholar]
- Wilson, J.W.; Crook, N.A.; Mueller, C.K.; Sun, J.; Dixon, M. Nowcasting thunderstorms: A status report. Bull. Am. Meteorol. Soc. 1998, 79, 2079–2100. [Google Scholar] [CrossRef]
- Wilson, J.; Feng, Y.; Chen, M.; Roberts, R. Nowcasting Challenges during the Beijing Olympics: Successes, Failures, and Implications for Future Nowcasting Systems. Weather Forecast. 2010, 25, 1691–1714. [Google Scholar] [CrossRef]
- Met Office. Nowcasting. Available online: https://www.metoffice.gov.uk/weather/learn-about/how-forecasts-are-made/hours-ahead/nowcasting (accessed on 8 November 2017).
- Held, G.; Gomes, J.L.; Nascimento, E. Forecasting a severe weather occurrence in the State of São Paulo, Brazil, on 24 May 2005: The Indaiatuba Tornado. In Proceedings of the 8th International Conference on Southern Hemisphere Meteorology and Oceanography, Foz do Iguaçu, Brazil, 24–28 April 2006; pp. 1799–1807. [Google Scholar]
- Pierce, C.; Seed, A.; Ballard, S.; Simonin, D.; Li, Z. Nowcasting. In Doppler Radar Observations-Weather Radar, Wind Profiler, Ionospheric Radar, and Other Advanced Applications; InTech Open Access Publisher: London, UK, 2012. [Google Scholar]
- Instruction Manual Rainbow® 5; Selex Systems Integration GmbH: Backnang, Germany, 2017.
- Dixon, M.; Wiener, G. TITAN: Thunderstorm identification, tracking, analysis, and nowcasting—A radar-based methodology. J. Atmos. Ocean. Technol. 1993, 10, 785–797. [Google Scholar] [CrossRef]
- World Meteorological Organization. Guidelines for Nowcasting Techniques; (WMO-No. 1198) Series; WMO: Geneva, Switzerland, 2017. [Google Scholar]
- Luk, K.C.; Ball, J.E.; Sharma, A. An application of artificial neural networks for rainfall forecasting. Math. Comput. Modeling 2001, 33, 683–693. [Google Scholar] [CrossRef]
- Bushara, N.O.; Abraham, A. Computational intelligence in weather forecasting: A review. J. Netw. Innov. Comput. 2013, 1, 320–331. [Google Scholar]
- McGovern, A.; Elmore, K.L.; Gagne, D.J.; Haupt, S.E.; Karstens, C.D.; Lagerquist, R.; Smith, T.; Williams, J.K. Using artificial intelligence to improve real-time decision-making for high-impact weather. Bull. Am. Meteorol. Soc. 2017, 98, 2073–2090. [Google Scholar] [CrossRef]
- Germann, U.; Zawadzki, I.; Turner, B. Predictability of precipitation from continental radar images. Part IV: Limits to prediction. J. Atmos. Sci. 2006, 63, 2092–2108. [Google Scholar] [CrossRef]
- Mueller, C.; Saxen, T.; Roberts, R.; Wilson, J.; Betancourt, T.; Dettling, S.; Oien, N.; Yee, J. NCAR auto-nowcast system. Weather Forecast. 2003, 18, 545–561. [Google Scholar] [CrossRef]
- AMS Glossary. Available online: http://glossary.ametsoc.org/wiki/Predictability (accessed on 27 February 2020).
- Franch, G.; Nerini, D.; Pendesini, M.; Coviello, L.; Jurman, G.; Furlanello, C. Precipitation nowcasting with orographic enhanced stacked generalization: Improving deep learning predictions on extreme events. Atmosphere 2020, 11, 267. [Google Scholar] [CrossRef] [Green Version]
- Reichstein, M.; Camps-Valls, G.; Stevens, B.; Jung, M.; Denzler, J.; Carvalhais, N. Deep learning and process understanding for data-driven Earth system science. Nature 2019, 566, 195–204. [Google Scholar] [CrossRef]
- Shi, X.; Chen, Z.; Wang, H.; Yeung, D.Y.; Wong, W.K.; Woo, W.C. Convolutional LSTM network: A machine learning approach for precipitation nowcasting. In Proceedings of the Advances in Neural Information Processing Systems 28 (NIPS 2015), Montreal, QC, Canada, 7–12 December 2015; pp. 802–810. [Google Scholar]
- Wang, Y.; Long, M.; Wang, J.; Gao, Z.; Yu, P.S. PredRNN: Recurrent Neural Networks for Predictive Learning using Spatiotemporal LSTMs. In Proceedings of the Neural Information Processing Systems 30 (NIPS 2017), Long Beach, CA, USA, 4–9 December 2017; pp. 879–888. [Google Scholar]
- Rew, J.; Park, S.; Cho, Y.; Jung, S.; Hwang, E. Animal Movement Prediction Based on Predictive Recurrent Neural Network. Sensors 2019, 19, 4411. [Google Scholar] [CrossRef] [PubMed] [Green Version]
- Shi, X.; Gao, Z.; Lausen, L.; Wang, H.; Yeung, D.Y.; Wong, W.K.; Woo, W.C. Deep learning for precipitation nowcasting: A benchmark and a new model. In Proceedings of the Neural Information Processing Systems 30 (NIPS 2017), Long Beach, CA, USA, 4–9 December 2017; pp. 5617–5627. [Google Scholar]
- Tran, Q.K.; Song, S.K. Computer Vision in Precipitation Nowcasting: Applying Image Quality Assessment Metrics for Training Deep Neural Networks. Atmosphere 2019, 10, 244. [Google Scholar] [CrossRef] [Green Version]
- Klein, B.; Wolf, L.; Afek, Y. A dynamic convolutional layer for short range weather prediction. In Proceedings of the IEEE Conference on Computer Vision and Pattern Recognition, Boston, MA, USA, 7–12 June 2015; IEEE Computer Society: Los Alamitos, CA, USA, 2015; pp. 4840–4848. [Google Scholar]
- Mathieu, M.; Couprie, C.; LeCun, Y. Deep multi-scale video prediction beyond mean square error. In Proceedings of the International Conference on Learning Representations (ICLR), San Juan, Puerto Rico, 2–4 May 2016. [Google Scholar]
- Srivastava, N.; Mansimov, E.; Salakhudinov, R. Unsupervised learning of video representations using lstms. In Proceedings of the 32nd International Conference on International Conference on Machine learning (37), Lille, France, 7–9 July 2015; pp. 843–852. [Google Scholar]
- Wang, Y.; Long, M.; Wang, J.; Gao, Z.; Yu, P.S. PredRNN++: Towards a resolution of the deep-in-time dilemma in spatiotemporal predictive learning. PLMR 2018, 80, 5123–5132. [Google Scholar]
- Saisp Homepage. Available online: https://www.saisp.br/estaticos/sitenovo/produtos.xmlt (accessed on 26 December 2018).
- Rinehart, R.E. Radar for Meteorologists: Or You, too, can be a Radar Meteorologist, Part. III, 5th ed.; Rinehart Publications: Nevada, MO, USA, 2010. [Google Scholar]
- Straka, J.M.; Zrnić, D.S.; Ryzhkov, A.V. Bulk Hydrometeor Classification and Quantification Using Polarimetric Radar Data: Synthesis of Relations. J. Appl. Meteorol. 2000, 39, 1341–1372. [Google Scholar] [CrossRef]
- PredRNN++ Code. Available online: https://github.com/Yunbo426/predrnn-pp (accessed on 7 May 2019).
- Xu, Z.; Wang, Y.; Long, M.; Wang, J.; KLiss, M.O.E. PredCNN: Predictive Learning with Cascade Convolutions. In Proceedings of the 27th International Joint Conference on Artificial Intelligence (IJCAI-18), Stockholm, Sweden, 13–19 July 2018; pp. 2940–2947. [Google Scholar]
- Oord, A.V.D.; Dieleman, S.; Zen, H.; Simonyan, K.; Vinyals, O.; Graves, A.; Kalchbrenner, N.; Senior, A.; Kavukcuoglu, K. Wavenet: A generative model for raw audio. arXiv 2016, arXiv:1609.03499. [Google Scholar]
- LeCun, Y.; Bottou, L.; Bengio, Y.; Haffner, P. Gradient-based learning applied to document recognition. Proc. IEEE 1998, 86, 2278–2324. [Google Scholar] [CrossRef] [Green Version]
- Srivastava, R.K.; Greff, K.; Schmidhuber, J. Training very deep networks. In Proceedings of the 28th International Conference on Neural Information Processing Systems (NIPS 2015), Montreal, QC, Canada, 7–12 December 2015; Volume 2, pp. 2377–2385. [Google Scholar]
- Wilks, D.S. Statistical Methods in the Atmospheric Sciences, 2nd ed.; Academic Press: New York, NY, USA, 2006. [Google Scholar]
- Schaefer, J.T. The critical success index as an indicator of warning skill. Weather Forecast. 1990, 5, 570–575. [Google Scholar] [CrossRef] [Green Version]
- Hamill, T.M. Hypothesis tests for evaluating numerical precipitation forecasts. Weather Forecast. 1999, 14, 155–167. [Google Scholar] [CrossRef]
- Sharifi, E.; Steinacker, R.; Saghafian, B. Assessment of GPM-IMERG and other precipitation products against gauge data under different topographic and climatic conditions in Iran: Preliminary results. Remote Sens. 2016, 8, 135. [Google Scholar] [CrossRef] [Green Version]
- Wang, C.C. On the calculation and correction of equitable threat score for model quantitative precipitation forecasts for small verification areas: The example of Taiwan. Weather Forecast. 2014, 29, 788–798. [Google Scholar] [CrossRef]
- CPTEC/INPE bulletin of “casos significativos do mês”. Available online: https://www.cptec.inpe.br/noticias/quadro/143 (accessed on 7 January 2019).
- Ebert, E. Fuzzy verification of high resolution gridded forecasts: A review and proposed framework. Meteorol. Appl. A J. Forecast. Pract. Appl. Train. Tech. Modeling 2008, 15, 51–64. [Google Scholar] [CrossRef]
Figure 1.
(a) Location of the weather radar. The red circle marks 100-km of range; (b) Reflectivity image from the Plan Position Indicator (PPI) radar at 0.5°, with a map of the surrounding area in the background. The red line marks the radius of 100 km and the darker-colored square defines the borders.

Figure 2.
PredRNN++ architecture of the model. Blue parts indicate the gradient highway connecting the current time step directly with prior inputs, while the red parts show the deep transition pathway. Where t denotes time step, k denotes kth hidden layer in the stacked model,
is the spatial memory, is the temporal memory, is the final output (determined by the dual memory states) and is the hidden state, provided by “gradient highway unit” (GHU). Source: adapted from Wang et al. [35].

Figure 3.
Prediction for 8:25 on 31 July 2018: (a) 10 input frames of PredRNN++; (b) 1-h prediction of PredRNN++; (c) observed reflectivity, ground truth of (b); (d) observed reflectivity greater than 20 dBZ, used as “truth” compared to (e); (e) 1-h prediction of Ensemble NowCASTing (ENCAST).
Figure 3.
Prediction for 8:25 on 31 July 2018: (a) 10 input frames of PredRNN++; (b) 1-h prediction of PredRNN++; (c) observed reflectivity, ground truth of (b); (d) observed reflectivity greater than 20 dBZ, used as “truth” compared to (e); (e) 1-h prediction of Ensemble NowCASTing (ENCAST).

Figure 4.
Prediction for 16:50 on 22 December 2018: (a) 10 input frames of PredRNN++; (b) 1-h prediction of PredRNN++; (c) observed reflectivity, ground truth of (b); (d) observed reflectivity greater than 20 dBZ, used as “truth” compared to (e); (e) 1-h prediction of ENCAST.
Figure 4.
Prediction for 16:50 on 22 December 2018: (a) 10 input frames of PredRNN++; (b) 1-h prediction of PredRNN++; (c) observed reflectivity, ground truth of (b); (d) observed reflectivity greater than 20 dBZ, used as “truth” compared to (e); (e) 1-h prediction of ENCAST.

Figure 5.
Scatter plot of results of PredRNN++for the test set (the year of 2018): (a) observed vs. predicted 30-min forecast; (b) observed vs. predicted 60-min forecast.
Figure 5.
Scatter plot of results of PredRNN++for the test set (the year of 2018): (a) observed vs. predicted 30-min forecast; (b) observed vs. predicted 60-min forecast.

Figure 6.
Verification statistics per prediction time (minutes) up to 150 min lead time, calculated over the subset minutes.
Figure 6.
Verification statistics per prediction time (minutes) up to 150 min lead time, calculated over the subset minutes.

Figure 7.
Time series of the number of pixels per image according to the thresholds established in the legend (for 30-min prediction) and time lag (× 15 min) of TP events up to 60 min lead time forecast for each case study: (a) and (b) 31 July 2018, (c) and (d) 5 December 2018, (e) and (f) 22 December 2018. The arrows mark the delays between the observed (red) and predicted (blue) number of pixel peaks. The vertical red dashed lines mark the observed and predicted “rain start”.


Table 2.
Binary statistics from PredRNN++ model applied to all test data, for each lead time (in minutes): False Alarm Rate (FAR); Probability of Detection (POD); Probability of False Detection (POFD); the BIAS score; Critical Success Index (CSI), and Equitable Threat Score (ETS). All statistics were computed using thresholds of 1 dBZ for predicted and observed reflectivity.
| Period | Lead Time (min) | FAR ↓ | POD ↑ | POFD ↓ | BIAS (~1) | CSI ↑ | ETS ↑ |
|---|---|---|---|---|---|---|---|
| All | 15 | 0.45 | 0.90 | 0.10 | 1.62 | 0.52 | 0.46 |
| 30 | 0.53 | 0.86 | 0.13 | 1.82 | 0.44 | 0.37 | |
| 45 | 0.59 | 0.83 | 0.15 | 1.99 | 0.38 | 0.31 | |
| 60 | 0.62 | 0.79 | 0.17 | 2.09 | 0.35 | 0.27 | |
| Summer | 15 | 0.43 | 0.91 | 0.12 | 1.61 | 0.54 | 0.46 |
| 30 | 0.51 | 0.87 | 0.16 | 1.80 | 0.45 | 0.36 | |
| 45 | 0.56 | 0.84 | 0.19 | 1.93 | 0.40 | 0.31 | |
| 60 | 0.59 | 0.81 | 0.21 | 1.99 | 0.37 | 0.27 |
Table 3.
Binary statistics of PredRNN++ model (for 15, 30, 45 and 60-min prediction times) and ENCAST nowcasting model (for 10, 20, 30, 40, 50, 60-min prediction times) applied to selected cases: 31 July 2018, 05 December 2018 and 22 December 2018. The graphics and metrics are similar to those presented in Figure 5 and Table 2. The table is divided into three blocks according to the evaluated model and the thresholds: (Block 1) PredRNN++, pre > 1 dBZ and obs > 1 dBZ; (Block 2) PredRNN++, pre > 10 dBZ and obs > 20 dBZ; (Block 3) ENCAST, ENCAST > 1 mm/h and obs > 20 dBZ.
| Data | 31 July 2018 | 5 December 2018 | 22 December 2018 | |
|---|---|---|---|---|
| Block 1 | pre > 1 vsobs > 1 |  |  |  |
| Block 2 | pre > 10 vsobs > 20 |  |  |  |
| Block 3 | ENCAST vsobs > 20 |  |  |  |
Publisher’s Note: MDPI stays neutral with regard to jurisdictional claims in published maps and institutional affiliations. |
© 2020 by the authors. Licensee MDPI, Basel, Switzerland. This article is an open access article distributed under the terms and conditions of the Creative Commons Attribution (CC BY) license (http://creativecommons.org/licenses/by/4.0/).
Share and Cite
MDPI and ACS Style
Bonnet, S.M.; Evsukoff, A.; Morales Rodriguez, C.A. Precipitation Nowcasting with Weather Radar Images and Deep Learning in São Paulo, Brasil. Atmosphere 2020, 11, 1157. https://doi.org/10.3390/atmos11111157
AMA Style
Bonnet SM, Evsukoff A, Morales Rodriguez CA. Precipitation Nowcasting with Weather Radar Images and Deep Learning in São Paulo, Brasil. Atmosphere. 2020; 11(11):1157. https://doi.org/10.3390/atmos11111157
Chicago/Turabian StyleBonnet, Suzanna Maria, Alexandre Evsukoff, and Carlos Augusto Morales Rodriguez. 2020. "Precipitation Nowcasting with Weather Radar Images and Deep Learning in São Paulo, Brasil" Atmosphere 11, no. 11: 1157. https://doi.org/10.3390/atmos11111157
Note that from the first issue of 2016, this journal uses article numbers instead of page numbers. See further details here.