Article

Ventilation and Filtration Control Strategy Considering PM2.5, IAQ, and System Energy

1
Hanil Mechanical & Electrical Consultants Ltd., Seoul 07271, Korea
2
Department of Architecture and Architectural Engineering, Graduate School, Seoul National University, Seoul 08826, Korea
3
Department of Architecture and Architectural Engineering/Institute of Construction and Environmental Engineering, Seoul National University, Seoul 08826, Korea
*
Author to whom correspondence should be addressed.
Atmosphere 2020, 11(11), 1140; https://doi.org/10.3390/atmos11111140
Submission received: 4 September 2020 / Revised: 7 October 2020 / Accepted: 20 October 2020 / Published: 22 October 2020
(This article belongs to the Section Air Quality)

Abstract

:
Ventilation or filtration control is widely applied to improve indoor particle matter (PM) concentration. Adjusting the ventilation rates to control indoor PM levels can affect the concentration of other indoor pollutants and energy costs, and increasing the filtration flow rate can lower the indoor PM concentration, but also increase the fan energy consumption. In this study, we developed a ventilation and filtration control strategy to determine the optimal control mode and flow rate of the system to meet indoor PM (especially PM2.5) concentration, ensure adequate indoor air quality (IAQ), and minimize fan energy consumption. First, a dynamic model to estimate the indoor PM2.5 generation rate was developed based on the mass balance model and then verified by experiments. Next, the control limit (CL) curve was developed on the basis of the indoor PM2.5 characteristics depending on ventilation and filtration control during various indoor and outdoor PM2.5 conditions (indoor PM2.5 generation rate and outdoor PM2.5 concentration). In addition, an algorithm was proposed to determine the optimal control mode and flow rate of the system. Condition zone control can keep indoor PM2.5 below or as close to the desired target concentration as possible, maintain IAQ within acceptable ranges, and save about 15~70% of fan energy compared with the conventional rule-based control under the case condition.

1. Introduction

Particle matter (PM) has been identified as an important cause of various diseases, including asthma, lung cancer, cardiovascular disease, and coronary heart disease [1,2,3]. In particular, particles less than 2.5 μm in aerodynamic diameter (PM2.5) have a larger surface area than coarse particles and are more likely to adsorb harmful substances such as heavy metal elements on the surface while staying in the atmosphere for a long time [4]. Moreover, smaller particles can penetrate deeper into the human body and therefore have a higher potential for hazardous health risks than larger particles [5,6].
Ventilation or filtration control has been widely applied to improve indoor PM concentration from indoor and outdoor sources [7,8,9,10,11,12,13,14]. Ventilation is defined as the process by which outdoor and indoor air is exchanged through mechanical ventilation systems. Outdoor PM2.5 is removed by a ventilation filter before it flows into the room. Filtration is defined as the process by which indoor air is recirculated and indoor PM2.5 is removed by filtration filter. Ventilation is advantageous for overall indoor air quality (IAQ) by lowering the concentration of other indoor pollutants emitted from building materials, furniture, occupants, etc., but when the outdoor PM concentration is high, contaminated outdoor air can be introduced to increase the indoor PM concentration [9,14]. When ventilation is not recommended due to high outdoor concentrations, indoor air filtration may be an alternative control strategy to remove indoor PM. However, the filtration method itself has limitations in managing the concentrations of other indoor pollutants as it recirculates indoor air without introducing fresh outdoor air. Therefore, filtration control can be applied as a supplementary method if ventilation is unfavorable or insufficient to maintain an acceptable indoor PM level.
In Korea, ventilation systems have been mandatory for apartments licensed for construction from January 2006, requiring ventilation system to meet the air exchange rate of 0.5 h−1 specified for indoor air quality (IAQ). As PM problems in Korea become worse, the number of houses equipped with portable air filtration systems have increased, and as of 2020, 54% of households have portable air filtration systems [15]. Moreover, a ventilation system integrated with a filtration system was developed and applied for an apartment to manage indoor PM and IAQ [16]. With the increasing prevalence of such systems, the needs of control strategies of ventilation and filtration system to manage indoor PM has been evoked.
Meanwhile, adjusting the ventilation rate to control the indoor PM concentration affects overall IAQ and energy costs. For example, low ventilation rates may increase the concentration of other indoor pollutants, while high ventilation rates may increase energy costs. For filtration control, increasing the flow rate can lower the indoor PM concentration, but at the same time increase the fan energy consumption. Many studies have proposed control strategies for ventilation or filtration systems to ensure acceptable indoor pollutant concentrations that consider energy consumption [17,18,19,20,21,22]. Ganesh et al. [23] presented a model-based dynamic optimization strategy that minimized the energy consumption of an air handling unit while making sure that the concentration of indoor air pollutants (PM, HCHO, and ozone) remained within the permissible limits. The results showed that operation under optimized conditions reduced the peak pollutant concentration by 31%, time of exposure to undesirable concentrations by 48%, and energy consumption of the air handling unit (AHU) by 17.7%, compared to the constant, heuristic operation case. In study of Liu et al. [24], a multi-objective optimization (MOO) determined the optimal ventilation set points to ensure acceptable indoor PM10 levels using minimal fan energy. The results show that the proposed control could maintain the same level of PM10 and save 24% of energy consumption when compared with the manual control. Their study [23,24] focused on optimized ventilation rates and did not consider filtration control. Cho et al. [25] presented the energy saving potential of a ventilation system with an air-cleaning unit and demand control in an apartment. The results indicated that concentration of indoor pollutants, which were CO2 and HCHO, could be maintained below target level and energy consumption was reduced by 19.5% when compared to the operation mode constant ventilation without filtration.
In this study, the control mode for filtration and ventilation was determined according to indoor CO2 and HCHO. Ventilation was activated when indoor CO2 concentration was above the target level and filtration was activated when indoor HCHO concentration was above the target level. It targeted pollutants emitted from indoors and filtration control was only used as a means of reducing the ventilation rate to save heating, cooling, and ventilation energy. Han et al. [26] developed a dynamic integration strategy between ventilation and air filtration to reduce energy consumption, keeping indoor HCHO below the standard level. The integration strategy would provide satisfactory IAQ and also could bring 11% annual energy savings for the case building. The filtration or ventilation control mode was determined according to outdoor HCHO concentration. Bae et al. [16] developed a ventilation system with a filtering mode for Korean apartments. The developed system adopted a simple strategy, i.e., a ventilation mode that operates when outdoor PM concentration is below a certain concentration and a filtration mode that operates when it exceeds a certain concentration. In the studies of Han [26] and Bae [16], the control of ventilation and filtration modes was quite simple because the source of the pollutants of interest was assumed to be outdoors.
Previous research mainly focused on optimizing ventilation control considering IAQ and energy. To the best of our knowledge, the existing literature does not address the control strategies of combining ventilation control and filtration control considering indoor PM levels, overall IAQ, and energy consumption. The objective of this study was to propose a control strategy to determine the optimal control modes and set-point values of the ventilation and filtration flow rates, according to continuously changing indoor and outdoor PM2.5 conditions (indoor PM2.5 generation rate and outdoor PM2.5 concentration) taking into account indoor PM level, overall IAQ, and energy consumption.

2. Methods

The ventilation and filtration controls proposed in this study identifies optimal set-point values that satisfied three goals, which is shown in Figure 1. First, indoor PM2.5 concentration were kept below the target concentration; second, we ensured a minimum ventilation rate for overall IAQ management even though ventilation is unfavorable to reduce indoor PM2.5; and third, we minimized the fan energy consumption while achieving the first and second goals. The optimizing problem can be expressed mathematically as:
Objective function
E ( t ) = f ( Q v ( t ) ,   Q f ( t ) ) = Q v ( t ) × Δ P v 3600 × F v , eff + Q f ( t ) × Δ P f 3600 × F f , eff
Constraints
Q v ( t ) Q v , min   ,   Q f ( t ) 0 :   Lower   bounds
Q v ( t ) Q v , max   ,   Q f ( t ) Q f , max :   Upper   bounds
C in ( t + 1 ) = f ( Q v ( t ) ,   Q f ( t ) ) C in , target :   Linear   inequalities

2.1. Dynamic Model for Predicting Indoor PM Generation Rate

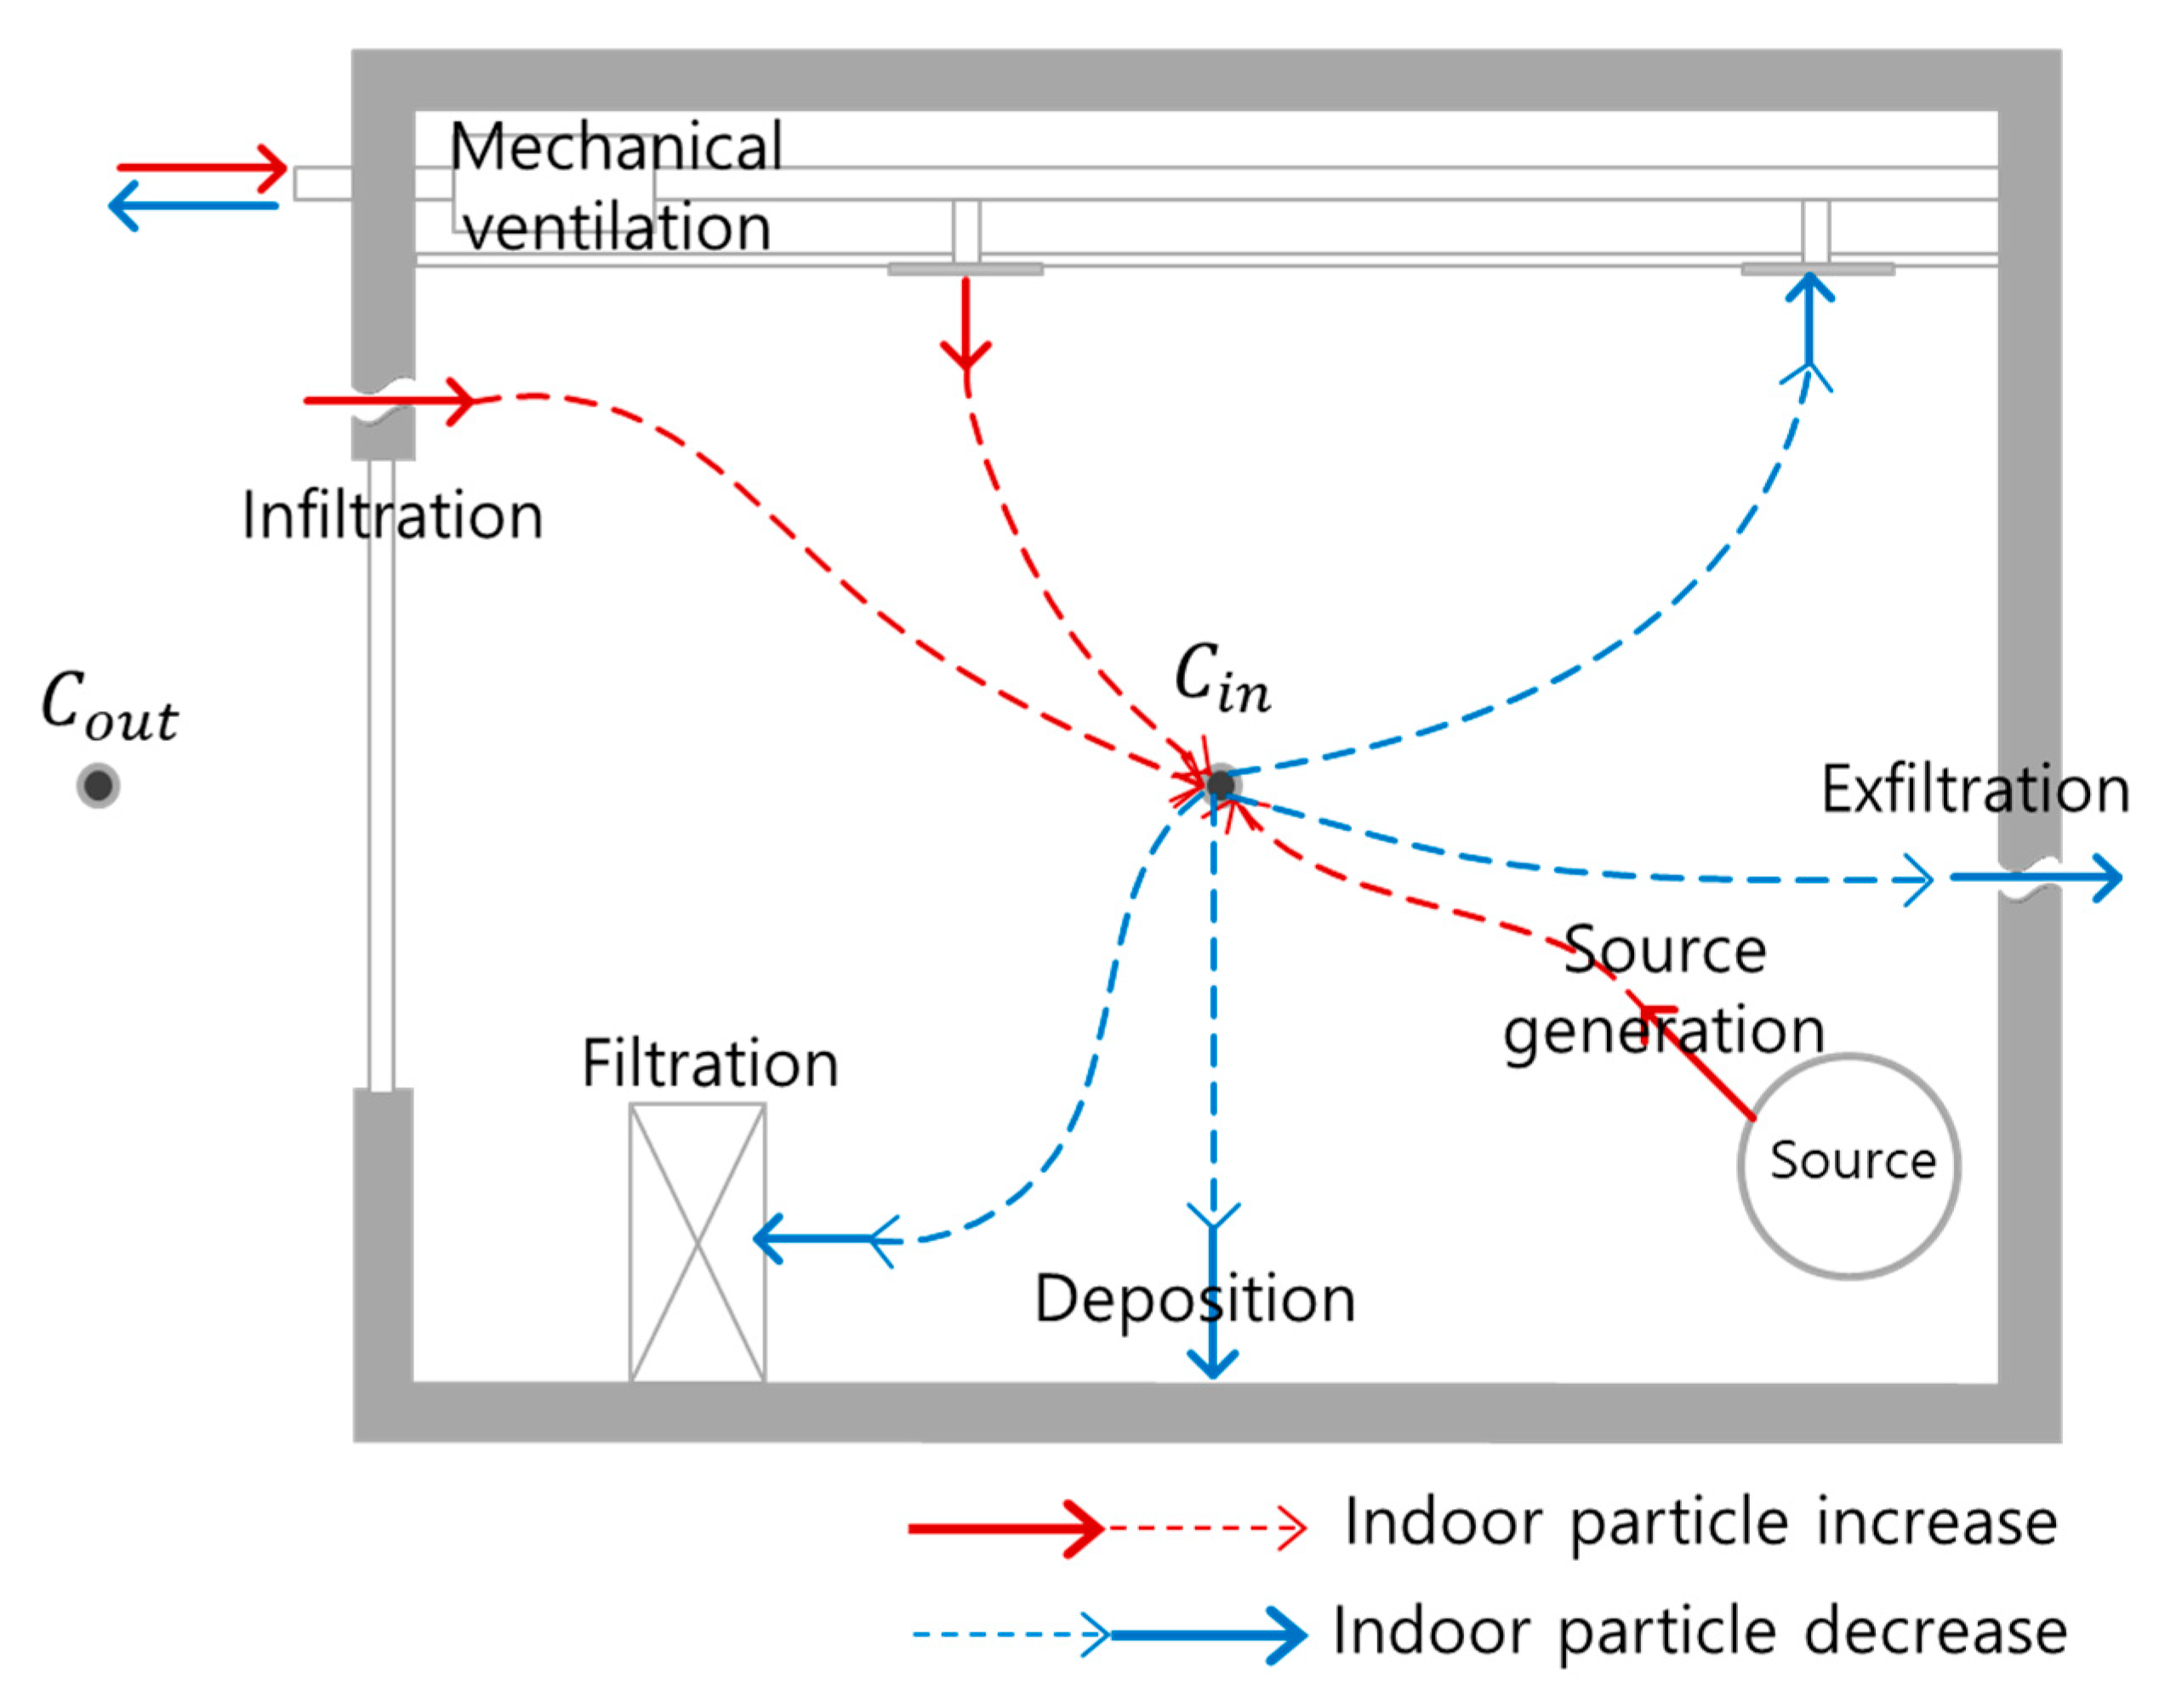
A mass balance equation was adopted to calculate the indoor PM generation rate, and a MATLAB program (MathWorks, Natick, Massachusetts, USA) was developed to estimate the indoor PM generation rate. Figure 2 shows the mechanism of indoor particle concentration in a space equipped with a mechanical ventilation system and a filtration system. Further, indoor particle concentration can be calculated using Equation (5). The indoor PM2.5 generation rate of Equation (6) can be derived from the indoor PM2.5 concentration model of Equation (5). The first and second terms in Equation (5) describe the outdoor particles transported into building via infiltration and ventilation. G represents the lumped indoor PM2.5 generation rate from various indoor sources. The remaining terms in Equation (5) explain the indoor particle removal due to exfiltration, ventilation, deposition onto indoor surfaces, and indoor air filtration.
dC in ( t ) dt = P λ C out ( t ) + ( 1 η v ) Q V ( t ) V C out ( t ) + G ( t ) V λ C in Q V ( t ) V C in ( t ) kC in ( t ) η f Q f ( t ) V C in ( t )
G ( t ) = V φ · ( C in ( t ) C in ( t 1 ) e φ t ( 1 e φ t ) ( Q V ( t 1 ) V ( 1 η v ) + P λ ) φ C out ( t 1 ) ) , φ = Q V ( t 1 ) V + k + λ + η f Q f ( t 1 ) V
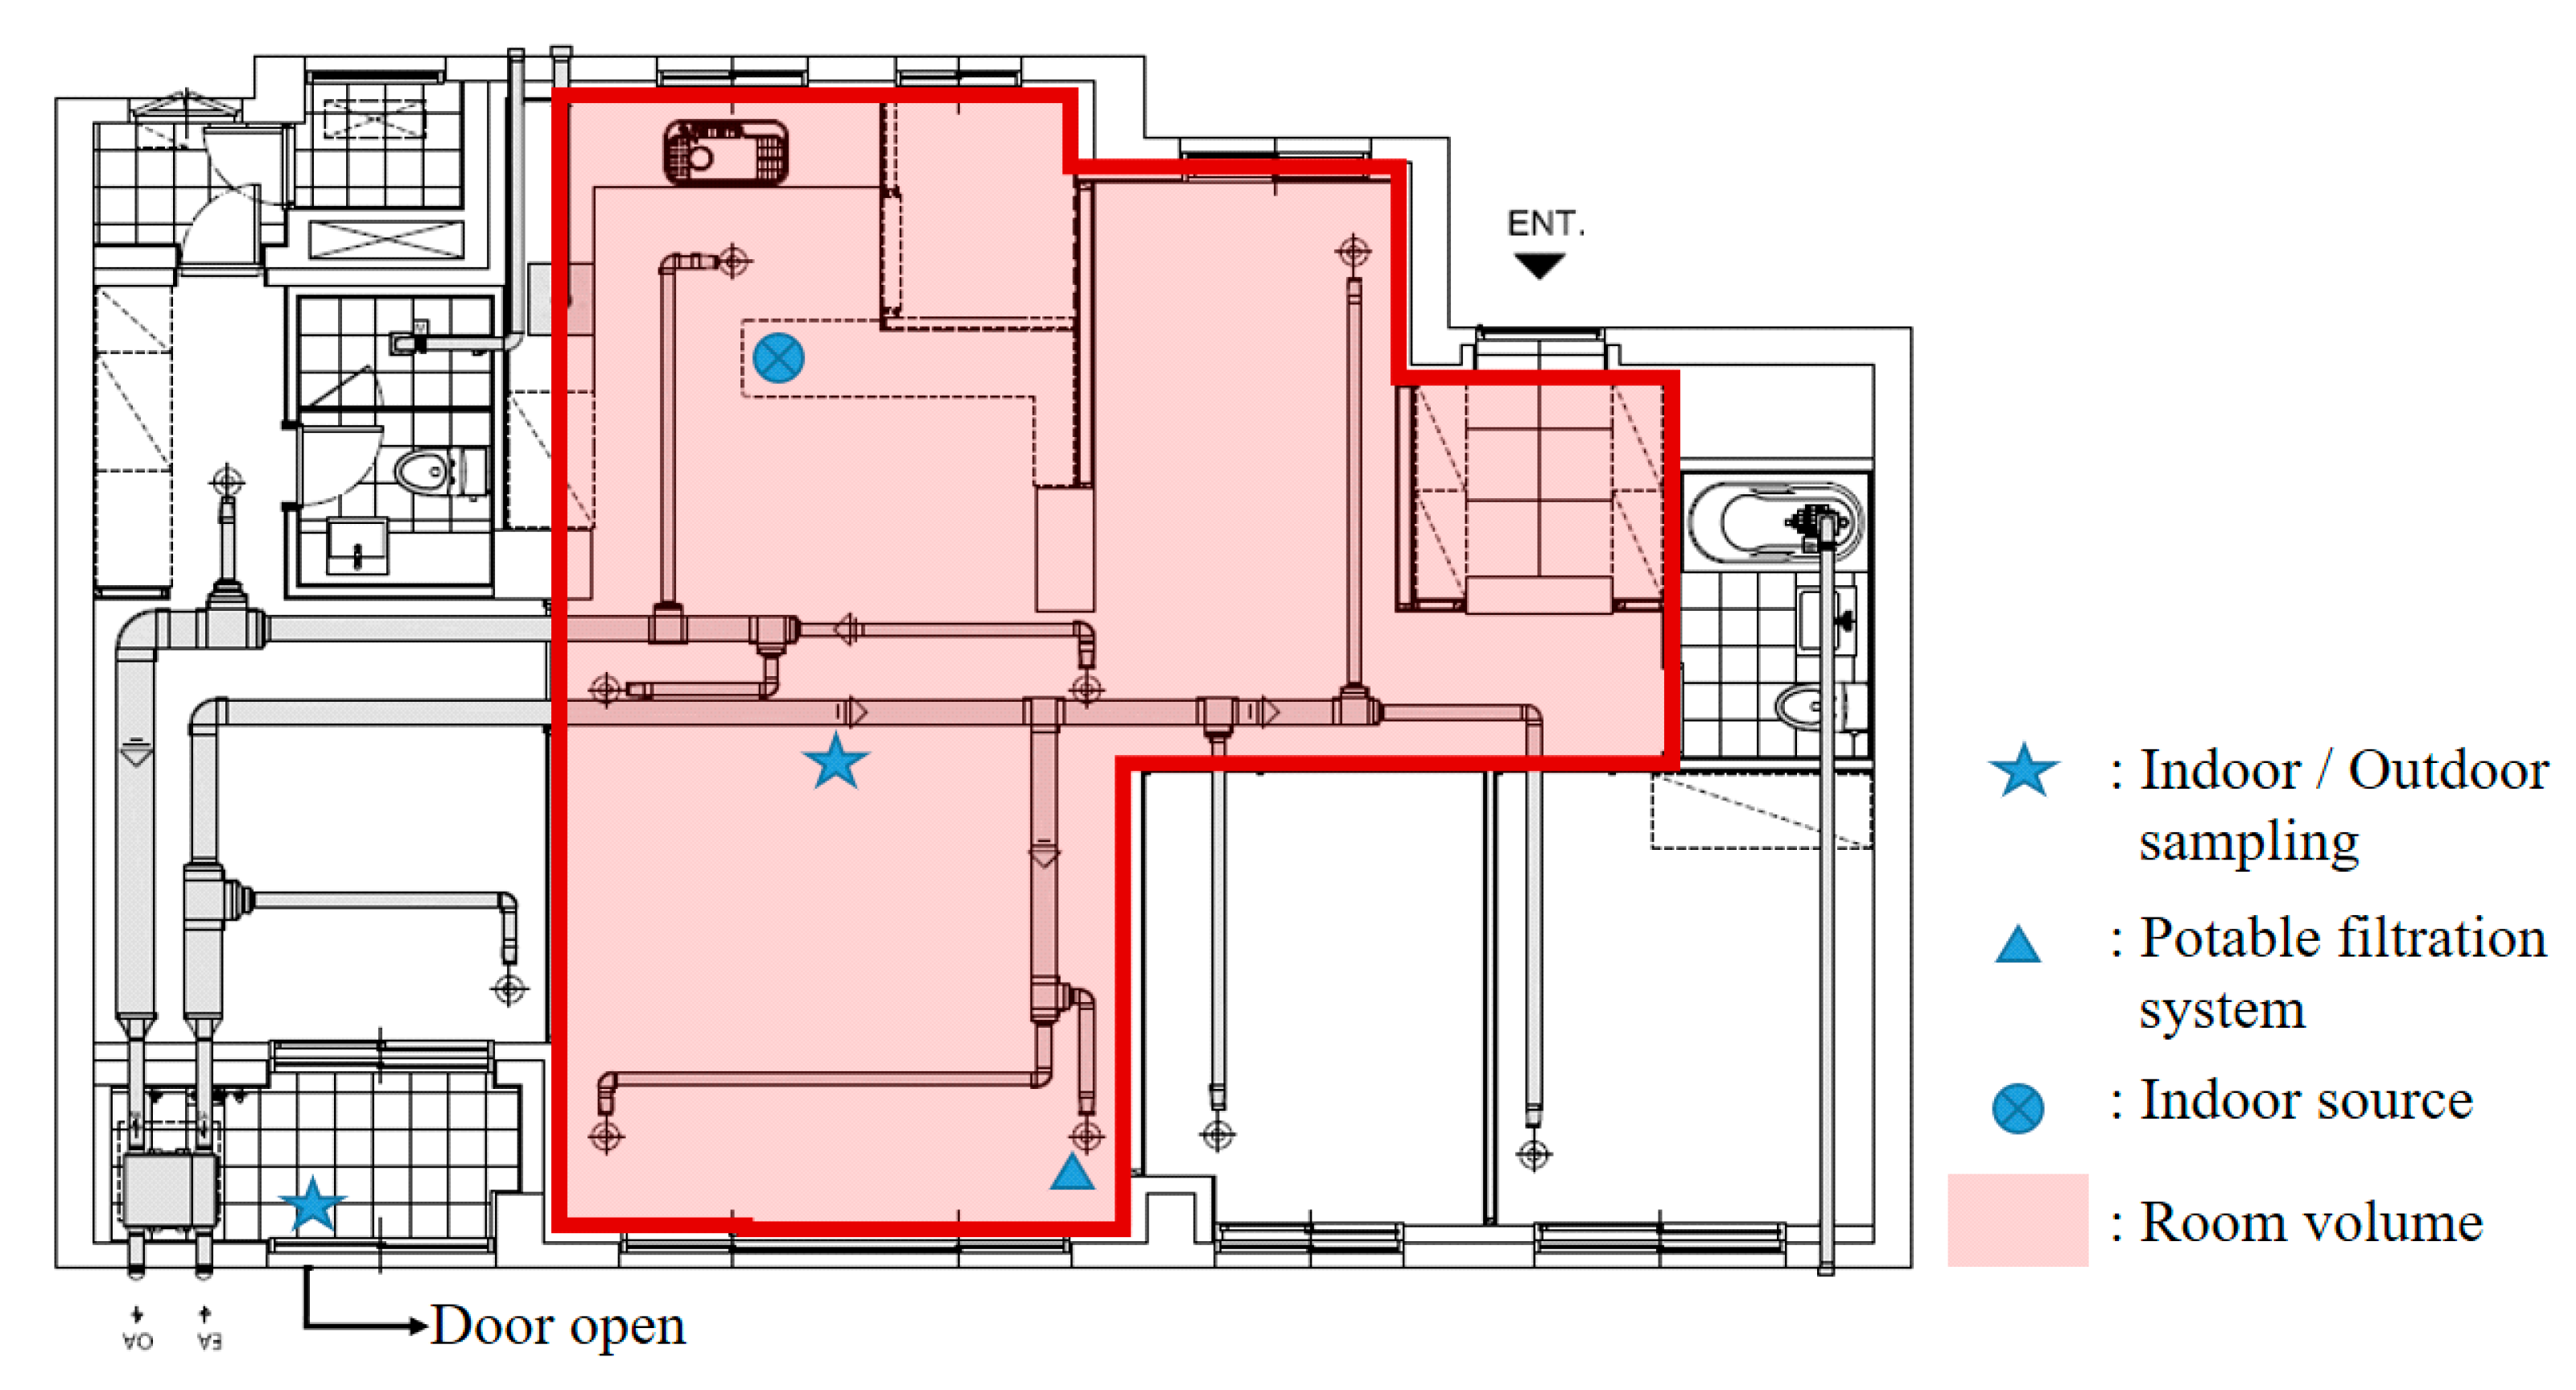
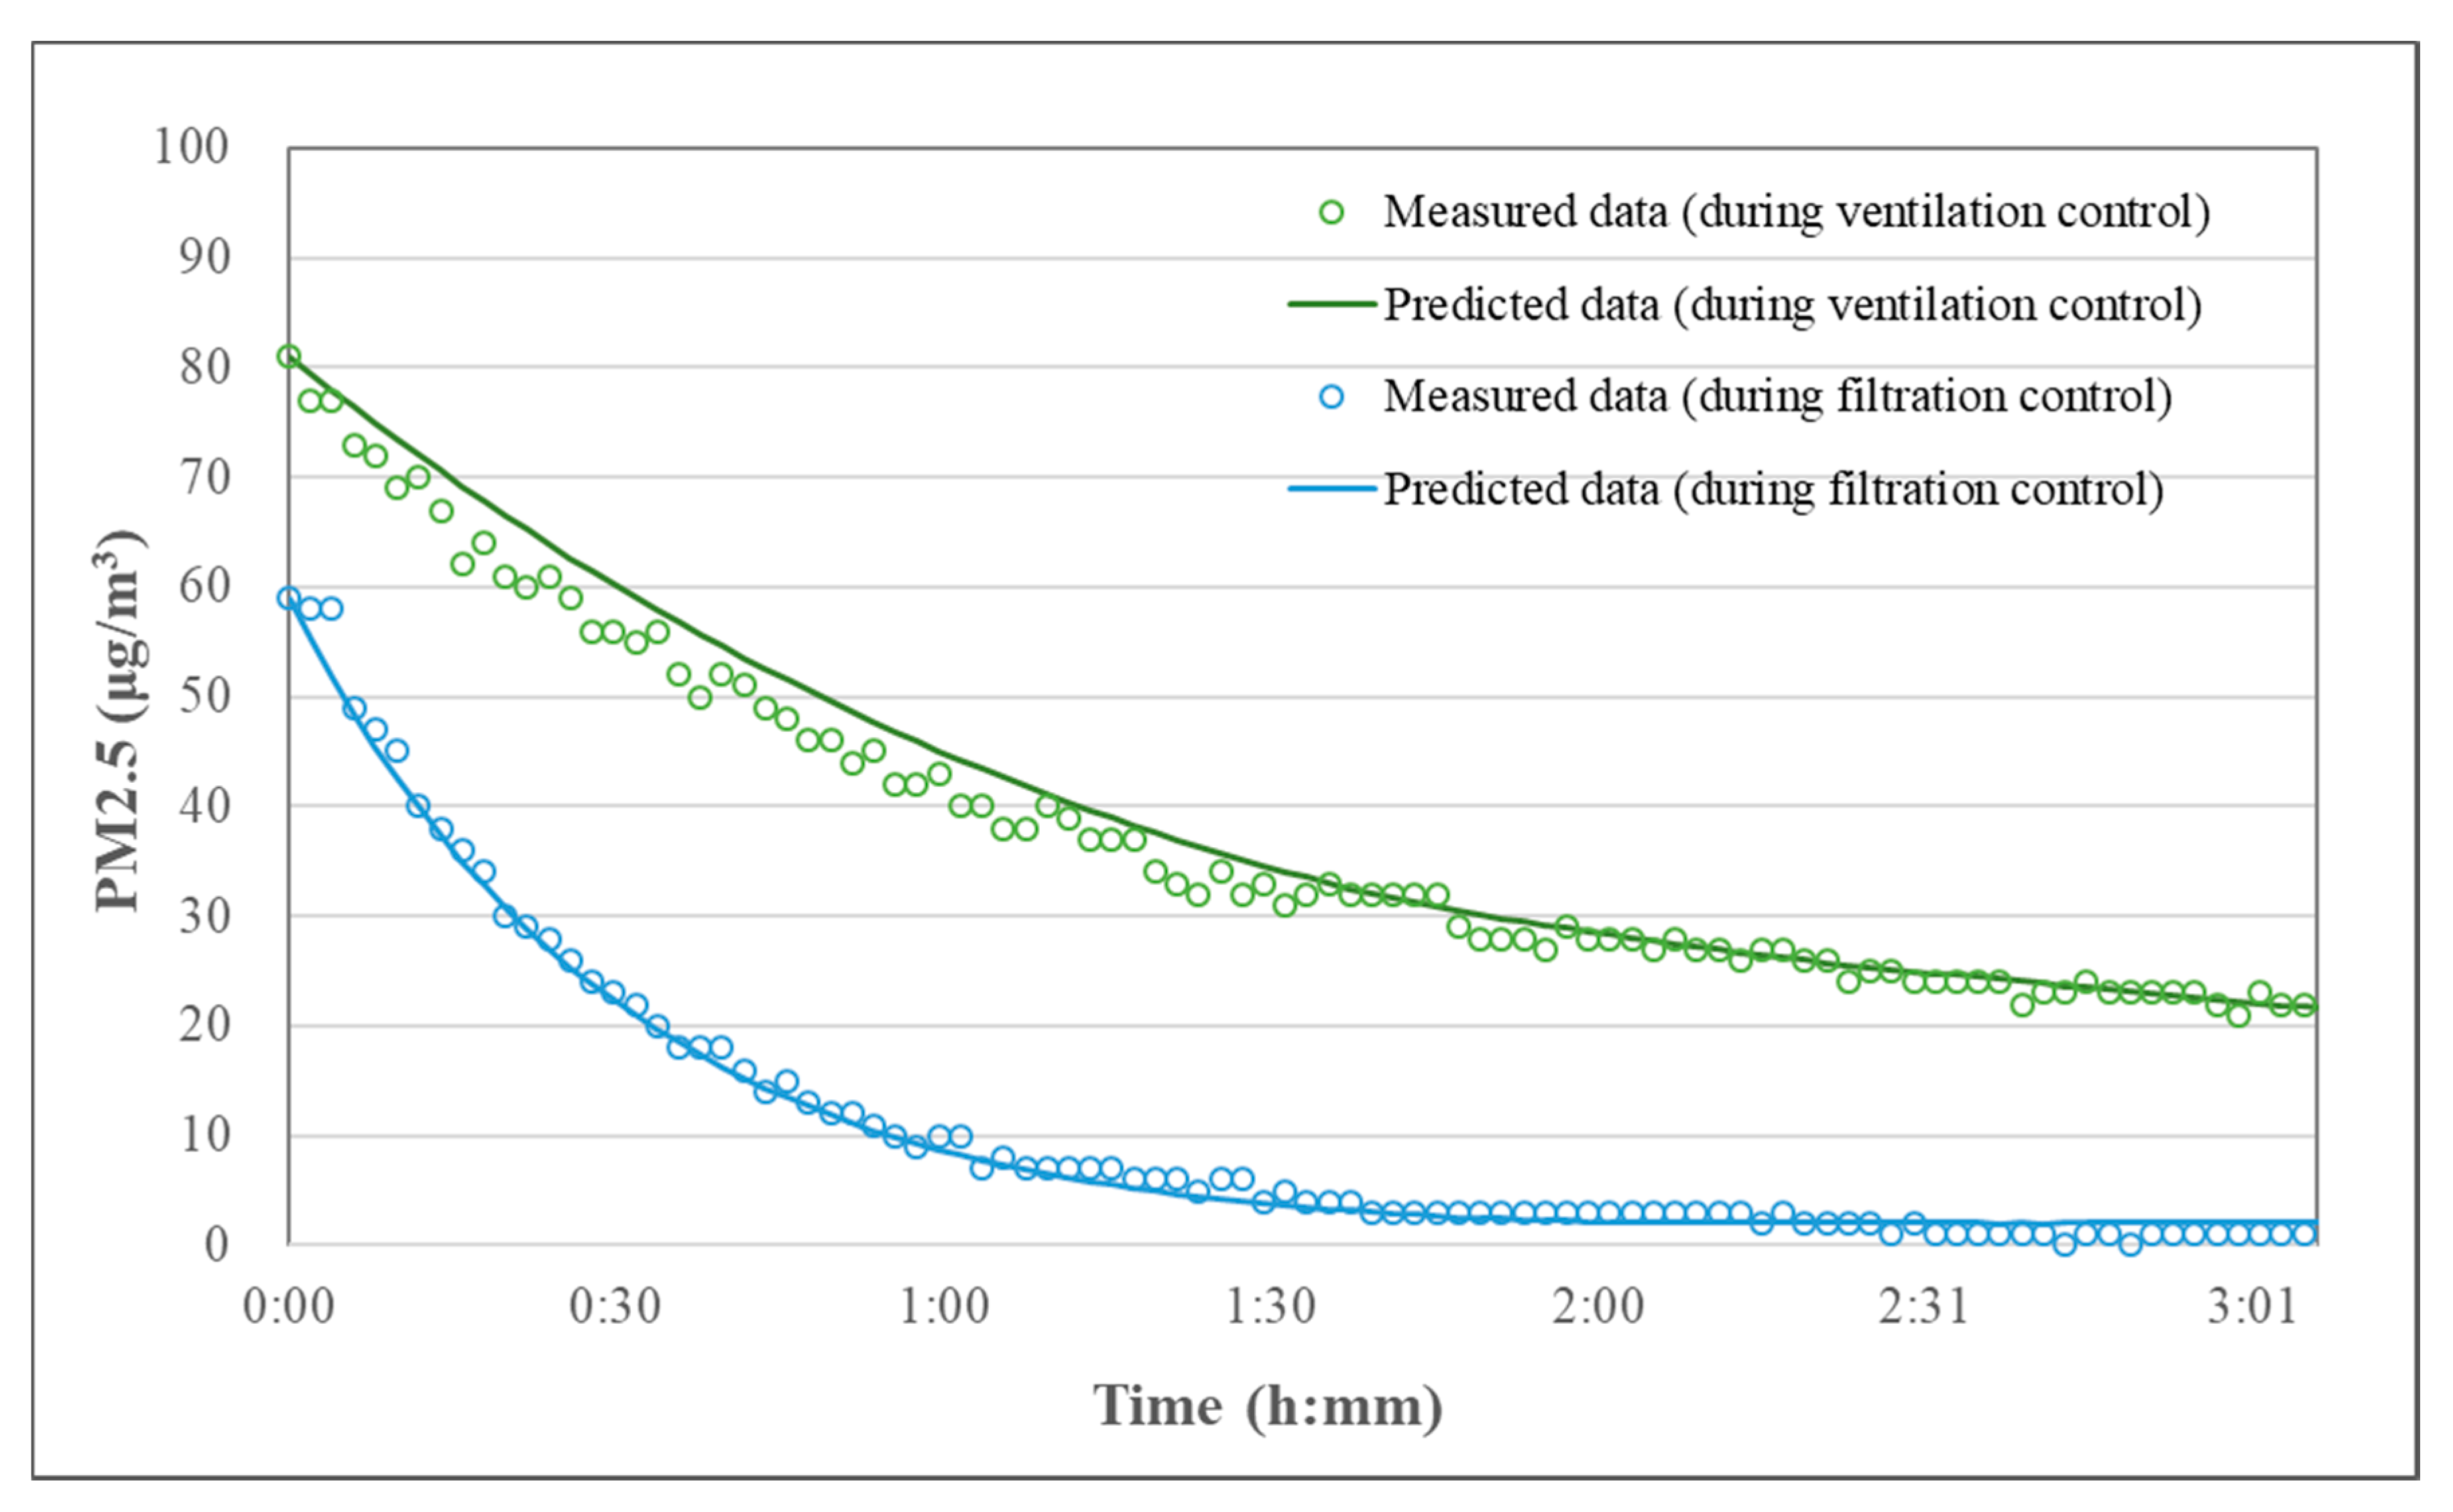
The field test experiment was carried out in a house (Figure 3) to verify the theoretical model. The test apartment was equipped with a heat-recovery ventilation system and portable air-cleaning system, which are both widely used in Korean residential buildings. The experiment was conducted on a portion of the apartment (inside area of the red line in Figure 3) that could be assumed as a single zone (door gap was sealed using clear tape to prevent airflow between the rooms). Although the predicted generation rate needs to be compared with the measured value for accurate model verification, it is difficult to directly measure the particle generation rate with current technology. For this reason, the model was verified by comparing the indoor concentrations predicted by Equation (5) with the measured data. Figure 4 shows the comparison of the indoor PM2.5 concentration calculated by the model (blue and green line) and the measured indoor PM2.5 concentration (blue and green circles) during operation of the ventilation or filtration system. To obtain the values of the coefficients (P, k, ηv, and ηf) required for the indoor PM model, experiments were conducted before the verification experiments, and the results are shown in Table 1 and Table 2. A more detailed description of the measurement setup was reported previously [27]. Briefly, experiments were conducted successively for 20 days from 4 July 2017 to 23 July 2017 in a newly constructed apartment. Two sets of equipment were deployed indoors and outdoors to measure particle concentration, temperature, and relative humidity. Particle number concentration ranged from 0.3–10 μm (AeroTrak Handheld Particle Counter Model 9306, TSI, Ramsey County, MN, USA) in size. Mass concentration of PM2.5 (Sidepak personal aerosol monitor Model AM510, TSI) were collected every 2 min and the air exchange rates were simultaneously measured using a tracer gas (SF6) monitor (Photoacoustic multi-gas monitor Model INNOVA 1314/1412, INNOVA AirTech Instruments, Ballerup, Denmark) every two minutes.

2.2. Control Limit (CL) Curve

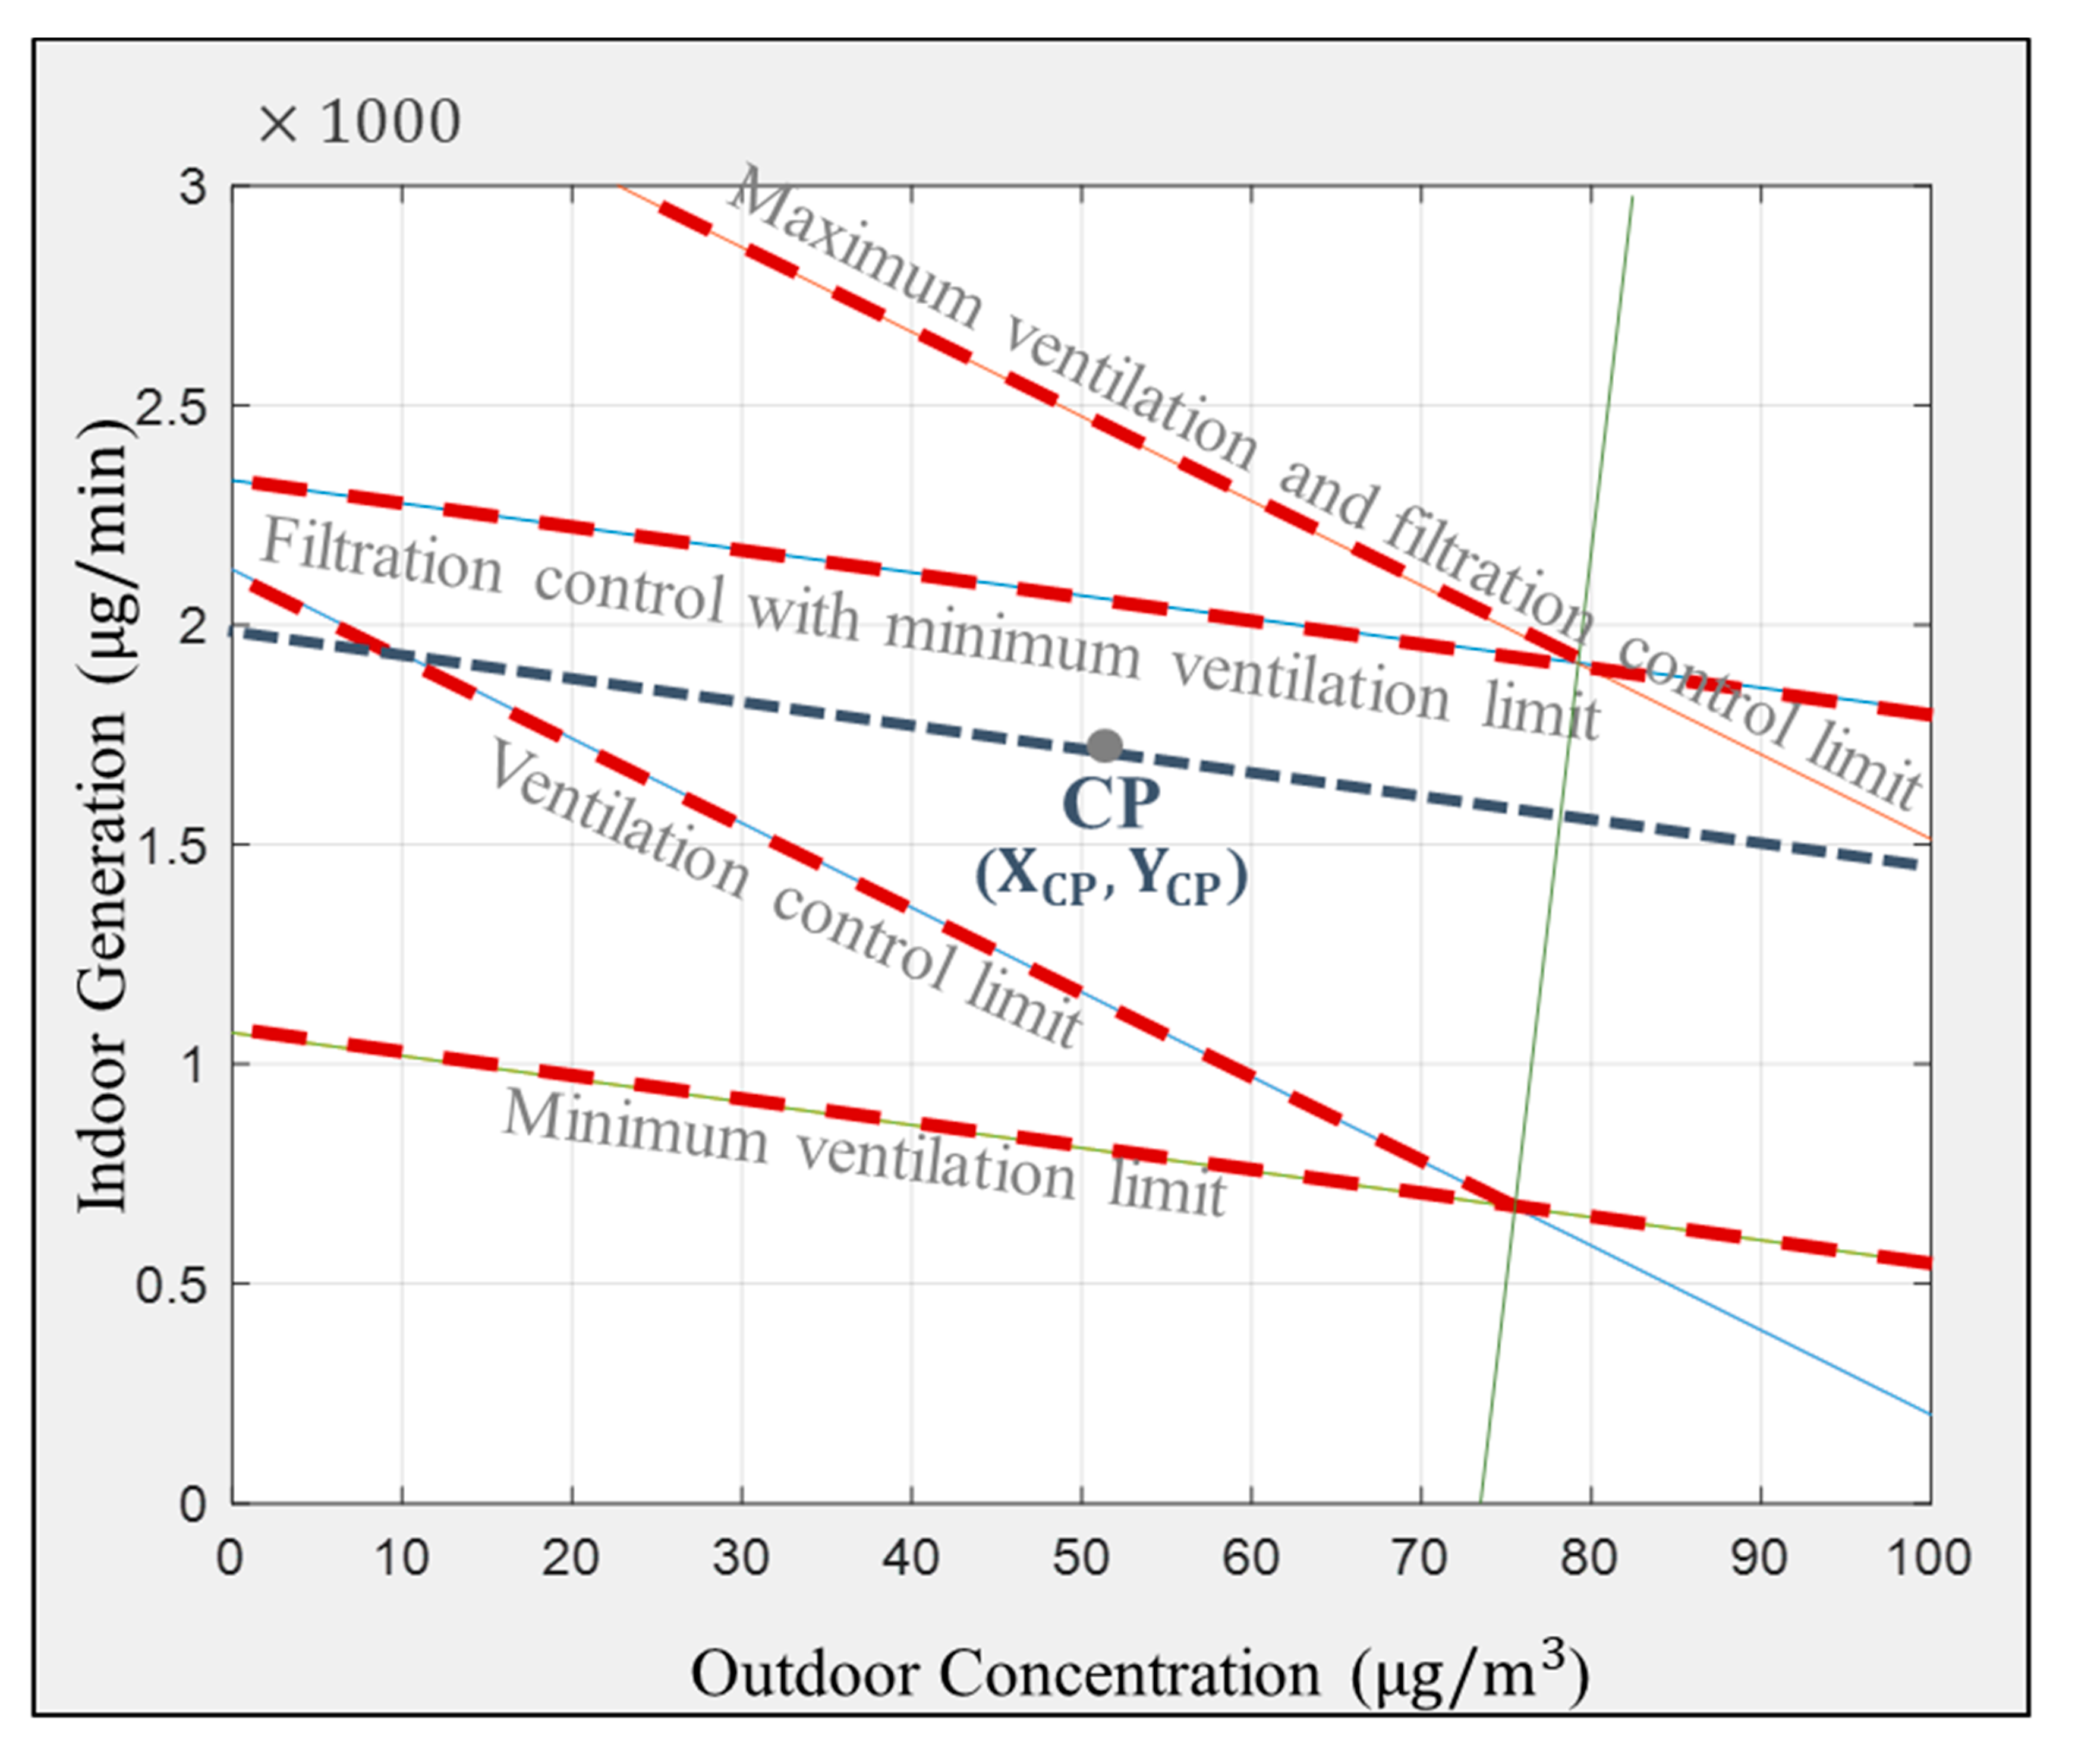
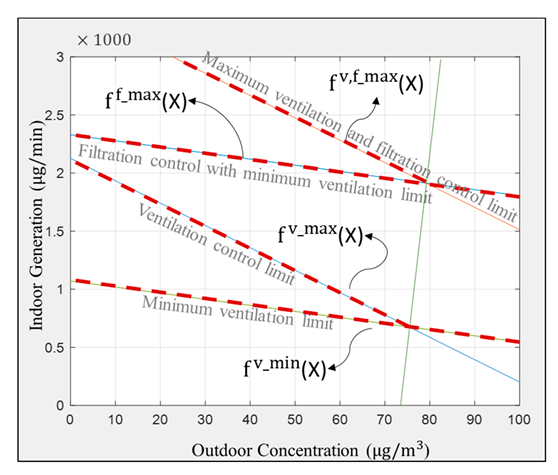
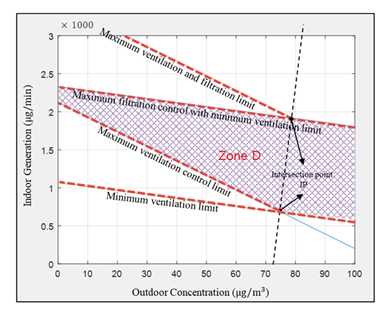
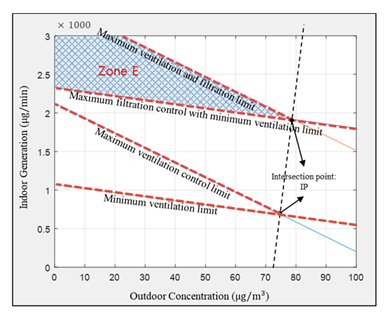
To determine the optimal control mode and set-point flow rate of the ventilation and filtration system, a control limit (CL) curve was developed in this study. The CL curve can be used to determine the optimal operation mode and set-point values of the ventilation and filtration systems depending on indoor and outdoor PM conditions. The CL curve includes zones (A to F) divided by four control limit graphs, as shown in Figure 5. Zones of the CL curve represent condition sets of indoor and outdoor PM defined by the outdoor PM2.5 concentration (X-value) and indoor PM2.5 generation rate (Y-value). The four control limits in Figure 5 are minimum ventilation control limit, ventilation control limit, filtration + minimum ventilation control limit, and maximum ventilation + filtration limit. Each control limit represents a control constraint that can maintain indoor PM2.5 concentration below the target concentration by minimum ventilation control, ventilation control, filtration + minimum ventilation control, and maximum ventilation + filtration control, respectively. By obtaining four control limits using the indoor PM2.5 generation rate model from Equation (6), the CL curve can be generated for each control time step. The process of developing the CL curve is as follows.
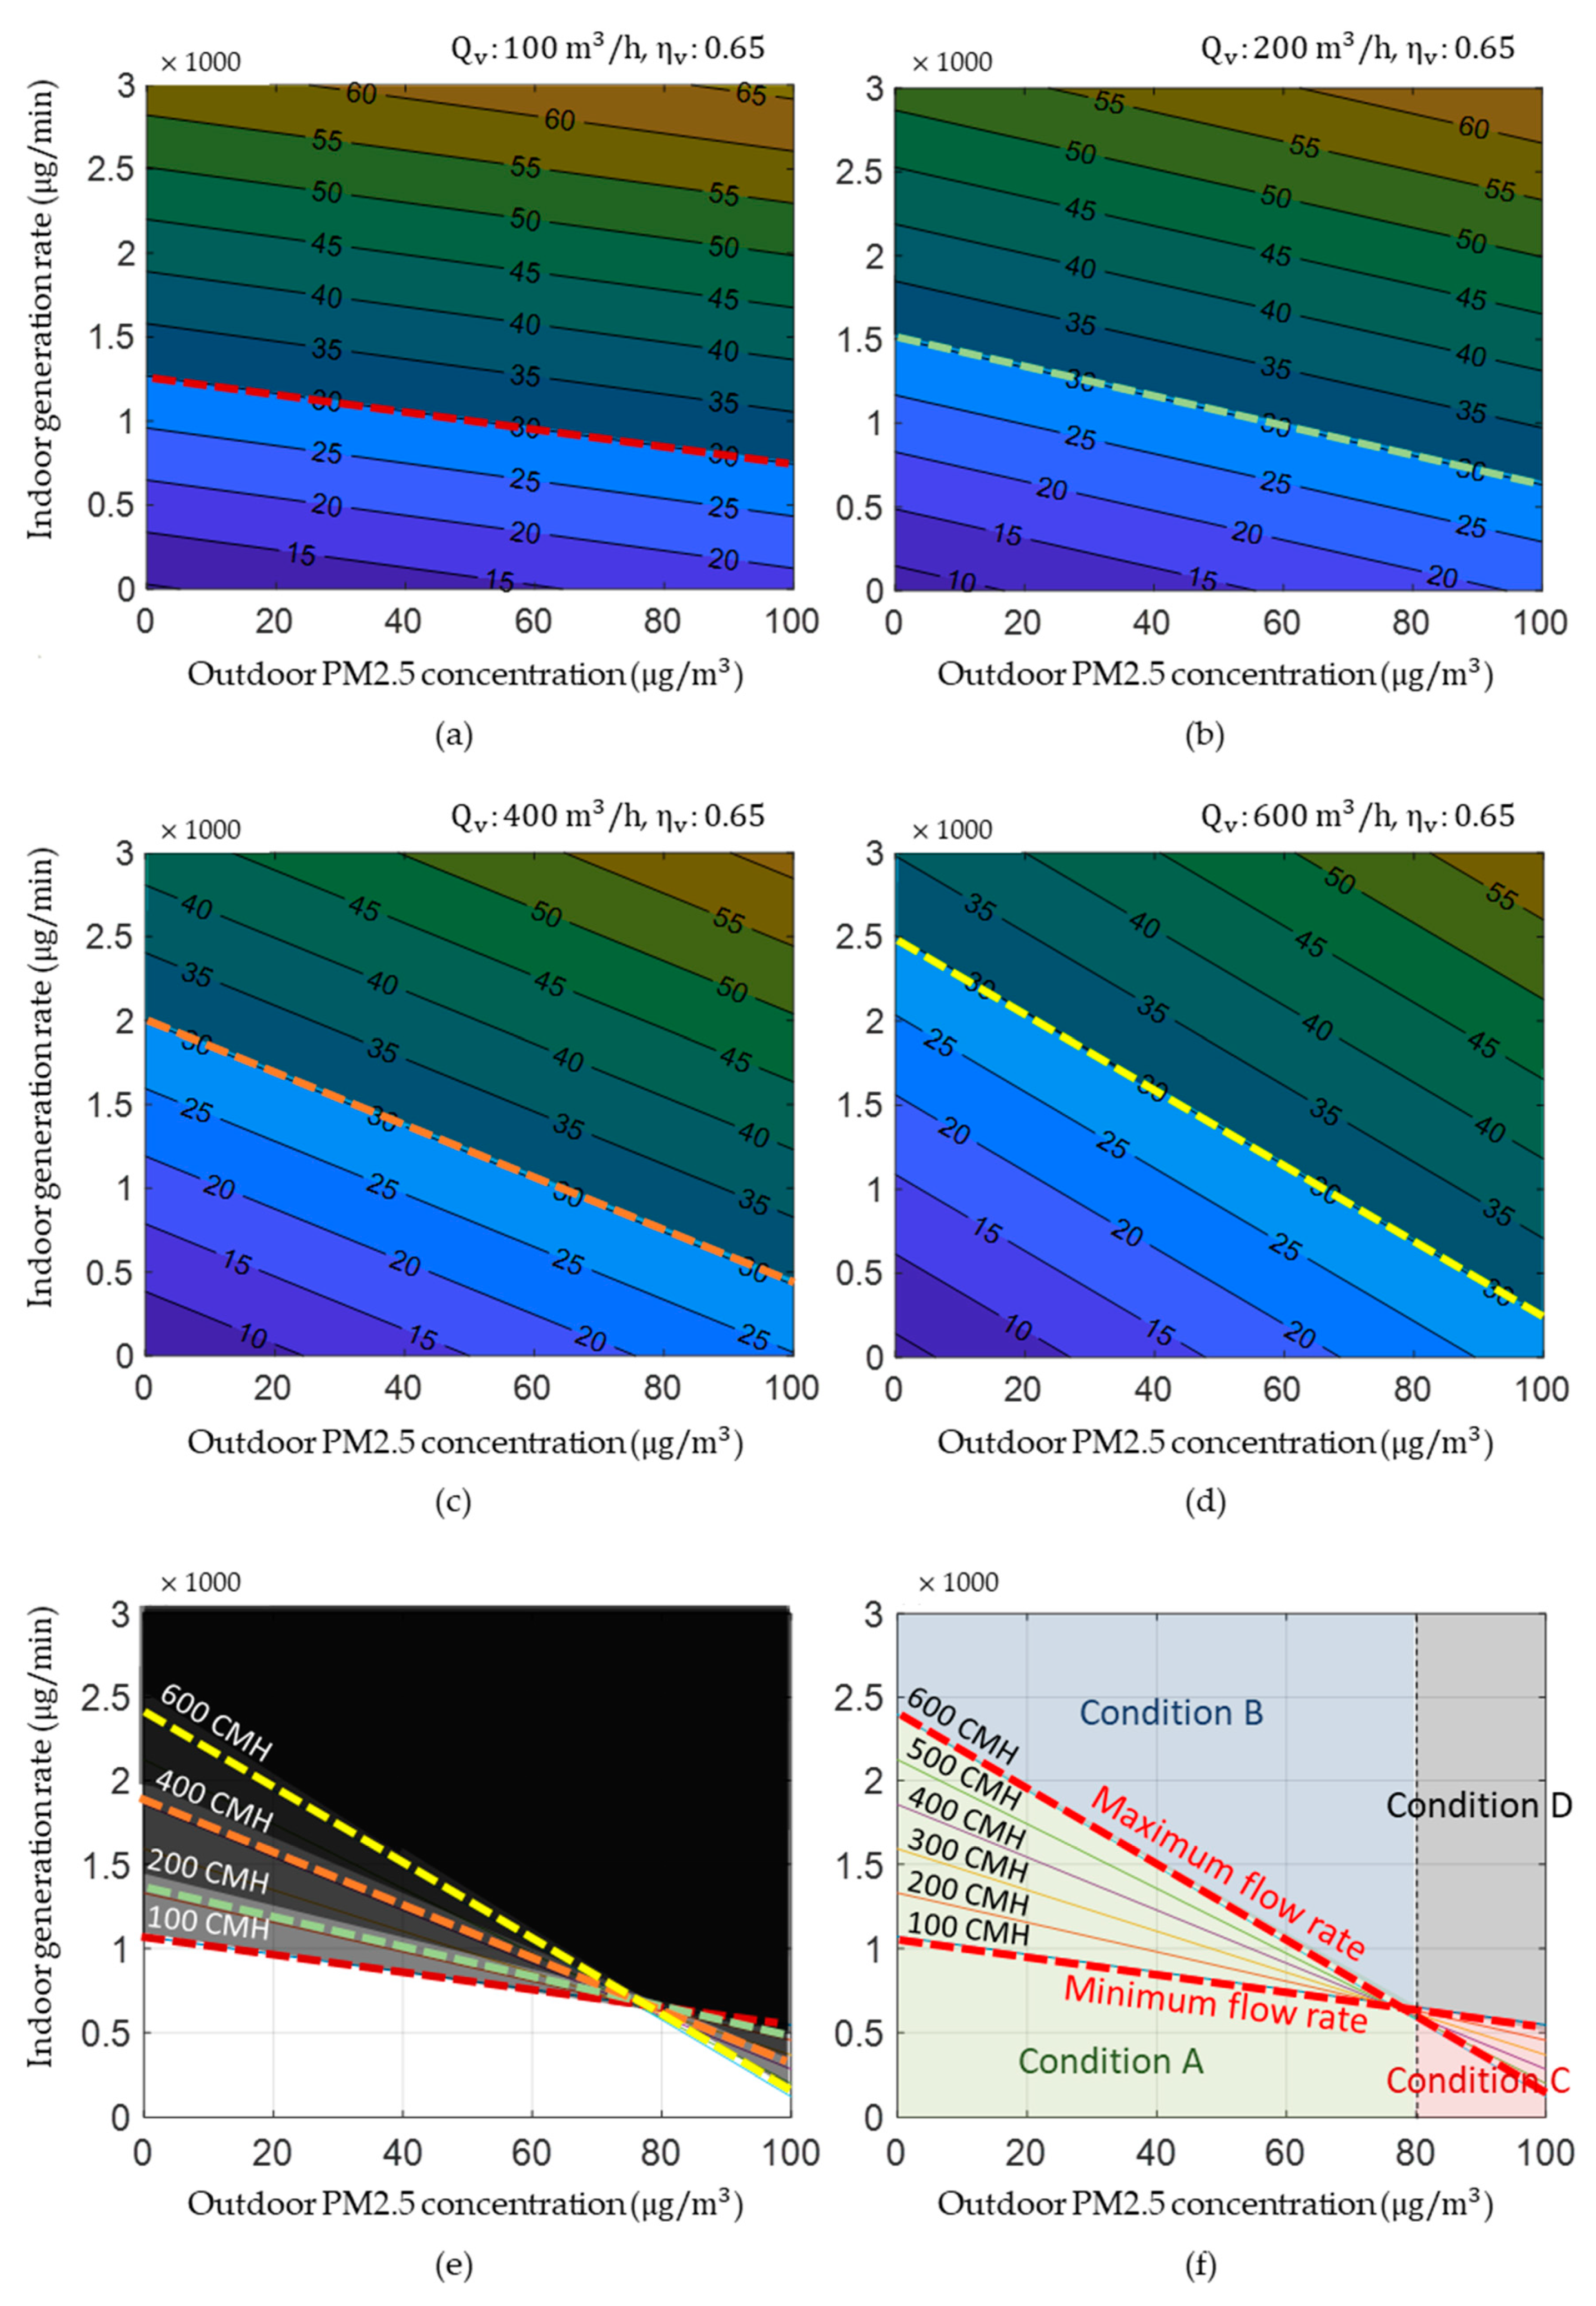
Figure 6a–d shows characteristics of indoor PM2.5 concentration at a given time depending on the outdoor concentration (X-axis) and indoor generation rate (Y-axis) when the ventilation system with a filter efficiency of 0.65 is operated at 100 m 3 / h (Figure 6a), 200 m 3 / h (Figure 6b), 400 m 3 / h (Figure 6c), and 600 m 3 / h (Figure 6d), respectively. Assuming the indoor target concentration is 30 μ g / m 3 (dashed lines in Figure 6a–d), the graphs in the bright parts represent lower indoor concentration than the target concentration, and those in the dark parts represent higher indoor concentration than the target concentration. It can also be stated that the bright parts are the indoor and outdoor PM2.5 condition sets that can be maintained below the indoor target concentration; on the other hand, the dark parts are the condition sets that exceed the indoor target concentration. From Figure 6a–d, the indoor target concentration according to the ventilation flow rates can be drawn as shown in Figure 6e and schematized as shown in Figure 6f.
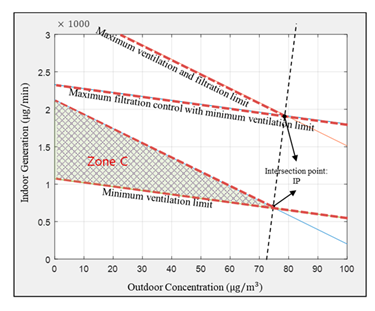
Obviously, all the graphs in Figure 6f cross at one point, as denoted by the intersection point (IP). On the left side of the IP, the indoor and outdoor PM condition zone below the indoor target concentration widens as the ventilation flow rate increases. On the other hand, it narrows as the ventilation flow rate increases on the right side of the IP. This means that increasing the ventilation rate is advantageous to lower the indoor PM concentration under the conditions on the left side of the IP, whereas it is disadvantageous under the conditions on the right side of the IP. The left side is divided into Condition A, which can meet the indoor target concentration by adjusting the ventilation rate, and Condition B, with which it is difficult to maintain the indoor target concentrations even with the maximum flow rate (600 m 3 / h ) of the applied ventilation system. The right part is also divided into the two conditions: Condition C and D. Condition C is the indoor and outdoor conditions that can keep the indoor target concentration when the minimum ventilation control is applied despite the high outdoor concentration. In addition, Condition D is the conditions that cannot maintain the target concentration.
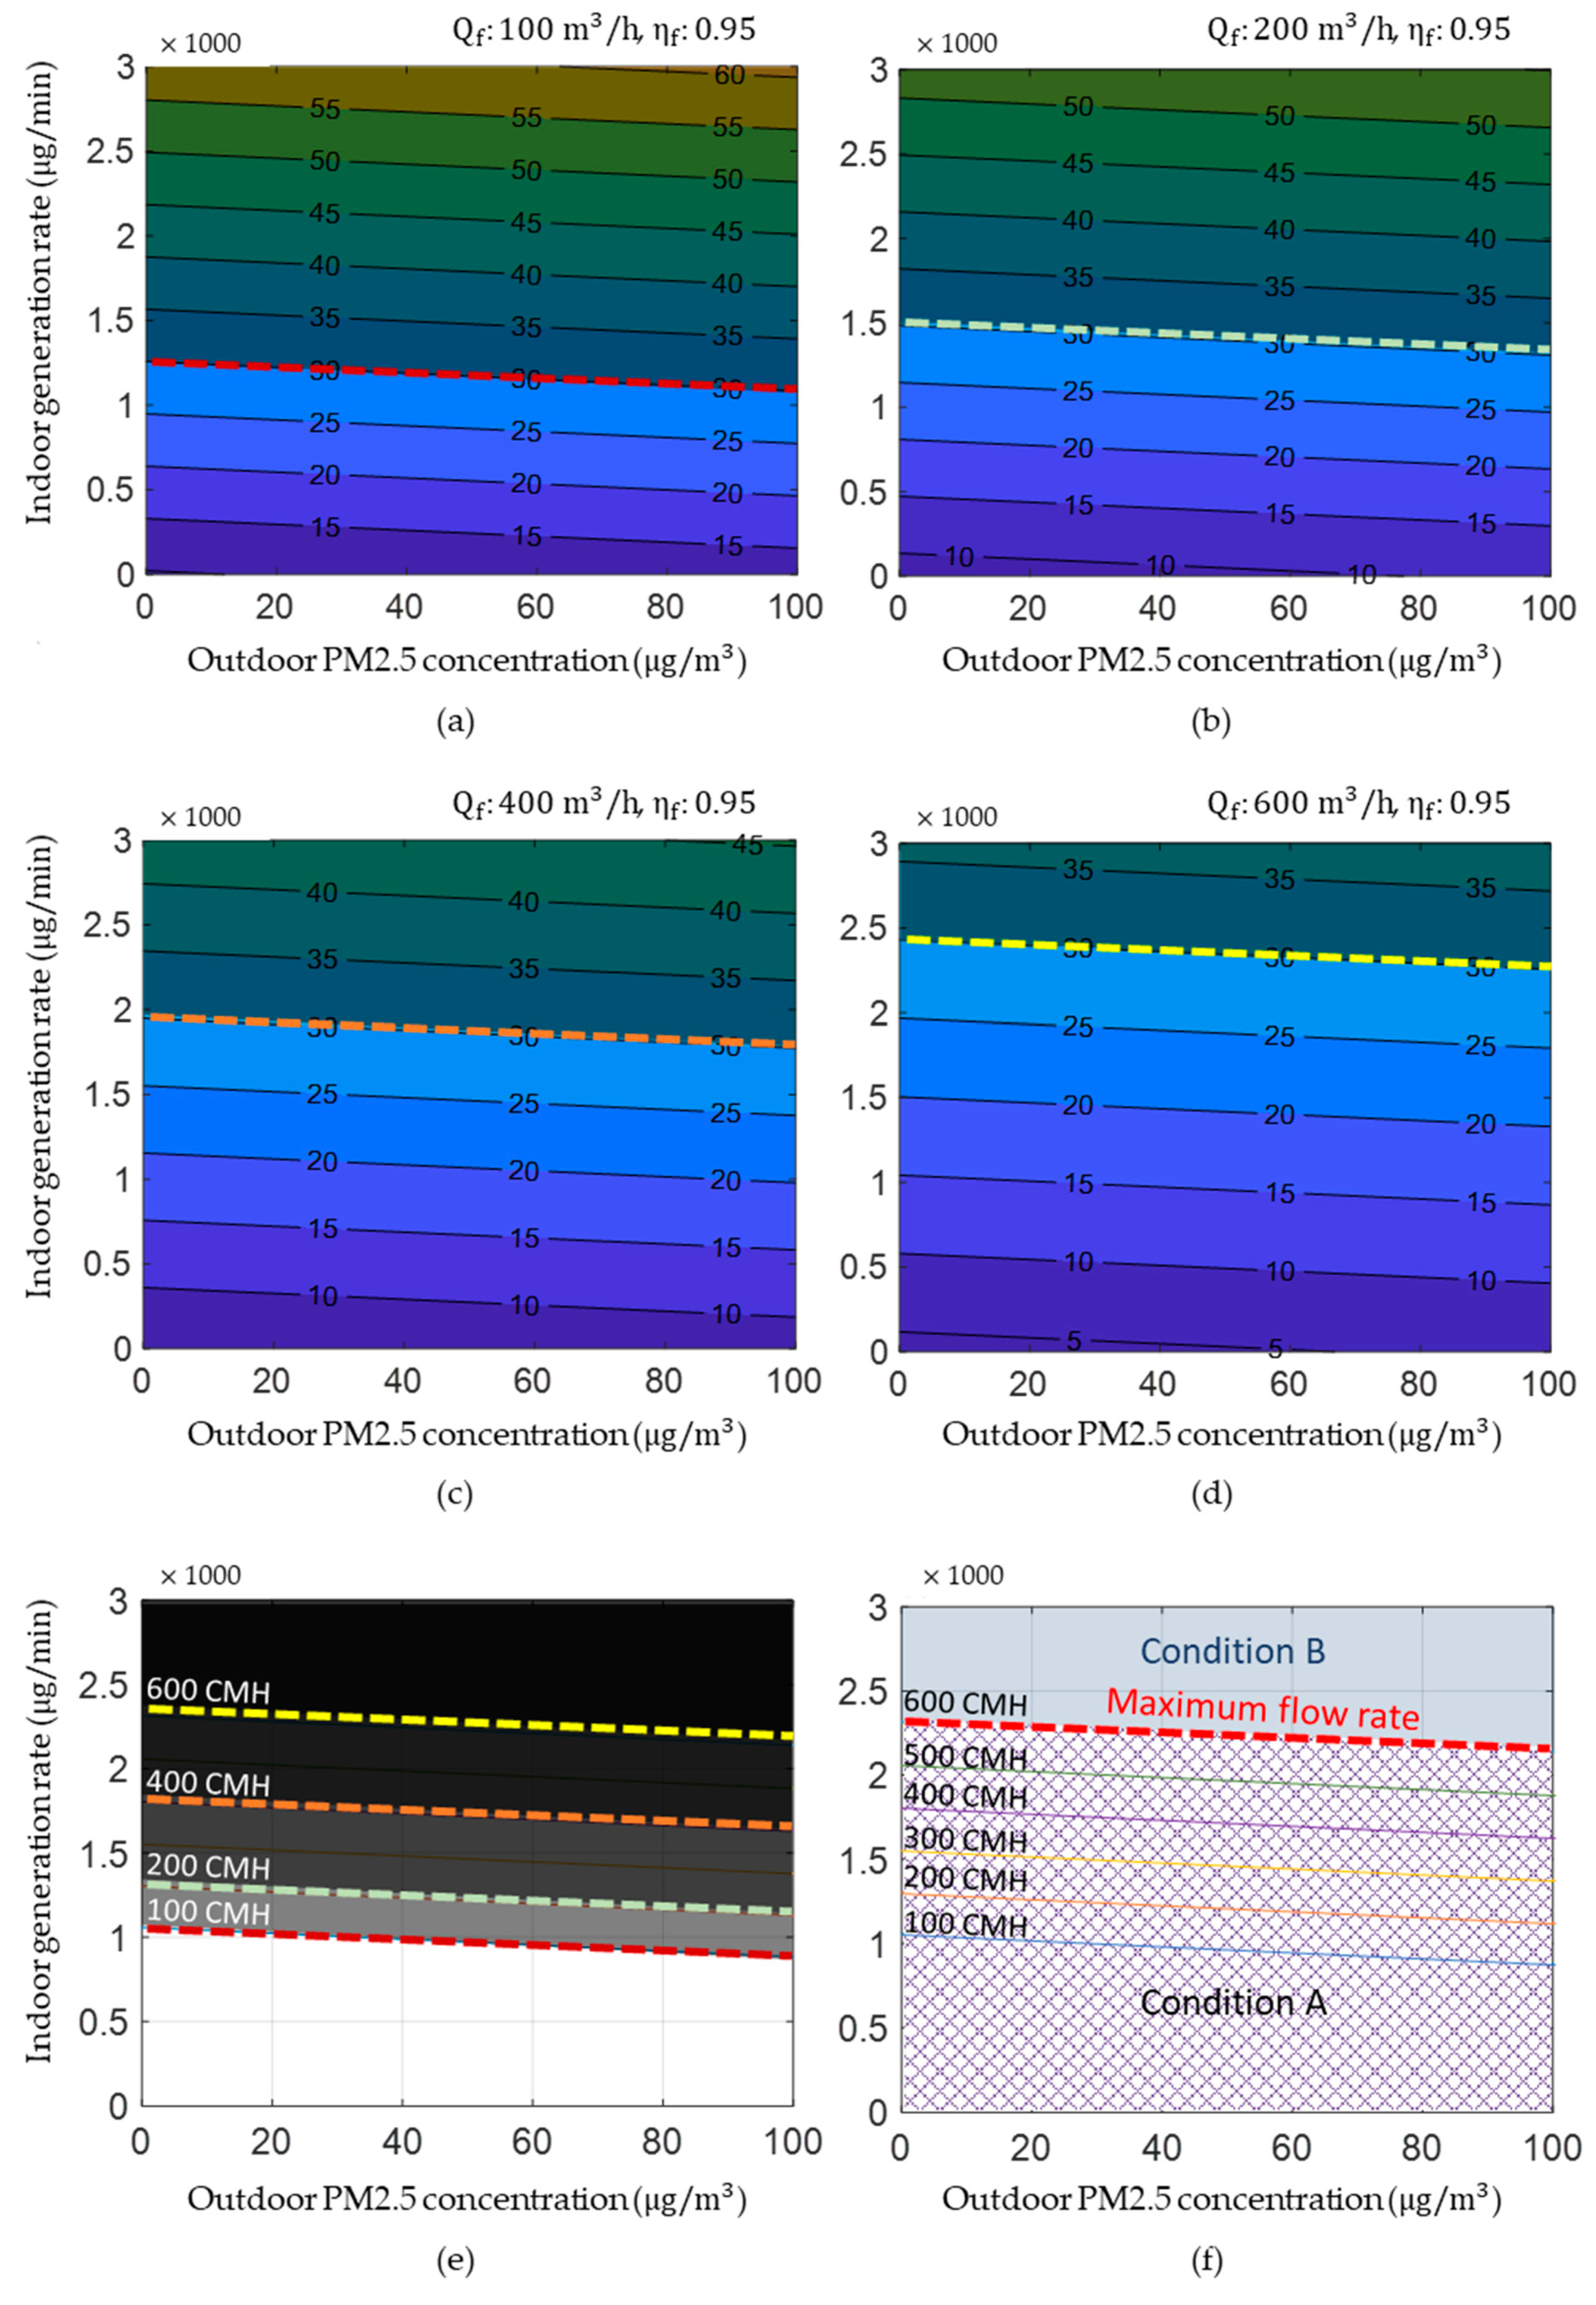
Similar concepts can be applied to the filtration control. Figure 7a–d shows the indoor PM2.5 concentration depending on the outdoor concentration and the indoor generation rate when the filtration system with a filter efficiency of 0.95 is operated at 100 m 3 / h (Figure 7a), 200 m 3 / h . (Figure 7b), 400 m 3 / h (Figure 7c), and 600 m 3 / h (Figure 7d), respectively. The graphs of Figure 7e represent the graph corresponding to the indoor concentration 30 μ g / m 3 from Figure 7a–d, and it can be schematized as shown in Figure 7f, according to the filtration flow rates. It can be seen that the slopes of the graphs in Figure 7f are all identical regardless of the filtration flow rate. The slope is associated to the amount of incoming external air and it is assumed to be same during the filtration mode. Figure 7f is divided into the two conditions: Conditions A and B. Condition A indicates the indoor and outdoor conditions that can meet the indoor target concentration by controlling the flow rates, and Condition B indicates the conditions that exceeds the target concentration even with the maximum flow rate of the applied filtration system. By combining Figure 6f and Figure 7f, the CL curve can be obtained as shown in Figure 5.

2.3. Concept of the Optimization Control Using the CL Curve

Using the CL curve, the control strategy for each zone can be directed by the control limits, which indicates the control constraints. First, Zones A and B in Figure 5 are constrained by the minimum ventilation limit. It means that the indoor PM2.5 concentration can be maintained below the target level by operating the ventilation system with the minimum ventilation rate (100 m 3 / h in this study). Specifically, increasing the ventilation rate is advantageous to lowering indoor PM2.5 in Zone A, whereas increasing the ventilation rate is disadvantageous in Zone B due to the high outdoor concentration. Minimum ventilation is recommended to minimize the fan energy consumption in Zone A, whereas minimum ventilation should be ensured to optimize PM2.5 and overall IAQ in Zone B. Second, either by ventilation control or filtration control, the indoor target concentrations in Zone C can be managed, because Zone C is below ventilation control limit and filtration + minimum ventilation control limit. The control mode and the optimal set-point flow rate maintaining the indoor target concentration and consuming least energy needs to be determined by comparing the energy consumption of the ventilation control and filtration control in this condition zone. If the filtration control is determined using less energy than the ventilation control in Zone C, minimum ventilation should be ensured for overall IAQ management. Thereafter, in Zone D, it is difficult to maintain the target indoor PM2.5 concentration with the applied ventilation system; therefore, the filtration + minimum ventilation control should be applied for managing the indoor PM and overall IAQ. To maintain the target PM2.5 concentration and minimize fan energy consumption, the filtration system needs to be controlled with the optimum filtration flow rate. In conditions of low outdoor concentration and high indoor generation rate, which is Zone E, the system needs to be operated with maximum filtration control and additional ventilation control to keep indoor PM2.5 concentration below the target concentration. Finally, Zone F is the condition in which the target PM2.5 concentration cannot be satisfied by operation of the applied ventilation or filtration system. In Zone F, the filtration system operates at the maximum flow rate up to the next control time step.

2.4. Optimization Control Algorithm of Ventilation and Filtration

What is first needed to optimize the control mode and flow rate of the system is to identify what the current outdoor and indoor PM conditions are and which zones the current conditions belong to. Then, the optimum flow rate needs to be calculated to meet the objectives according to condition zone using the CL curve. The optimization control algorithm of ventilation and filtration system follows three steps:
Step 1: Identify the condition point (CP) at the control time step
The condition Point (CP) is defined as the outdoor and indoor PM conditions, i.e., the outdoor PM2.5 concentration ( X CP ) and indoor PM2.5 generation rate ( Y CP ) at the corresponding control time step. The outdoor PM2.5 concentration is measured by the sensor, and the indoor PM2.5 generation rate is estimated by the dynamic model of Equation (2).
Step 2: Identify the condition zone to which the CP belongs
Once the condition zone to which the CP ( X CP , Y CP ) belongs is identified, the direction of control can be determined. Since the condition zone is an area surrounded by control limits, it can be identified by formulas of the control limits from Table 3 and the discriminant equations as shown in Table 4. For example, comparing the y-value of the CP with the y-values ( f v _ min ( X cp ) ,   f v _ max ( X cp ) ,   f f _ max ( X cp ) ) calculated by entering X CP into the control limit functions given in Table 3, the condition zone where the CP is located can be determined, as summarized in Table 4.
Step 3: Determine optimal control mode and flow rate
If the CP is in Zones A, B, or F, the operation mode and flow rate are determined immediately by the identification of the condition zone, but if the CP is in Zone C, the control mode and optimum flow rate should be determined, and if the CP is in Zone D and E, the optimum flow rate should be calculated. The optimum ventilation flow rate, Q v , opt , to satisfy the indoor target concentration, can be obtained from the function of the graph passing through the CP and the intersection point (IP) simultaneously, as shown in Figure 8. A graph below the CP indicates that the ventilation flow rate is not sufficient to maintain the target concentration; on the other hand, a graph above the CP means that the ventilation flow rate exceeds the required amount. Thus, in order to manage indoor PM2.5 using the minimum fan energy, the optimum ventilation rate is determined by a graph passing through the CP. If the flow rate is controlled by steps instead of applying a variable speed drive (VSD) device, it should be adjusted to a higher flow step than the calculated optimum flow rate. Knowing the IP, a function of the linear graph can be defined because the x- and y-values of the CP are already known in Step 1. Because the IP is the intersection of the minimum ventilation limit and ventilation control limit, solving the simultaneous equations from the relationship of f v _ min ( X IP ) = f v _ max ( X IP ) can obtain the x- and y-values of the IP, as presented in Equation (7).
X IP = I max I min S max S min ,   Y IP = S min · I max S max · I min S min S max
I max = V φ ( C in , target C in i 1 e φ t 1 e φ t ) ,   φ = Q v , max V + k + λ ,
I min = V φ ( C in , target C in i 1 e φ t 1 e φ t ) ,   φ = Q v , min V + k + λ ,
S max = Q v , max ( 1 η v ) + P · V · λ ,
S min = Q v , min ( 1 η v ) + P · V · λ .
Now, the optimum ventilation rate, Q v , opt , can be calculated by Equation (8) with the known CP ( X CP ,   Y CP ) and IP ( X IP ,   Y IP ):
Q v , opt = 1 1 η v · [ Y CP Y IP X IP X CP P · V · λ ] .
The optimum filtration rate ( Q f , opt ) to maintain the indoor target concentration can be obtained by Equation (9), i.e., a function of a linear graph passing through the CP with the same slope as the filtration + minimum ventilation control limit (Figure 9).
Y CP = ( Q v , min ( 1 η v ) + VP λ ) X CP +   V φ · C in , target C in i 1 e φ t ( 1 e φ t ) φ = Q v , min V + k + λ + η f Q f , opt V
When the CP belongs to condition Zone C, both the ventilation and filtration control can maintain the indoor target concentration. Therefore, it is necessary to determine an optimal control mode that uses less energy to manage indoor PM2.5. For this, the energy consumption of the fan when each system operates with the optimal flow rate should be calculated using Equations (10)–(13).
W v , opt = Q v , opt × Δ P v 3600 × F v , eff
E v , opt = W v , opt × T v
W f , opt = Q f , opt × Δ P f 3600 × F f , eff
E f , opt = W f , opt × T f
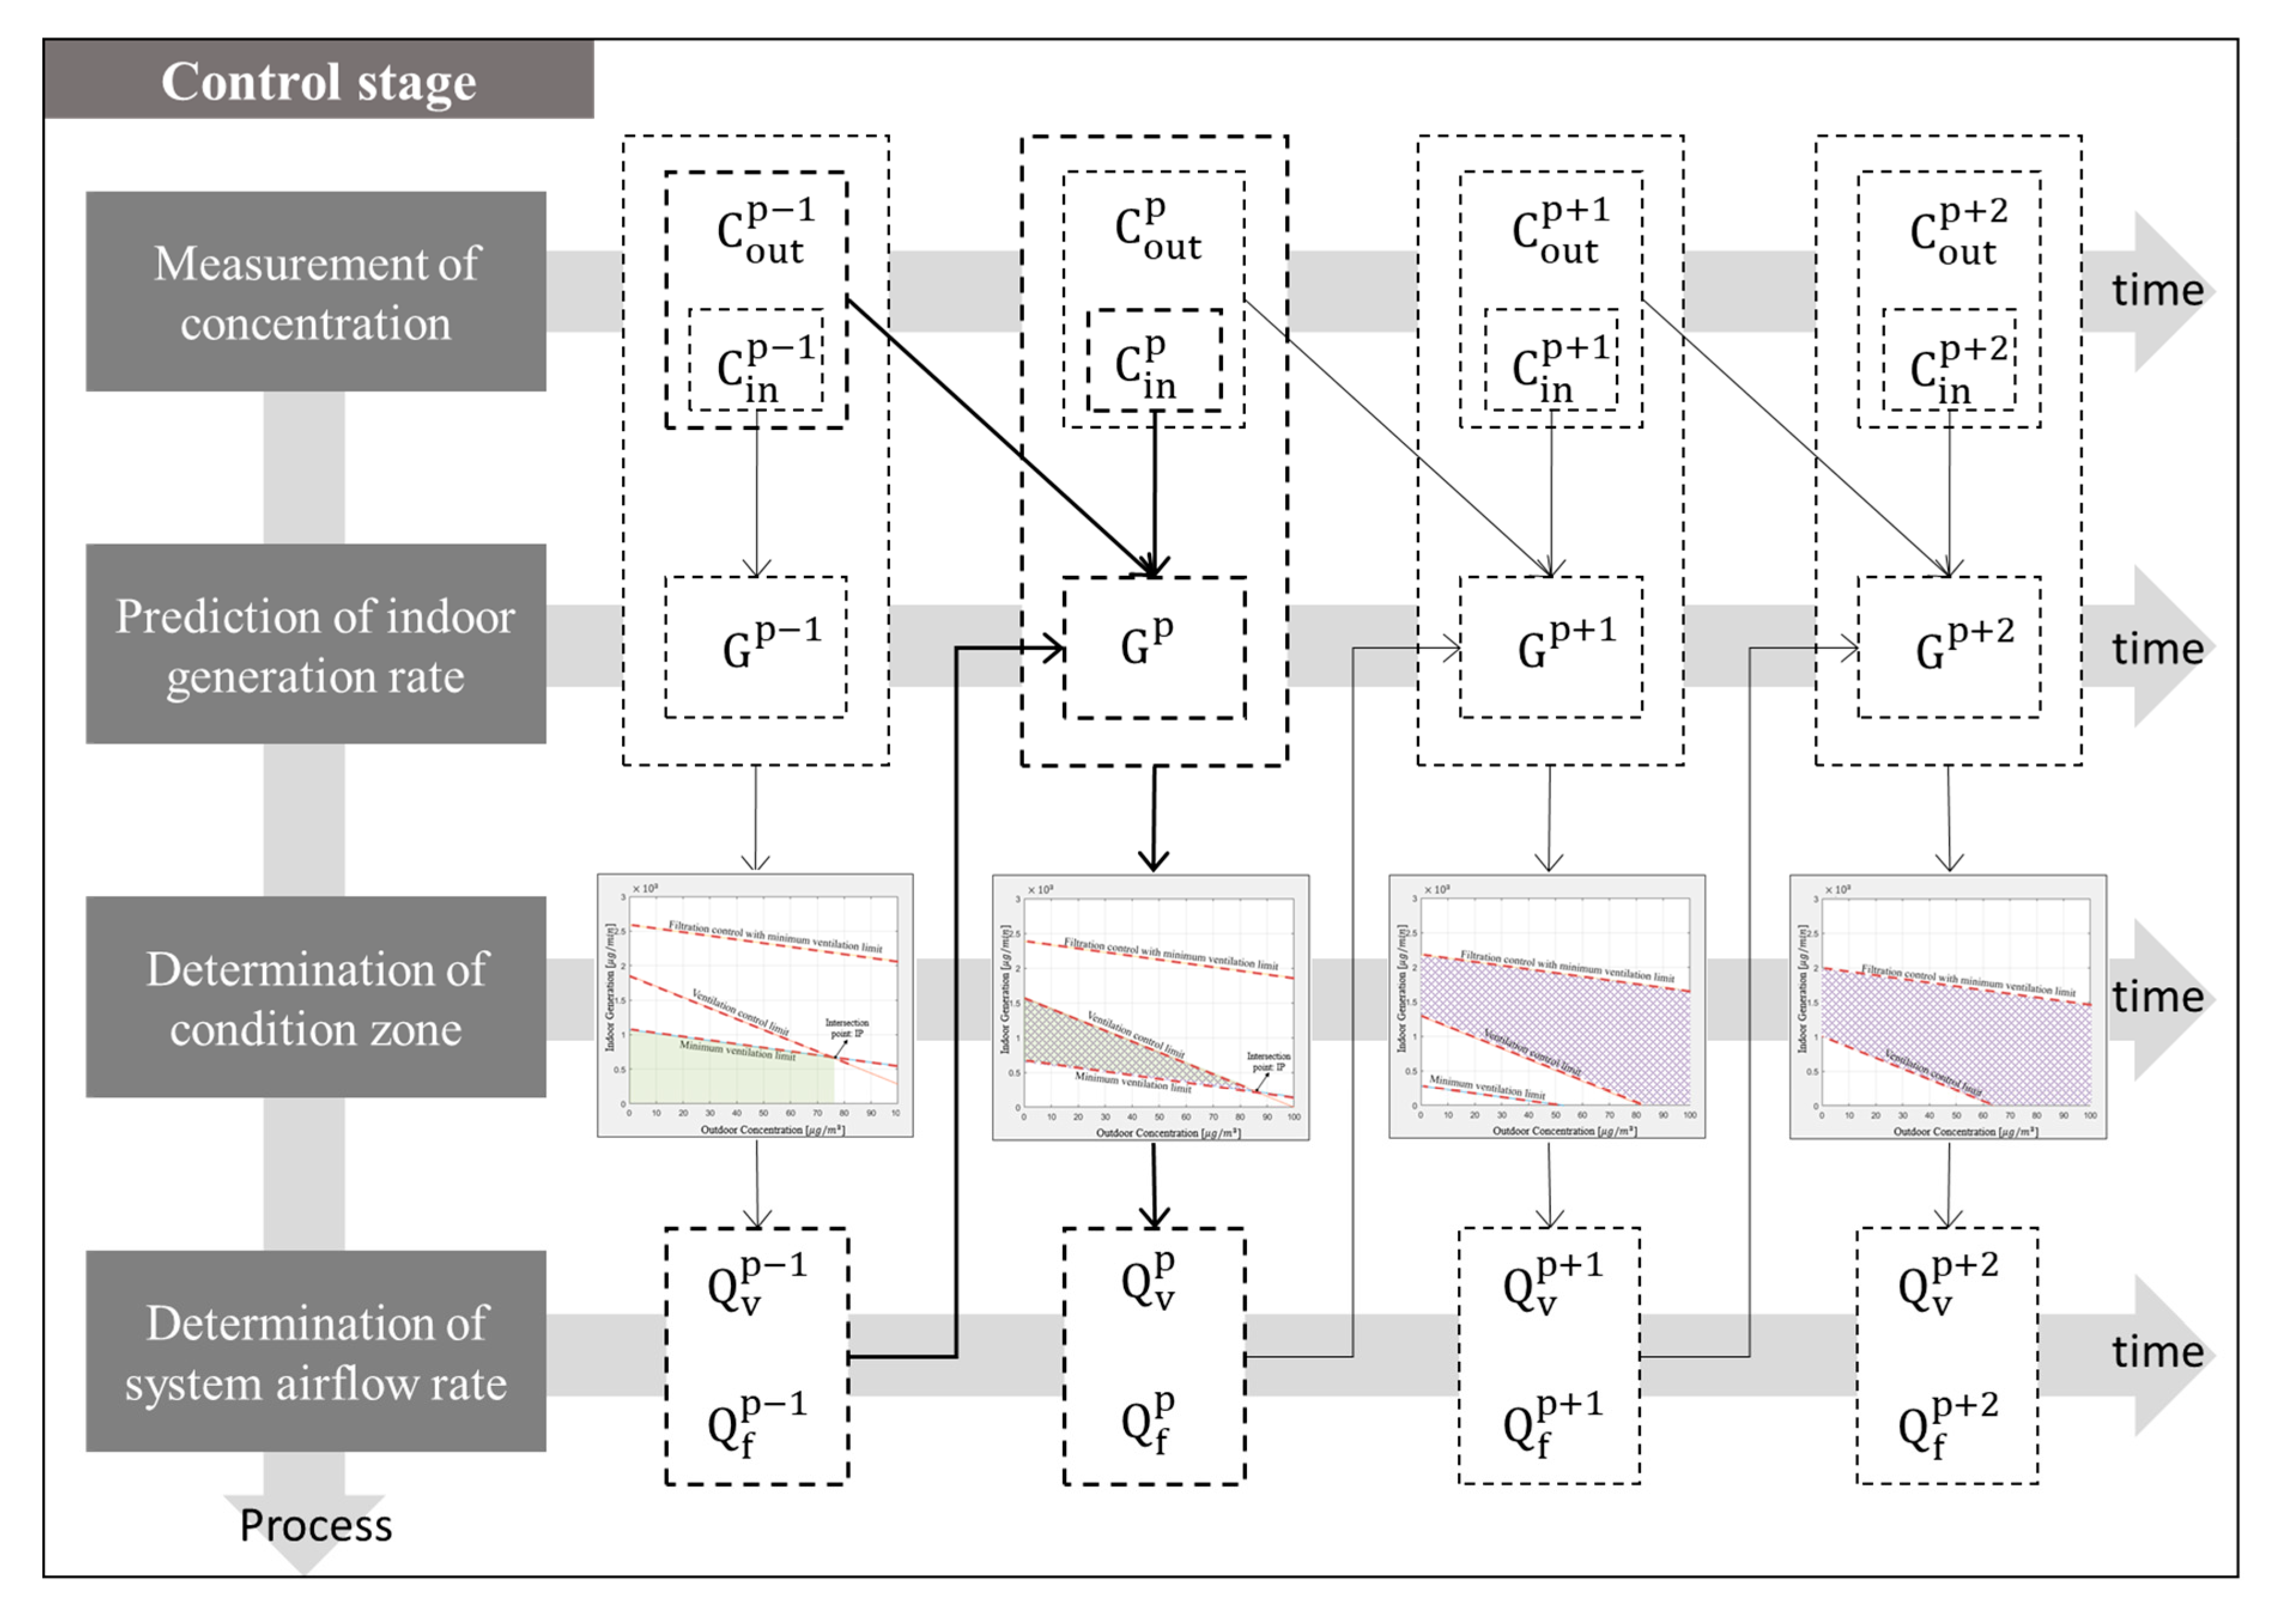
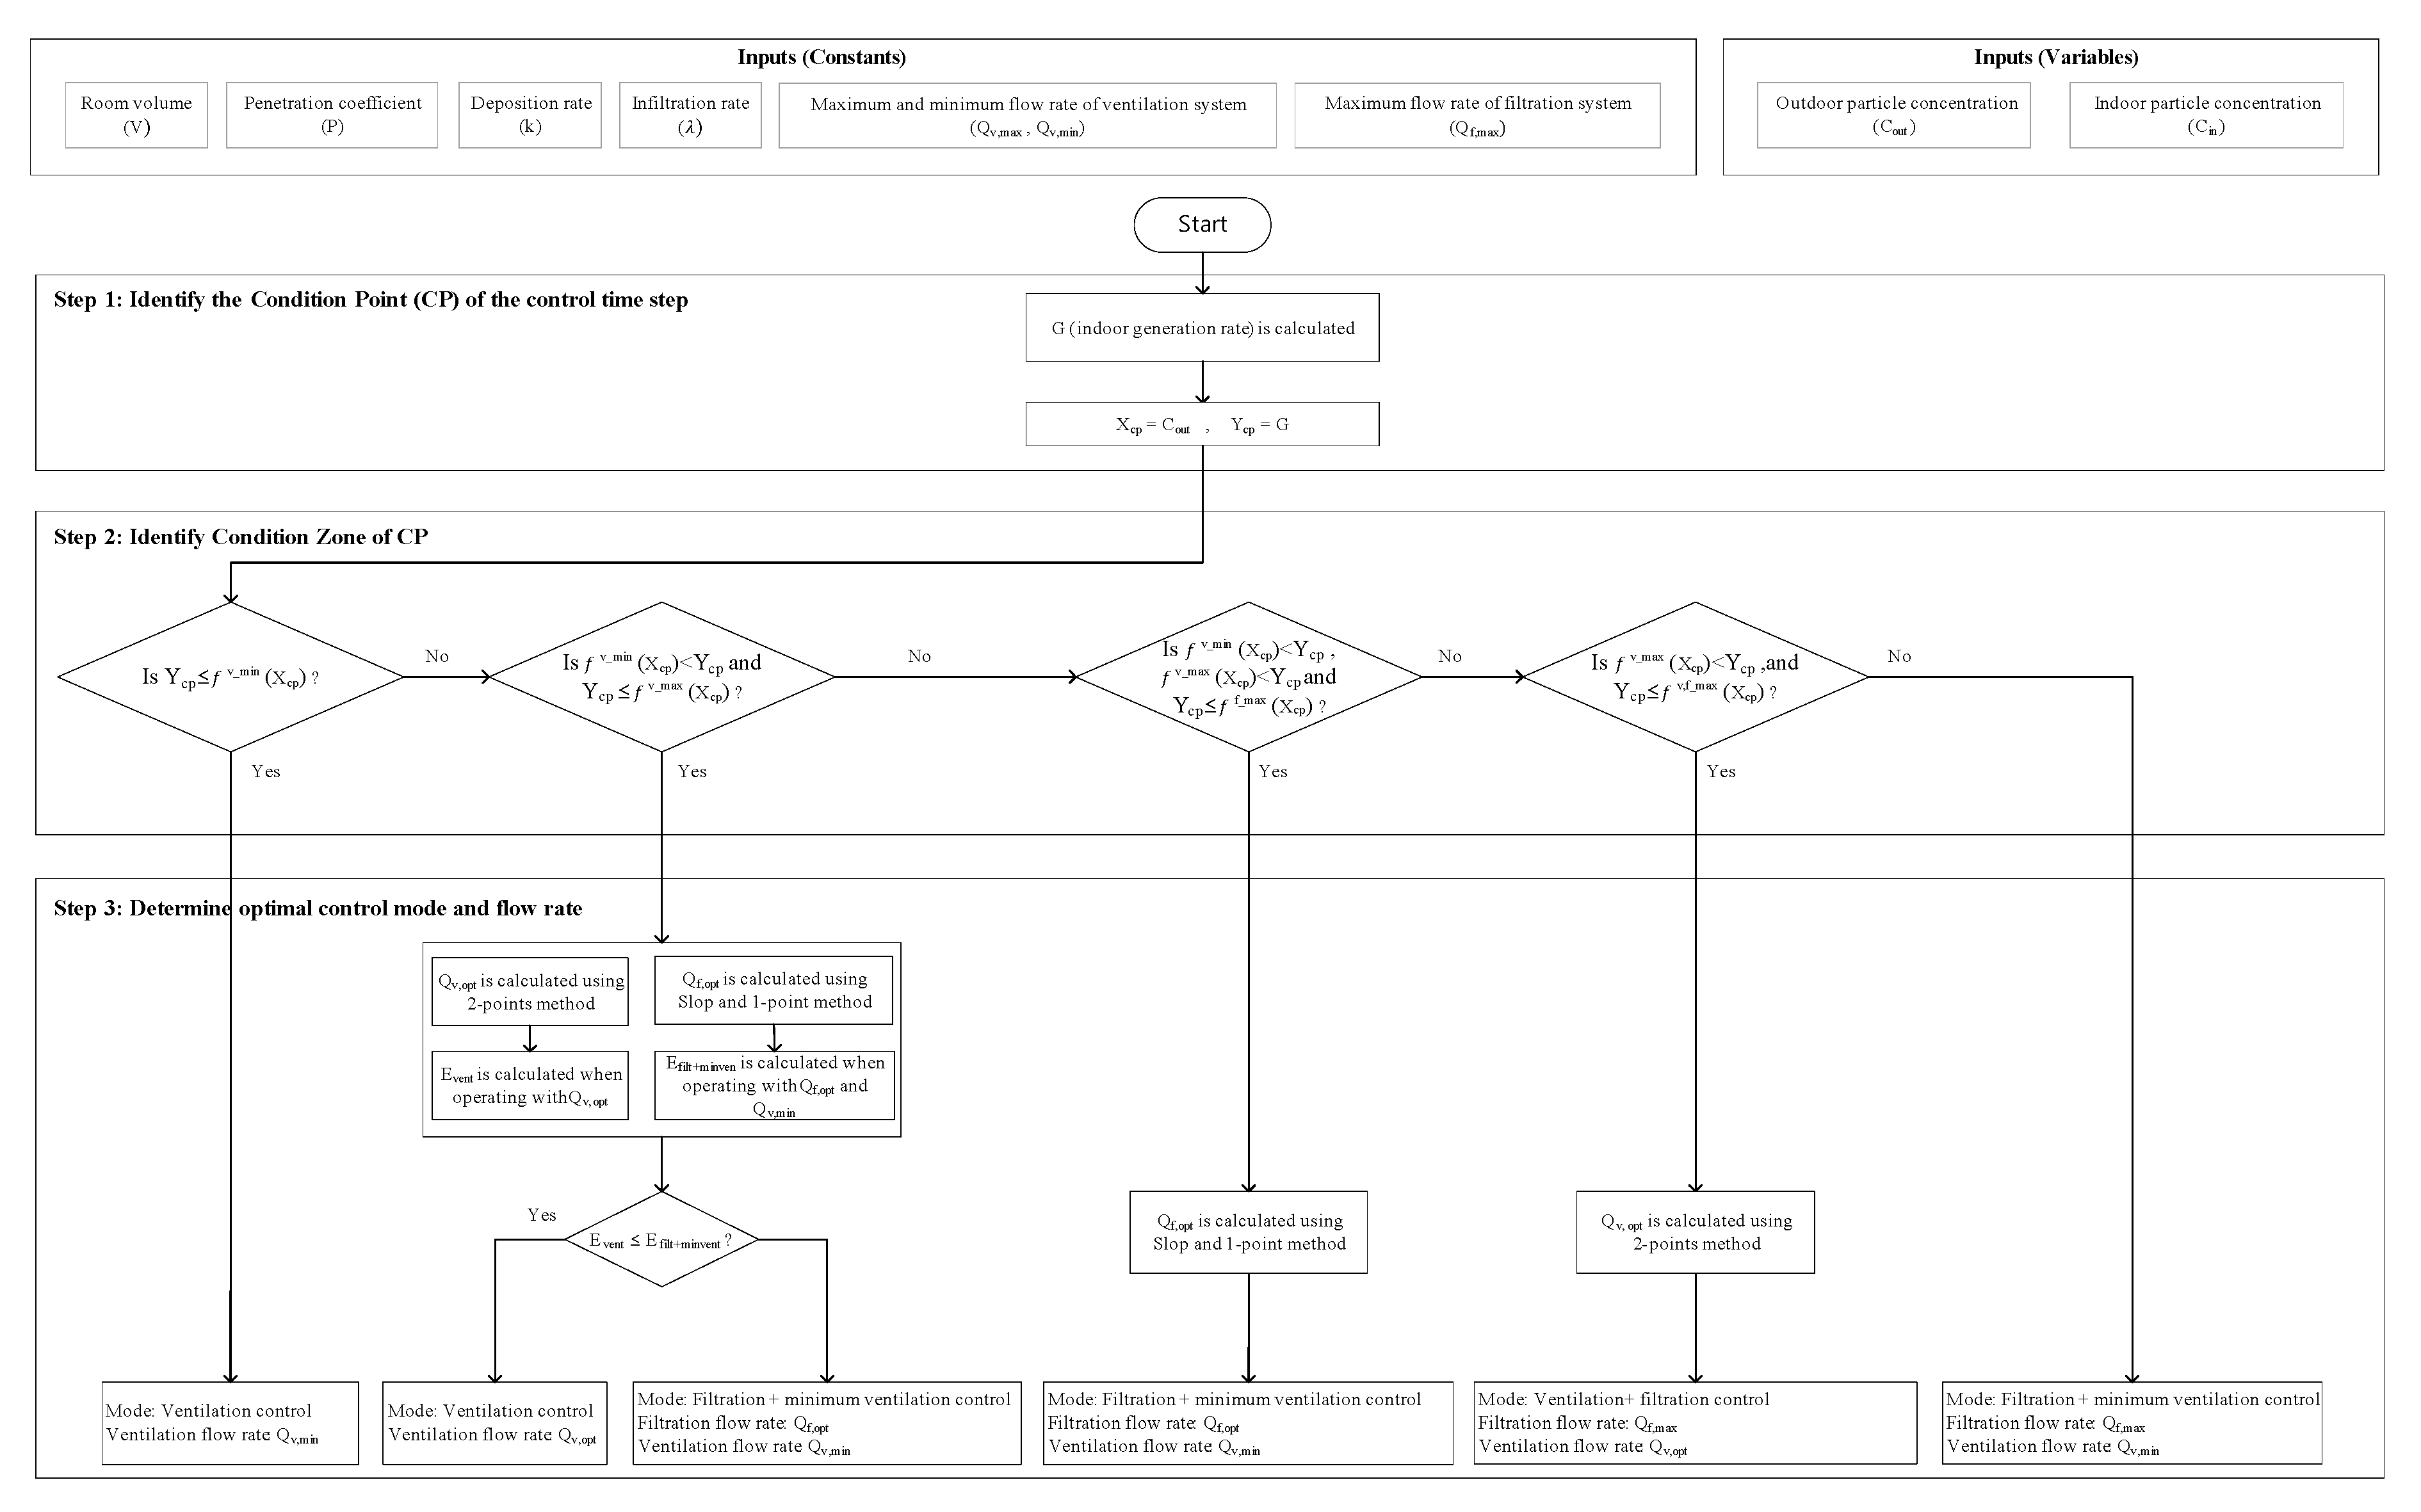
The optimization control process over time and the algorithm of the ventilation and filtration systems described above are summarized in Figure 10 and Figure 11.

3. Performance Evaluation of the Proposed Control Method

3.1. Simulation Model

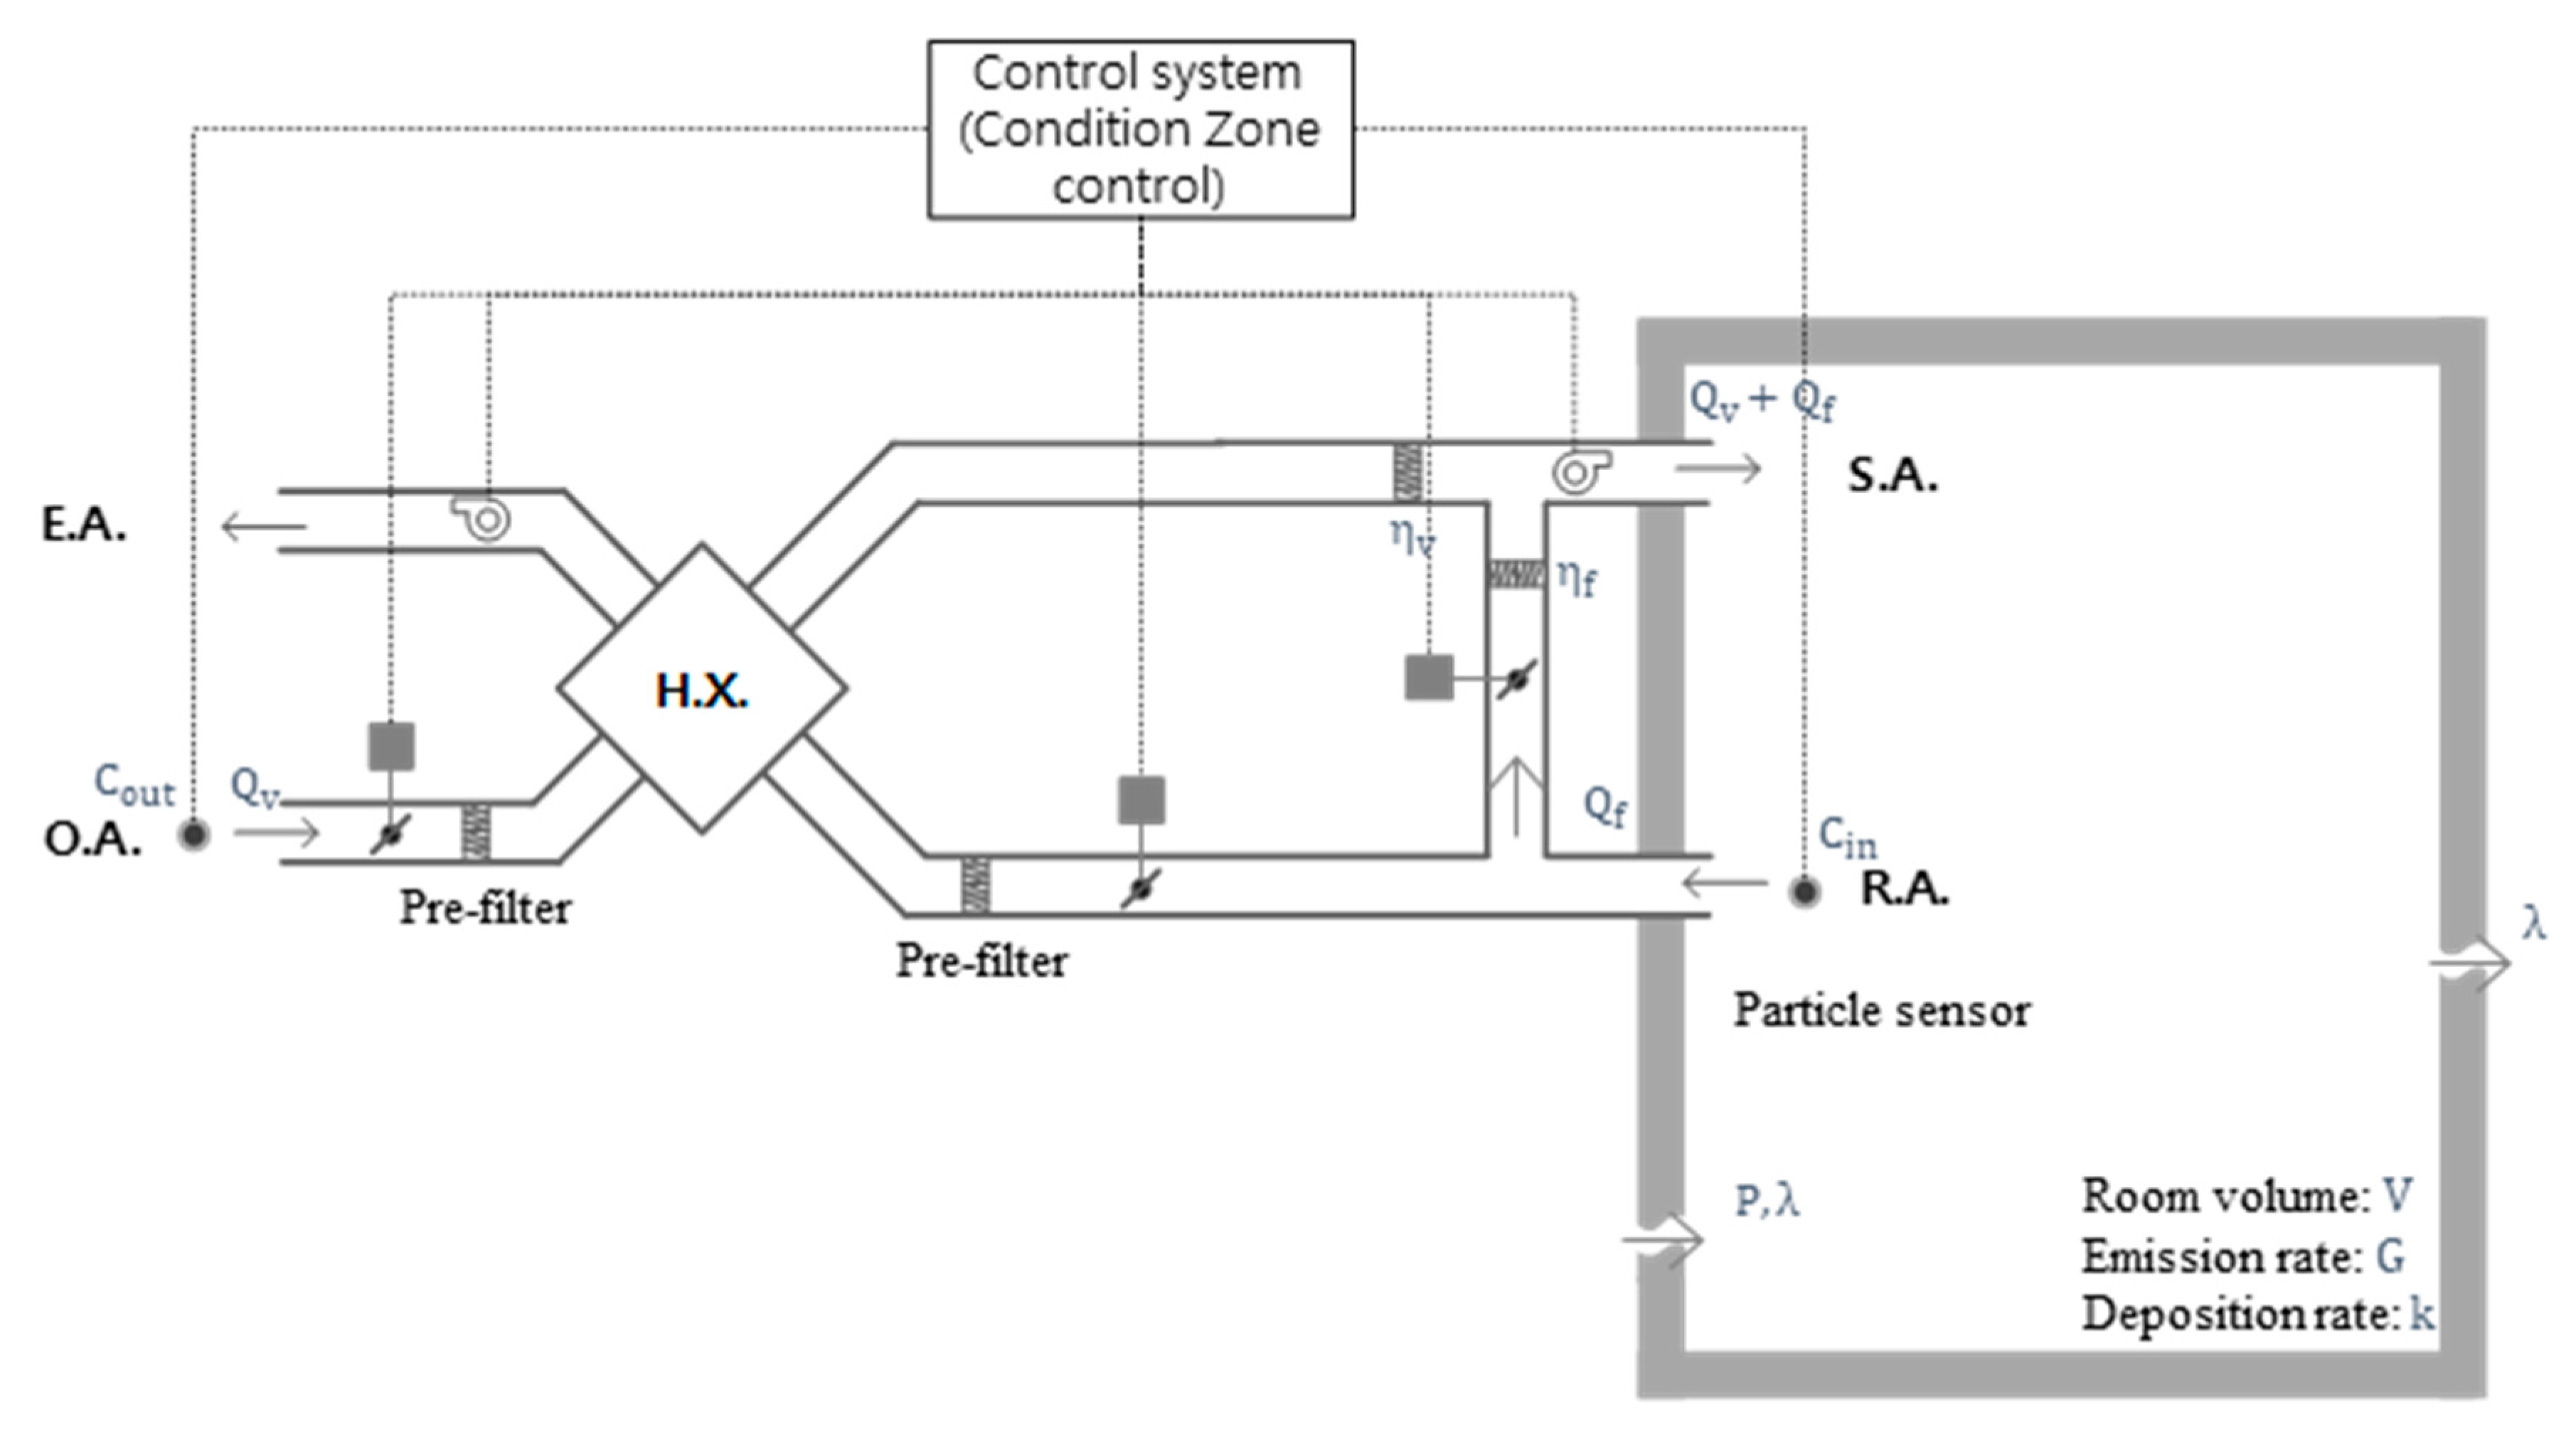
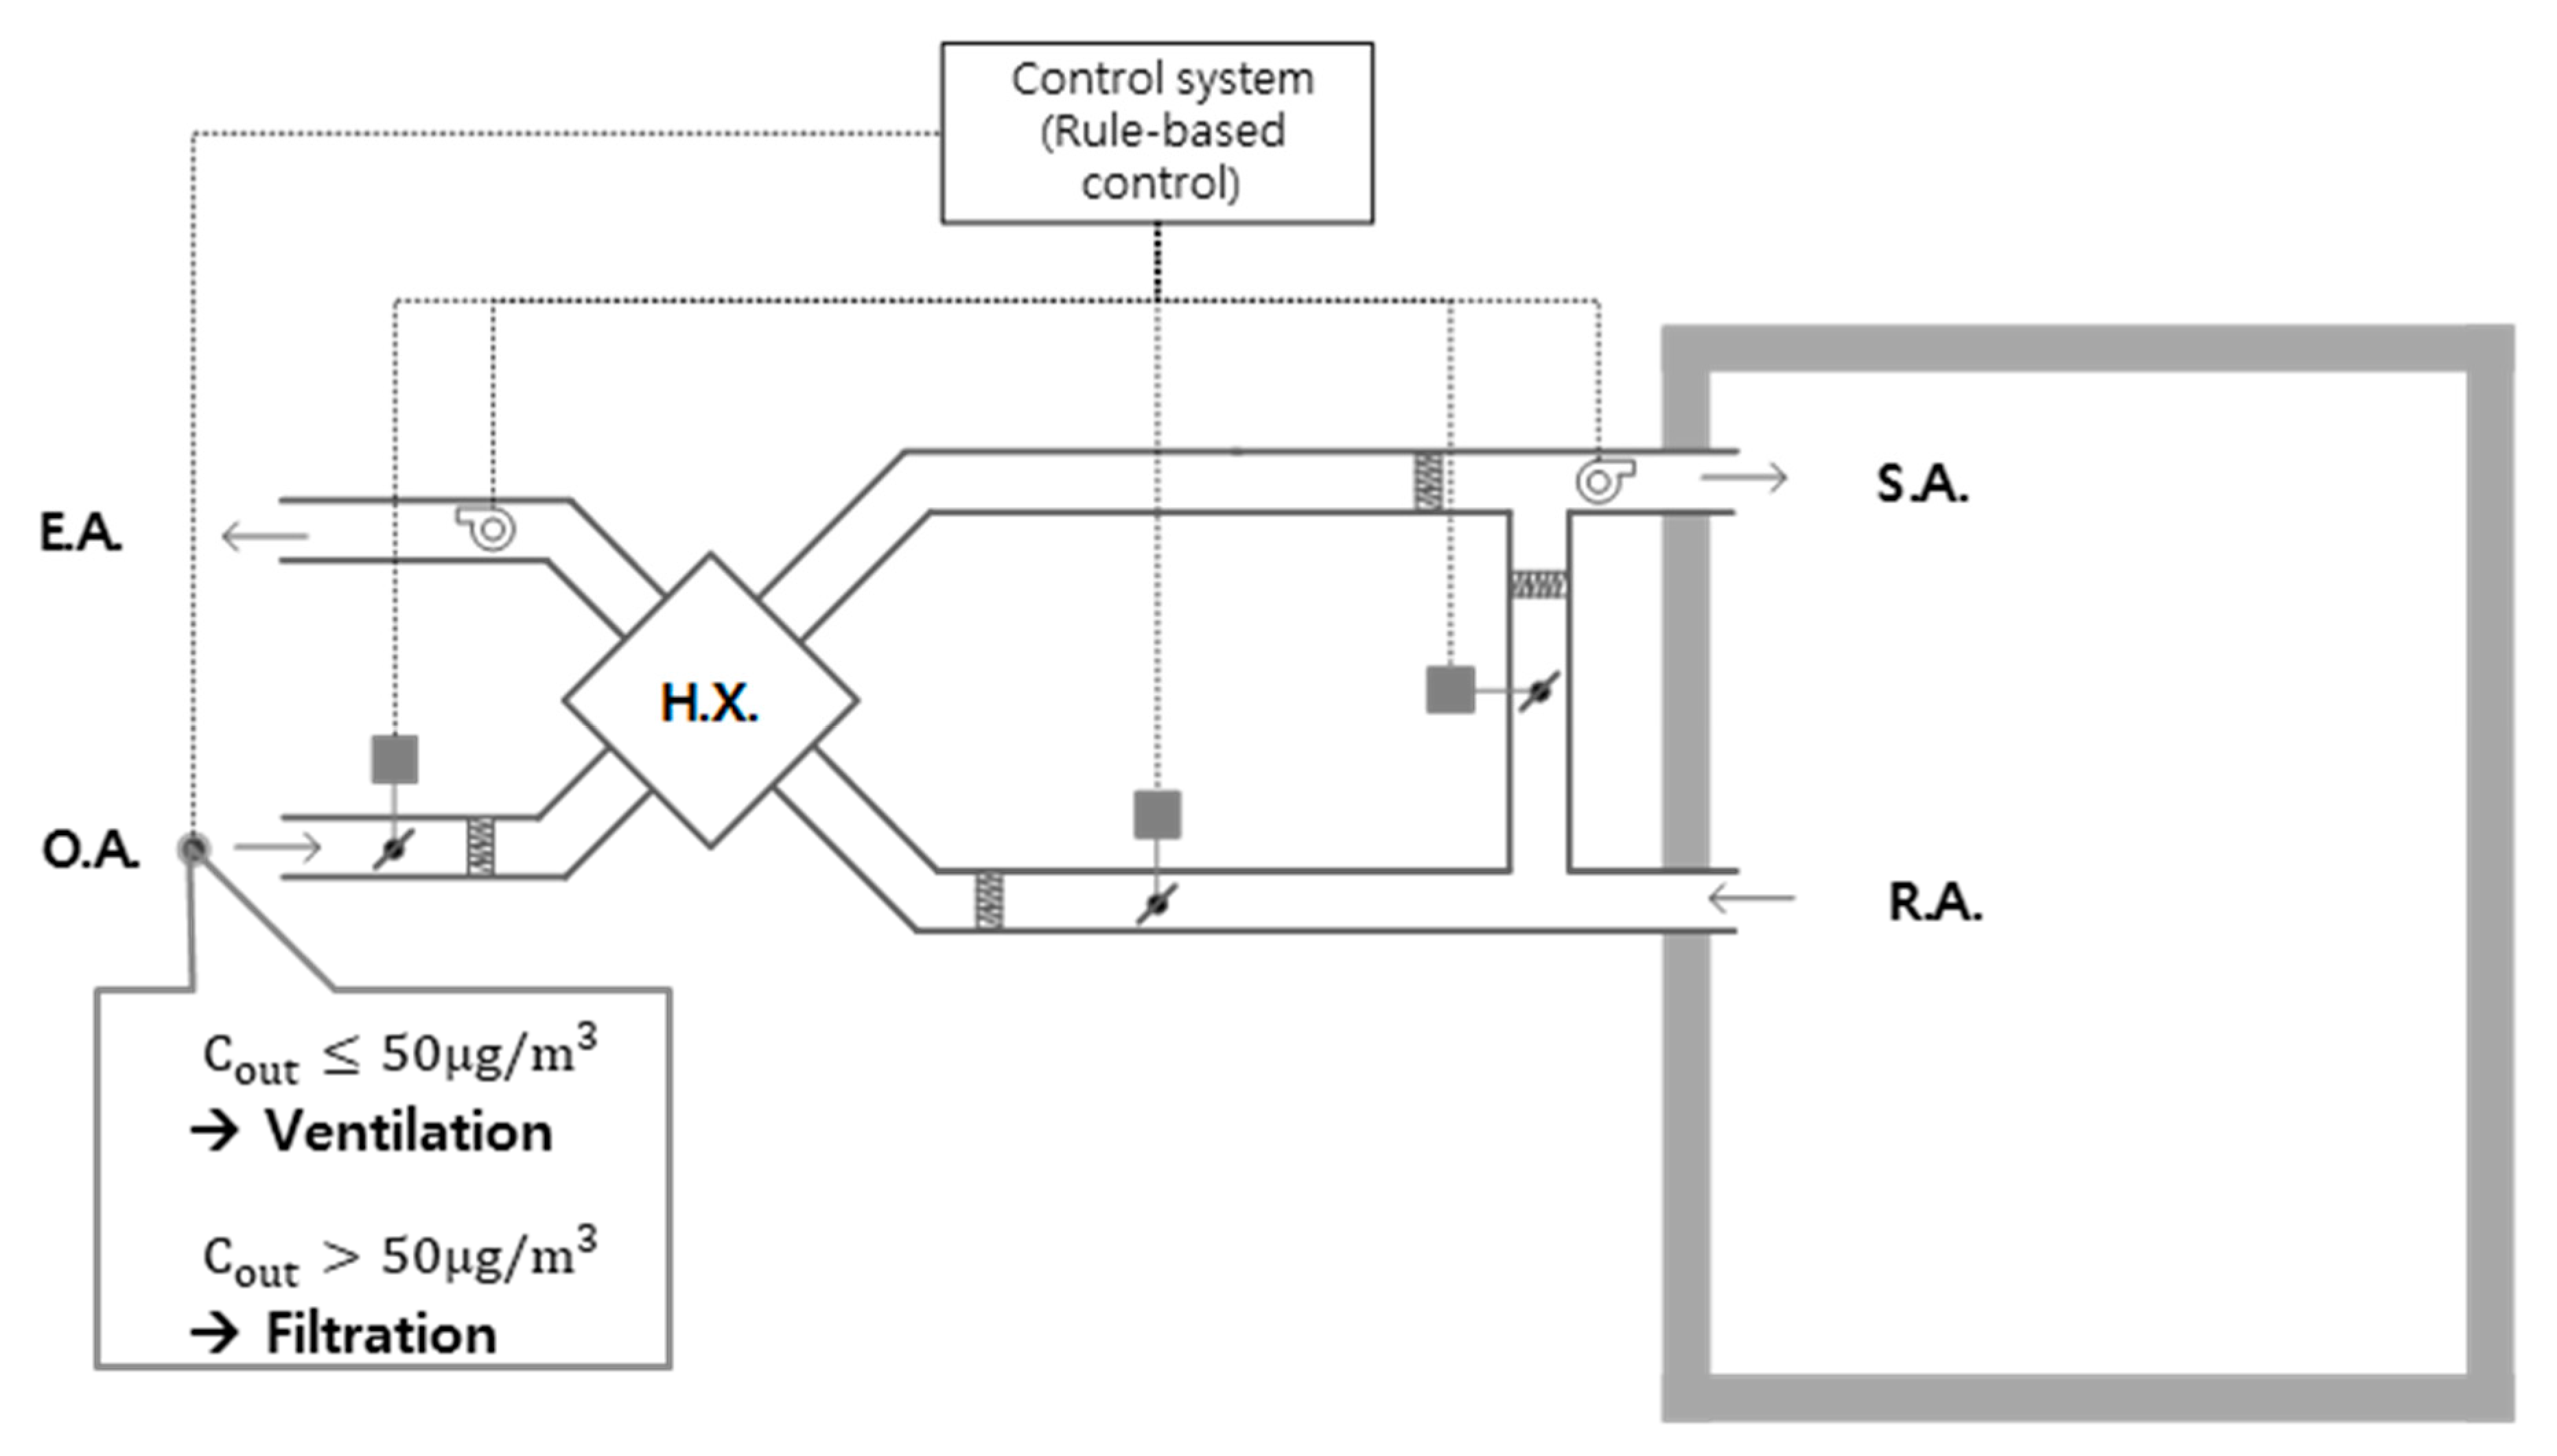
The control performance of the proposed optimization method (condition zone control) and the conventional rule-based method were simulated using the MATLAB program. The condition zone control system measures indoor and outdoor PM2.5 concentrations in real time and adjusts the dampers and fan speed based on the control logic, as schematized in Figure 11 and Figure 12. In comparison, the conventional rule-based method controls the ventilation and filtration system according to the outdoor concentration. In the conventional method shown in Figure 13, the ventilation control was assumed to operate when the outdoor PM2.5 concentration was less than 50 μ g / m 3 , and filtration control was assumed operate when the outdoor PM2.5 concentration was 50 μ g / m 3 or higher. The outdoor concentration of 50 μ g / m 3 is the PM2.5 level where the concentration of air drops below 30 μ g / m 3 (target concentration) after passing through the ventilation filter (efficiency: 0.65).
The space characteristics and system hardware configuration were assumed to be same for the condition zone and conventional control methods. The space parameters used in the simulation are shown in Table 5. A heat recovery ventilation system integrated with the filtration mode was assumed to be installed in the space (Figure 12 and Figure 13). The parameters associated with the ventilation and filtration system are given in Table 6. The system can control the flow rates in three steps, and minimum ventilation flow rate was set at 100 m 3 / h , which is equivalent to air exchange rate of 0.5 h−1 required by the Korean government. The Condition Zone method determines the flow rate based on the optimization method. On the other hand, the conventional rule-based method operates the system at the maximum flow rate (step 3) since there is no algorithm to determine the optimal flow rate.

3.2. Simulation Cases

Simulation cases were organized to evaluate the control performance under various outdoor and indoor PM2.5 conditions. For the outdoor PM2.5 condition, referring to hourly data provided by the Korea Environment Corporation [28], a day of low outdoor PM2.5 concentrations (Case E1) and a day of high concentrations (Case E2) were selected (Figure 14a). The schedule of the indoor PM2.5 generation rate was set, referring to the generation rate of the various activities in the residence [29,30,31,32,33]. The range of the generation rate varies from weak (below 180 μ g / min ) to strong (above 1000 μ g / min ) values for a day, as shown in Figure 14b. Simulation cases according to the outdoor conditions and control methods are listed in Table 7, and the schedule of the indoor PM2.5 generation rate was assumed to be same for all simulation cases.

3.3. Results

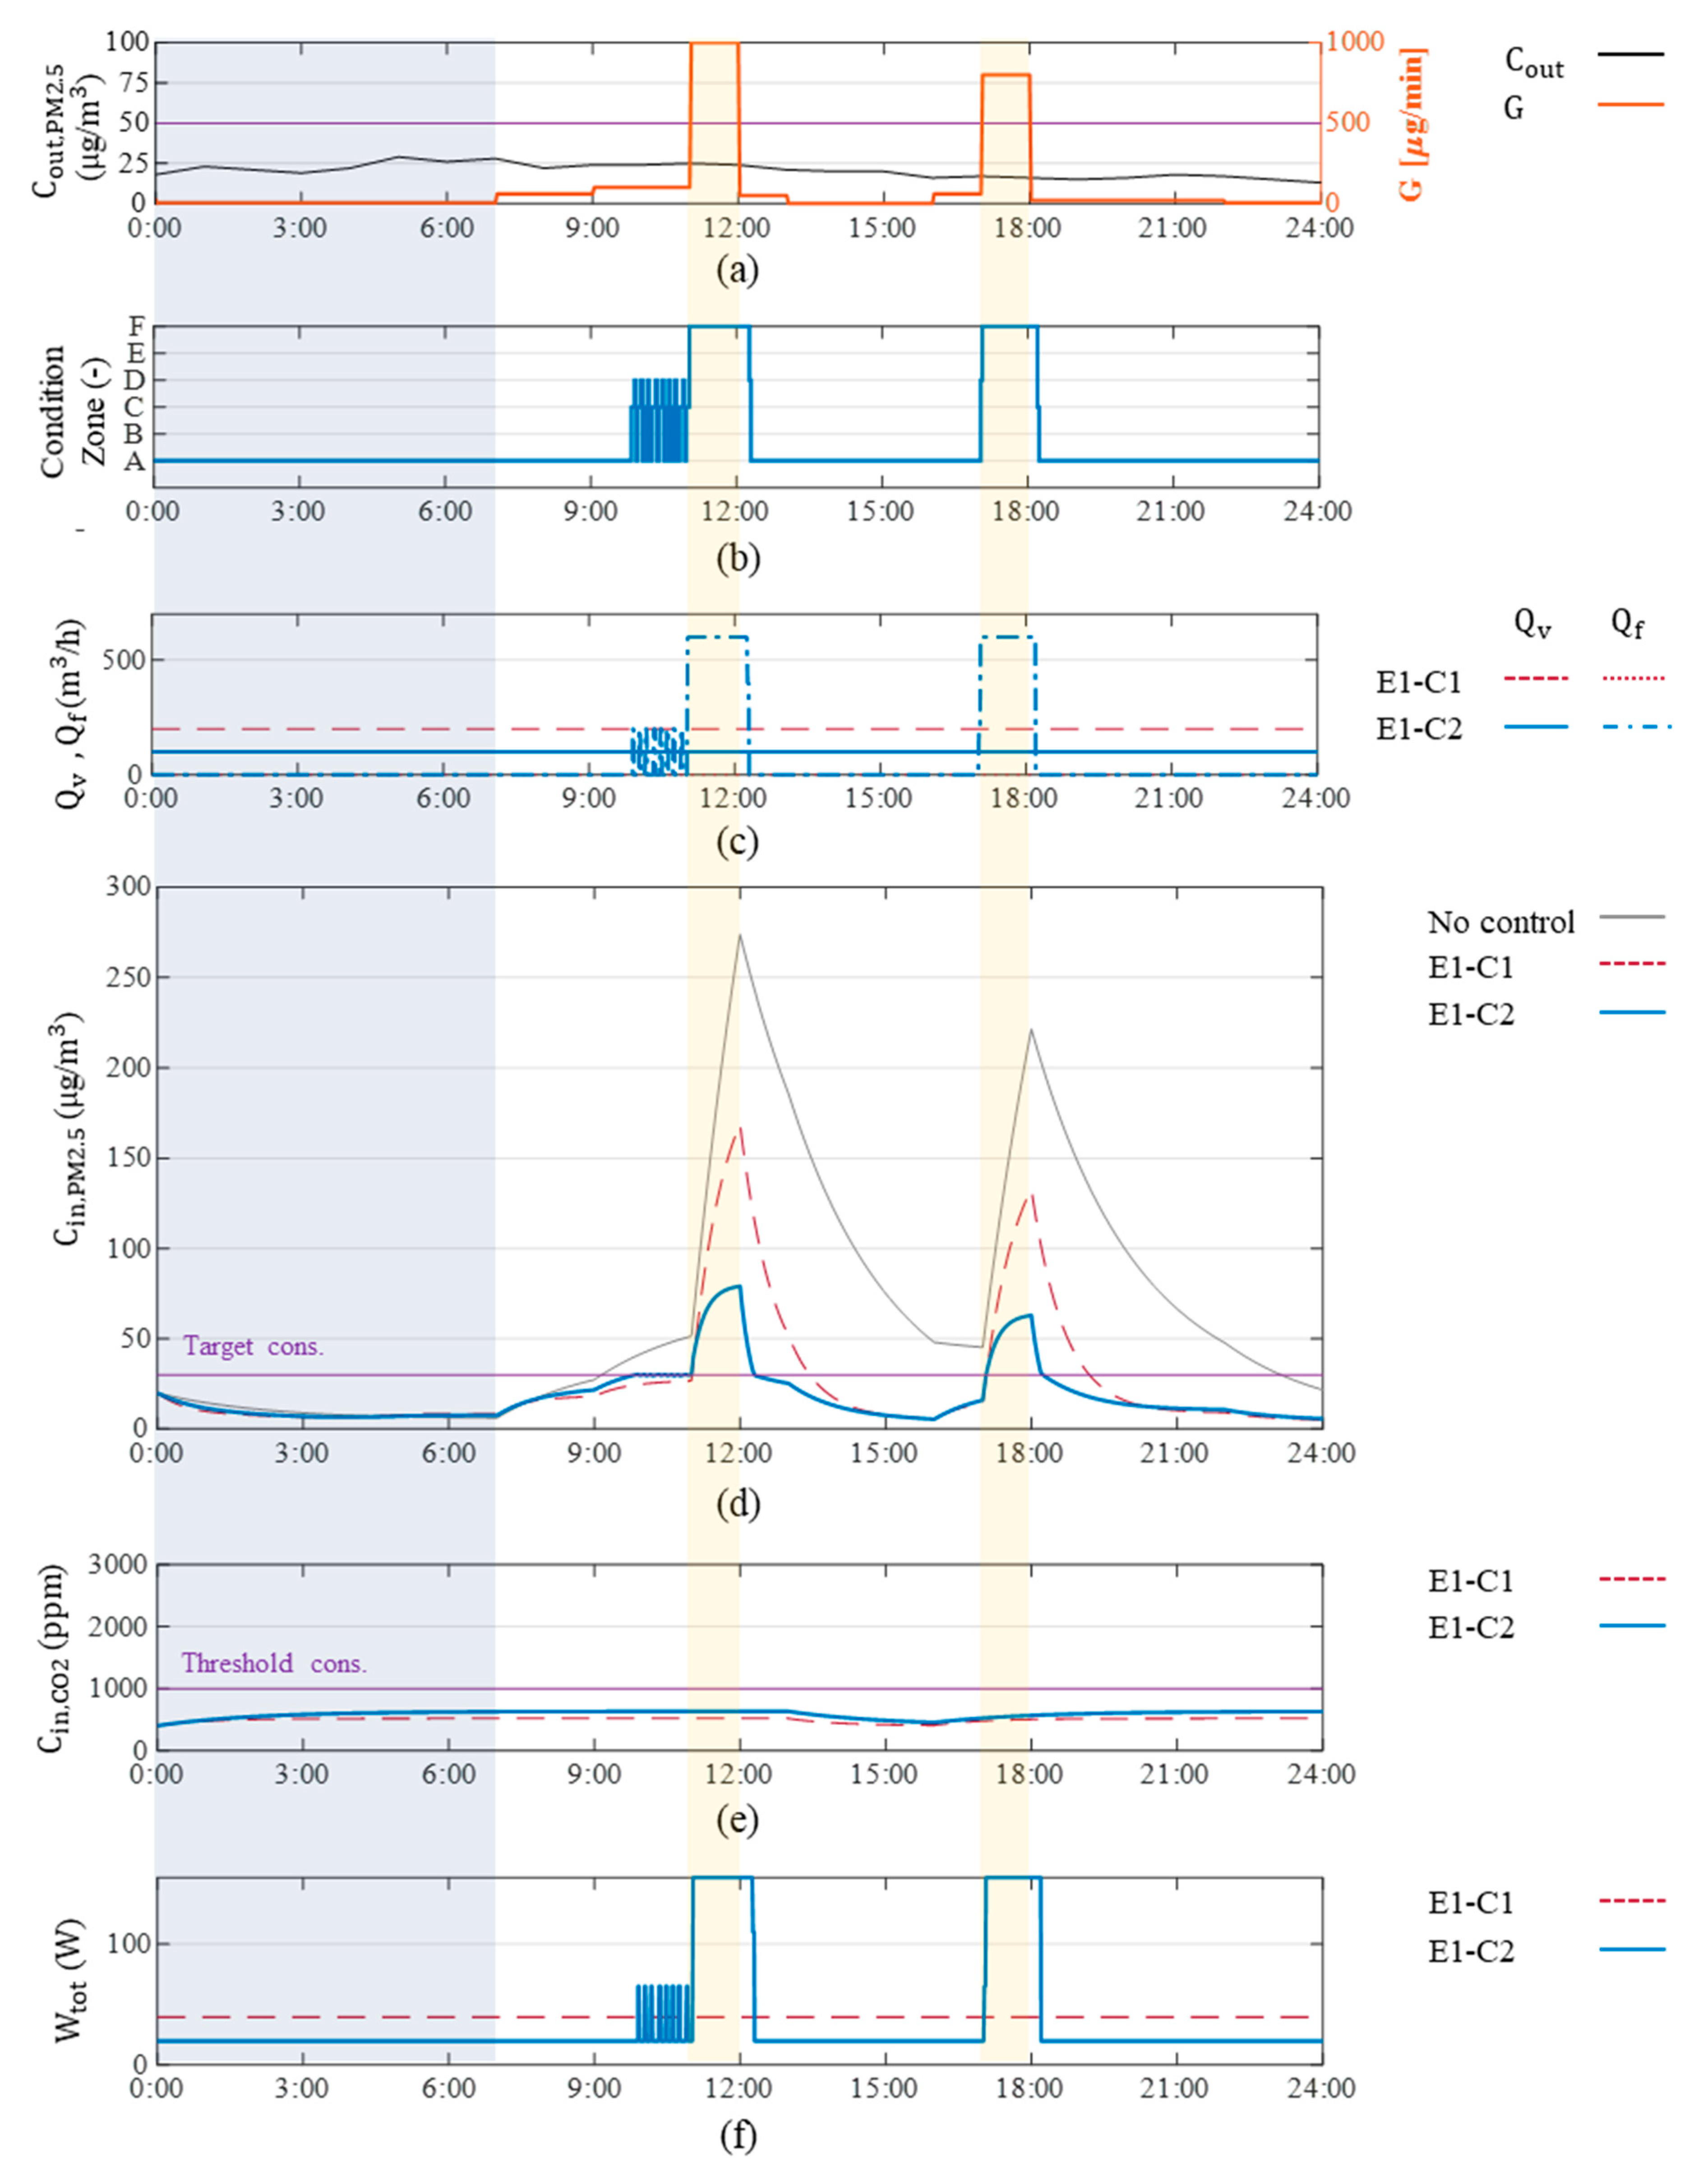
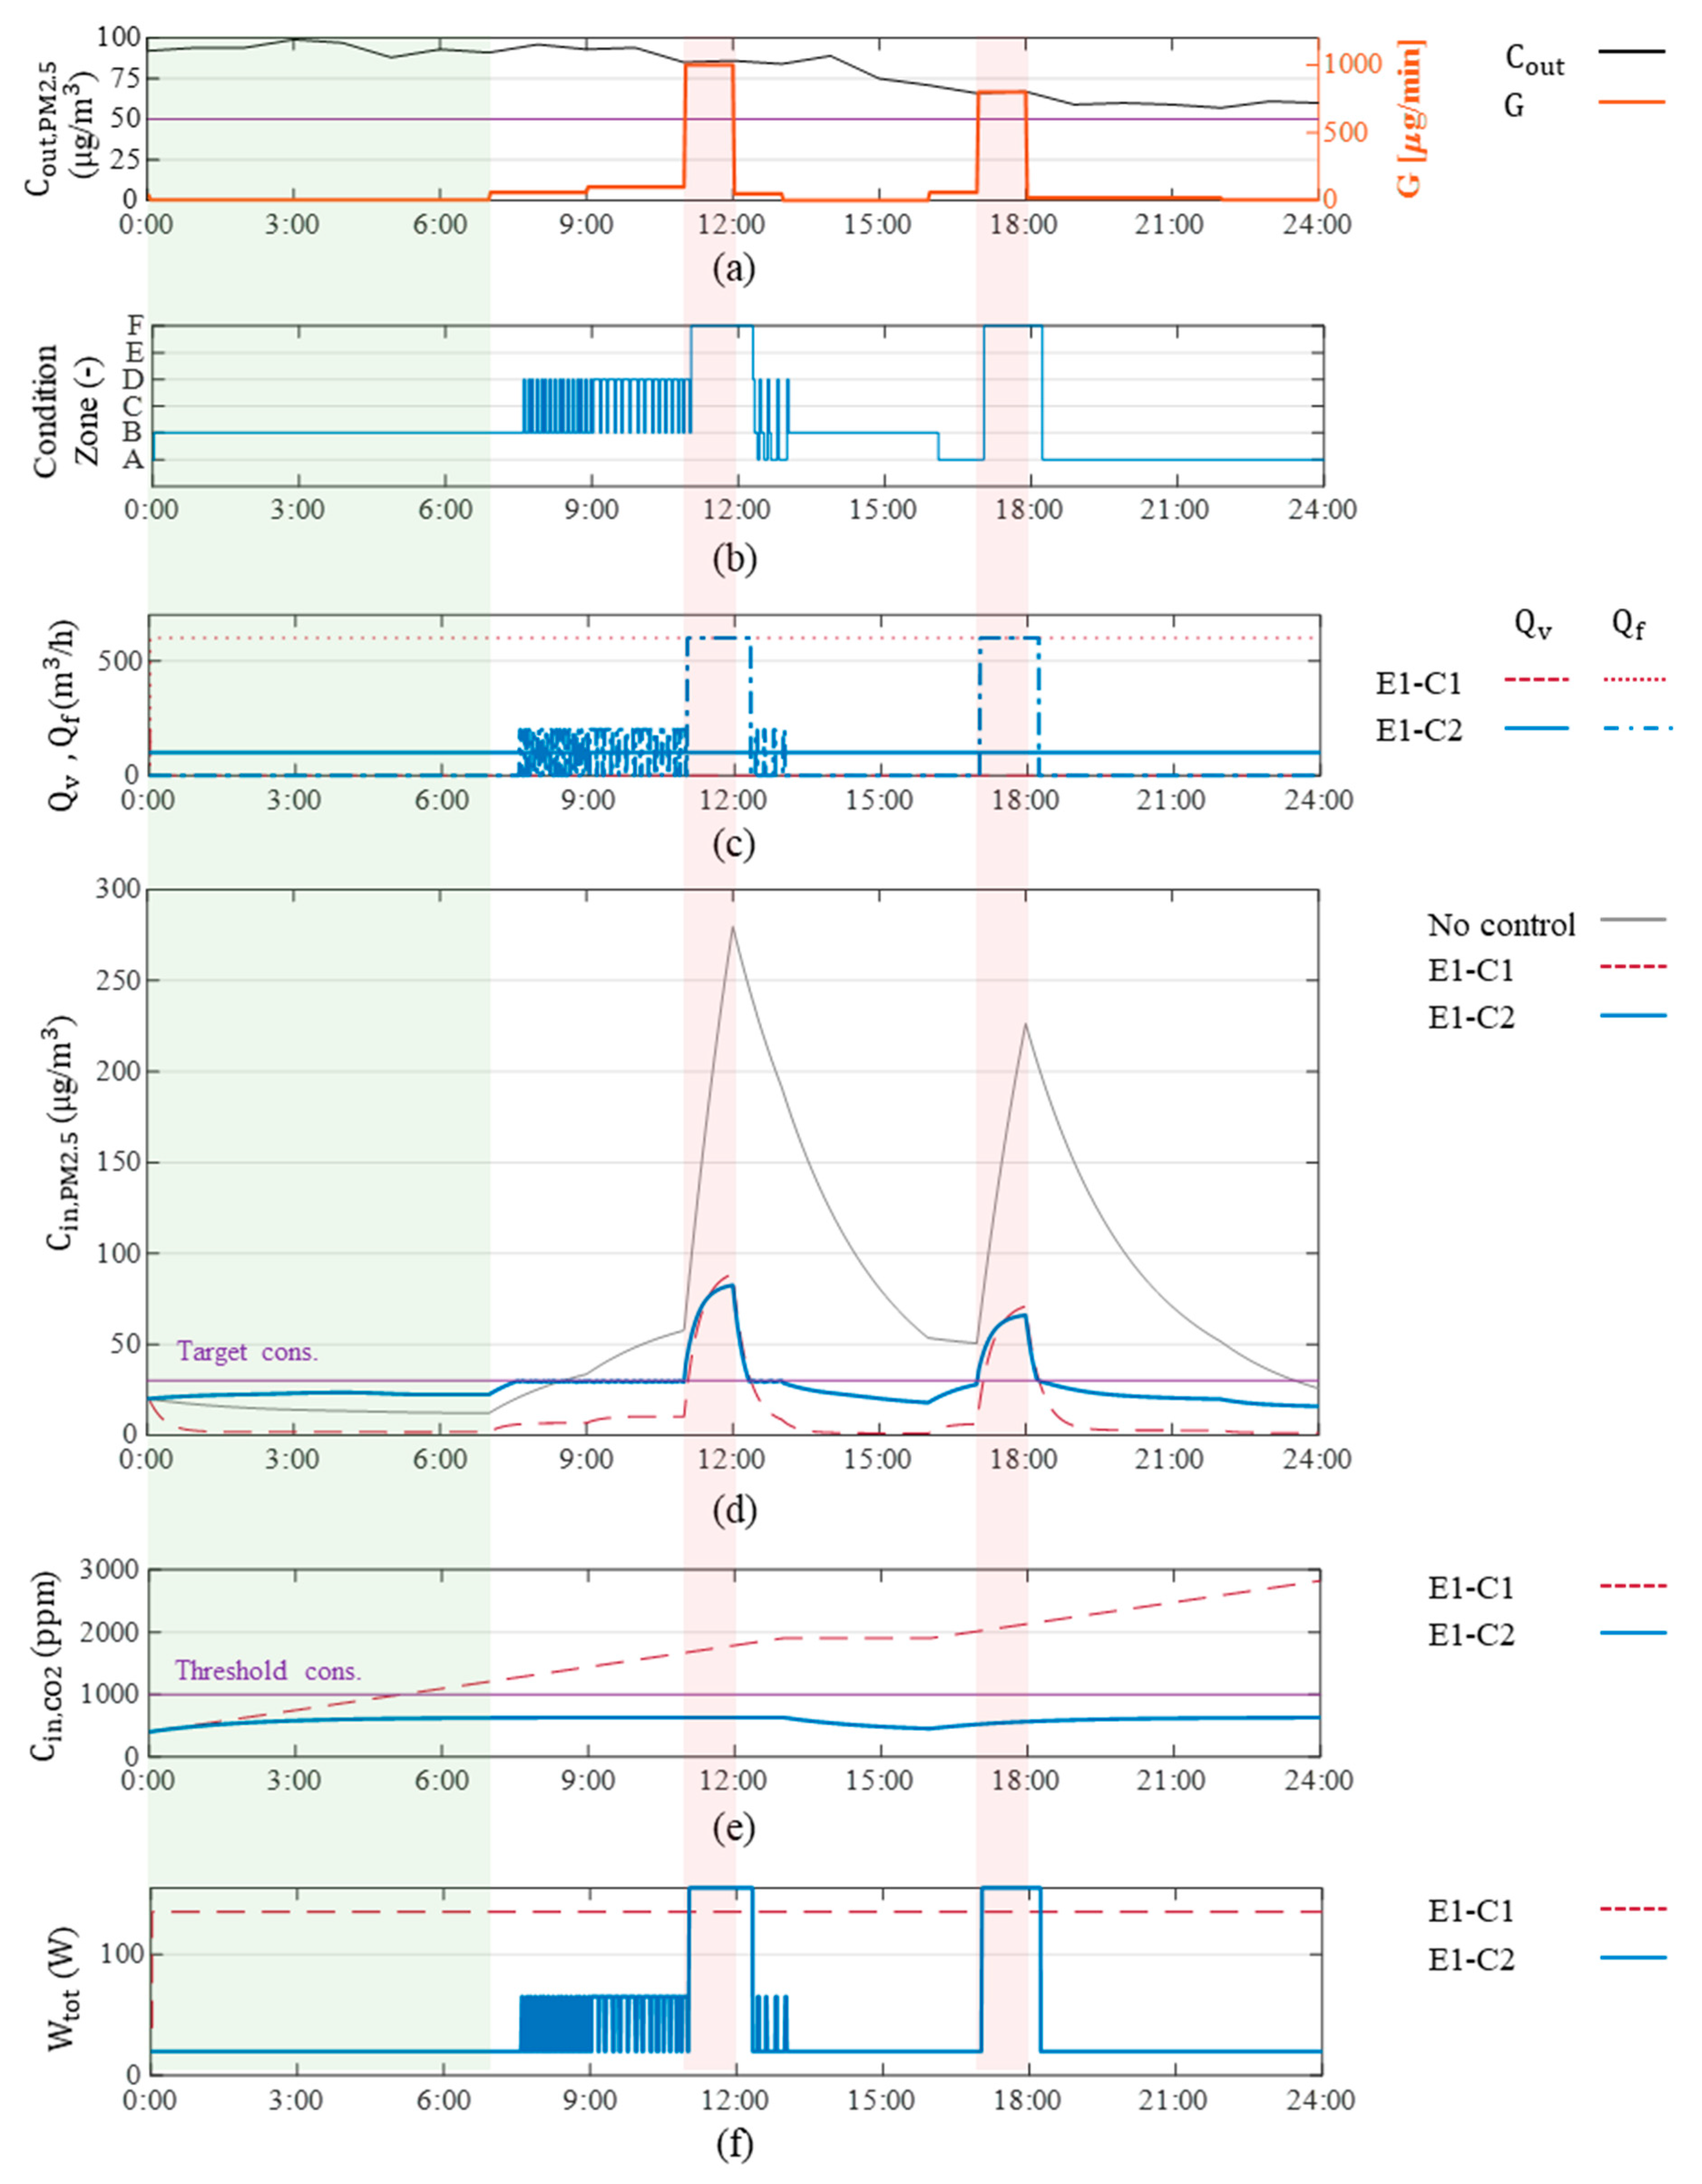
Figure 15 and Figure 16 show the results of comparing the control performance of the condition zone control method (E1-C2 or E2-C2) with the conventional rule-based control method (E1-C1 or E2-C1) according to indoor and outdoor PM2.5 conditions. In particular, the results of the low outdoor PM2.5 concentration and low indoor PM2.5 generation rate are presented in the blue section of Figure 15. The results of the low outdoor PM2.5 concentration and high indoor PM2.5 generation rate are shown in the yellow sections of Figure 15. The green section of Figure 16 indicates the results of high outdoor PM2.5 concentration and low indoor PM2.5 generation rate, and the red sections are the results of conditions in which outdoor PM2.5 concentration and indoor PM2.5 generation are both high. To analyze IAQ control performance, CO2 concentration was used as the surrogate indicator of indoor air quality.
Figure 15b shows the condition zone result according to the indoor and outdoor PM2.5 conditions shown in Figure 15a. It was found that activities with a weak indoor generation rate such as sleeping, sitting, and walking corresponded to Zone A, and those with a normal generation rate such as vacuuming corresponded to Zone C and D, whereas those with a high generation rate such as cooking corresponded to Zone E. According to the results of the condition zone, optimal control mode and system flow rates were calculated and shown in case E1-C2 of Figure 15c. For the conventional control case, the outdoor PM2.5 concentrations were less than 50 μ g / m 3 all day, so the ventilation control was applied for 24 h (case E1-C1 of Figure 15c). Figure 15d–f shows the control performance of the condition zone method (E1-C2) and the conventional method (E1-C1). In the blue section, indoor PM2.5 (Figure 15d) and CO2 level (Figure 15e) met the target (or threshold) concentration in both control methods. During this period, fan power consumption was reduced by 50% when the condition zone control was applied (Figure 15f). In the yellow sections, the indoor PM2.5 concentration exceeded the target concentration in both cases, but the condition zone control reduced the indoor PM2.5 concentration by 45%. The condition zone control carried out filtration control at the maximum flow rate, which increased fan energy consumption (yellow sections of Figure 15f). The results of indoor CO2 concentration were below the threshold in both cases.
Figure 16b shows the condition zones over time according to the indoor and outdoor PM conditions shown in Figure 16a. Depending on the condition zone, the optimal control mode and system flow rates were determined, as shown in case E2-C2 of Figure 16c. For the conventional control case, the outdoor PM2.5 concentrations were higher than 50 μ g / m 3 all day, so filtration was performed with a maximum flow rate for 24 h and ventilation was not allowed (case E1-C1 of Figure 16c). Figure 16d–f show the results of indoor PM2.5 concentration, CO2 concentration, and fan power consumption of each control case when the outdoor PM condition was high (E2 case). In the green section, the indoor PM2.5 concentrations were below the indoor target concentration in both cases. Indoor PM2.5 concentrations were lower, but the fan power consumptions were 6.8 times higher for the conventional control method than in the condition zone control case. This is because filtration was performed at the maximum flow rate in the E2-C1 whereas ventilation was performed at the minimum flow rate in case E2-C2. The condition zone control applied the minimum ventilation control even if the outdoor PM2.5 concentration was high, and the additional filtration control was applied if indoor PM2.5 exceeded the target concentration (8:00~13:00 and 17:10~18:10). In the red section, although the filtration control was carried out at the maximum flow rate, the indoor PM2.5 concentration exceeded the target concentration in both cases. The peak indoor PM2.5 concentration of case E2-C2 was lower than that of case E2-C1. This implies that even if the outdoor PM2.5 level is high, ventilation could benefit from reducing indoor PM2.5 concentration during the period of strong indoor generation. The condition zone control case achieved indoor CO2 concentrations below the threshold concentration all day; however, the conventional control case showed a constant increase in indoor CO2 over time, indicating the risk of poor IAQ. The use of fan energy in the ventilation and filtration system according to the control method is shown in Table 8. The energy use in the condition zone control case was reduced by 14.5% compared to the rule-based control results under E1 condition and 71.8% less than rule-based control under E2 condition.

4. Conclusions

A model-based control strategy for a ventilation and filtration system was developed to maintain indoor PM2.5 concentration below the target concentration, taking into account overall IAQ and fan energy consumption. For this purpose, the condition zone control method using the control limit (CL) curve was proposed to determine optimal ventilation and filtration operation modes and set-point flow rate depending on the outdoor PM2.5 concentration and the indoor PM2.5 generation rate. The conventional rule-based control has risk of high indoor PM2.5 under low outdoor concentration and a high indoor generation rate. On the other hand, condition zone control can reduce the indoor PM2.5 concentration by approximately 45%. Condition zone control can save about 15% of electricity usage during a day of low outdoor PM2.5 concentration compared to the rule-based control strategy. Benefits applying condition zone control are maximized during a day of high outdoor PM2.5 concentration. Condition zone control can keep indoor PM2.5 below or as close to the desired target concentration as possible, maintain indoor CO2 below the thresholds, and save about 70% of power consumption compared with the rule-based control. Although the heat recovery ventilation system is targeted, it is the limitation of this study that the thermal comfort or heating and cooling energy effects caused by ventilation are not considered. Developing a control strategy for ventilation and filtration systems to keep indoor PM2.5 and IAQ within acceptable ranges while maximizing thermal comfort during the intermediate season and minimizing overall energy consumption during the heating and cooling season would be of use for future study.

Author Contributions

Conceptualization, J.-H.K. and M.-S.Y.; data curation, J.-H.K.; formal analysis, J.-H.K.; methodology, J.-H.K. and M.-S.Y.; project administration, J.-H.K. and M.-S.Y.; supervision, M.-S.Y.; experiments, J.-H.K.; simulations, J.-H.K. and H.-G.K.; validation, J.-H.K.; visualization, J.-H.K. and H.-G.K.; writing—original draft, J.-H.K.; writing—review and editing, J.-H.K. and M.-S.Y. All authors have read and agreed to the published version of the manuscript.

Funding

This research was supported by Basic Science Research Program through the National Research Foundation of Korea (NRF) funded by the Ministry of Education (NRF-2018R1D1A1A09083184).

Conflicts of Interest

The authors declare no conflict of interest.

Abbreviations

C in Indoor particle concentration ( μ g / m 3 )
C out Outdoor particle concentration ( μ g / m 3 )
C in , target Target indoor particle concentration (30   μ g / m 3 in this study) ( μ g / m 3 )
C in , CO 2 Indoor CO2 concentration ( ppm )
λ Infiltration/Exfiltration rate ( h 1 )
P Penetration coefficient (-)
k Deposition rate ( h 1 )
η v Particle removal efficiency of the ventilation system (-)
η f Particle removal efficiency of the filtration system (-)
Q v Ventilation airflow rate ( m 3 / h )
Q f Filtration airflow rate ( m 3 / h )
G Indoor generation rate ( μ g / h )
V Room volume ( m 3 )
Q v , min Minimum ventilation flow rate ( m 3 / h )
Q v , opt Optimum ventilation flow rate ( m 3 / h )
Q v , max Maximum ventilation flow rate ( m 3 / h )
Q f , opt Optimum filtration flow rate ( m 3 / h )
Q f , max Maximum filtration flow rate ( m 3 / h )
Y CP Y value of CP point, Indoor generation rate ( μ g / h )
X CP X value of CP point, Outdoor particle concentration ( μ g / m 3 )
Y IP Y value of IP point, Indoor generation rate ( μ g / h )
X IP X value of IP point, Outdoor particle concentration ( μ g / m 3 )
t Time (h)
W v , opt Fan power of ventilation system ( W )
W f , opt Fan power of filtration system ( W )
W tot Fan power of system ( W )
Δ P v Pressure drop of ventilation system ( Pa )
Δ P f Pressure drop of filtration system ( Pa )
F v ,   eff Ventilation fan efficiency (-)
F f ,   eff Filtration fan efficiency (-)
E v , min Fan energy of ventilation system during operation with the minimum ventilation rate ( Wh )
E v , opt Fan energy of ventilation system during operation with the optimum ventilation rate ( Wh )
E f , opt Fan energy of filtration system during operation with the optimum filtration rate ( Wh )
T v Ventilation fan operating time ( h )
T f Filtration fan operating time ( h )
p Current time (-)

References

  1. Hoek, G.; Krishnan, R.M.; Beelen, R.; Peters, A.; Ostro, B.; Brunekreef, B. Long-term air pollution exposure and cardiorespiratory mortality: A review. Environ. Health 2013, 12, 43. [Google Scholar] [CrossRef] [PubMed] [Green Version]
  2. Shah, A.S.V.; Lee, K.K.; Mcallister, D.A.; Hunter, A.; Nair, H.; Whiteley, W.; Langlish, J.P.; Newby, D.E.; Mills, N.L. Short term exposure to air pollution and stroke: Systematic review and meta-analysis. BMJ 2015, 350, h1295. [Google Scholar] [CrossRef] [PubMed] [Green Version]
  3. Park, S.-K. Assessing the impact of ozone and particulate matter on mortality rate from respiratory disease in Seoul, Korea. Atmosphere 2019, 10, 685. [Google Scholar] [CrossRef] [Green Version]
  4. Wu, L.; Luo, X.-S.; Li, H.; Cang, L.; Yang, J.; Yang, J.; Zhao, Z.; Tang, M. Seasonal levels, sources, and health risks of heavy metals in atmospheric PM2.5 from four functional areas of Nanjing city, eastern China. Atmosphere 2019, 10, 419. [Google Scholar] [CrossRef] [Green Version]
  5. Franck, U.; Odeh, S.; Wiedensohler, A.; Wehner, B.; Herbarth, O. The effect of particle size on cardiovascular disorders—The smaller the worse. Sci. Total Environ. 2011, 409, 4217–4221. [Google Scholar] [CrossRef]
  6. Kim, K.; Kabir, E.; Kabir, S. A review on the human health impact of airborne particulate matter. Environ. Int. 2015, 74, 136–143. [Google Scholar] [CrossRef]
  7. Fisk, W.J.; Faulkner, D.; Palonen, J.; Sepanen, O. Performance and costs of particle air filtration technologies. Indoor Air 2002, 12, 223–234. [Google Scholar] [CrossRef] [Green Version]
  8. Howard-Reed, C.; Wallace, L.; Emmerich, S. Effect of ventilation systems and air filters on decay rates of particles produced by indoor sources in an occupied townhouse. Atmos. Environ. 2003, 37, 5295–5306. [Google Scholar] [CrossRef]
  9. Jamriska, M.; Morawska, L.; Ensor, D. Control strategies for sub-micrometer particles indoors: Model study of air filtration and ventilation. Indoor Air 2003, 13, 96–105. [Google Scholar] [CrossRef] [Green Version]
  10. Ben-David, T.; Waring, M.S. Interplay of ventilation and filtration: Differential analysis of cost function combining energy use and indoor exposure to PM2.5 and ozone. Build. Environ. 2018, 128, 320–335. [Google Scholar] [CrossRef]
  11. Ren, J.; Liu, J.; Cao, X.; Hou, Y. Influencing factors and energy-saving control strategies for indoor fine particles in commercial office buildings in six Chinese cities. Energy Build. 2017, 149, 171–179. [Google Scholar] [CrossRef]
  12. Ruan, T.; Rim, D. Indoor air pollution in office buildings in mega-cities: Effects of filtration efficiency and outdoor air ventilation rates. Sustain. Cities Soc. 2019, 49, 101609. [Google Scholar] [CrossRef]
  13. Xie, W.; Fan, Y.; Zhang, X.; Tian, G.; Si, P. A mathematical model for predicting indoor PM2.5 concentration under different ventilation methods in residential buildings. Build. Serv. Eng. Res. Technol. 2020. [Google Scholar] [CrossRef]
  14. Zhong, X.; Wu, W.; Ridley, I.A. Assessing the indoor PM2.5 exposure impacts of control strategies for residential energy recovery ventilators. J. Build. Eng. 2020, 29, 101137. [Google Scholar] [CrossRef]
  15. Gallup Korea. Available online: https://www.gallup.co.kr/gallupdb/reportContent.asp?seqNo=1118 (accessed on 5 October 2020).
  16. Bae, S.H.; Jeong, M.H. Ventilation system for apartment houses with filtering mode. KIAEBS 2017, 11, 23–30. [Google Scholar]
  17. Chenari, B.; Carrilho, J.D.; da Silva, M.G. Towards sustainable, energy-efficient and healthy ventilation strategies in buildings: A review. Renew. Sustain. Energy Rev. 2016, 59, 1426–1447. [Google Scholar] [CrossRef]
  18. Cheng, Y.; Zhang, S.; Huan, C.; Oladokun, M.O.; Lin, Z. Optimization on fresh outdoor air ratio of air conditioning system with stratum ventilation for both targeted indoor air quality and maximal energy saving. Build. Environ. 2019, 147, 11–22. [Google Scholar] [CrossRef] [Green Version]
  19. Fisk, W.J.; De Almeida, A.T. Sensor-based demand-controlled ventilation: A review. Energy Build. 1998, 29, 35–45. [Google Scholar] [CrossRef] [Green Version]
  20. Guyot, G.; Sherman, M.H.; Walker, I.S. Smart ventilation energy and indoor air quality performance in residential buildings: A review. Energy Build. 2018, 165, 416–430. [Google Scholar] [CrossRef] [Green Version]
  21. Pantazaras, A.; Santamouris, M.; Lee, S.E.; Assimakopoulos, M.N. A decision tool to balance indoor air quality and energy consumption: A case study. Energy Build. 2018, 165, 246–258. [Google Scholar] [CrossRef]
  22. Zaatari, M.; Novoselac, A.; Siegel, J. Impact of ventilation and filtration strategies on energy consumption and exposures in retail stores. Build. Environ. 2016, 100, 186–196. [Google Scholar] [CrossRef]
  23. Ganesh, H.S.; Fritz, H.E.; Edgar, T.F.; Novoselac, A.; Baldea, M. A model-based dynamic optimization strategy for control of indoor air pollutants. Energy Build. 2019, 195, 168–179. [Google Scholar] [CrossRef]
  24. Liu, H.; Lee, S.; Kim, M.; Shi, H.; Kim, J.; Wasewar, K.; Yoo, C. Multi-objective optimization of indoor air quality control and energy consumption minimization in a subway ventilation system. Energy Build. 2013, 66, 553–561. [Google Scholar] [CrossRef]
  25. Cho, W.; Song, D.; Hwang, S.; Yun, S. Energy-efficient ventilation with air-cleaning mode and demand control in a multi-residential building. Energy Build. 2015, 90, 6–14. [Google Scholar] [CrossRef]
  26. Han, K.; Zhang, J.S.; Guo, B. A novel approach of integrating ventilation and air cleaning for sustainable and healthy office environments. Energy Build. 2014, 76, 32–42. [Google Scholar] [CrossRef]
  27. Kim, J.H.; Yeo, M.S. Effect of flow rate and filter efficiency on indoor PM2.5 in ventilation and filtration control. Atmosphere 2020, 11, 1061. [Google Scholar] [CrossRef]
  28. Korea Environment Corporation. Airkorea. Available online: www.airkorea.or.kr (accessed on 19 June 2020).
  29. Ferro, A.R.; Kopperud, R.J.; Hildemann, L.M. Source strengths for indoor human activities that resuspend particulate matter. Environ. Sci. Technol. 2004, 38, 1759–1764. [Google Scholar] [CrossRef]
  30. Wallace, L.A. Indoor particles: A review. J. Air Waste Manag. Assoc. 1996, 46, 98–126. [Google Scholar] [CrossRef]
  31. He, C.; Morawska, L.; Hitchins, J.; Gilbert, D. Contribution from indoor sources to particle number and mass concentrations in residential houses. Atmos. Environ. 2004, 38, 3405–3415. [Google Scholar] [CrossRef]
  32. Kleipis, N.; Ott, W.; Switzer, P.A. Multiple smoker model for predicting indoor air quality in public lounges. Environ. Sci. Technol. 1996, 30, 2813–2820. [Google Scholar] [CrossRef]
  33. Brauer, M.; Hirtle, R.; Lang, B.; Ott, W. Assessment of indoor fine aerosol contributions from environmental tobacco smoke and cooking with a portable nephelometer. J. Expo. Anal. Environ. Epidemiol. 2000, 10, 136–144. [Google Scholar] [CrossRef] [PubMed] [Green Version]
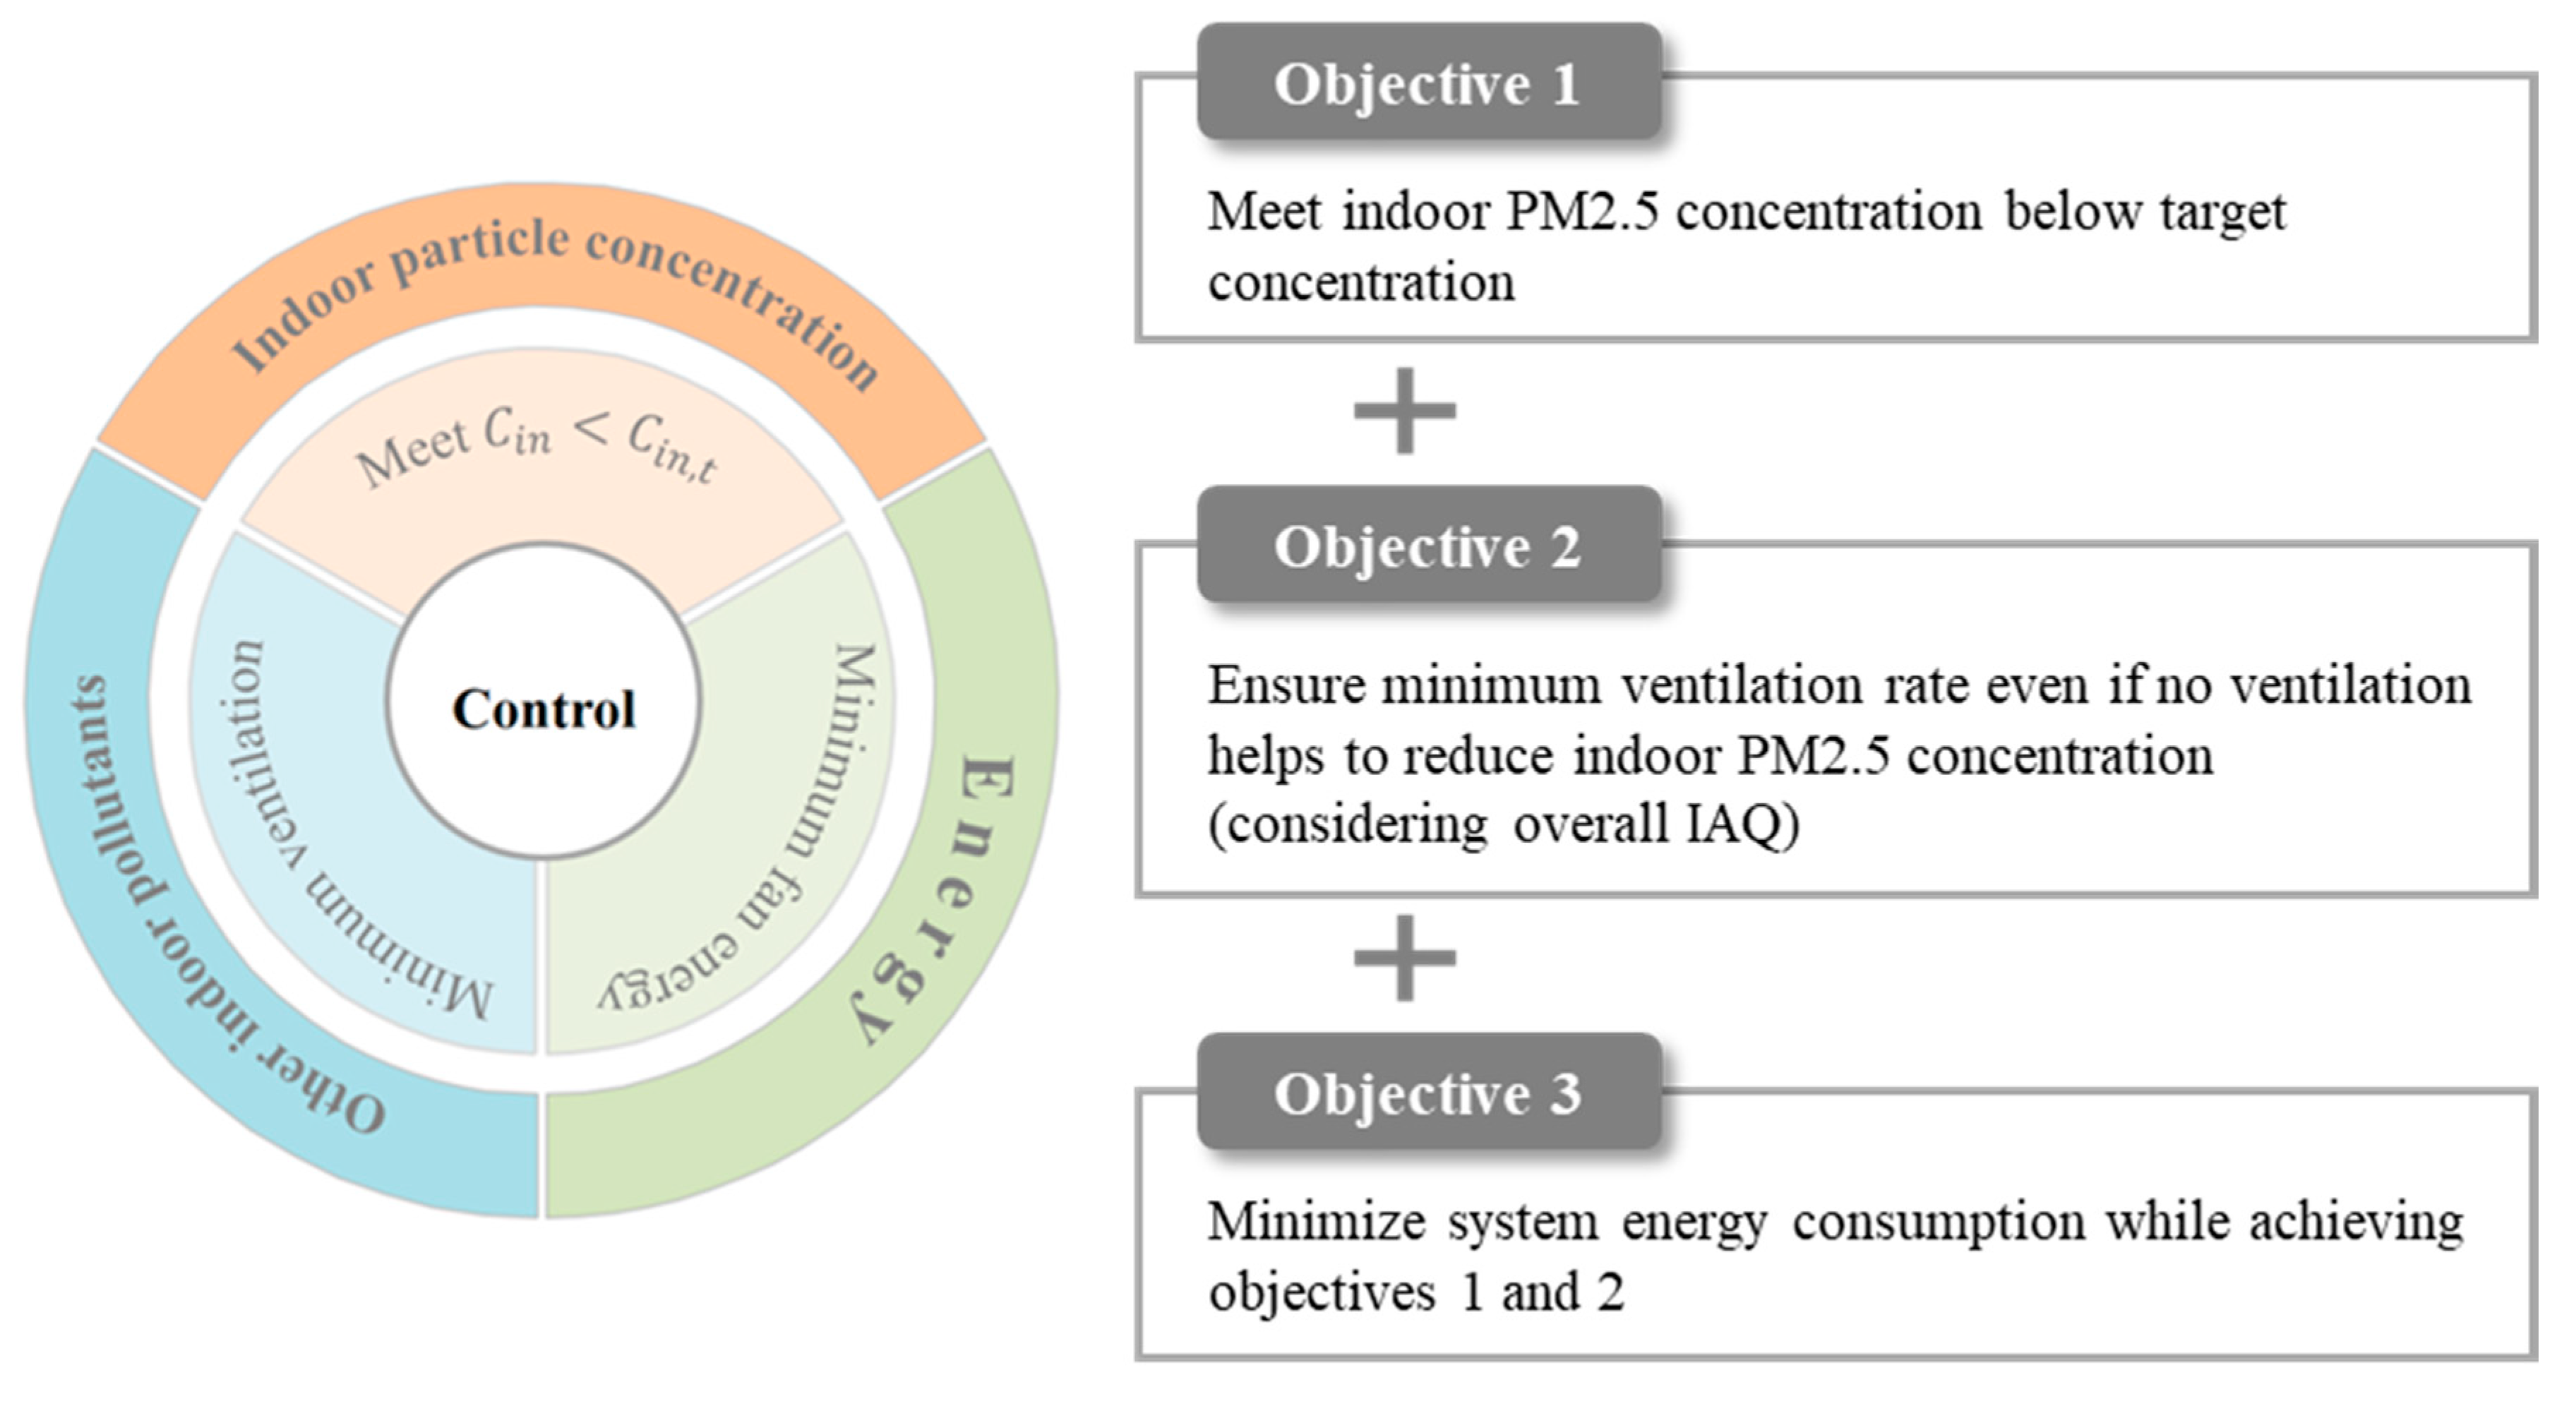
Figure 1. Goals of optimal ventilation and filtration control.
Atmosphere 11 01140 g001
Figure 2. Particle matter (PM) concentration mechanism in a space with a mechanical ventilation system and portable filtration system.
Atmosphere 11 01140 g002
Figure 3. Configuration of the experimental house: system layout, sampling locations, and emission point.
Atmosphere 11 01140 g003
Figure 4. Comparison of measured and predicted data.
Atmosphere 11 01140 g004
Figure 5. Control limit (CL) curve.
Atmosphere 11 01140 g005
Figure 6. (ad) Indoor particle concentration characteristics depending on the ventilation rates when the filter efficiency of system is 0.65; (e) ventilation control limit graphs to maintain the target indoor PM that vary with ventilation flow rates; and (f) indoor and outdoor particle conditions separated by the ventilation control limit.
Atmosphere 11 01140 g006
Figure 7. (ad) Indoor particle concentration characteristics depending on the filtration rates when the filter efficiency of system is 0.95; (e) filtration control limit graphs to maintain the target indoor PM that vary with filtration flow rates; and (f) indoor and outdoor particle conditions separated by the maximum flow filtration control limit.
Atmosphere 11 01140 g007
Figure 8. A linear graph passing through the CP and the intersection point (IP) simultaneously for estimating Q v , opt .
Atmosphere 11 01140 g008
Figure 9. A linear graph passing through the CP with the same slope as the filtration + minimum ventilation control limit for estimating Q f , opt .
Atmosphere 11 01140 g009
Figure 10. Optimization control process of the ventilation and filtration system.
Atmosphere 11 01140 g010
Figure 11. Optimization algorithm of the ventilation and filtration system.
Atmosphere 11 01140 g011
Figure 12. Schematic diagram of the ventilation and filtration system applied with the condition zone control system.
Atmosphere 11 01140 g012
Figure 13. Schematic diagram of the ventilation and filtration system applied with the conventional control system.
Atmosphere 11 01140 g013
Figure 14. Indoor and outdoor particle conditions for the cases: (a) Outdoor PM2.5 concentration of cases E1 and E2; (b) schedule of the indoor PM2.5 generation rate.
Atmosphere 11 01140 g014
Figure 15. The results of (a) indoor and outdoor PM conditions, (b) condition zones, (c) operation flow rates of the system, (d) indoor PM2.5 concentration, (e) indoor CO2 concentration, and (f) system fan power consumption during E1.
Atmosphere 11 01140 g015
Figure 16. The results of (a) indoor and outdoor PM conditions, (b) condition zones, (c) operation flow rates of the system, (d) indoor PM2.5 concentration, (e) indoor CO2 concentration, and (f) system fan power consumption during E2.
Atmosphere 11 01140 g016
Table 1. Results of P, k, and λ obtained from tests.
Parameters P   ( - ) k   ( h 1 ) λ   ( h 1 )
Distribution Atmosphere 11 01140 i001 Atmosphere 11 01140 i002 Atmosphere 11 01140 i003
Average ( μ )0.70.40.13
Variance ( σ 2 )0.09370.00650.0108
Standard deviation ( σ )0.30600.08060.1041
Table 2. Results of parameters η v and η f according to flow rate.
Efficiency of FilterOperation Mode
Step 1Step 2Step 3
η v
(-)
0.60
( Q v = 107 m3/h)
0.60
( Q v = 121 m3/h)
0.70
( Q v = 145 m3/h)
η f
(-)
0.89
( Q f = 125 m3/h)
0.80
( Q f = 245 m3/h)
0.97
( Q f = 305 m3/h)
Table 3. Formulas of control limits in the CL curve.
Atmosphere 11 01140 i004 f v _ min ( X ) = ( Q v _ min ( 1 η v ) + V · P · λ ) X + ( V · φ ( C in , t C in i 1 e φ t 1 e φ t ) ) φ = Q v _ min V + k + λ
f v _ max ( X ) = ( Q v _ max ( 1 η v ) + V · P · λ ) X + ( V · φ ( C in , t C in i 1 e φ t 1 e φ t ) ) φ = Q v _ max V + k + λ
f f _ max ( X ) = ( Q v _ min ( 1 η v ) + V · P · λ ) X + ( V · φ ( C in , t C in i 1 e φ t 1 e φ t ) ) φ = Q v _ min V + k + λ + η f Q f _ max V
f v ,   f _ max ( X ) = ( Q v _ max ( 1 η v ) + V · P · λ ) X + ( V · φ ( C in , t C in i 1 e φ t 1 e φ t ) ) φ = Q v _ max V + k + λ + η f Q f _ max V
Table 4. Discriminant equation for identifying the condition zone to which the condition point (CP) belongs.
Condition Zone to Which the CP Belongs Discriminant Equation
Atmosphere 11 01140 i005CP ( X cp ,   Y cp )
Zone A or B
Y cp f v _ min ( X cp )
Atmosphere 11 01140 i006CP ( X cp ,   Y cp )
Zone C
f v _ min ( X cp ) < Y cp and
Y cp f v _ max ( X cp )
Atmosphere 11 01140 i007CP ( X cp ,   Y cp )
Zone D
f v _ min ( X cp ) < Y cp ,
f v _ max ( X cp ) < Y cp and
Y cp f f _ max ( X cp )
Atmosphere 11 01140 i008CP ( X cp ,   Y cp )
Zone E
f f _ max ( X cp ) < Y cp and
Y cp f v , f _ max ( X cp )
Atmosphere 11 01140 i009CP ( X cp ,   Y cp )
Zone F
f f _ max ( X cp ) < Y cp and
f v , f _ max ( X cp ) < Y cp
Table 5. Parameters associated with the space.
ParametersValueUnit
Room volume200m3
Penetration coefficient0.7-
Deposition rate0.4h−1
Infiltration rate0.06h−1
Table 6. Parameters associated with the system.
VentilationFiltration
Flow rate ( m 3 / h )Filter efficiency (-)Pressure drop (Pa)Flow rate ( m 3 / h )Filter efficiency (-)Pressure drop (Pa)
100 (Step 1)0.65120200 (Step 1)0.95200
150 (Step 2)400 (Step 2)
200 (Step 3)600 (Step 3)
Table 7. Simulation cases.
Level of Outdoor ConcentrationControl Method TypeCases
E1: Good ~ NormalConventional control (C1)E1-C1
Condition Zone control (C2)E1-C2
E2: Bad Conventional control (C1)E2-C1
Condition Zone control (C2)E2-C2
Table 8. Comparison of fan energy consumption during E1 condition and E2 condition.
Condition CaseFan Energy Consumption (Wh)
Conventional Control (C1)Condition Zone Control (C2)
E1 condition950.01812.04 (14.5% )
E2 condition3246.84912.85 (71.8% )
Publisher’s Note: MDPI stays neutral with regard to jurisdictional claims in published maps and institutional affiliations.