Ventilation and Filtration Control Strategy Considering PM2.5, IAQ, and System Energy
Abstract
:1. Introduction
2. Methods
2.1. Dynamic Model for Predicting Indoor PM Generation Rate
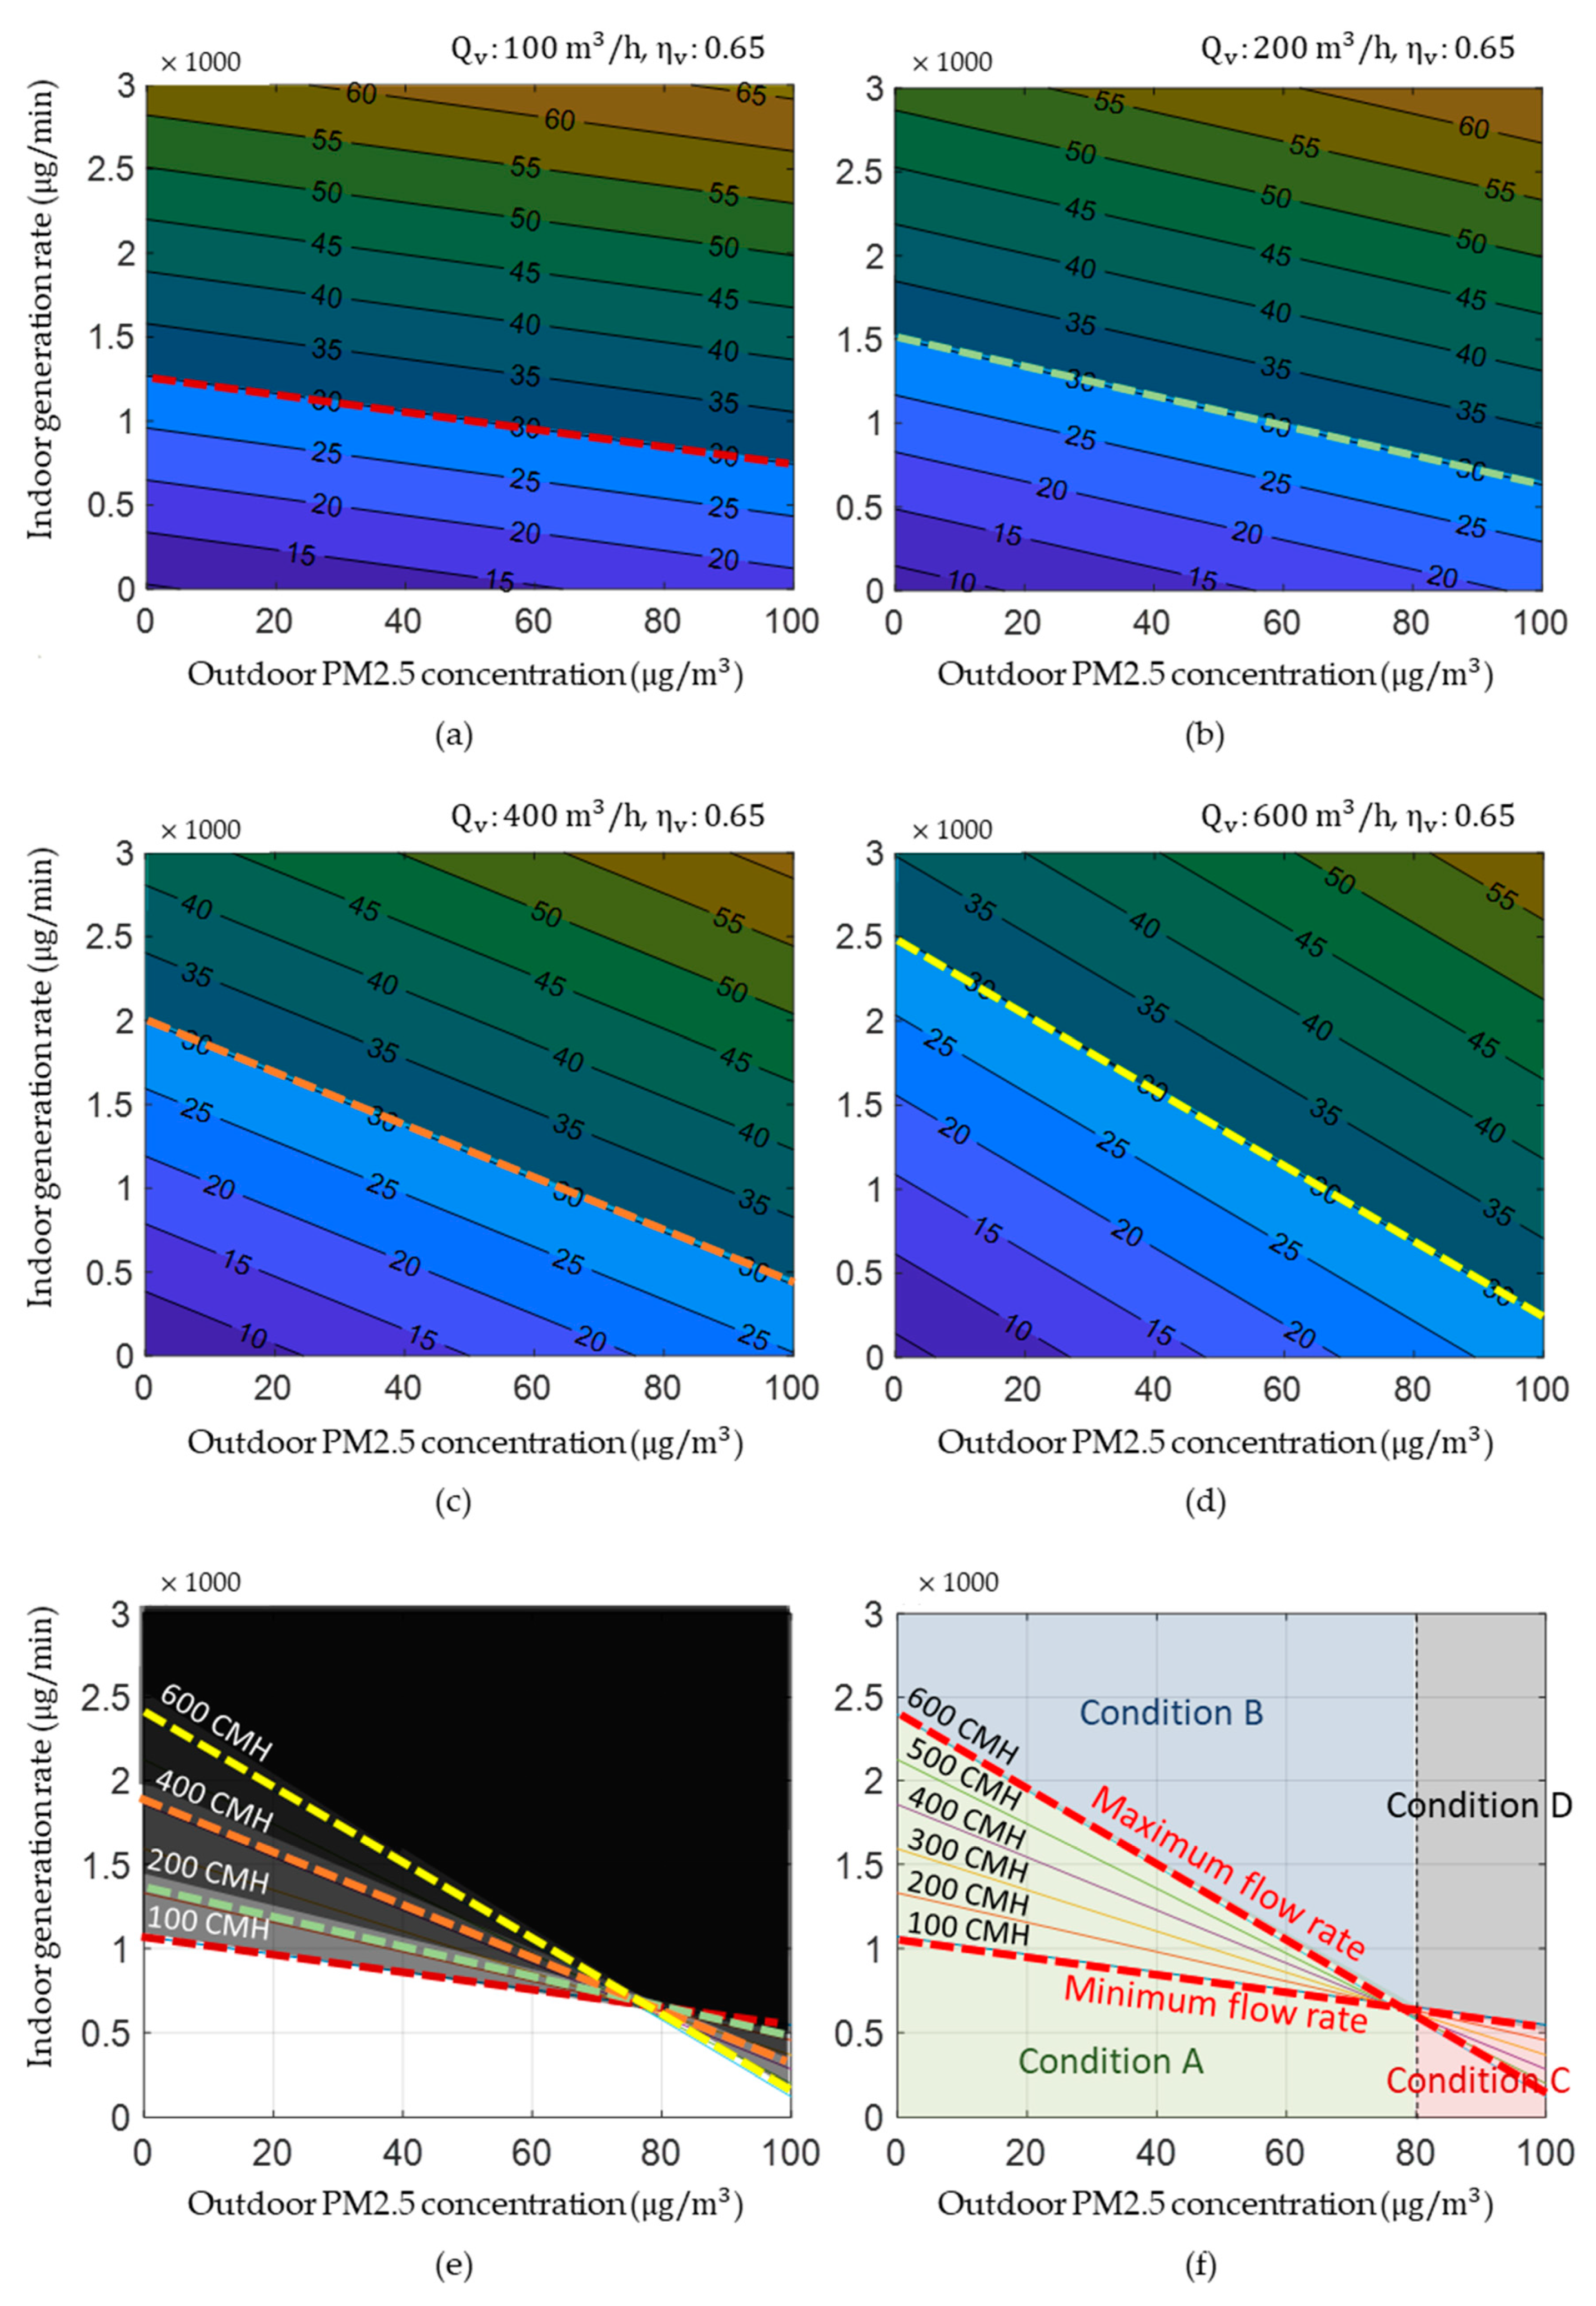
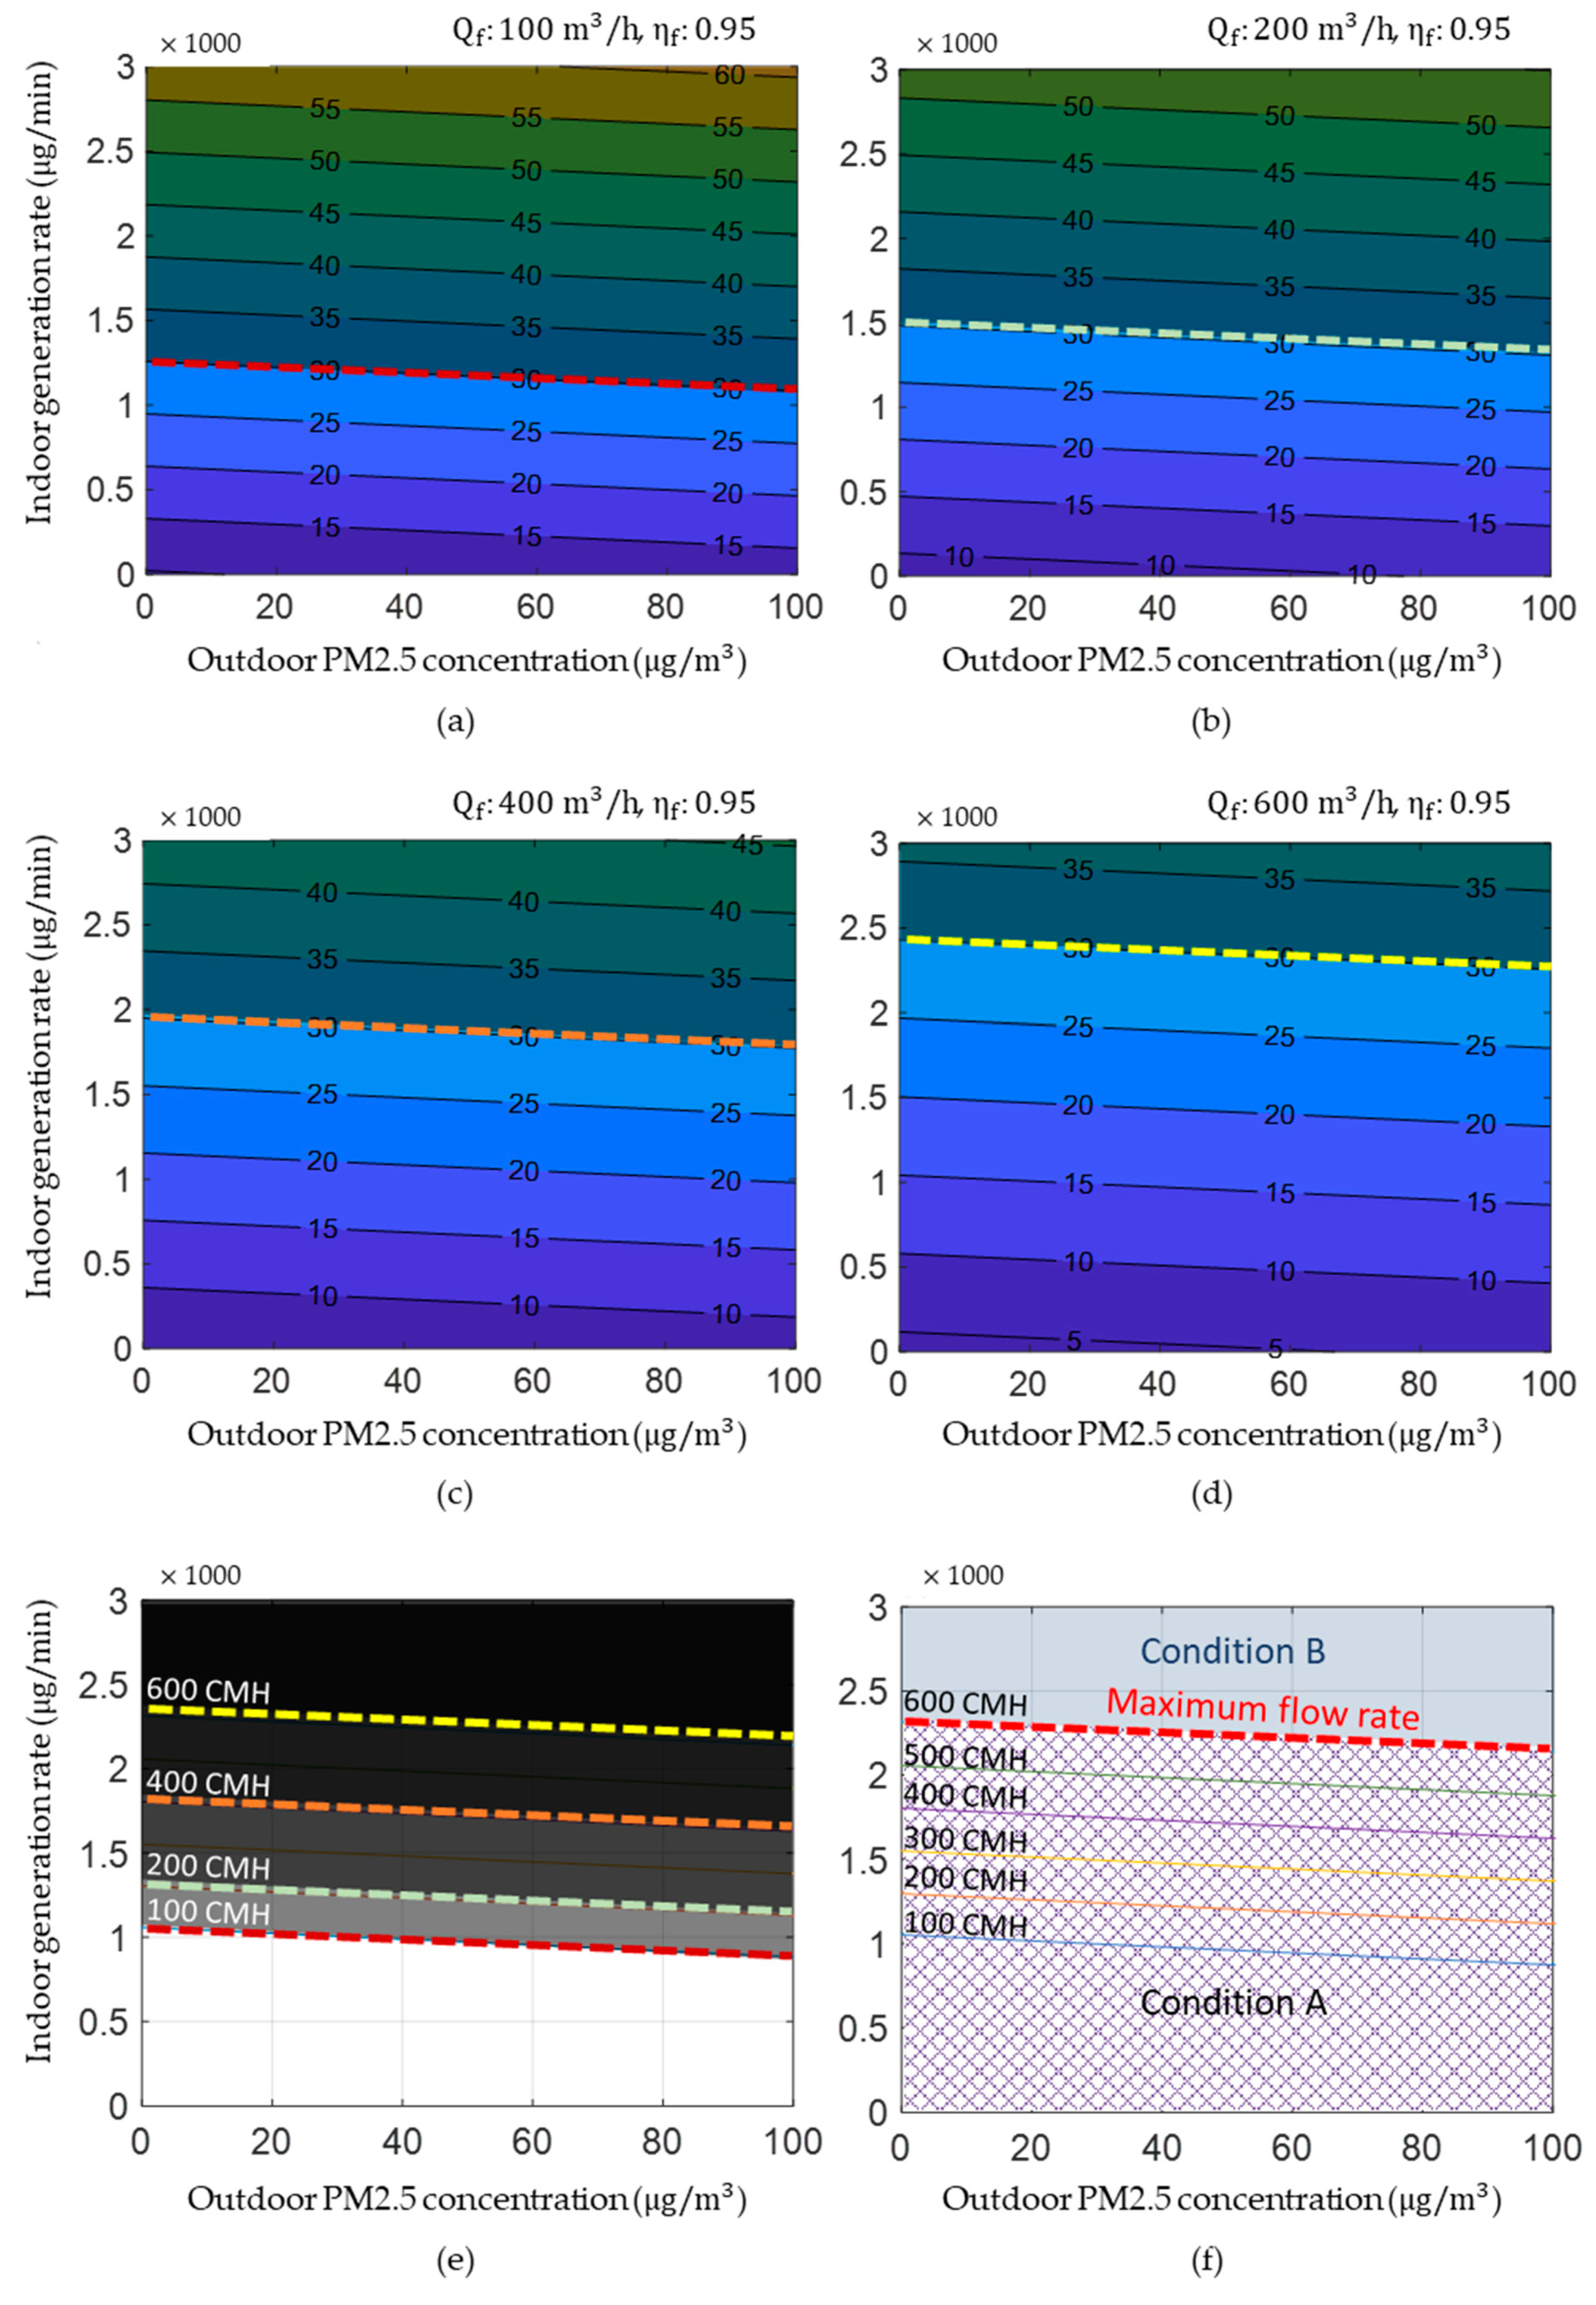
2.2. Control Limit (CL) Curve
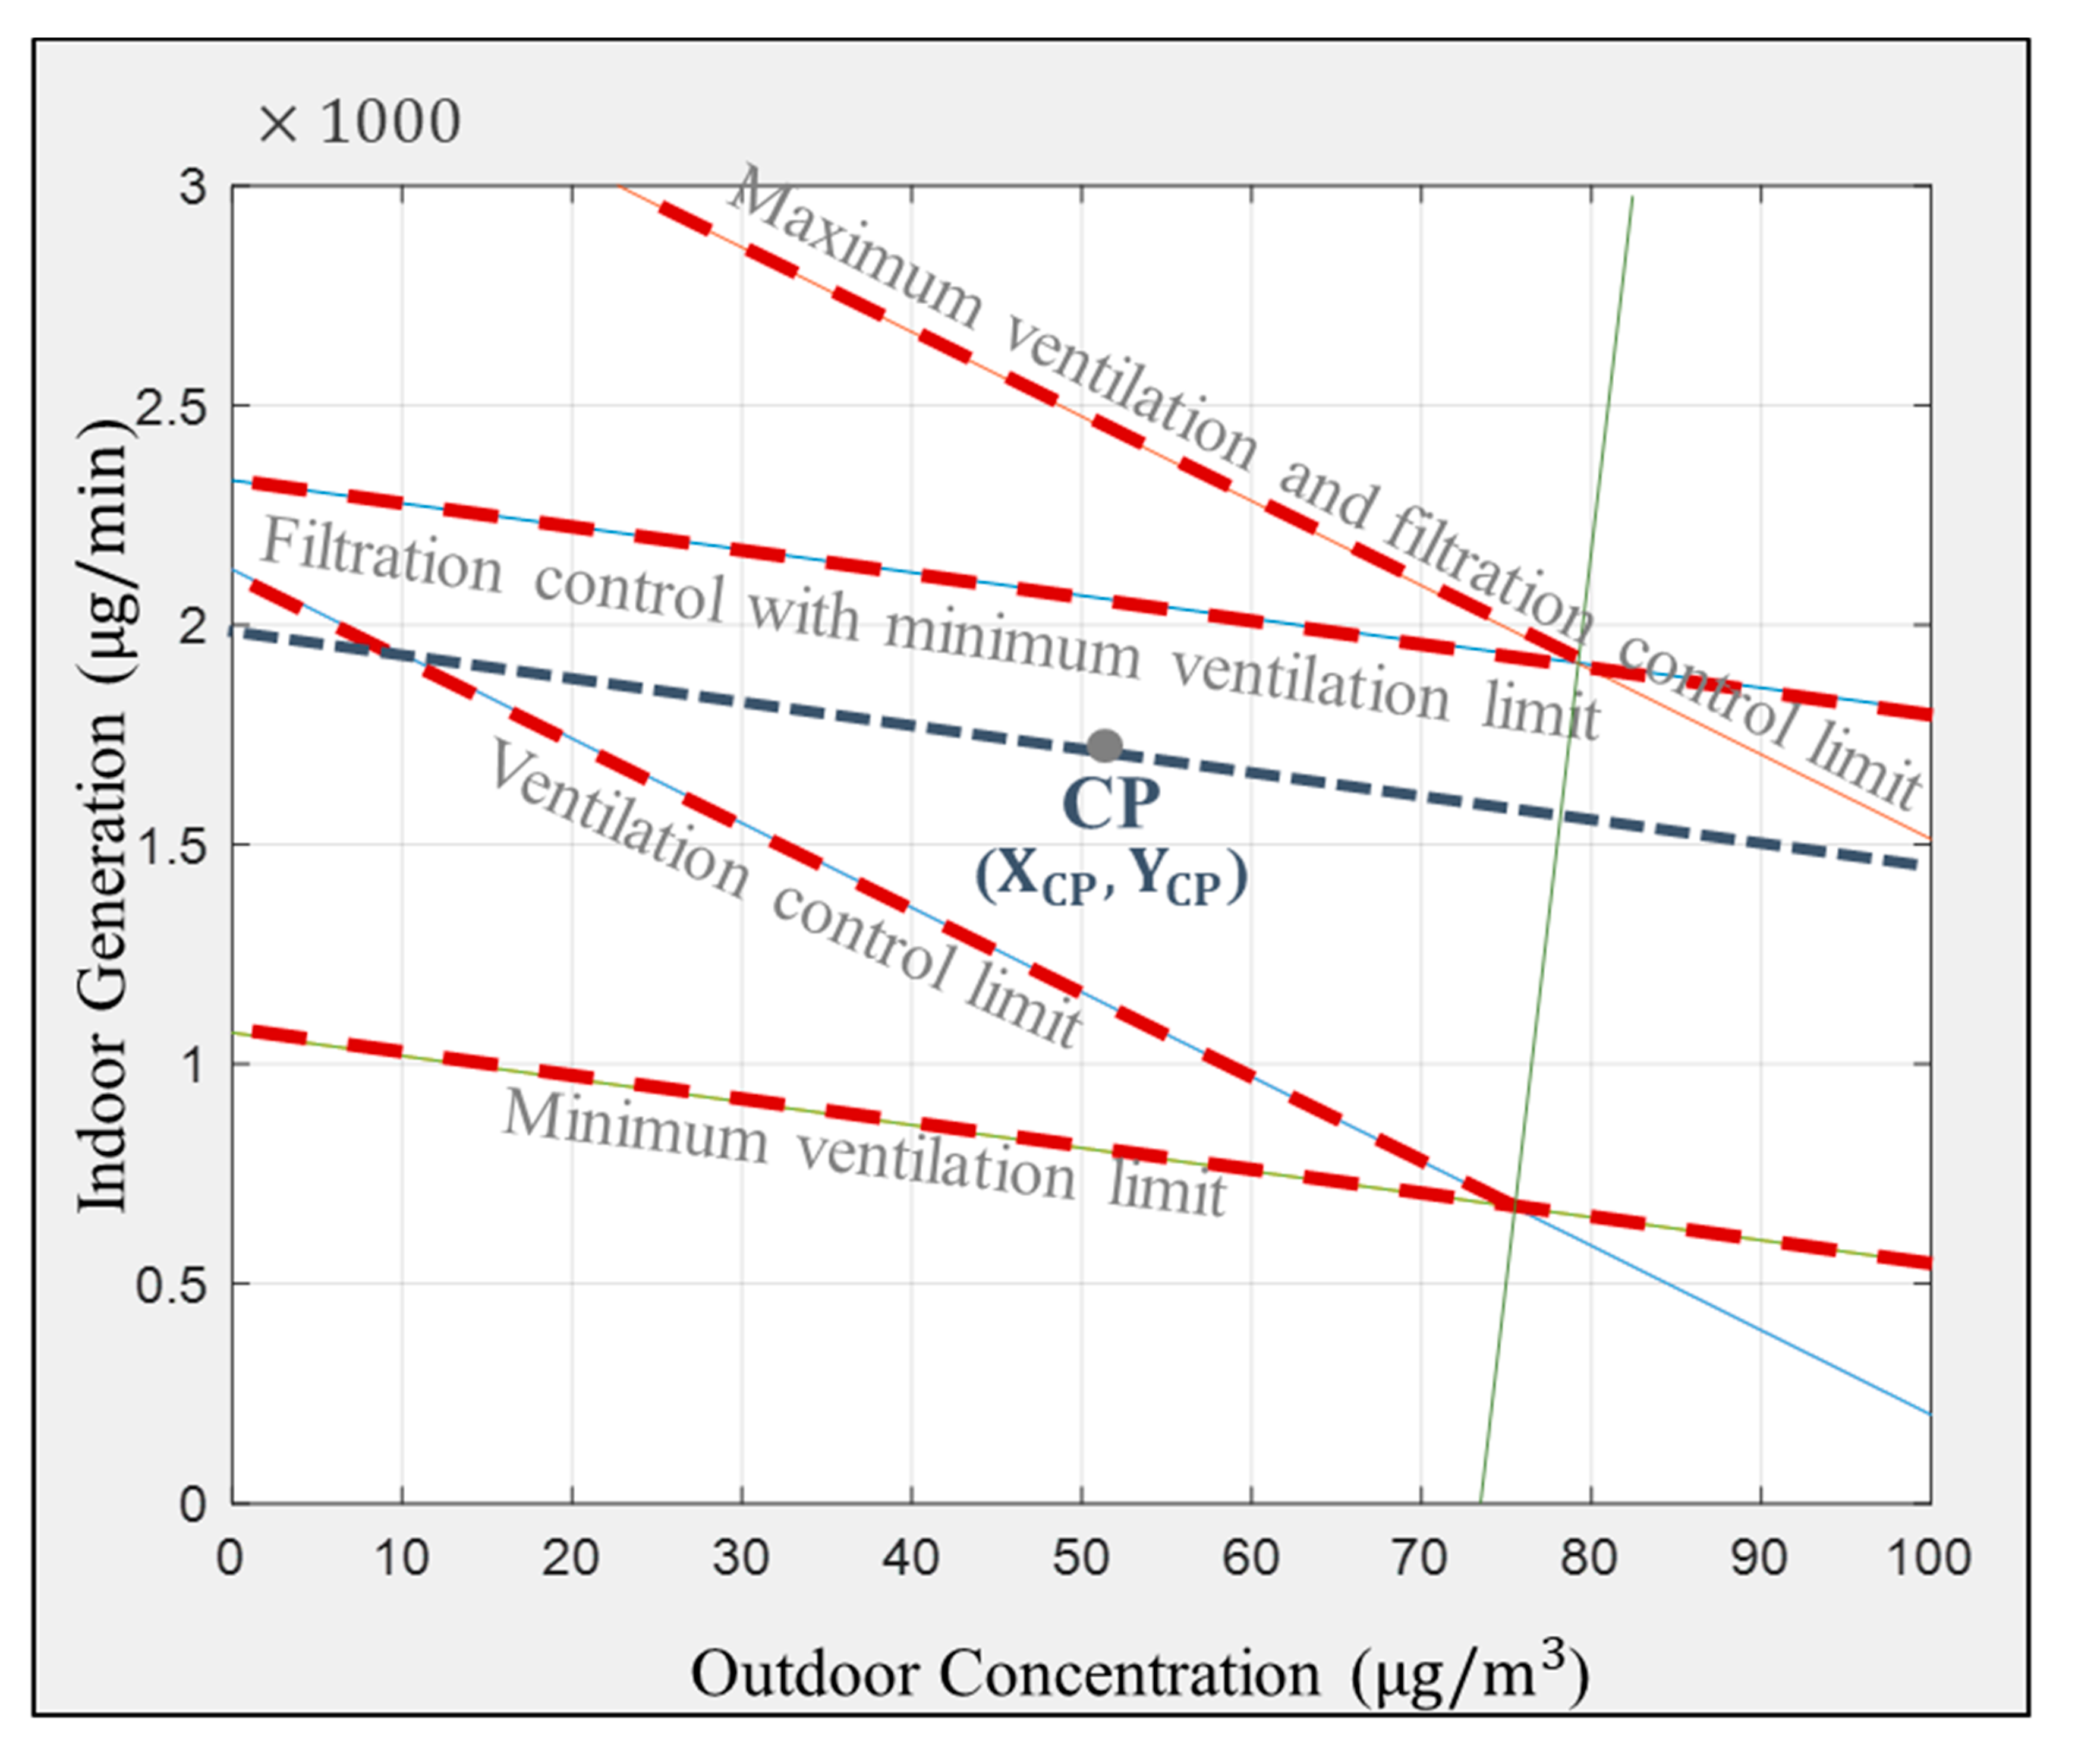
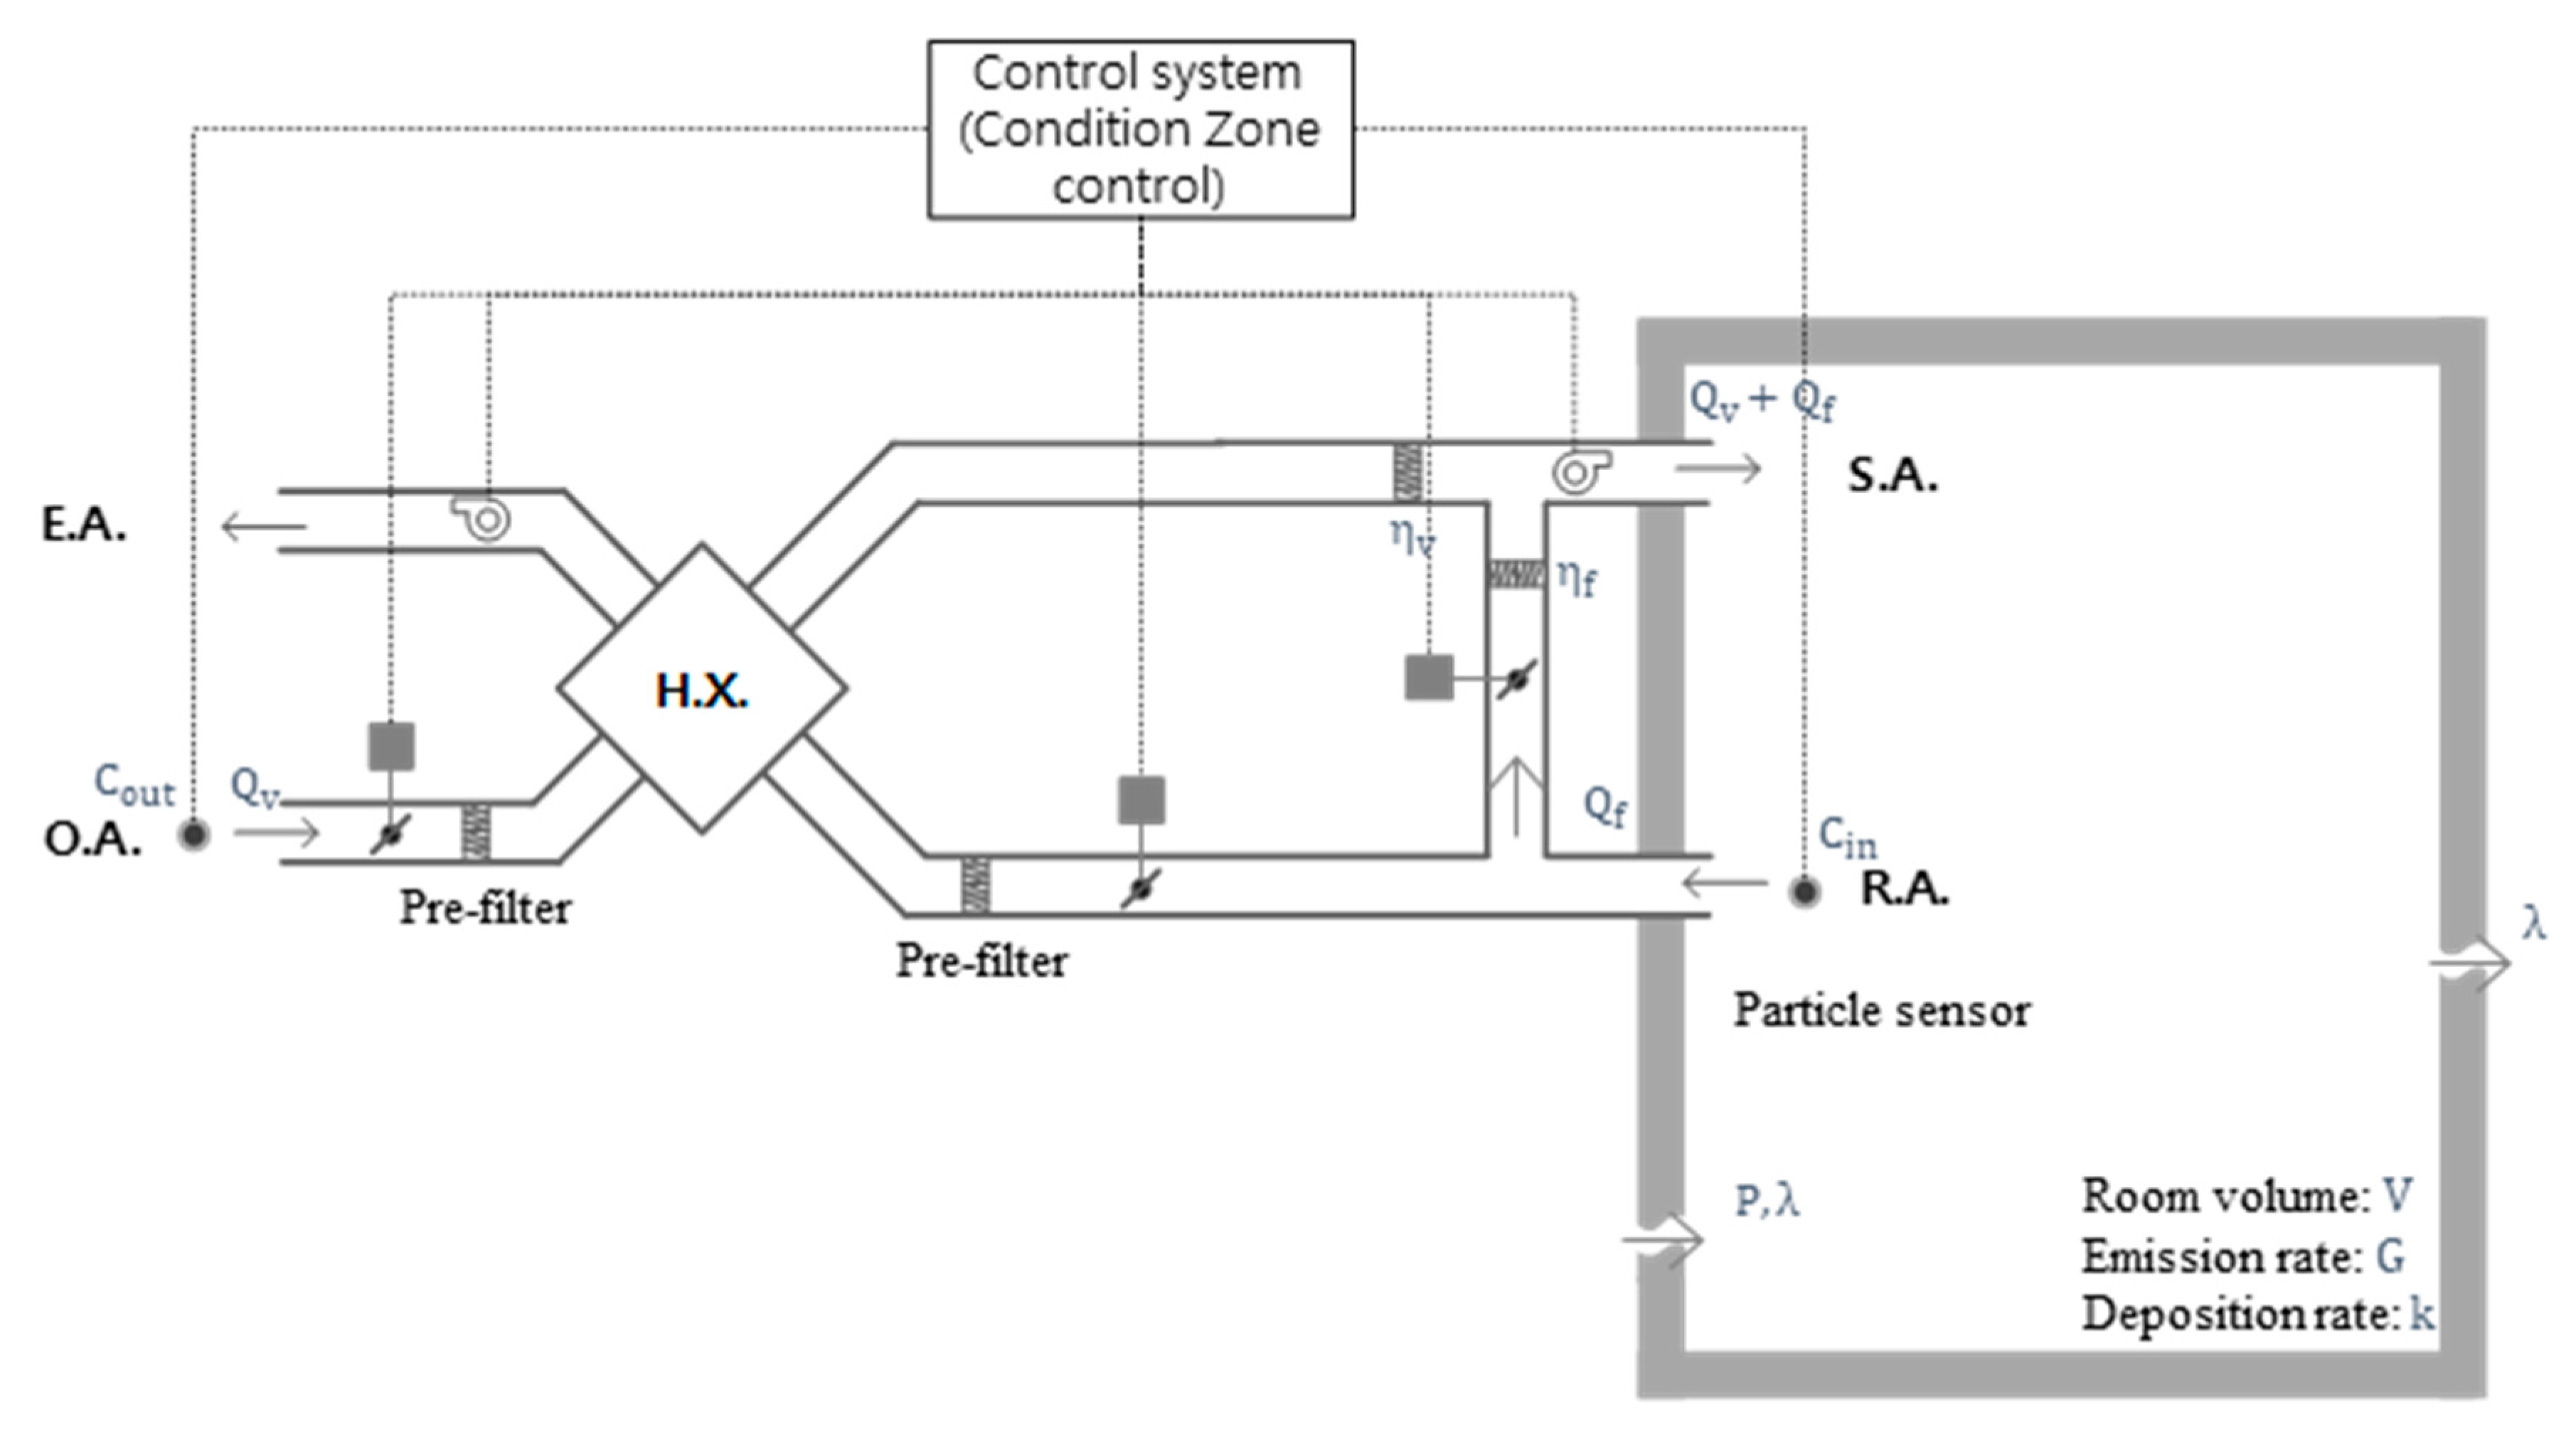
2.3. Concept of the Optimization Control Using the CL Curve
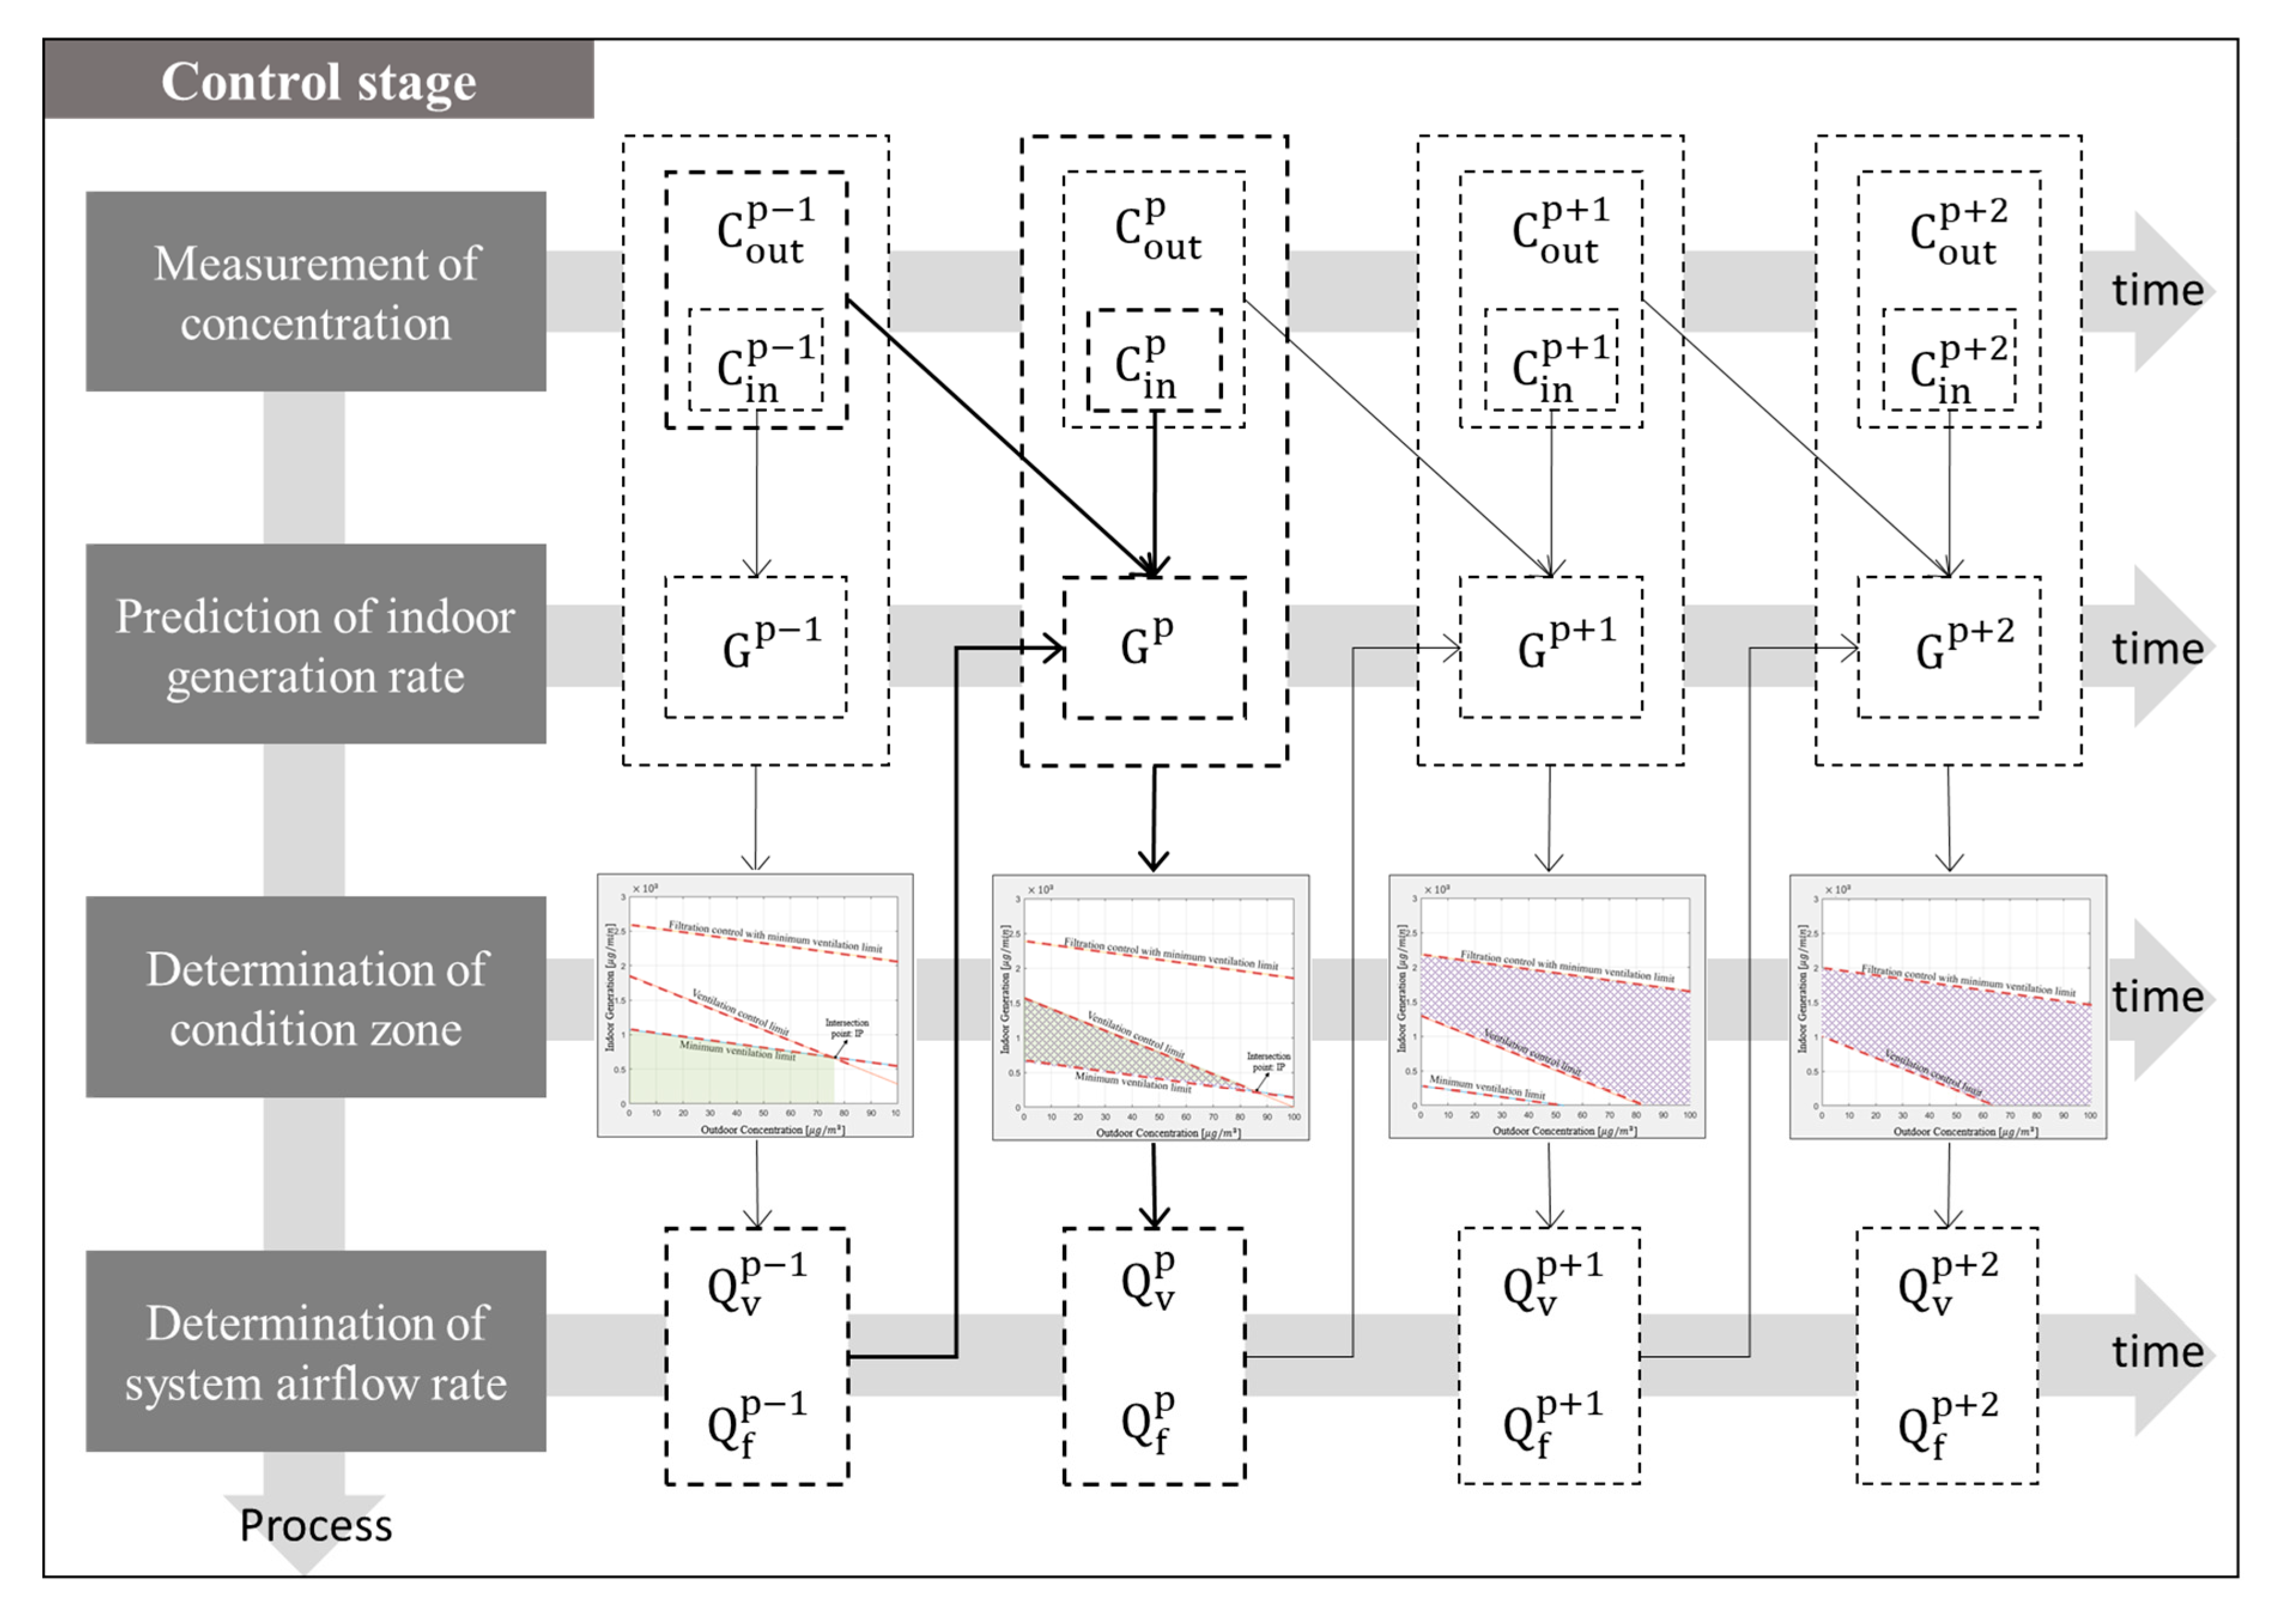
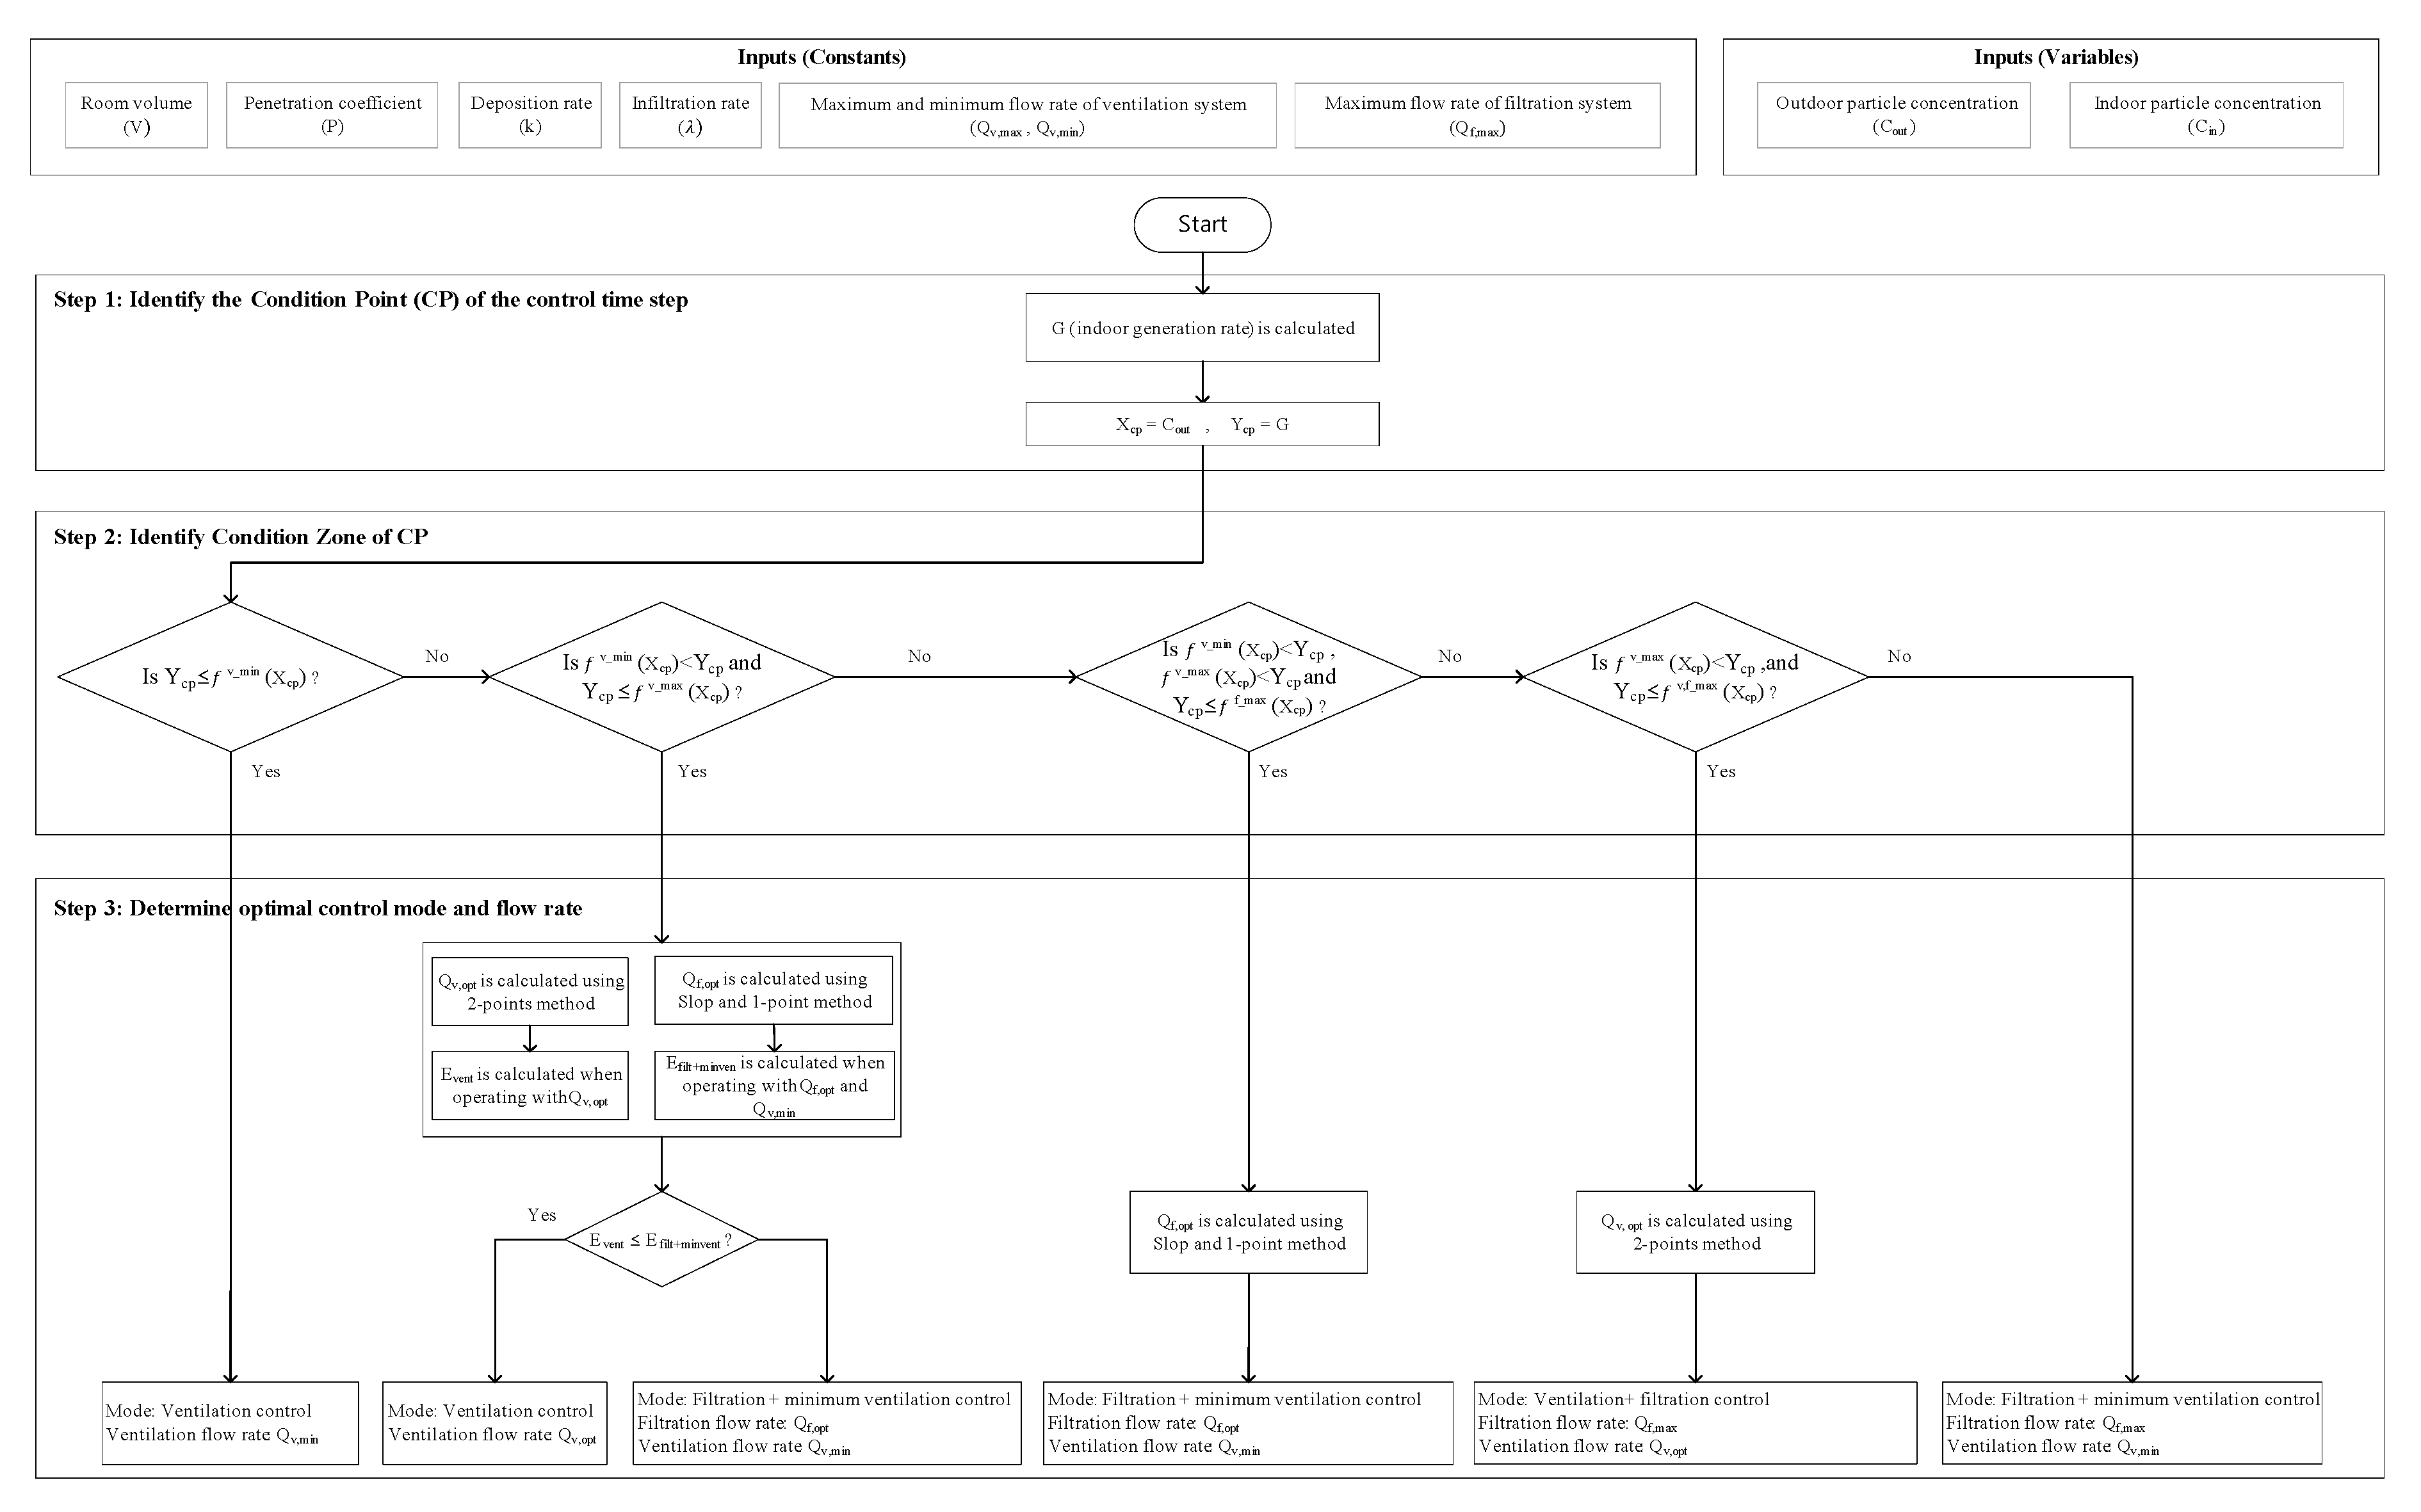
2.4. Optimization Control Algorithm of Ventilation and Filtration
3. Performance Evaluation of the Proposed Control Method
3.1. Simulation Model
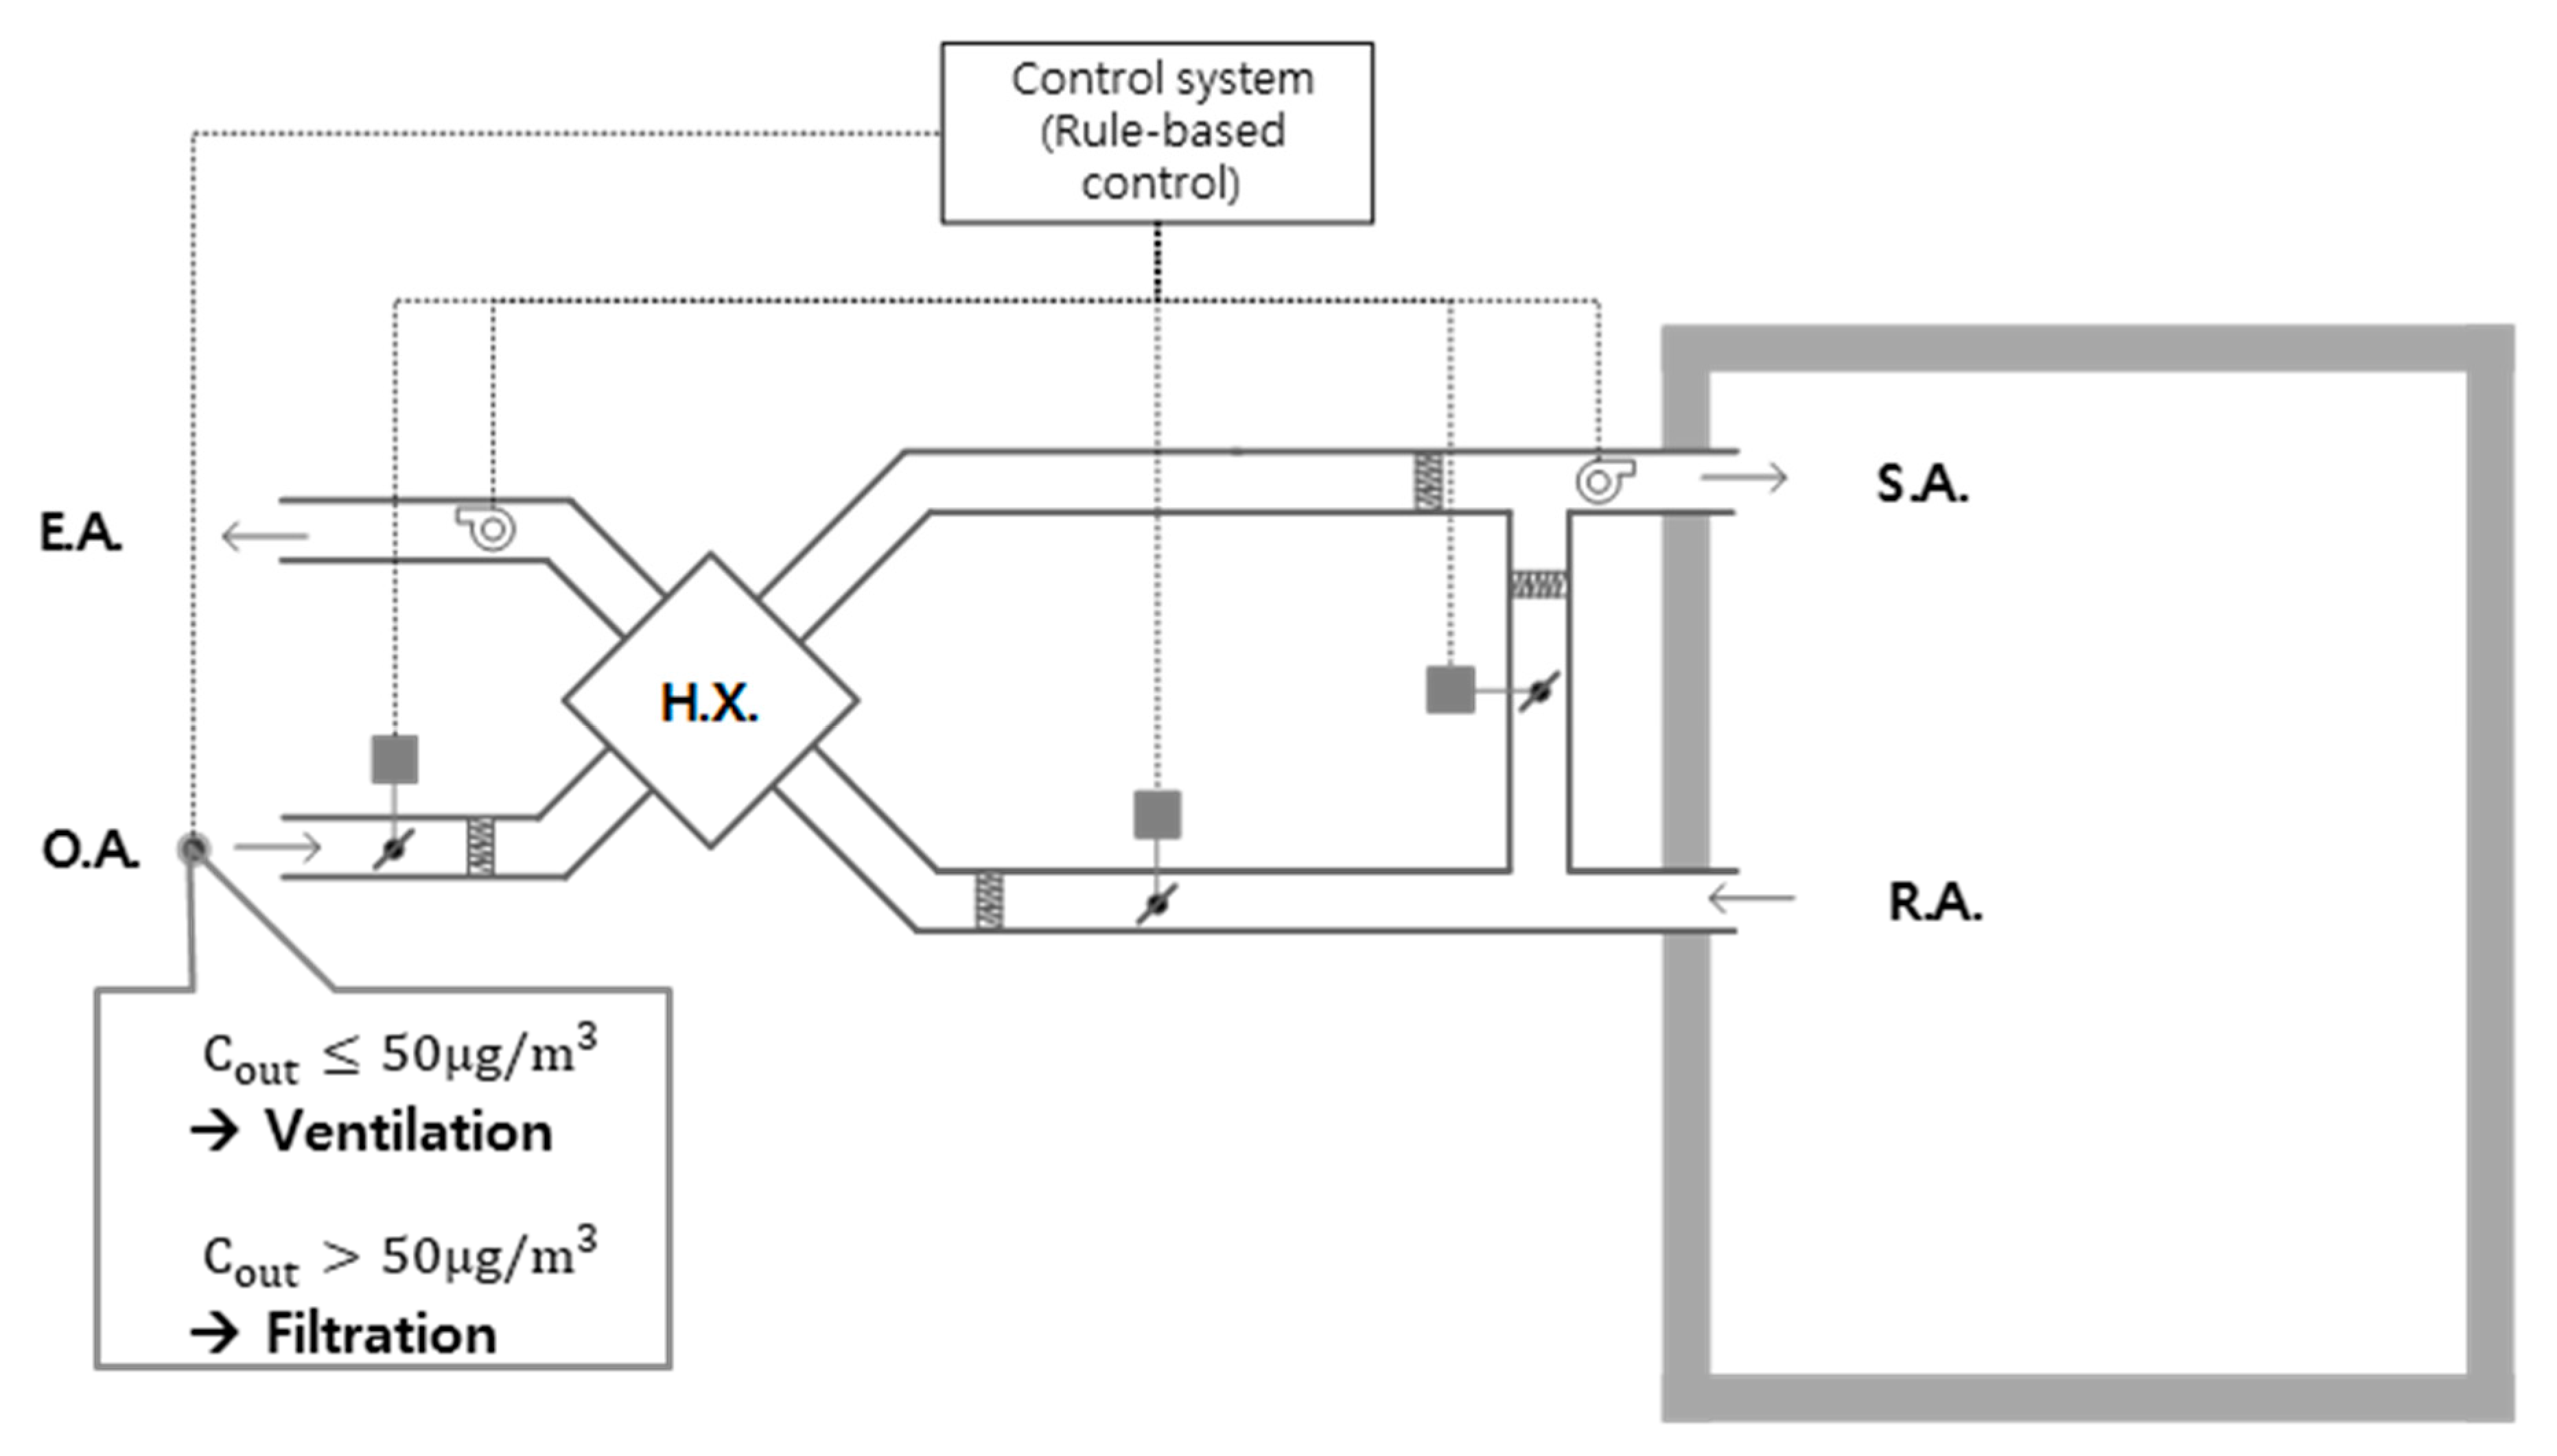
3.2. Simulation Cases
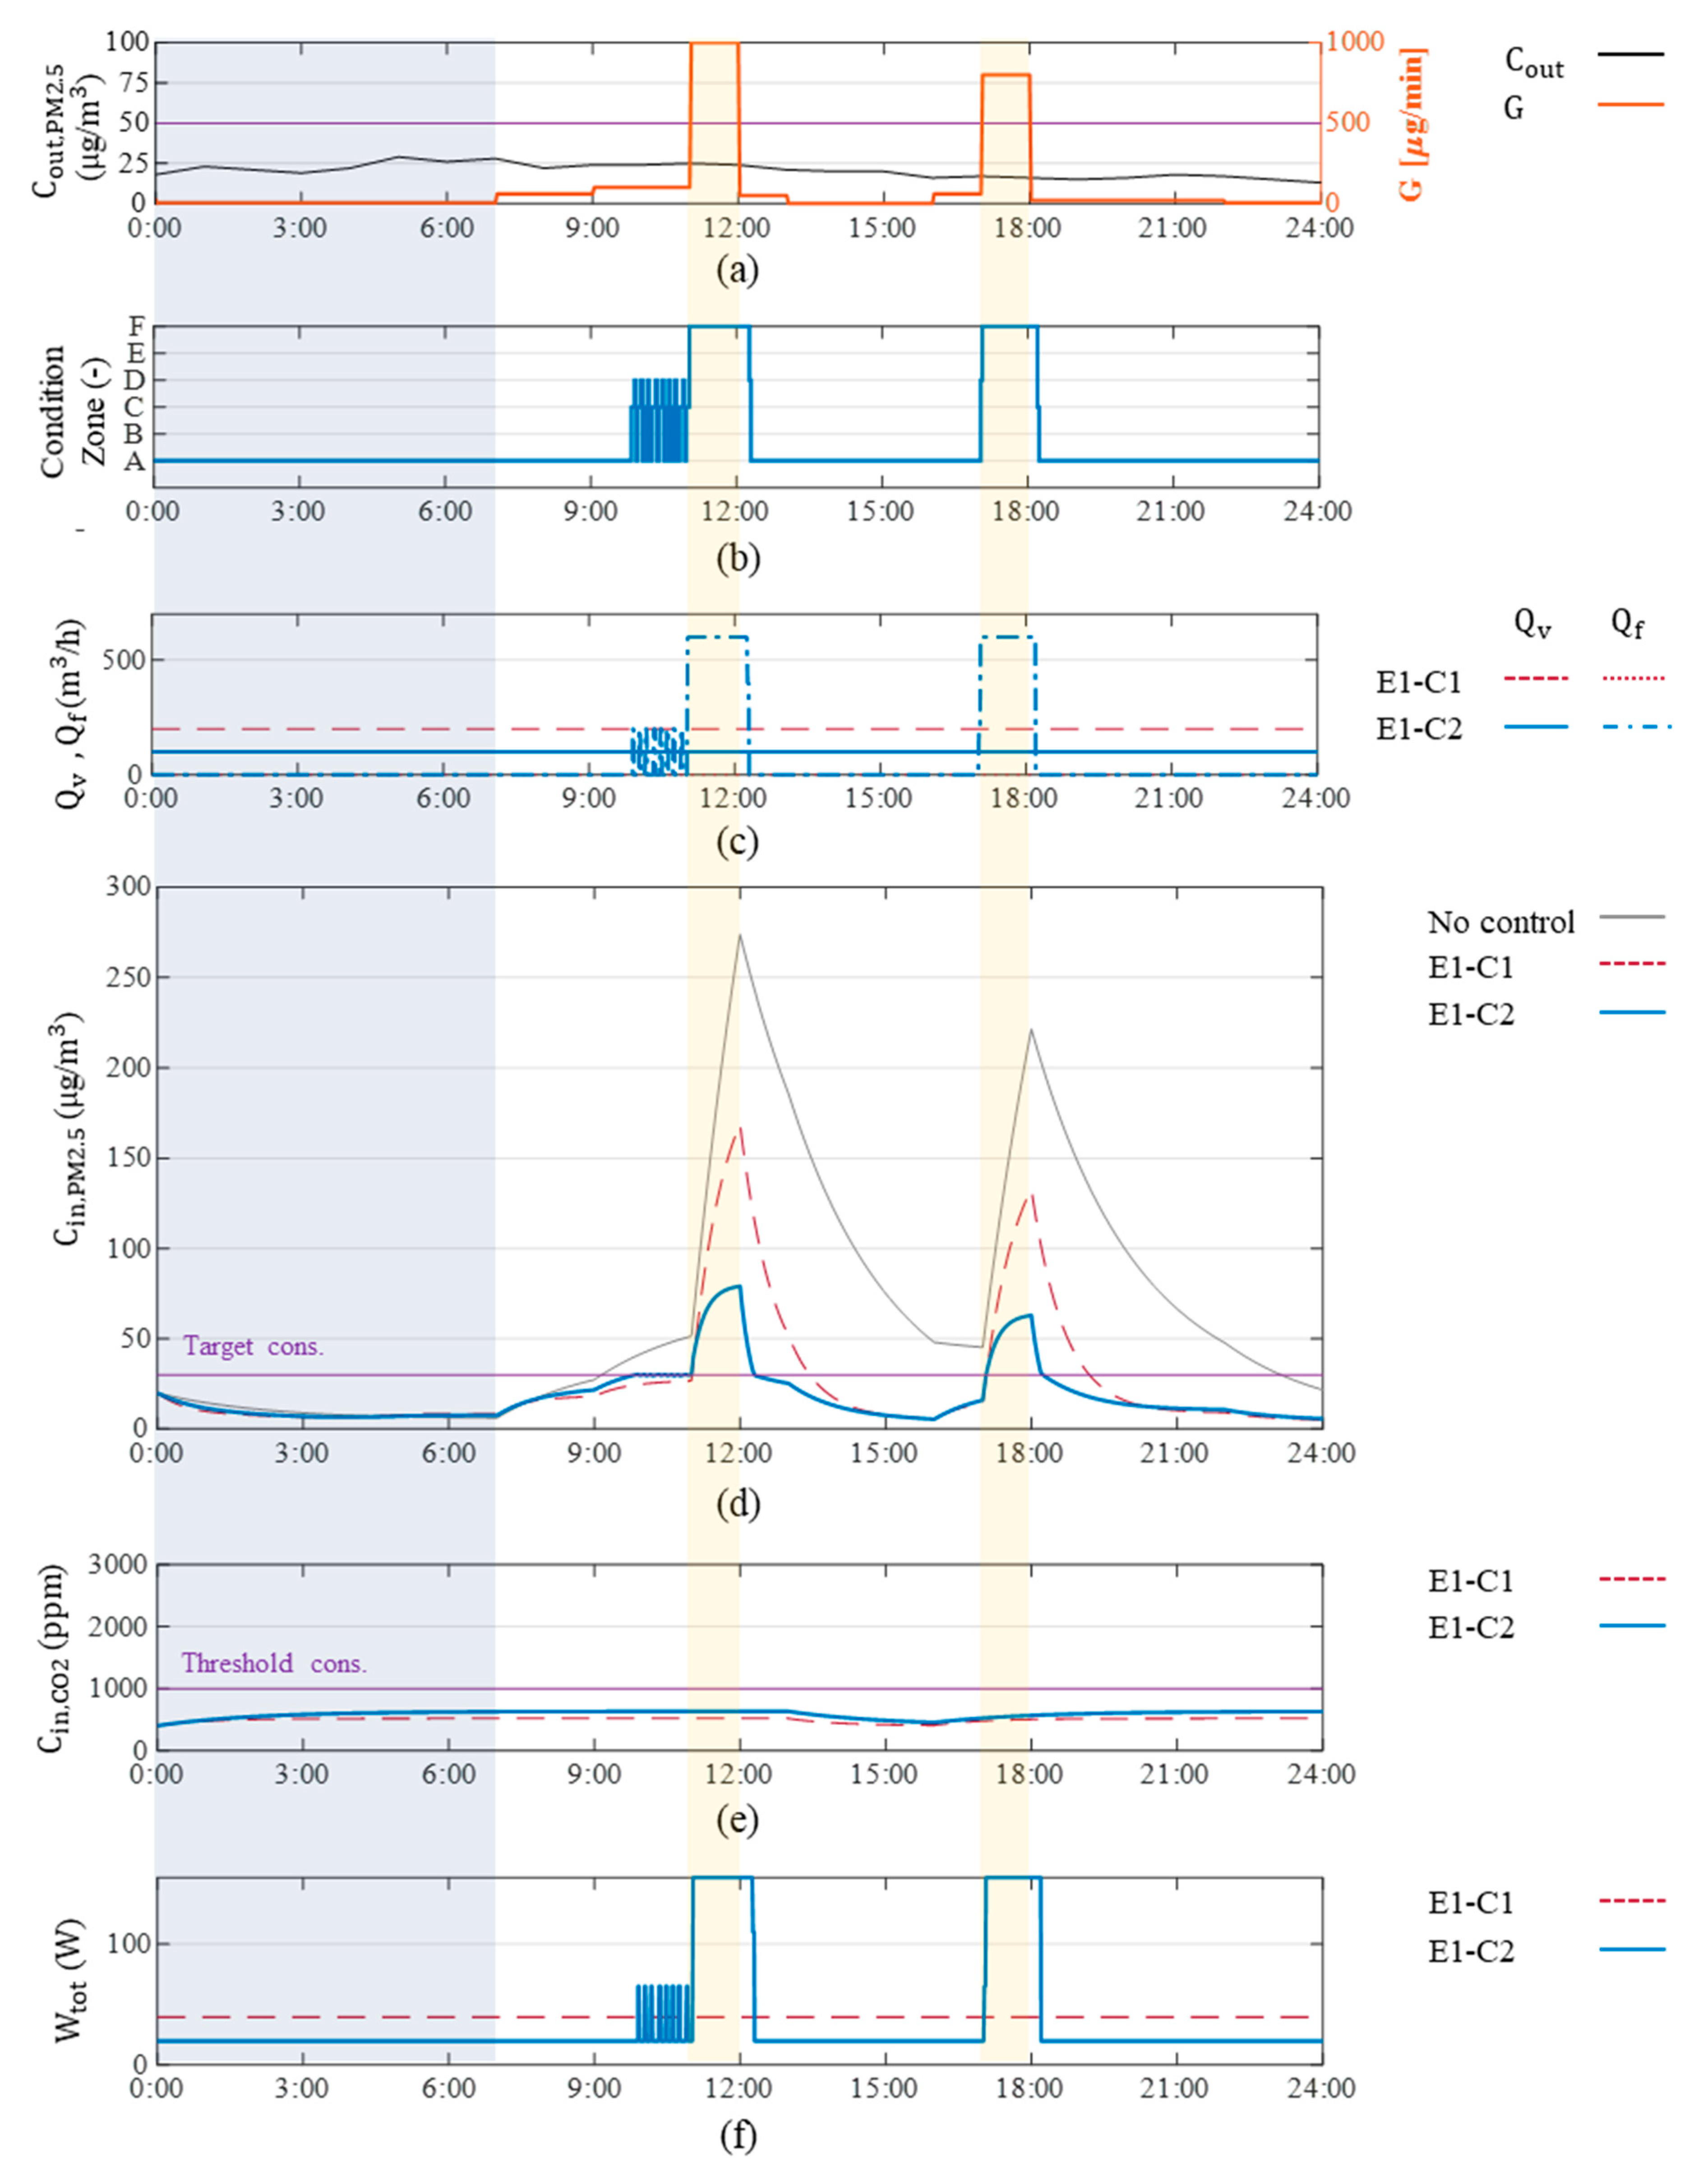
3.3. Results
4. Conclusions
Author Contributions
Funding
Conflicts of Interest
Abbreviations
| Indoor particle concentration () | |
| Outdoor particle concentration ( | |
| Target indoor particle concentration (30 in this study) ( | |
| Indoor CO2 concentration ( | |
| Infiltration/Exfiltration rate ( | |
| Penetration coefficient (-) | |
| Deposition rate ( | |
| Particle removal efficiency of the ventilation system (-) | |
| Particle removal efficiency of the filtration system (-) | |
| Ventilation airflow rate ( | |
| Filtration airflow rate ( | |
| Indoor generation rate ( | |
| Room volume ( | |
| Minimum ventilation flow rate ( | |
| Optimum ventilation flow rate ( | |
| Maximum ventilation flow rate ( | |
| Optimum filtration flow rate ( | |
| Maximum filtration flow rate ( | |
| Y value of CP point, Indoor generation rate ( | |
| X value of CP point, Outdoor particle concentration ( | |
| Y value of IP point, Indoor generation rate ( | |
| X value of IP point, Outdoor particle concentration ( | |
| Time (h) | |
| Fan power of ventilation system ( | |
| Fan power of filtration system ( | |
| Fan power of system ( | |
| Pressure drop of ventilation system ( | |
| Pressure drop of filtration system ( | |
| Ventilation fan efficiency (-) | |
| Filtration fan efficiency (-) | |
| Fan energy of ventilation system during operation with the minimum ventilation rate ( | |
| Fan energy of ventilation system during operation with the optimum ventilation rate ( | |
| Fan energy of filtration system during operation with the optimum filtration rate ( | |
| Ventilation fan operating time ( | |
| Filtration fan operating time ( | |
| Current time (-) |
References
- Hoek, G.; Krishnan, R.M.; Beelen, R.; Peters, A.; Ostro, B.; Brunekreef, B. Long-term air pollution exposure and cardiorespiratory mortality: A review. Environ. Health 2013, 12, 43. [Google Scholar] [CrossRef] [PubMed] [Green Version]
- Shah, A.S.V.; Lee, K.K.; Mcallister, D.A.; Hunter, A.; Nair, H.; Whiteley, W.; Langlish, J.P.; Newby, D.E.; Mills, N.L. Short term exposure to air pollution and stroke: Systematic review and meta-analysis. BMJ 2015, 350, h1295. [Google Scholar] [CrossRef] [PubMed] [Green Version]
- Park, S.-K. Assessing the impact of ozone and particulate matter on mortality rate from respiratory disease in Seoul, Korea. Atmosphere 2019, 10, 685. [Google Scholar] [CrossRef] [Green Version]
- Wu, L.; Luo, X.-S.; Li, H.; Cang, L.; Yang, J.; Yang, J.; Zhao, Z.; Tang, M. Seasonal levels, sources, and health risks of heavy metals in atmospheric PM2.5 from four functional areas of Nanjing city, eastern China. Atmosphere 2019, 10, 419. [Google Scholar] [CrossRef] [Green Version]
- Franck, U.; Odeh, S.; Wiedensohler, A.; Wehner, B.; Herbarth, O. The effect of particle size on cardiovascular disorders—The smaller the worse. Sci. Total Environ. 2011, 409, 4217–4221. [Google Scholar] [CrossRef]
- Kim, K.; Kabir, E.; Kabir, S. A review on the human health impact of airborne particulate matter. Environ. Int. 2015, 74, 136–143. [Google Scholar] [CrossRef]
- Fisk, W.J.; Faulkner, D.; Palonen, J.; Sepanen, O. Performance and costs of particle air filtration technologies. Indoor Air 2002, 12, 223–234. [Google Scholar] [CrossRef] [Green Version]
- Howard-Reed, C.; Wallace, L.; Emmerich, S. Effect of ventilation systems and air filters on decay rates of particles produced by indoor sources in an occupied townhouse. Atmos. Environ. 2003, 37, 5295–5306. [Google Scholar] [CrossRef]
- Jamriska, M.; Morawska, L.; Ensor, D. Control strategies for sub-micrometer particles indoors: Model study of air filtration and ventilation. Indoor Air 2003, 13, 96–105. [Google Scholar] [CrossRef] [Green Version]
- Ben-David, T.; Waring, M.S. Interplay of ventilation and filtration: Differential analysis of cost function combining energy use and indoor exposure to PM2.5 and ozone. Build. Environ. 2018, 128, 320–335. [Google Scholar] [CrossRef]
- Ren, J.; Liu, J.; Cao, X.; Hou, Y. Influencing factors and energy-saving control strategies for indoor fine particles in commercial office buildings in six Chinese cities. Energy Build. 2017, 149, 171–179. [Google Scholar] [CrossRef]
- Ruan, T.; Rim, D. Indoor air pollution in office buildings in mega-cities: Effects of filtration efficiency and outdoor air ventilation rates. Sustain. Cities Soc. 2019, 49, 101609. [Google Scholar] [CrossRef]
- Xie, W.; Fan, Y.; Zhang, X.; Tian, G.; Si, P. A mathematical model for predicting indoor PM2.5 concentration under different ventilation methods in residential buildings. Build. Serv. Eng. Res. Technol. 2020. [Google Scholar] [CrossRef]
- Zhong, X.; Wu, W.; Ridley, I.A. Assessing the indoor PM2.5 exposure impacts of control strategies for residential energy recovery ventilators. J. Build. Eng. 2020, 29, 101137. [Google Scholar] [CrossRef]
- Gallup Korea. Available online: https://www.gallup.co.kr/gallupdb/reportContent.asp?seqNo=1118 (accessed on 5 October 2020).
- Bae, S.H.; Jeong, M.H. Ventilation system for apartment houses with filtering mode. KIAEBS 2017, 11, 23–30. [Google Scholar]
- Chenari, B.; Carrilho, J.D.; da Silva, M.G. Towards sustainable, energy-efficient and healthy ventilation strategies in buildings: A review. Renew. Sustain. Energy Rev. 2016, 59, 1426–1447. [Google Scholar] [CrossRef]
- Cheng, Y.; Zhang, S.; Huan, C.; Oladokun, M.O.; Lin, Z. Optimization on fresh outdoor air ratio of air conditioning system with stratum ventilation for both targeted indoor air quality and maximal energy saving. Build. Environ. 2019, 147, 11–22. [Google Scholar] [CrossRef] [Green Version]
- Fisk, W.J.; De Almeida, A.T. Sensor-based demand-controlled ventilation: A review. Energy Build. 1998, 29, 35–45. [Google Scholar] [CrossRef] [Green Version]
- Guyot, G.; Sherman, M.H.; Walker, I.S. Smart ventilation energy and indoor air quality performance in residential buildings: A review. Energy Build. 2018, 165, 416–430. [Google Scholar] [CrossRef] [Green Version]
- Pantazaras, A.; Santamouris, M.; Lee, S.E.; Assimakopoulos, M.N. A decision tool to balance indoor air quality and energy consumption: A case study. Energy Build. 2018, 165, 246–258. [Google Scholar] [CrossRef]
- Zaatari, M.; Novoselac, A.; Siegel, J. Impact of ventilation and filtration strategies on energy consumption and exposures in retail stores. Build. Environ. 2016, 100, 186–196. [Google Scholar] [CrossRef]
- Ganesh, H.S.; Fritz, H.E.; Edgar, T.F.; Novoselac, A.; Baldea, M. A model-based dynamic optimization strategy for control of indoor air pollutants. Energy Build. 2019, 195, 168–179. [Google Scholar] [CrossRef]
- Liu, H.; Lee, S.; Kim, M.; Shi, H.; Kim, J.; Wasewar, K.; Yoo, C. Multi-objective optimization of indoor air quality control and energy consumption minimization in a subway ventilation system. Energy Build. 2013, 66, 553–561. [Google Scholar] [CrossRef]
- Cho, W.; Song, D.; Hwang, S.; Yun, S. Energy-efficient ventilation with air-cleaning mode and demand control in a multi-residential building. Energy Build. 2015, 90, 6–14. [Google Scholar] [CrossRef]
- Han, K.; Zhang, J.S.; Guo, B. A novel approach of integrating ventilation and air cleaning for sustainable and healthy office environments. Energy Build. 2014, 76, 32–42. [Google Scholar] [CrossRef]
- Kim, J.H.; Yeo, M.S. Effect of flow rate and filter efficiency on indoor PM2.5 in ventilation and filtration control. Atmosphere 2020, 11, 1061. [Google Scholar] [CrossRef]
- Korea Environment Corporation. Airkorea. Available online: www.airkorea.or.kr (accessed on 19 June 2020).
- Ferro, A.R.; Kopperud, R.J.; Hildemann, L.M. Source strengths for indoor human activities that resuspend particulate matter. Environ. Sci. Technol. 2004, 38, 1759–1764. [Google Scholar] [CrossRef]
- Wallace, L.A. Indoor particles: A review. J. Air Waste Manag. Assoc. 1996, 46, 98–126. [Google Scholar] [CrossRef]
- He, C.; Morawska, L.; Hitchins, J.; Gilbert, D. Contribution from indoor sources to particle number and mass concentrations in residential houses. Atmos. Environ. 2004, 38, 3405–3415. [Google Scholar] [CrossRef]
- Kleipis, N.; Ott, W.; Switzer, P.A. Multiple smoker model for predicting indoor air quality in public lounges. Environ. Sci. Technol. 1996, 30, 2813–2820. [Google Scholar] [CrossRef]
- Brauer, M.; Hirtle, R.; Lang, B.; Ott, W. Assessment of indoor fine aerosol contributions from environmental tobacco smoke and cooking with a portable nephelometer. J. Expo. Anal. Environ. Epidemiol. 2000, 10, 136–144. [Google Scholar] [CrossRef] [PubMed] [Green Version]



| Parameters | |||
|---|---|---|---|
| Distribution |  |  |  |
| Average () | 0.7 | 0.4 | 0.13 |
| Variance () | 0.0937 | 0.0065 | 0.0108 |
| Standard deviation () | 0.3060 | 0.0806 | 0.1041 |
| Efficiency of Filter | Operation Mode | ||
|---|---|---|---|
| Step 1 | Step 2 | Step 3 | |
(-) | 0.60 ( = 107 m3/h) | 0.60 ( = 121 m3/h) | 0.70 ( = 145 m3/h) |
(-) | 0.89 ( = 125 m3/h) | 0.80 ( = 245 m3/h) | 0.97 ( = 305 m3/h) |
 | |
| Condition Zone to Which the CP Belongs | Discriminant Equation | |
|---|---|---|
 | CP () Zone A or B | |
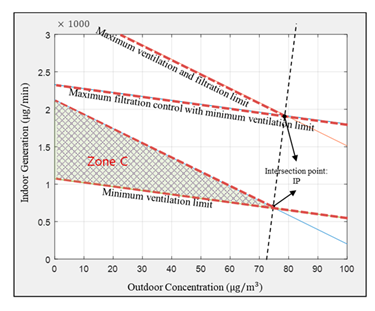 | CP () Zone C | and |
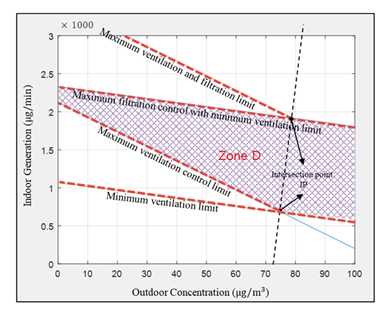 | CP () Zone D | , and |
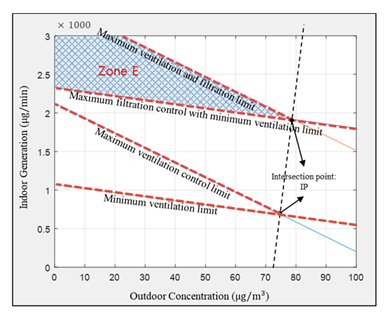 | CP () Zone E | and |
 | CP () Zone F | and |
| Parameters | Value | Unit |
|---|---|---|
| Room volume | 200 | m3 |
| Penetration coefficient | 0.7 | - |
| Deposition rate | 0.4 | h−1 |
| Infiltration rate | 0.06 | h−1 |
| Ventilation | Filtration | ||||
|---|---|---|---|---|---|
| Flow rate () | Filter efficiency (-) | Pressure drop (Pa) | Flow rate () | Filter efficiency (-) | Pressure drop (Pa) |
| 100 (Step 1) | 0.65 | 120 | 200 (Step 1) | 0.95 | 200 |
| 150 (Step 2) | 400 (Step 2) | ||||
| 200 (Step 3) | 600 (Step 3) | ||||
| Level of Outdoor Concentration | Control Method Type | Cases |
|---|---|---|
| E1: Good ~ Normal | Conventional control (C1) | E1-C1 |
| Condition Zone control (C2) | E1-C2 | |
| E2: Bad | Conventional control (C1) | E2-C1 |
| Condition Zone control (C2) | E2-C2 |
| Condition Case | Fan Energy Consumption (Wh) | |
|---|---|---|
| Conventional Control (C1) | Condition Zone Control (C2) | |
| E1 condition | 950.01 | 812.04 (14.5% ) |
| E2 condition | 3246.84 | 912.85 (71.8% ) |
Publisher’s Note: MDPI stays neutral with regard to jurisdictional claims in published maps and institutional affiliations. |
© 2020 by the authors. Licensee MDPI, Basel, Switzerland. This article is an open access article distributed under the terms and conditions of the Creative Commons Attribution (CC BY) license (http://creativecommons.org/licenses/by/4.0/).
Share and Cite
Kim, J.-H.; Kim, H.-G.; Yeo, M.-S. Ventilation and Filtration Control Strategy Considering PM2.5, IAQ, and System Energy. Atmosphere 2020, 11, 1140. https://doi.org/10.3390/atmos11111140
Kim J-H, Kim H-G, Yeo M-S. Ventilation and Filtration Control Strategy Considering PM2.5, IAQ, and System Energy. Atmosphere. 2020; 11(11):1140. https://doi.org/10.3390/atmos11111140
Chicago/Turabian StyleKim, Ji-Hye, Hee-Gang Kim, and Myoung-Souk Yeo. 2020. "Ventilation and Filtration Control Strategy Considering PM2.5, IAQ, and System Energy" Atmosphere 11, no. 11: 1140. https://doi.org/10.3390/atmos11111140
APA StyleKim, J.-H., Kim, H.-G., & Yeo, M.-S. (2020). Ventilation and Filtration Control Strategy Considering PM2.5, IAQ, and System Energy. Atmosphere, 11(11), 1140. https://doi.org/10.3390/atmos11111140


