Article

Numerical Modeling of Formation and Rise of Gas and Dust Cloud from Large Scale Commercial Blasting

Sadovsky Institute of Geosphere Dynamics of the Russian Academy of Sciences, 38-1, LeninskiyProspekt, 119334 Moscow, Russia
*
Author to whom correspondence should be addressed.
Atmosphere 2020, 11(10), 1112; https://doi.org/10.3390/atmos11101112
Submission received: 8 September 2020 / Revised: 13 October 2020 / Accepted: 13 October 2020 / Published: 16 October 2020
(This article belongs to the Special Issue Atmospheric and Ocean Optics: Atmospheric Physics II)

Abstract

:
The emission of dust particles into the atmosphere during rock mass breaking by blasting in ore mining open-pits is one of the factors that determine the ground-level air pollution in the vicinity of pits. The data on dust concentration in the cloud, which is extremely difficult to obtain experimentally for large-scale explosions, is required to calculate the dust dispersion in the wind stream. We have elaborated a Eulerian model to simulate the initial stage of dust cloud formation and rising, and a Navier–Stokes model to simulate thermal rising and mixing with the ambient air. The first model is used to describe the dust cloud formation after a 500 t TNT (Trinitrotoluene equivalent) explosion. The second model based on the Large Eddy Simulation (LES) method is used to predict the height of cloud rising, its mass, and the evolution of dust particles size distribution for explosions of 1–1000 t TNT. It was found that the value of the turbulent eddy viscosity coefficient (Smagorinsky coefficient) depends on both the charge mass and the spatial resolution (grid cell size). The values of the Smagorinsky coefficient were found for charges with a mass of 1–1000 t using a specific grid.

1. Introduction

It is estimated that from hundreds of billions to a trillion t of solid substance are extracted from the lithosphere each year. A significant share of the processed rock mass is accounted for the extraction of mineral resources using open-pit mining [1,2]. Open-pit mining is followed by intensive emission of particulate pollutants, which is a consequence of rock crushing using blasting, drilling, extraction-and-loading works, transportation of rock mass, as well as the transport of dust in the course of wind erosion of made-made massifs of mined-out rocks [3]. According to the data on emissions of particulate pollutants into the atmosphere, the share of mineral extraction is approximately 28% [4] of the total emissions depending on the type of business operation. One of the main problems in areas of mineral resource extraction is associated with deterioration in air quality [5,6]. At the same time, it is important to note that microparticles of human-made origin are more dangerous than natural materials, due to their chemical composition [3,7,8].
Explosive technologies are widely used both for strip mining and for rock crushing, and are especially intensively applied in pits where hard rocks are mined. Modern studies in the field of development of new technologies for extracting mineral resources and shattering hard rocks shows that this situation will prevail in the coming decades [2,9,10,11]. A number of studies indicate that blasting operations are one of the main sources of particulate pollutants in pits [12,13,14,15,16]. It is estimated that more than 50% of the total amount of particulate pollutants released into the near-surface layer of the atmosphere during mining mineral resources in open pits happens to be through large-scale blasts [17]. As an example, we will provide data on the number of large-scale explosions at the Lebedinsky Mining and Processing Plant (Lebedinsky GOK). Thus, the number of explosions with a mass of more than 500 t in the period 1997 to 1999 was an average of 25 explosions per year [14]. Large-scale explosions with a total TNT mass of 3155.2 t were carried out at the Lebedinsky GOK in 2015, and the blasted-out volume of rock mass was 2855 thousand m3 [18]. At the same time, large-scale explosions are carried out once a month. A rough estimation of the annual blast out volume of rock mass at the Lebedinsky GOK gives a value of 34 × 106 m3, and an assessment of the mass of explosives used annually is ≈37.9 × 10⁶ kg. According to statistical reports, the total emissions of particulate pollutants to the atmosphere from all registered sources at the Lebedinsky GOK were 6.28 × 10⁶ kg in 2017, whereas, the total emissions were 7.05 × 10⁶ kg in 2018 [19].
Despite the wide use of large-scale blasting during development of mineral deposits, using open-pit mining, the emission of particulate pollutants into the atmosphere induced by explosions has not been sufficiently studied yet. This is due to a lack of data and unreliability of available tests [20]. The numerical simulations can help to solve the problem. Important information on the dispersion of particles inside and outside the pit is provided by studies on particle transport using local wind streams, taking into account the disturbances created by the complex topology of the excavation and surrounding terrain [21,22,23]. The Reynolds-averaged Navier–Stokes equations are usually solved numerically in these cases, and various turbulent transfer models are used for the determination of the eddy viscosity. A comprehensive review of numerical dust dispersion models developed for predicting the dispersion of particles during the extraction of mineral resources using open-pit mining is presented in Reference [24]. The blast-aided dust cloud is simulated in these calculations by an experimentally defined particle flow from the specified injection regions. The formation of a hot cloud filled with detonation products, air and dust in the vicinity of the explosion epicenter, and the subsequent convective rise of hot gas and dust cloud in the stratified atmosphere are ignored in such models. However, these processes become crucial for dust transfer generated by powerful large-scale (>1 t TNT) explosions. The upper boundary of the gas and dust cloud rises to the heights significantly exceeding the pit depth (hundreds of meters), and the subsequent spread of dust particles is determined by the prevailing winds at these heights. The initial spread of particle mass size distribution, which is formed as a result of the interaction of the explosion with the underlying surface, is modified during the formation and rise of a gas and dust cloud. Therefore, a proper description of the particle dispersion after the cloud has reached the upper position requires defining the concentration of particles in the cloud at this point, which in turn, is associated with the entire complex of gas-dynamic processes that are followed by formation and rise of the gas and dust cloud. It is difficult to determine the distribution of particle concentrations in dust cloud experimentally, and numerical modeling can possibly help to solve the problem.
The development of gas and dust clouds from commercial blasting can be conditionally divided into three stages. The first one is characterized by fast processes (hundreds of milliseconds) starting from the generation of detonation and shock waves and ejection of rock particles of various sizes from the crater formed. Then, the explosion products expand to atmospheric pressure and mix with the air and dust particles. As a result, buoyancy-driven gas and dust flow forms, which are generally called thermal. Over the course of time, the shock waves travel long distances and attenuate. The second stage, which lasts for several minutes, is characterized by a relatively slow rise of the thermal in the stratified atmosphere under the influence of buoyancy forces, its expansion, and entrainment of the surrounding cold air in the course of turbulent mixing [25]. The original quasispherical shape of the cloud of explosion products is destroyed, a toroidal vortex is formed, and the gas and dust cloud acquire a mushroom shape. The cloud rise is limited to the height at which the hydrostatic equilibrium with the ambient air is achieved. The third stage lasts for several hours or more, and the cloud moves at this stage by the action of the wind, continues to mix with the ambient air by the influence of turbulent diffusion, and the dust particles contained in it are gradually settled under the action of gravity force. In this paper, we study the first and second stages of the development of the gas and dust cloud, which make it possible to obtain the initial data for the third stage.
In Section 2, we describe numerical models: Eulerian model to simulate the initial stage of dust cloud formation and rising and Navier–Stokes LES code to simulate thermal rising and mixing with ambient air. In Section 3, the results of dust cloud formation after 500 t TNT explosion obtained with the Eulerian model are predicted. In Section 4, thermal rising is investigated using the Navier–Stokes LES code. In Section 5, we study the evolution of dust particle size distribution during thermal rising. Some conclusions and discussions are presented in the last section.

2. Numerical Models for Describing the Gas and Dust Cloud

The three stages of commercial blasting development described above considerably vary from each other in time scales and the flow pattern of physical processes, and therefore, they are predicted through different physical and numerical models.

2.1. A numerical Model of Fireball Formation (Eulerian Model)

A model of TNT explosive blast was designed to present the development of explosion processes (i.e., the first stage). The model was constructed using the SOVA fluid dynamics software package [26,27]. The Software is capable of simulating complex fluid dynamics processes with strong discontinuities of physical parameters using Euler equations. The model allows accurate describing the boundaries between areas with different physical and chemical properties; in this case, the boundaries between rocks, detonation products, and air. Vortex processes occurring in this stage of development of a gas and dust cloud are described quite successfully by turbulent mixing, which is determined by the numerical viscosity.
It is considered acceptable to use various types of equations of state, analytical expressions, and tabular equations of state. Semi-empirical equations of state for detonation products [28,29,30], tables of thermodynamic properties of air [31], and a table equation of state for quartz obtained using ANEOS software package [32] for rocks were used in the calculations below. Since the hydrodynamic approximation is applied at this stage (without taking into account the strength), the stress tensor is considered to be spherical, which makes it possible to calculate the parameters of the transient crater only (i.e., prior to the modification phase). The model takes into account the impact of gravity force and the atmospheric stratification, for which either standard tables are used, or, if available, the results of meteorological measurements can be used at the time of the experiment.
The following model was applied to describe detonation wave propagation within the scope of the Euler scheme. After the internal energy ε in a cell, through which the shock front passes, increases to a critical value of εcr, the energy value increases by an amount Q ρ d m 0 / ρ e x p , where ρ d m 0 is initial density of the detonating mixture, ρ e x p is current explosive density, which exceeds ρ d m 0 , due to compression in the shock wave, and Q is the heat of the reaction. Such operation ensures total energy conservation, correct detonation velocity, and parameters after the detonation wavefront.
After the detonation wave passes, the pressure in the explosion products increases, which causes blast-wave propagation in the rock, rock deformation, and displacement. The rock is ejected from the edges of the opening-up crater during the excavation stage. The rock is made less compact at the edges of the crater immediately before the ejection. At the time when the density in a cell drops to some critical value ρ c r , the continuous medium in the cell is replaced by a set of particles (particles of dust and stones) of equivalent mass, and its movement is described not as the movement of a solid continuous medium, but as a movement of discrete particles taking into account their interaction with the gas flow. Such a method of generating particles, which later form the gas and dust cloud, was suggested in Reference [33] to describe the process of plume formation when a large-sized cosmic body hits the planet’s surface. The resulting particle size distribution is set either in the form of conventional log-normal law, or (as it was done in the calculations below) based on the available experimental data (analysis of rock samples).
The movement of condensed particles and their interaction with the gas flow is modeled using the standard equations of motion of multiphase mediums [34]. The method of representative-particles (markers) is used to solve these equations [33]. Each such marker represents the movement of many actual dust particles of 105–1010 with proximate trajectories, and accordingly, having proximate velocities, dimensions, and other characteristics. The reference number of such markers in actual calculations is 104–105. Dust diffusion is calculated using the Monte Carlo method. At each time step τ, the particle movement δr is defined as δ r = u τ + j D τ , where D is the diffusion coefficient, u is the particle velocity, and j is a unit vector, whose direction is selected randomly.
The condensed particles exchange heat and momentum with the gas (air, detonation products). The density heat flux is equal to the temperature difference between the particle and the ambient gas, divided by the particle size and multiplied by the coefficient of thermal conductivity of the gas. The equation of motion of representative-particles is used to define the momentum, assuming that it has the shape of a sphere:
M p d u p d t = 3 π d p μ u g u p + C d π d p 2 4 ρ g u g u p u g u p 2 + M p g ,
where u p ,   M p   and   d p are velocity, mass, and diameter of the particle, u g ,   ρ g   and   μ are velocity, density, and dynamic viscosity coefficient of the gas, g is gravitational acceleration, C d is drag coefficient. The first and second term of the right-hand side of Equation (1) combine the Stokes drag force, the predominant effect of which is experienced by the mass at low Reynolds numbers, and the drag force at high Reynolds numbers [35]. A specially designed implicit algorithm for calculating the momentum transfer [26] ensures a proper solution for both large particles which follow ballistic trajectories largely unaffected by the ambient air, and for the case of microparticles that are frozen in the gas stream. The scheme also ensures a proper particle settling limiting velocity (depending on their size) under the influence of gravity force.

2.2. Numerical Model of the Rising Thermal (Navier–Stokes LES Code)

Strong hydrodynamic discontinuities do not occur in the second stage, and the flow rates are subsonic. An important parameter is the turbulent eddy viscosity, which determines the mixing of the hot gas and dust with the ambient cold air, and thus, the size and height of the cloud rise. Therefore, a different (not the Eulerian one that was used in the previous section) model was used to account for these factors. The set of complete Navier–Stokes equations for compressible fluid in subsonic approximation [36] was used at numerical modeling of an axially-symmetric thermal rising. The Large Eddy Simulation (LES) model was used for the separation of large and small eddies. Here are the fundamental simplifications, which are used in the transition to the pattern of subsonic flows. Let us write the energy conservation equation in the form:
ρ ¯ d T ¯ d t ¯ = γ 1 γ d p ¯ d t ¯ + Φ ¯ ,
where it is assumed here that the medium is an ideal gas with the adiabatic ratio γ; ρ, T and p are density, temperature, and pressure; Φ is a set of terms, which include thermal conductivity and viscosity; d / d t ¯ is the total time derivative. The bar symbol at the top means that all marked quantities are written in the dimensionless form, and the following parameters are selected as dimensional: ρ 0 ,   p 0 ,   and   T 0 , i.e., the density, pressure, and temperature at the Earth surface, respectively; the velocity is divided by the value u 0 = r T g , where r T is the radius of the thermal, g is gravitational acceleration. Let us replace the variables:
T = = T ¯ T * ¯ ε T , p = = p ¯ p * ¯ ρ 0 u 0 2 / p 0 = p ¯ p * ¯ γ M 2 ,
where the parameters, which correspond to the atmosphere undisturbed by the explosion, are marked with an asterisk index, M is the Mach number, and ε T = T T T 0 / T 0 is the temperature difference between the initial temperature T T of the thermal and the ambient temperature T 0 . The variation range of variables of T = and p = is from 0 to a value of the order of 1. Equation (2) takes a form in the new variables:
ε T ρ ¯ d T = d t ¯   =   γ 1 M 2 d p = d t ¯ + Φ = ,
where Φ = is the thermal conductivity and viscosity in the new variables, together with the additional members that appear when converting the time derivatives of temperature and pressure to the new variables (members containing T * ¯ z ¯ and p * ¯ z ¯ ). We will proceed in a like manner with the equation of state of an ideal gas
p ¯ = ρ ¯ T ¯ ,
or, in the p =   and   T = variables,
γ M 2 p = + p * ¯ = ρ ¯ ε T T = + T * ¯ .
The terms with M 2 in Equations (4) and (5) are ignored by taking into account the smallness of the Mach number in the processes under review.
Replacing the density derivative with respect to time in the mass conservation equation
d ρ ¯ d t ¯ + ρ ¯ Δ U ¯ = 0
where U ¯ is the velocity vector, by expressions, which were obtained from Equations (4) and (5) after removing the terms with M 2 , leads to the equation
U ¯ = F ,
i.e., leads to the equation that has the same form as in the case of an incompressible liquid, but with the right-hand side of equation.
As noted in Reference [36], the subsonic model allows obtaining results that do not contradict the experiments in a wide range of initial thermal density. At the same time, the difference analog of equations of the asymptotic model allows using much larger time steps than the hyperbolic system of complete Navier–Stokes equations. The MAC (Marker and Cell) method [37] combined with the convergence acceleration of iterative procedure [38] was used to solve the Equations (4)–(6) in the problems under review.
The energy transfer between large-scale and small-scale eddies was simulated by a numerical scheme using the turbulent eddy viscosity determined using LES [39,40]. The LES method, in terms of simplicity of determining turbulent eddy viscosity, occupies an intermediate position between the models with a constant Reynolds number, and multicomponent systems of partial differential equations, which can be obtained for Reynolds-averaged Navier–Stokes equations [41,42]. In applying the LES method, the turbulent eddy viscosity ν T is defined as
ν T = C s m 2 l 2 S ¯ ,
where C s m is the proportionality coefficient (Smagorinsky parameter), l is the size of the mesh cell, and S ¯ is the deformation tensor:
S i j ¯ = 1 2 u i ¯ x j + u j ¯ x i .
We have adopted Einstein’s convention of summation over repeated indices. Simulation of the rise of a high-temperature large-scale thermal [40] illustrated the mesh convergence of the numerical solution to the experimental data at C s m 2 . The value C s m was selected by the trial and error method. However, the similarity of numerical and experimental results at C s m 2 is achieved only on a sufficiently detailed numerical grid. The simulations [40] were run using the axisymmetric, two-dimensional domain. The uniform mesh consisted of 2000 cells in the vertical direction and 500 cells in the radial direction (more than 50 numerical cells per initial radius r T of the thermal, r T = 1000 m, and initial thermal temperature T 0 = 3500 K). It was also shown [40] that a satisfactory match with the experiment can be achieved with coarser grids by reducing the Smagorinsky parameter accordingly, which in this case is also selected by the trial and error method. This allowed us to use coarse grids when investigating the rise of thermals with significantly lower initial temperatures and sizes. Ten points per radius was used in all of the calculations below. The maximum mesh size consisted of 600 cells in the vertical direction and 300 cells in the radial direction.
Vertical transport of the gas and dust mixture by the rising thermal takes several minutes, and both chemical and microphysical processes influence the granulometric composition of the mixture during the gas-dynamic expansion of the cloud. The extent of this influence for chemical explosions is studied insufficiently [43]. Therefore, we limited to a simpler method (in comparison with the previous stage) of determining the dust transport at this stage of development of the gas and dust cloud. The impurity concentration c k transfer equation was used for particles of a given size r k :
ρ ¯ c k t ¯ + U ¯ + V k ¯ Δ c k = d i v ρ ¯ D c k ,
where, as before, U ¯ is the gas-dynamic flow velocity, and a V k ¯ = 0 , v k is the gravitational settling velocity of the particles in undisturbed ambient air. The time to establish a steady-state settling regime is approximately one second, and it is significantly less than the time of thermal rise. The steady-state settling velocity is weakly dependent on the air density up to altitudes of several kilometers. On the basis, therefore, that the settling velocities of the particle sizes being considered could be assumed to be constant, the steady-state settling velocity was determined using Equation (8). The steady-state settling velocity is determined by formula (1) at zero acceleration of the particle. The diffusion coefficient D in Equation (8) was determined from the values of turbulent eddy viscosity ν T subject to the condition that these values are interrelated by the turbulent Schmidt number S c t = ν T / D . The turbulent Schmidt number was selected to be equal to 1.

3. Modeling the Gas and Dust Cloud Initiated by a 500 t TNT Explosion

Simulation of the initial stage of the blast development was considered on the example of 500 t TNT explosions conducted in 1985 and 1987. The initial data were a hemispherical TNT charge with a radius of 6.8 m and a density of 800 kg/m3 placed on a smooth horizontal surface of quartz. The detonation was initiated in the center of the hemisphere at the boundary between explosive material and the rock. The simulations were run using Eulerian model on an axisymmetric, two-dimensional domain. The mesh consisted of 700 cells in both radial and vertical directions. The initial cell size was 10 cm. During the process of cloud extension, the cell size was increased to 3.2 m.
The particle size distribution of the quartz rock ejected during the crater formation was determined in accordance with experimental data [44]. The rock samples were taken near the heap of the ejection funnel. Distribution of rock particles by size was obtained for particles in the range from 2 µm to 200 mm. The particle distribution by size can be written as:
1 m 0 Δ m Δ l n d p = a m d p k ,
where m 0 is the mass of the rock. For the considered 500 t explosion and particles sized from 2 µm to 0.5 mm, a m = 0.0049, k = 0.14 ± 0.01; and for particles sized from 0.5 mm to 200 mm a m = 0.0164, k = 1.13 ± 0.03.
Figure 1 shows the density isolines, spatial distributions of detonation products, rock, and ejected particles during the first 300 ms after the explosion. At the moment when the detonation wave reaches the boundary of the charge, a discontinuity of density, pressure, and velocity occurs, the disintegration of which leads to a blast shock wave in the air and the rarefaction wave in the products of detonation. The rarefaction wave is followed by a shock wave (clearly visible at 10 and 30 ms) moving inside the area of explosion products. This effect, resulting from spherical (or cylindrical) divergence, is well known in explosion physics [45]. The detonation products on the border with air have a higher density than the air’s density, even if it is compressed on the front of the blast wave, and the velocity of the blast wave, and consequently, the explosion product velocity decreases with time. Thus, there is a classic situation of the development of Rayleigh-Taylor instability, i.e., heavy gas slows down in the light one. The instability development, which can be clearly seen in Figure 1, leads to the mixing of the explosion products and air and intimately determines the initial size of the explosion cloud.
In calculations, the initial perturbations are caused by the calculation errors, in particular, by the inability to correctly describe the hemisphere by using the square cells. However, in real-life, very strong perturbations occur at large-scale explosions immediately, which is due to the heterogeneity of the charge. As a rule, the charge surface shape is far from the perfect hemisphere, as it includes ventilation ducts, a chamber for placing the blast unit, etc. All these can result in very strong perturbations occurring immediately when the detonation wave reaches the charge boundary. According to calculations, the initial heterogeneity can increase the size of the formed gas-dust cloud by 10–15%.
The crater begins to form almost immediately after the detonation wave reaches the boundary of the explosive charge and the initial size of the crater coincides with the TNT hemisphere radius. During the first 10–20 ms, the rock particles move from the explosion center at speeds up to 1 km/s. At a later stage, the dust spreads almost diffusely, gradually filling the entire cloud. However, large particles, i.e., stones with a radius of more than one centimeter, move at angles to the horizon not exceeding 45°. At the boundary with the rock, the detonation products are slowed down by friction and because they are forced to bend around the crater’s elevated edges and expanding cloud of particles. As a result, the envelope shock wave specific for the supersonic flow occurs, which is clearly visible at 10 ms after the explosion. This leads to the take-off of the current and cloud from the surface, which is visible after 30 ms from the explosion start.
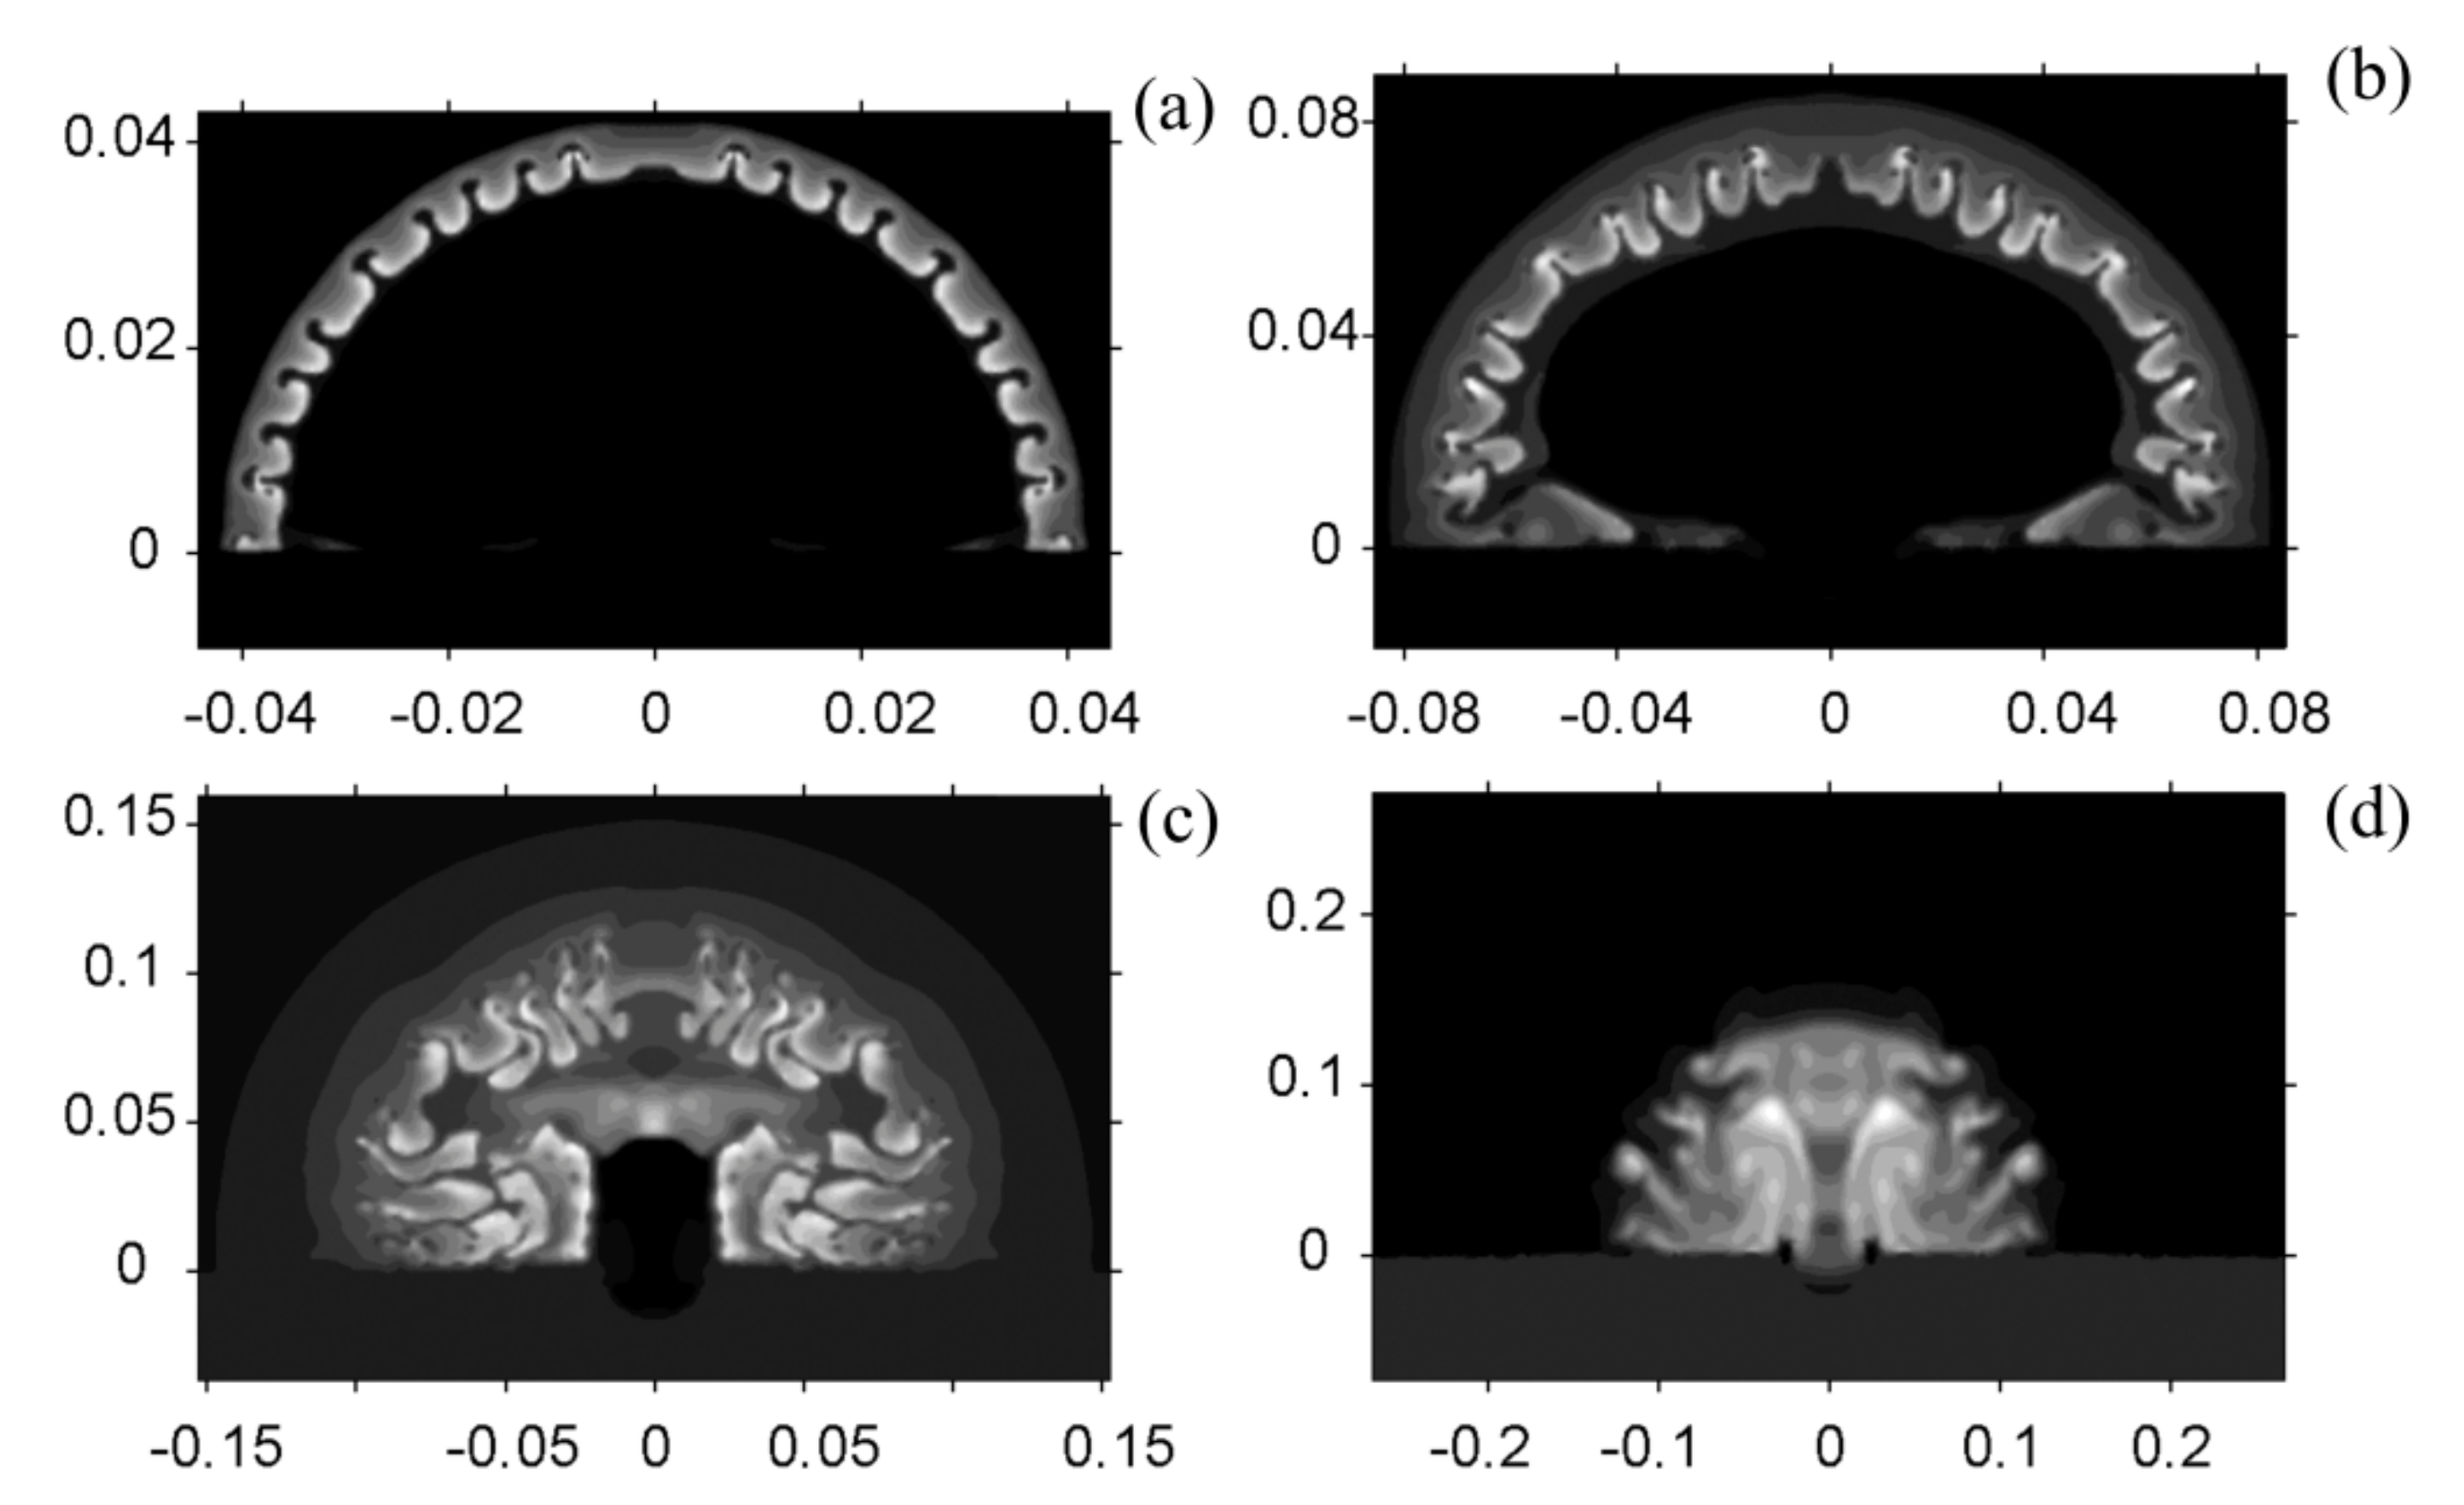
Figure 2 shows the temperature distributions at the same time, as in Figure 1. It is seen that the explosive products are very quickly cooled by adiabatic expansion, while the temperature of the air inside the shock wave reaches several thousand degrees. The explosive product temperature remains lower than the temperature of the heated air till the mixing is complete. The mixing in a narrow hot layer starts almost immediately, which explains the spotted structure of the glowing area described in the experiments [46]. The temperature of the heated gas and dust cloud starting to rise is 1000–1500 K when the shock wave separates from the cloud.
The explosive products have completely mixed with air by 300 ms after the explosion, i.e., the scale of individual particles of products becomes comparable with the size of the counting cell. From this point on, the mixed mixture is considered as a single gas with thermodynamic properties of air. To estimate further propagation of the explosion products, passive markers moving at the velocity of gas are introduced. The markers are assigned to coordinates of cells containing explosive products. Besides, these cells are assigned masses of products that are not involved in calculations, but estimates the product concentrations at any time and point.
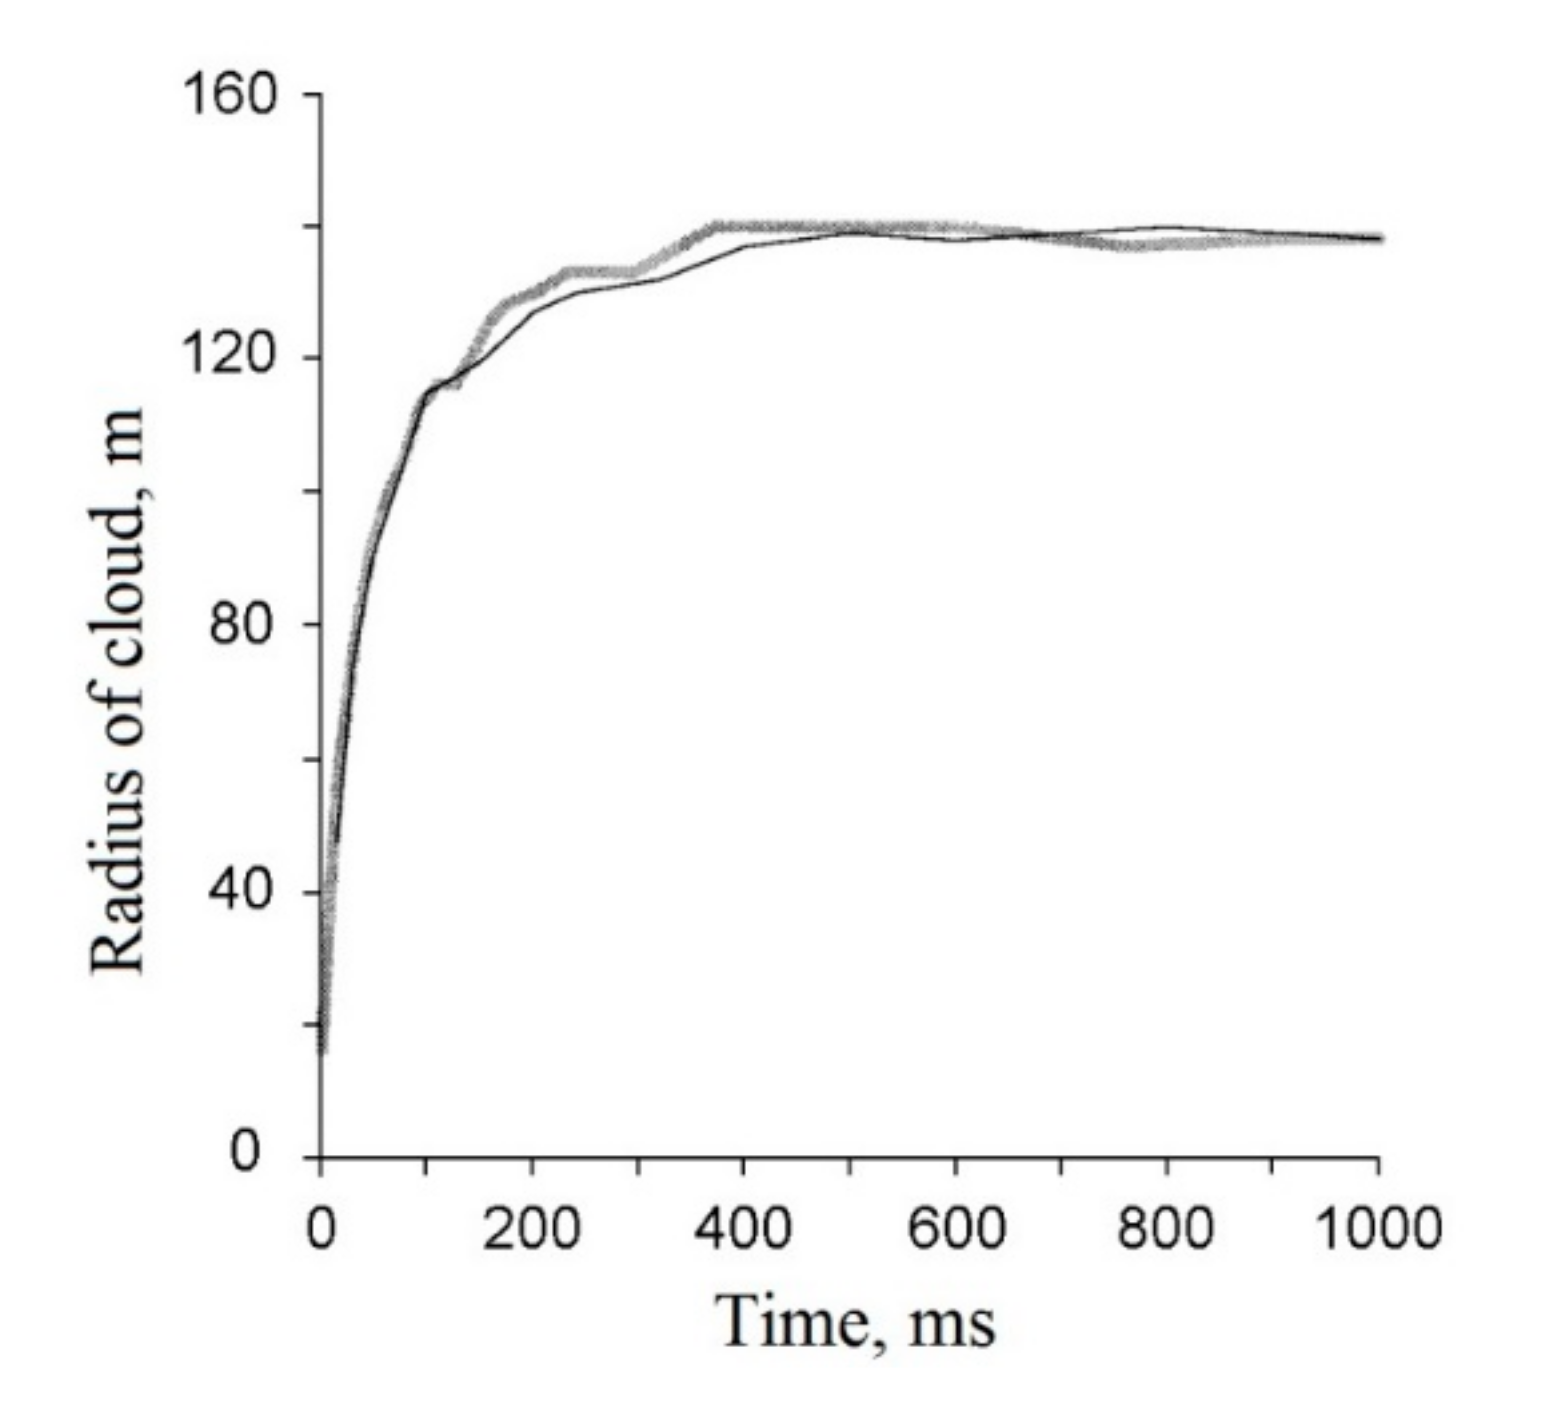
We have compared the calculated data with the results of processing images of 500 t experiments. Figure 3 shows the experimental and calculated time dependencies of the explosion cloud radial size during the first second after the detonation. These dependencies coincide well both qualitatively and quantitatively. However, the good coincidence of the cloud’s geometric size cannot be achieved for the subsequent period of thermal rise. The rise and radius values of the toroidal cloud obtained from the calculations are 1.5–2 times less than those observed. This discrepancy is not related to the volume of dust captured. If the condensed particles are completely removed from the thermal at any timepoint, which can be easily done at calculations, the result practically does not change. The results do not depend on cell size as well. Probably, a reason for such discrepancy is using Eulerian equations with numerical viscosity modeling the real turbulence.
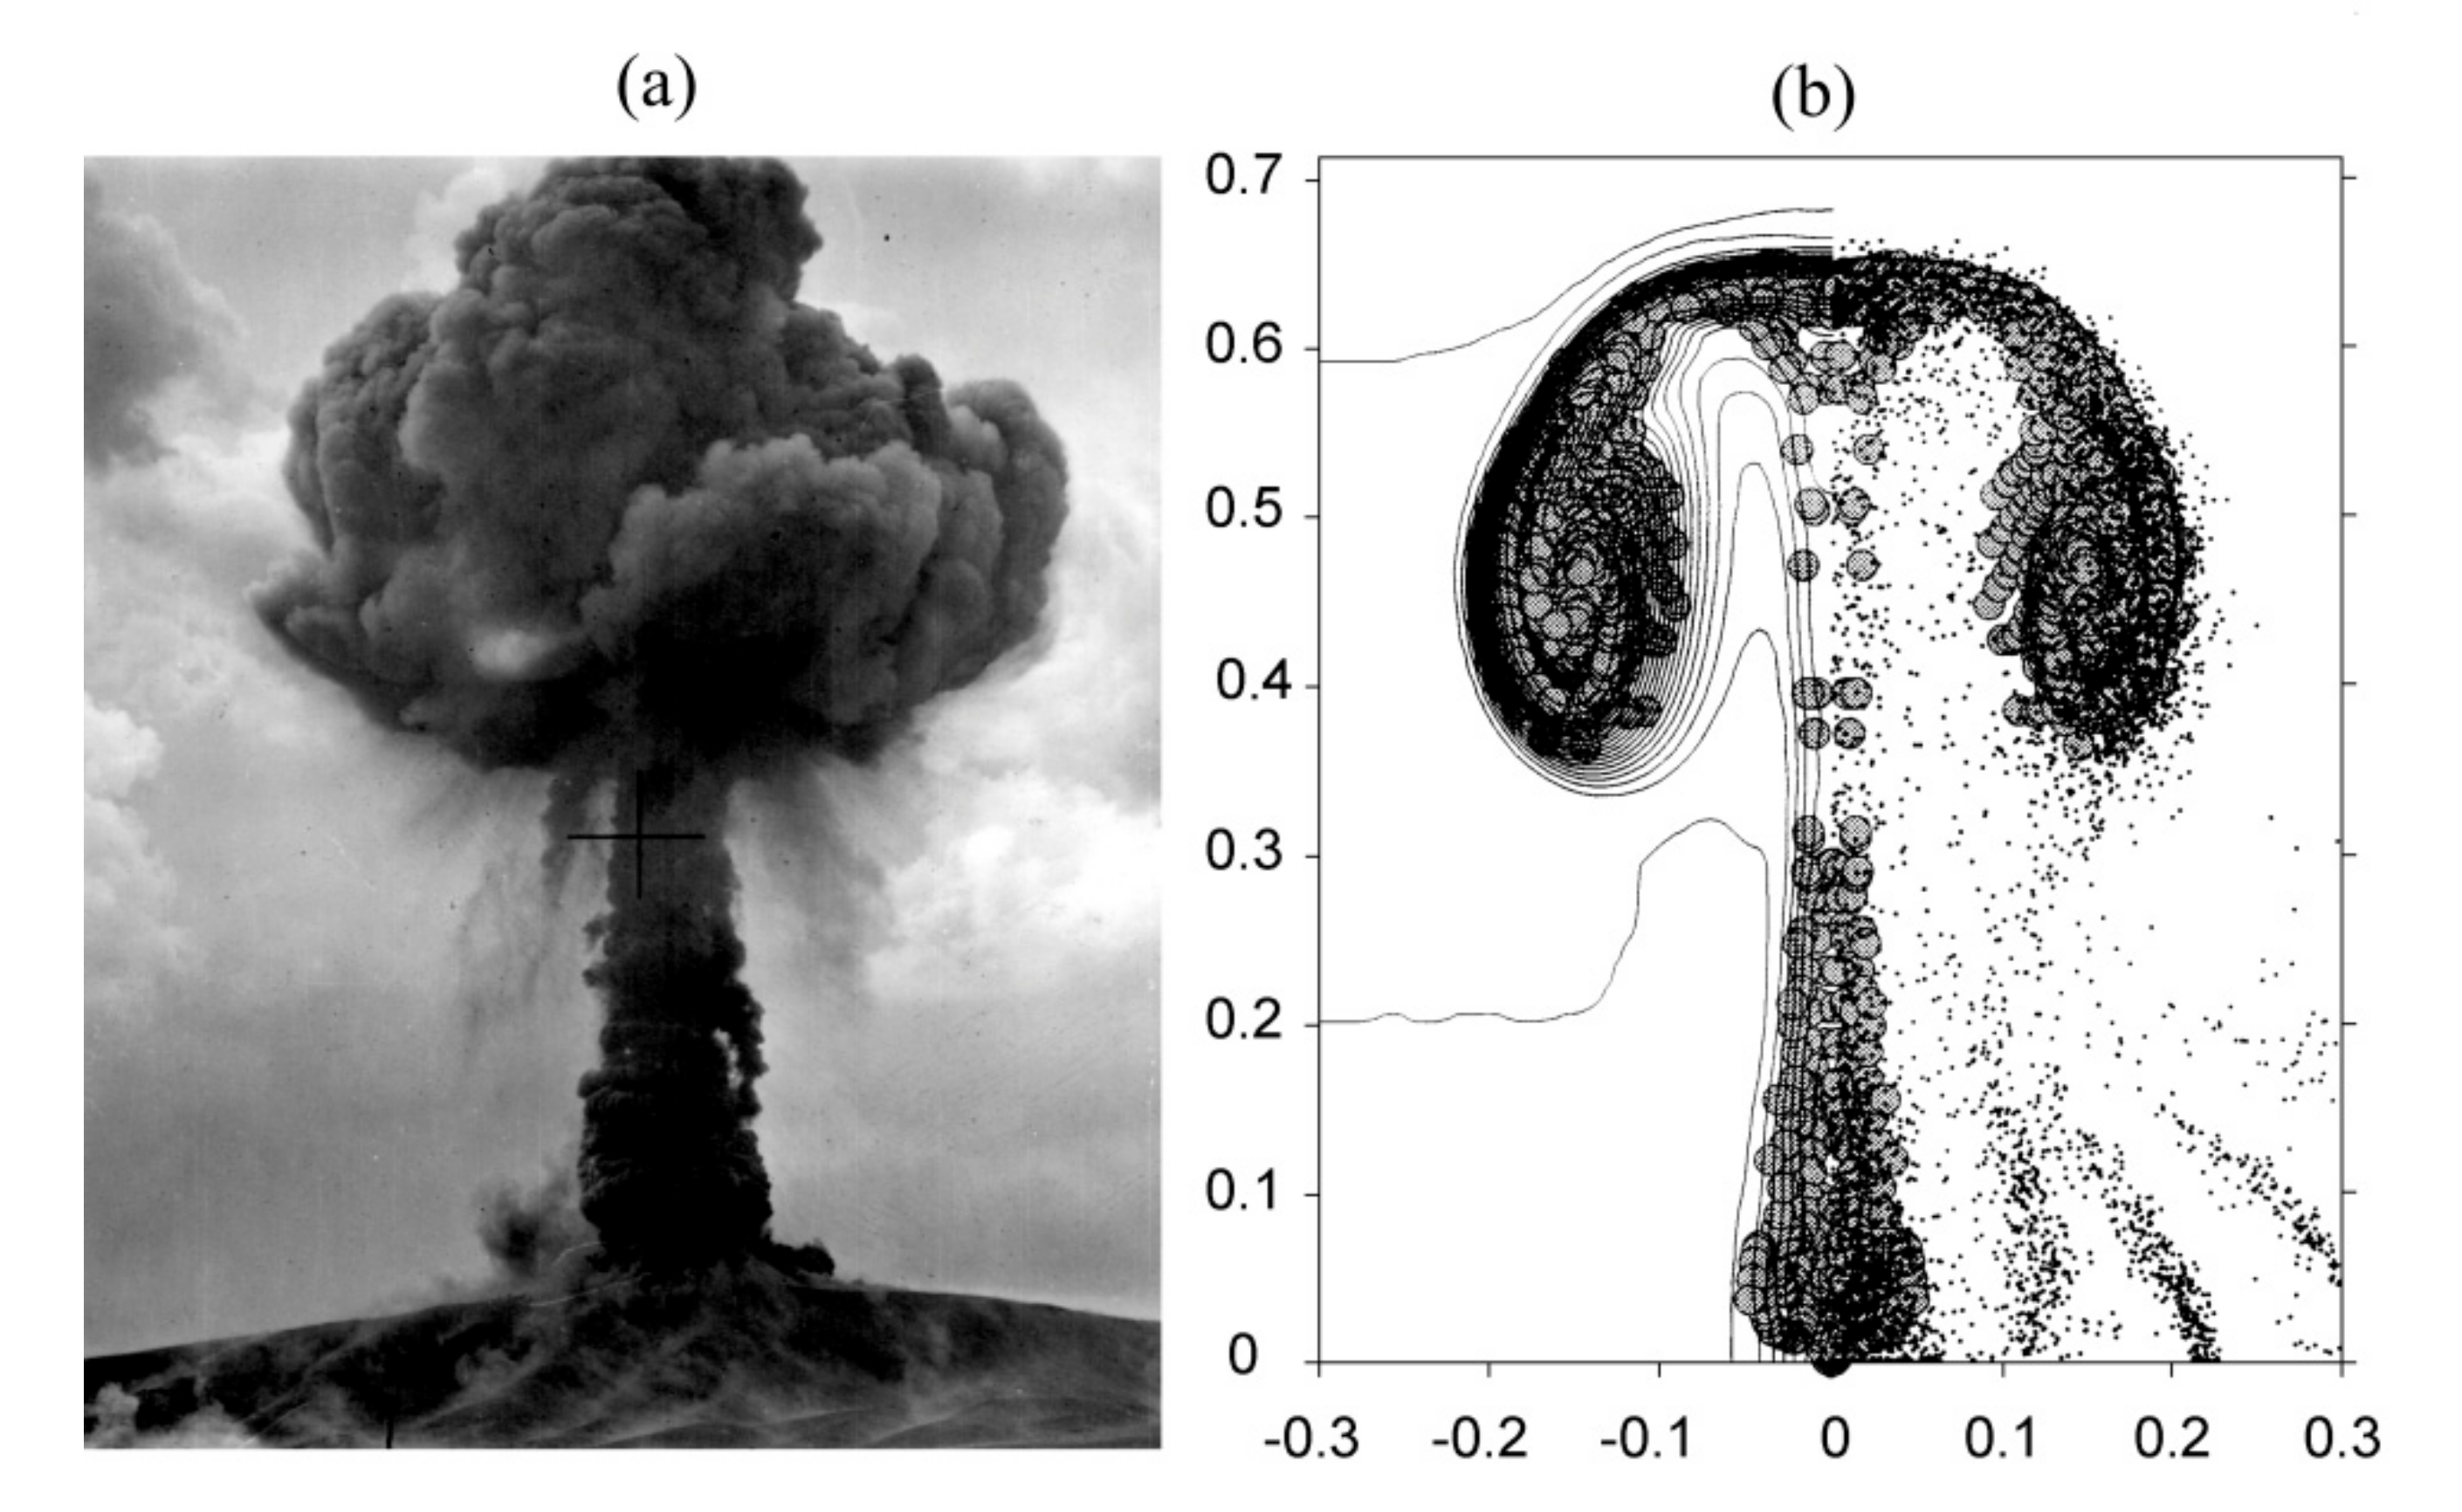
It should be said that a notable difference, for example, of the cloud rise values, was registered for the two different explosions with the same energy 500 t (see Figure 4). Figure 4 shows the time dependencies of the values of clouds upper edge rise. However, the difference between experimental data is still much smaller than that between experimental and calculated data (Figure 4, yellow rectangles). It is possible to get closer to the experimental data if additional heating of the cloud is provided at the timepoint of about 1 s. The calculations have shown that additional 30% of energy release in the cloud’s upper part at this timepoint allows obtaining a picture of thermal rise comparable to the experimental (Figure 4, yellow dots, and Figure 5). Nevertheless, an increase of the initial energy by the same value does not provide the same result.
Figure 4 (curves 3 and 4) also demonstrates the thermal rise calculated with an account of turbulent eddy viscosity at the ad-hoc Smagorinsky coefficients in the Navier–Stokes LES code. Section 4.1 contains the discussion of these curves.
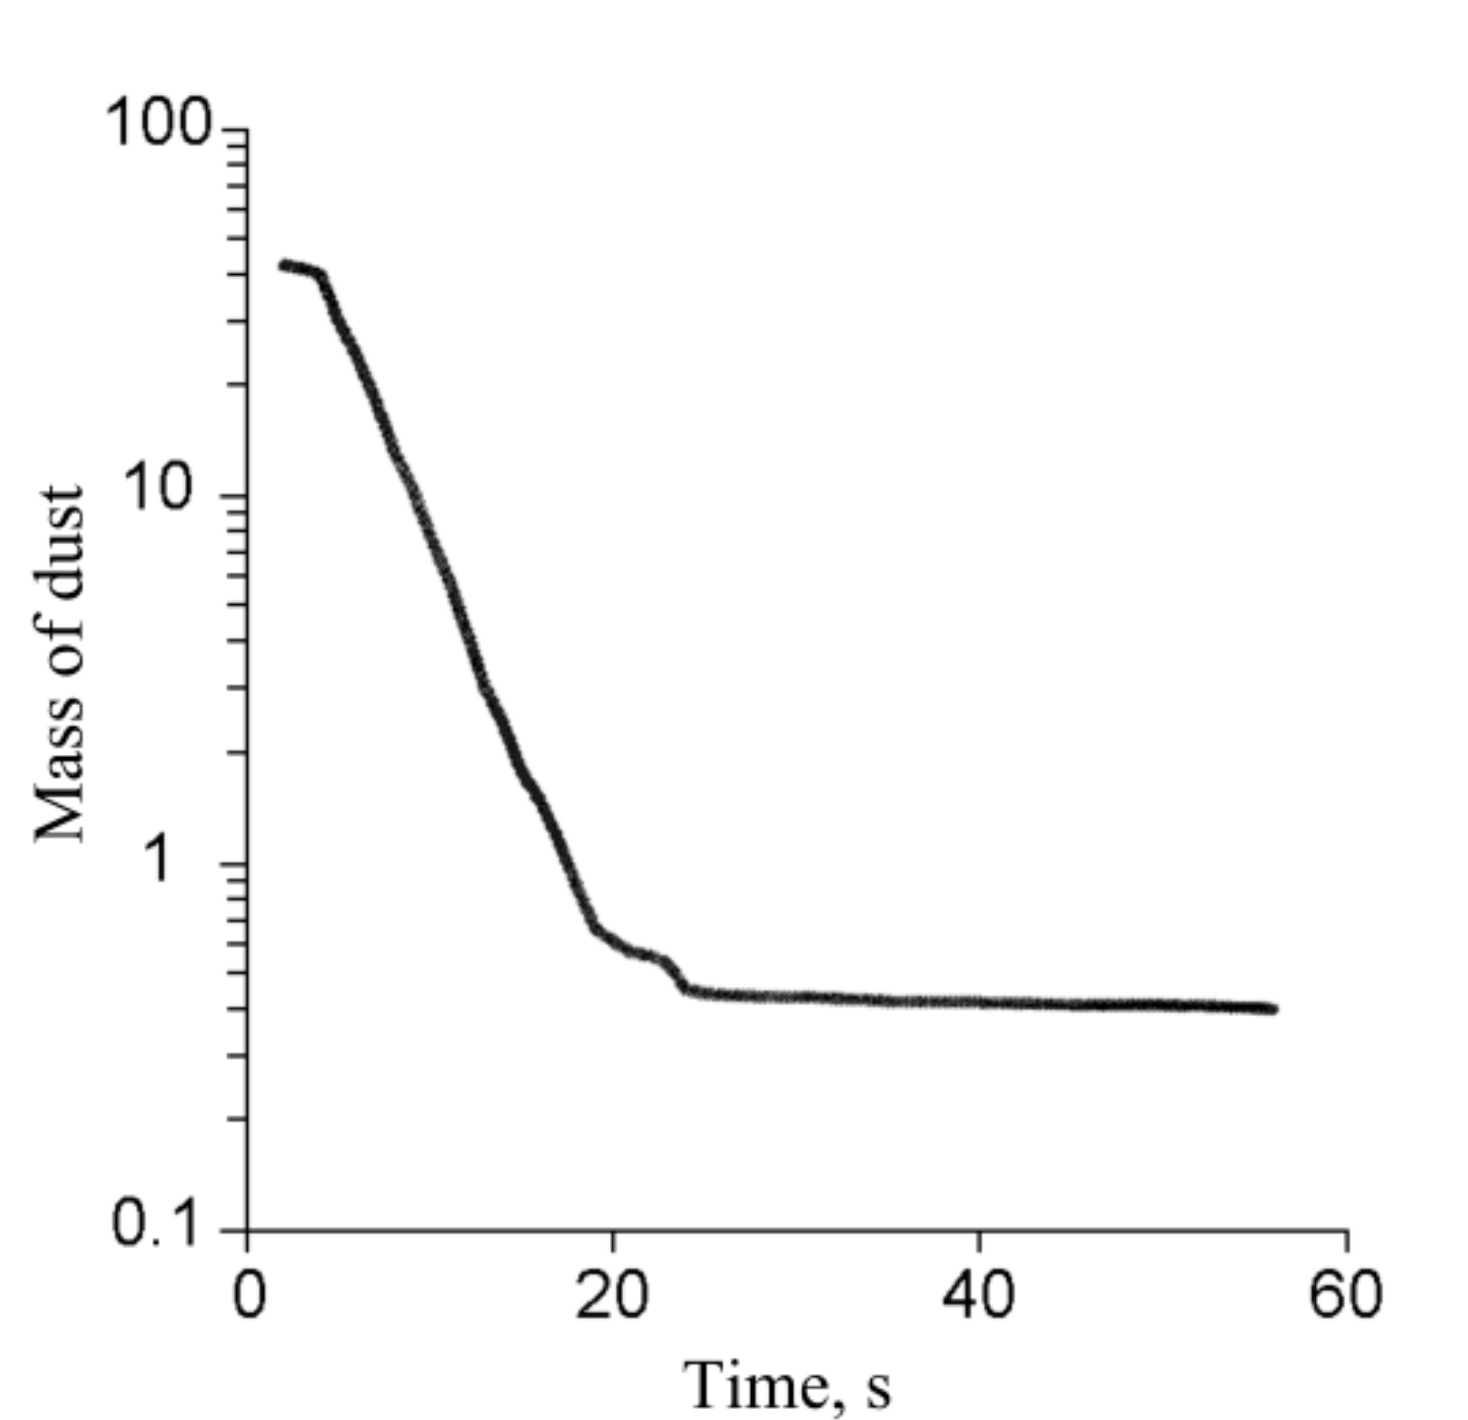
The artificial procedure (additional 30% of energy release) applied to calculate thermal rise allows using the solution for one-minute periods and determining the particle dynamics at the initial stage of rise. Figure 6 shows the time dependence of the total mass of rock particles, including large fragments moving out at the excavation stage. The maximum value of the dust mass and the mass of rock excavated from the crater have the same order of magnitudes. At about 20 s after the explosion, only dust captured by the rising cloud (a little under half of the charge mass) remains in the atmosphere. The size distribution of the mass of particles remaining in the cloud will be given in Section 5 below.
The Eulerian model described in this section allows us to describe the initial stage of dust cloud formation and rising and to estimate its initial size and dust concentration.

4. The Gas and Dust Cloud Rise Initiated by a TNT Explosion

In the previous section, we considered the initial stage of the gas-dust cloud rise (or thermal) without an account of turbulence, which may lead to an error in determining the thermal rise. Now we shall consider the second stage of the explosion more carefully. We assume: (a) This stage starts with the rise of hot gas-dust cloud formed after the charge detonation (about a second after the detonation of a 500 t explosive); (b) the hot gas-dust mixture at the starting moment creates a sphere (thermal, fireball) on the surface; (c) the equation of state for ideal gas has the adiabatic ratio γ = 1.4 both for the thermal and surrounding air; (d) the movement of dust particles in the gas-dynamic flow is described by the contaminant transport equation provided that the velocity of dust particles is equal to the sum of the gas local velocity and rate of unperturbed settling of particles under gravity; (e) the undisturbed atmosphere is described by the standard altitude distribution of gas-dynamic parameters of the windless air [47].

4.1. The Rise of the Thermal Initiated by a 500 t TNT Explosion

Basing on the results of Section 3, we have selected the thermal temperature 1250 K, and its radius 145 m as the initial parameters. The turbulent eddy viscosity parameter of Smagorinsky C s m was determined by comparing the results of numerical simulation with the data of experiments [48] according to which the height of the upper edge of the cloud has been 2300 m at 2 min after the detonation in the case of an explosion with a mass of 500 t. The calculated data are proximal to the experimental ones at C s m = 3.2 . Comparison of the numerical simulation results of the gas and dust cloud height at C s m = 3.2 with the data of the 1985 and 1987 full-scale experiments (Figure 4, curve 3) shows that the numerical simulation describes the 1985 experiment quite well. The eddy viscosity coefficient influences the mixing of the hot cloud with the ambient cold air. The higher the viscosity, the more ambient cold air is captured by the rising cloud, and the lower is its maximum height. By varying the value of C s m one can achieve the best match of the calculated and experimental data of 1987. Closeness to the 1987 experimental curve is achieved at C s m = 1.75 (Figure 4, curve 4). Since we do not know the reasons why the dynamics of the gas and dust cloud rise varies in different experiments with the same charge mass, we use C s m = 3.2 for describing a 500 t explosion. In this case, the calculation results correspond both to the experimental curve of the 1985 explosion and the data provided in Reference [48].
Figure 7 demonstrates the variable fields specific to the gas and dust cloud rise. It describes thermal containing pollution particles with D = 0.01 mm, and the low rate of unperturbed settling equal to 0.006 m/s.
The settling rate is significantly lower than the characteristic flow velocities. The particles behave like passive pollution following the directions of gas-dynamic flows. Most of the passive pollution is contained in the cloud cap, which is convenient for defining its dimensions. As seen in Figure 7a, the cloud’s upper edge has reached a height of 2300 m at 2 min after the explosion. The gas and dust mixture at this moment is still having positive buoyancy β, where β = ρ ρ * / ρ * , ρ—density, and ρ*(z)—density of the undisturbed atmosphere at the height of z (Figure 7b). The major part of the gas and dust mixture is still lighter than the ambient air, and the greatest deviation of the mixture density from the ambient air density is in the toroidal vortex area. As the cloud rises, expands, and mixes with cold air, it cools, and its density becomes higher than that of the ambient air. However, the cloud continues to rise by inertia, maintaining its structure (Figure 7c), and a negative buoyancy area is formed at its top (Figure 7d). The rising speed slows down, and at about 5 min after the explosion, the cloud rises up to its maximum height.
Size of the pollution particles, and consequently, their settling rate influences the ratio between the pollution masses in the column and the cloud cap. The larger the particle’s size, the greater proportion of such particles remains in the column, as the cloud rises (Figure 8). The combination of distributions of particles of all sizes, superimposed on each other, gives the cloud its specific mushroom-like shape corresponding to the image of the natural explosion.
We shall note an important role of diffusion for the cloud column formation. If the diffusion is excluded, then almost the entire mass of pollution particles will be concentrated in the cloud cap irrespective of the range of particle sizes (Figure 9). The thin column of 1–2 countable cells observed near the symmetry axis is a consequence of the boundary condition on the symmetry axis, and usually, it disappears when one considers axisymmetric problems in the 3-D approximation or introduces an artificial mechanism of dissipation near the symmetry axis.

4.2. The Gas and Dust Cloud Rise Initiated by 1–1000 t TNT Explosion

The hydrodynamic similarity of the rapid processes occurring at the thermal formation provides the grounds for recalculation of the initial thermal characteristics for other charge masses. The thermal radius must be proportional to the cube root of the charge mass. According to experimental studies [49],
r T = 1.93 M 0.32 T e x p l / 3600 1 / 3 .
Here, r T is the thermal radius in meters, M is the equivalent mass of explosive in kg, T e x p l is the initial temperature in the charge reaction zone assumed to be 5000 K for TNT explosive. Below, we use the mass of explosives in tonnes. We will denote it by W and rewrite (10) as:
r T = 19.64 W 0.32 .
For a 500 t explosion, the r T value obtained from (11) is approximately the same as we have got from the calculations confirmed by experiments (Figure 3).
If the charge mass reduces, the initial size of thermal decreases, while its initial temperature does not change and remains within a range of 1000–1500 K as in the case of a charge with a mass of 500 t. This follows from the similarity of gas-dynamic flows at the thermal formation stage considered in Section 3. It is confirmed by the high-speed radiometric temperature measurements in experiments with charge masses less than 50 kg [50]. The maximum temperature is maintained during the detonation stage lasting up to 5 ms, then it drops sharply, and the temperature variations for the period from 10 to 50 ms are within a range of 1000–1500 K, so we use 1250 K as the initial temperature in the numerical experiments given below.
To do estimations for a selected spatial resolution, one needs to know the dependence of the Smagorinsky parameter C s m on the charge mass. We apply the described above approach, i.e., selection of the C s m value by a rule of thumb with the use of the computational grid in which there are 10 points per radius. We have adjusted the model by the parameter C s m by comparing the estimated and experimental data [48]. A particular task considered in Reference [48] is to empirically determine the relationship between the height of the cloud upper edge and the explosion mass at 2 min after the detonation. The paper describes a set of investigated blasts, including 74 nuclear and 24 TNT explosions. The experiments data from the two 500 t explosions we referred to above. A ratio for the entire set of explosions has been obtained, and the data provided in Reference [48] clearly show that the heights registered for all blasts included in the set of TNT explosions with equivalent masses from 50 kg to 500 t are much better described by the dependence proposed earlier in Reference [51], and also given in Reference [48]. On the basis of theoretical, laboratory, and experimental studies [48,51], it is shown that the upper edge height H (in meters) at 2 min after the detonation is satisfactorily described by the formula
H = 490   W 1 4 .
We selected the C s m values for explosions with equivalent masses of 1, 3, 10, 30, 100, and 500 t so that the calculated upper edge heights and those estimated according to (12) were close. The dependence of C s m on the explosion mass W is shown in Figure 10a by curve III. The same Figure shows the maximum values of geometric dimensions of the gas and dust cloud at the selected values of C s m W at the time the rise is complete. Figure 10b,c demonstrates the geometrical size dynamics for the selected charge mass values.
The power-law relations between the Smagorinsky parameter, maximum upper-edge height ( H m / r T ), maximum radius of the gas cloud cap ( H / r T ), and the charge mass (Figure 10a) take the forms:
C s m = 7.36   W 0.134 ,
H m = 35.8 W 0.06 r T = 703 W 0.26 ,
R m = 8.9 W 0.09 r T = 175 W 0.23 .
These dependencies allow one, if necessary, to promptly estimate the geometrical characteristics of the gas and dust cloud at the final stage of its rise.

5. The Size Distribution of Dust Particles

The distribution of dust particles within the cloud is very interesting from the viewpoint of air pollution. Let us consider the dust transport within the cloud in more detail. For each particle size, we will define a cap of the cloud of particles of this size CDP (Cap of Dust Particles) as a spherical volume. The CDP radius Rp(t) is defined as the maximum radius of the cloud of particles of considered size, and its center is on the axis at a distance Rp(t) from the top cloud edge. Part of the cloud below the CDP will be called a stipe of dust particles (SDP). CDP and SDP are different for particles of different sizes. As follows from the calculations, the larger the particle size, the smaller the CDP radius. Let the CDP* be the CDP with the maximum radius. The size of CDP* is determined by the transfer of passive pollution (the smallest particles) at the time the cloud rise is complete. The upper-edge height and radius of the CDP* are determined by ratios (14) and (15).
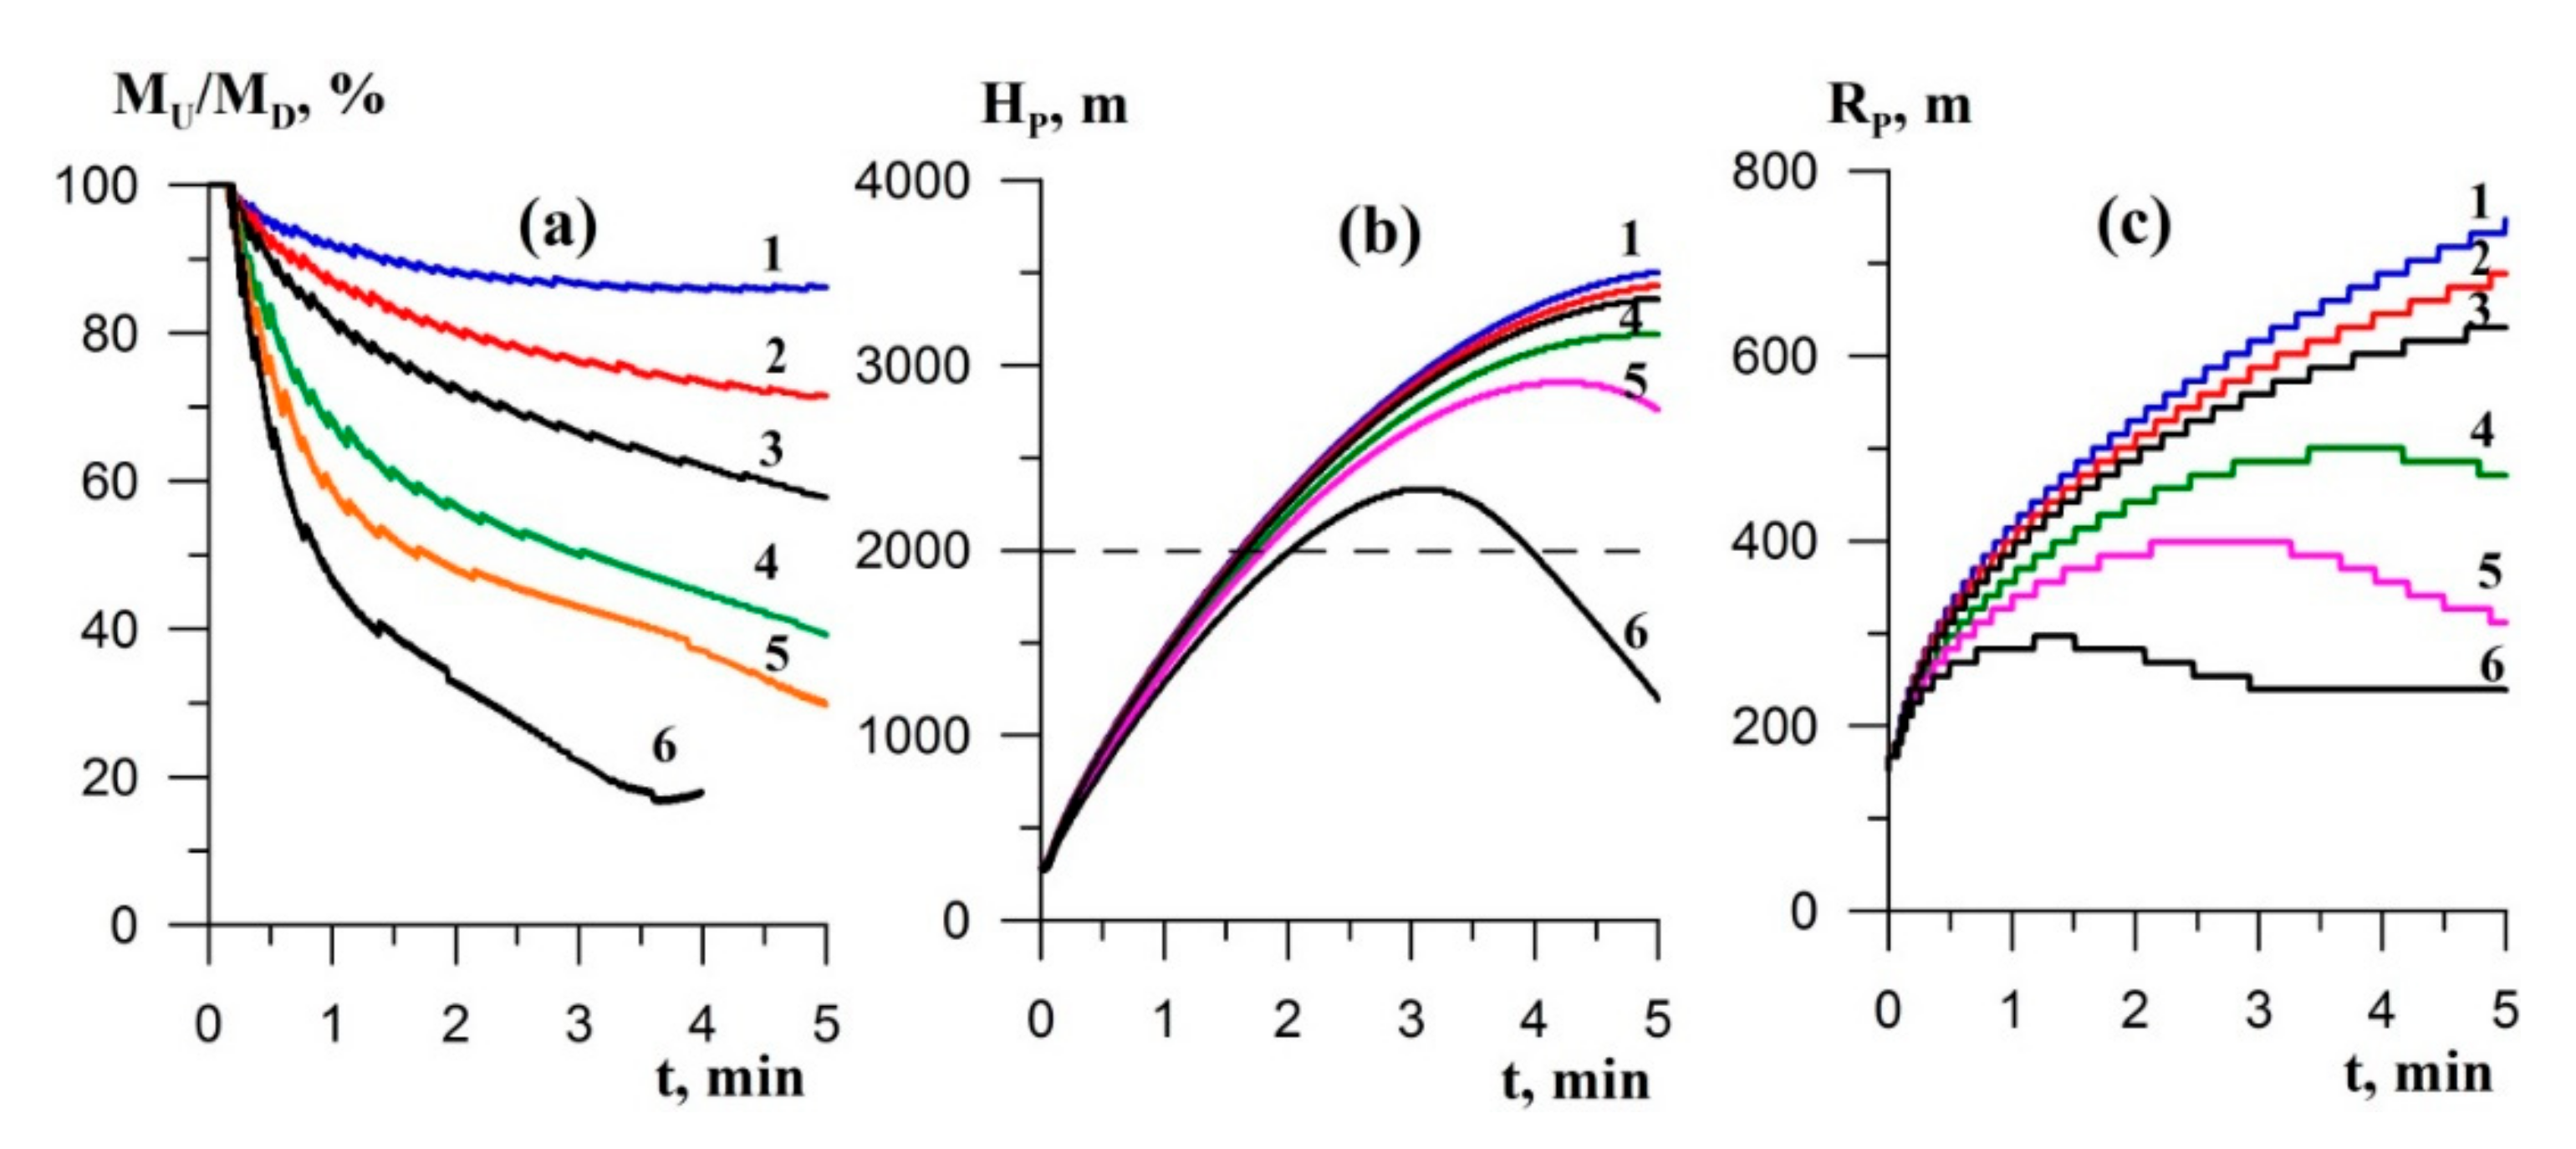
Figure 11a demonstrates the redistribution of particles of different sizes between CDP and SDP in the case of the 500 t TNT explosion. Here M U is the mass of particles of a particular size in CDP, M D is the mass of such particles in CDP and SDP. At the time, the cloud rise is complete (5 min), M U of larger particles is significantly lower than the initial mass M D . The CDP* has a radius of ~700 m. The lower boundary of this volume is marked with a dotted line in Figure 11b. The cloud of particles with r p = 0.3 cm (Figure 11b, curve 6) is partially included into the CDP* during the rise; it rises to its maximum height for 3 min after the detonation, then it starts to sink, and by the time the cloud rise is complete, the particles of the said size have fallen out of the CDP*. Thus, according to our estimation, the 500 t explosion cloud cap includes particles with dimensions not exceeding 0.1–0.3 cm at the time when the cloud rises to its maximum height.
When the charge mass is reduced, the characteristic flow velocities in the gas and dust cloud decrease, and the redistribution of dust particles between CDP and SDP is more influenced by the particle precipitation. Figure 12, similar to Figure 11, shows the redistribution of particles of different sizes between CDP and SDP for a 1 t TNT explosion. In this case, only particles less than 0.01–0.02 cm are left at the time when the gas and dust cloud rise is complete.
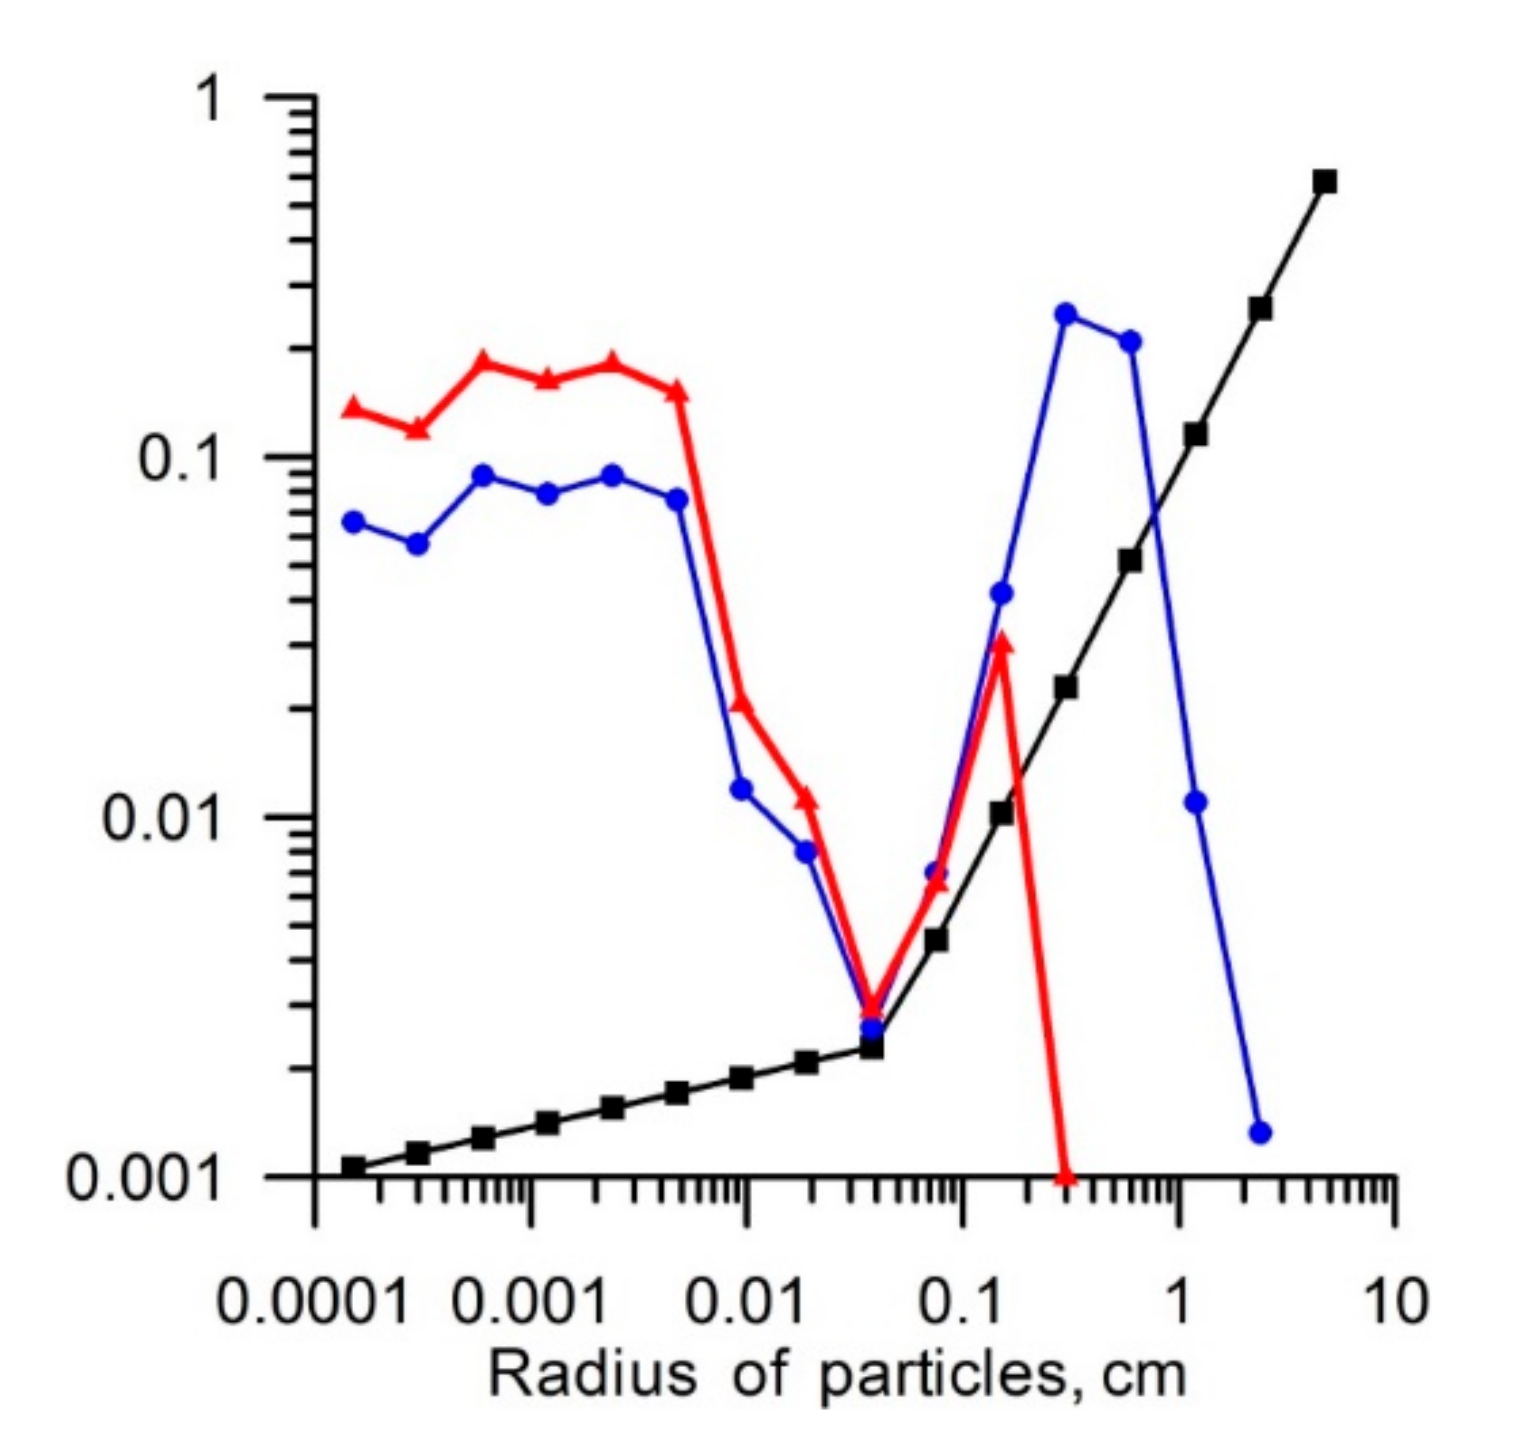
In conclusion, we shall describe the dynamics of the dust particles for a 500 t explosion (Figure 13).
The black curve in Figure 13 shows the initial particle mass distribution by size (9). This distribution is characterized by two branches of the power function. After 30 s, the cloud contains only a part of the particles which mass is about half of the charge mass (Figure 6). The particle mass distribution by size (the blue curve in Figure 13) at this time is characterized by a maximum in the area of particles with a radius of 0.1–1 cm. This is most likely due to the superposition of the two power laws (9) and (1), which can lead to the appearance of a local maximum. All particles captured in the gas and dust cloud for the period of 30 s after the detonation remains in the cloud during its further rise, but there occurs the redistribution of the particles between the CDP and SDP. When the cloud stops to rise, the mass of particles of each size in the CDP is less than the total mass of particles of these sizes in the CDP and SDP. The larger the size of the particles, the smaller the mass of these particles remains in the CDP. Large particles with sizes exceeding 0.1–0.3 cm fall out of the CDP completely. The red curve in Figure 13 demonstrates the final particle distribution by size at the time the cloud stops to rise.

6. Discussion of Results and Conclusions

To estimate the impact of powerful industrial explosions on the environment outside mining operations, one should have data on the pollution source, which in this case, is a mushroom-shaped dust cloud cap. The main parameters of these data include the dust cloud height, horizontal dimension of the dust cap, the dust mass contained in the cloud cap, and distribution of the dust mass by the particle size. The initial gas and dust cloud are formed near the ground surface after the expansion of detonation wave, dust ejection from the crater, and mixing the dust and detonation products with the ambient air. For a 500 t TNT explosion, the duration of the initial gas and dust cloud formation is about one second and proportional to the cube root of the charge mass. The Eulerian numerical model of this stage of the explosion, we have built, allows one to determine the initial size and temperature of the gas and dust cloud, estimate the mass and size distribution of the dust particles contained in the cloud. The resulting gas and dust cloud is lighter than air, due to its high temperature. The cloud starts to rise first, due to buoyancy, then by inertia. In the process of this rise, the size and mass of the cloud is increased by mixing with the ambient air, and at the same time, the mass is reduced by settling of the heaviest particles by gravity. The Navier–Stokes numerical model of this second stage, built by us, allows one to determine the size and maximum rising height of the buoyancy-driven gas and dust cloud, to study the variations of the dust mass and particle size distribution in the cloud during its rise. The performed calculations have shown that variations of the dust mass and particle-size distribution in the cloud during its rise significantly depend on the explosion scale. As the mass of TNT is reduced, the maximum particle size in the cloud cap reduces. Hence, the maximum particle size is linked to explosive mass.
The results show that numerical simulations make it possible to investigate details of explosive processes that are difficult to register and measure during the experiment (e.g., the evolution of particle size distribution). However, the results of the calculations again strongly depend on input parameters that can be reliably determined experimentally directly or indirectly. Here we, first of all, mean constants in Equation (9), which determines the particle mass distribution by size at the initial stage of explosion, and the Smagorinsky coefficient for the model of thermal rise. Tests of the large-eddy simulation turbulence model for the study of thermal rise have shown that the turbulent eddy viscosity coefficient in the used gas-dynamic model depends on the spatial resolution (grid cell size). It is not excluded that this dependence is determined by the numerical viscosity, which is summed up with the turbulent eddy viscosity. The coarser the computational grid, the greater the numerical viscosity becomes. This increase in numerical viscosity is compensated by reducing the turbulent eddy viscosity. Indeed, the increase in cell size requires a decrease in the Smagorinsky coefficient to obtain the same height as the cloud rise. However, one can successfully simulate the gas and dust cloud rise if the numerical solution is configured by the Smagorinsky constant required to match numerical simulations and experimental data. No less important is the question of the value of the turbulent Schmidt number. However, no universally-accepted values of this parameter have been established [52]. Some available values of the turbulent Schmidt number from atmospheric systems literature are given in Reference [52]. Sc t values vary from 0.1 to 2.5, Sc t value of 1 is considered as an acceptable choice. We used this value. However, this question requires further study.
Numerical calculations are significantly less time-consuming than a large-scale experiment with full registration of all related processes. Therefore, a reasonable approach is to carry out separate expensive experiments to build and configure numerical models for using them in mass calculations aimed at solving environmental problems. We have elaborated on the Eulerian numerical model of the dust cloud formation and initial rising, which allows one to determine the initial size and temperature of the gas and dust cloud, to estimate the mass and size distribution of the dust particles contained in the cloud. The specific feature of the model is that an extension of dust is described not as the movement of a solid continuous medium, but as a motion of discrete particles taking into account their interaction with the gas flow. The Navier–Stokes LES code has been elaborated, which allows one to predict the size and maximum rising height of the buoyancy-driven dusty cloud and to study the variations of the dust mass and particle size distribution in the cloud during its rise. However, we cannot now provide a simple relationship for the amount of material in the cloud at it is at the highest point and particle size distributions for different charge masses. It is a problem for future investigations. It was found that the value of the Smagorinsky coefficient depends on both the charge mass and the grid cell size. The values of the Smagorinsky coefficient were found for charges with a mass of 1–1000 t using a specific grid.

Author Contributions

This paper was done in close collaboration of the authors. All authors participated in the main research, as well as original draft writing and editing. All authors have read and agreed to the published version of the manuscript.

Funding

The reported study was funded by RFBR, project number 19-05-50050.

Acknowledgments

Authors are thankful to the editor and anonymous reviewers for valuable suggestions and comments.

Conflicts of Interest

The authors declare no conflict interest.

References

  1. Trubetskoy, K.N.; Galchenko, Y.P. Methodology for estimating promising development paradigm for mineral mining and processing industry. J. Min. Sci. 2015, 51, 407–415. [Google Scholar] [CrossRef]
  2. Viktorov, S.D. The explosive destruction of the rock is the basis of progress in mining. Min. Inf. Anal. Bull. 2015, 1, 63–75. (In Russian) [Google Scholar]
  3. Patra, A.K.; Gautam, S.; Kumar, P. Emissions and human health impact of particulate matter from surface mining operation—A review. Environ. Technol. Innov. 2016, 5, 233–249. [Google Scholar] [CrossRef]
  4. Ministry of Natural Resources of Russia. State Report: On the State and Protection of the Environment of the Russian Federation in 2018; NPP “Kadastr”, Ministry of Natural Resources of Russia: Moscow, Russia, 2019; p. 844. Available online: https://www.mnr.gov.ru/docs/o_sostoyanii_i_ob_okhrane_okruzhayushchey_sredy_rossiyskoy_federatsii/gosudarstvennyy_doklad_o_sostoyanii_i_ob_okhrane_okruzhayushchey_sredy_rossiyskoy_federatsii_v_2018_/ (accessed on 30 August 2020). (In Russian)
  5. Rout, T.K.; Masto, R.E.; Padhy, P.K.; Ram, L.C.; George, J.; Joshi, G. Heavy metals in dusts from commercial and residential areas of Jharia coal mining town. Environ. Earth Sci. 2014, 73, 347–359. [Google Scholar] [CrossRef]
  6. Gautam, S.; Kumar, P.; Patra, A.K. Occupational exposure to particulate matter in three Indian opencast mines. Air Qual. Atmos. Health 2014, 9, 143–158. [Google Scholar] [CrossRef]
  7. Csavina, J.; Field, J.; Taylor, M.P.; Gao, S.; Landázuri, A.; Betterton, E.A.; Sáez, A.E. A review on the importance of metals and metalloids in atmospheric dust and aerosol from mining operations. Sci. Total Environ. 2012, 433, 58–73. [Google Scholar] [CrossRef] [Green Version]
  8. Barrows, A.; Cathey, S.; Petersen, C. Marine environment microfiber contamination: Global patterns and the diversity of microparticle origins. Environ. Pollut. 2018, 237, 275–284. [Google Scholar] [CrossRef] [Green Version]
  9. Zhang, Z.X. Rock Fracture and Blasting. Theory and Applications; Elsevier, Butterworth-Heinemann: Amsterdam, The Netherlands, 2016; p. 528. [Google Scholar]
  10. Michailov, O.Y.; Tarasenko, J.V. Golden jubilee of the iron ore giant of Russia. Gorn. Zhurnal 2017, 5, 15–18. (In Russian) [Google Scholar]
  11. Silva, J.; Worsey, T.; Lusk, B. Practical assessment of rock damage due to blasting. Int. J. Min. Sci. Technol. 2018, 29, 379–385. [Google Scholar] [CrossRef]
  12. Beresnevich, P.V.; Mikhailov, V.A.; Filatov, S.S. Aerology Quarries: Reference Book; Nedra: Moscow, Russia, 1990; 280p. (In Russian) [Google Scholar]
  13. Roy, S.; Adhikari, G.R.; Singh, T.N. Development of emission factors for quantification of blasting dust at surface. J. Environ. Prot. 2010, 1, 346–361. [Google Scholar] [CrossRef] [Green Version]
  14. Adushkin, V.V.; Spivak, A.A.; Soloviev, S.P.; Pernik, L.M.; Kishkina, S.B. Environmental consequences of mass chemical blasting in open pits. Geoekologiya 2000, 6, 554–563. (In Russian) [Google Scholar]
  15. Monjezi, M.; Shahriar, K.; Dehghani, H.; Namin, F.S. Environmental impact assessment of open pit mining in Iran. Environ. Earth Sci. 2008, 58, 205–216. [Google Scholar] [CrossRef]
  16. Fişne, A.; Kuzu, C.; Hüdaverdi, T. Prediction of environmental impacts of quarry blasting operation using fuzzy logic. Environ. Monit. Assess. 2010, 174, 461–470. [Google Scholar] [CrossRef] [PubMed]
  17. Adushkin, V.V.; Weidler, P.G.; Dubovskoi, A.N.; Pernik, L.M.; Popel, S.I.; Friedrich, F. Properties of nano- and microparticles emitted into the environment from open-pit mining of iron deposits. Geol. Ore Depos. 2010, 52, 373–380. [Google Scholar] [CrossRef]
  18. Ugarov, A.A.; Ismagilov, R.I.; Badtiev, B.; Borisov, I.I. State-of-the art and future considerations on drilling-and-blasting system at plants of Metalloinvest. Gorn. Zhurnal 2017, 5, 102–106. [Google Scholar] [CrossRef]
  19. Zvyagintseva, A.V.; Sazonova, S.A.; Kulneva, V.V. Analytical monitoring of the harmful effects at the Lebedinsky Mining and Processing Plant (Lebedinsky GOK) on the environment and improvement of environmental protection measures. Inf. Technol. Build. Soc. Econ. Syst. 2020, 1, 92–99. (In Russian) [Google Scholar]
  20. Sairanen, M.; Rinne, M.; Selonen, O. A review of dust emission dispersions in rock aggregate and natural stone quarries. Int. J. Min. Reclam. Environ. 2017, 32, 196–220. [Google Scholar] [CrossRef]
  21. Silvester, S.; Lowndes, I.S.; Hargreaves, D. A computational study of particulate emissions from an open pit quarry under neutral atmospheric conditions. Atmos. Environ. 2009, 43, 6415–6424. [Google Scholar] [CrossRef]
  22. Joseph, G.; Lowndes, I.S.; Hargreaves, D. A computational study of particulate emissions from Old Moor Quarry, UK. J. Wind. Eng. Ind. Aerodyn. 2018, 172, 68–84. [Google Scholar] [CrossRef]
  23. Torno, S.; Toraño, J.; Menendez, M.; Gent, M. CFD simulation of blasting dust for the design of physical barriers. Environ. Earth Sci. 2010, 64, 73–83. [Google Scholar] [CrossRef]
  24. Reed, W.R. Significant Dust Dispersion Models for Mining Operations; NIOSH-Publications Disseminations: Cincinnati, OH, USA, 2005; p. 27. [Google Scholar]
  25. Belotserkovskiy, O.M.; Andrushchenko, V.A.; Shevelev, Y.D. Dynamics of Spatial Vortex Flows in an Inhomogeneous Atmosphere: Computational Experiment; Yanus: Moscow, Russia, 2000; p. 456. (In Russian) [Google Scholar]
  26. Shuvalov, V. Multi-dimensional hydrodynamic code SOVA for interfacial flows: Application to the thermal layer effect. Shock Waves 1999, 9, 381–390. [Google Scholar] [CrossRef]
  27. Shuvalov, V.; Artem’Eva, N.; Kosarev, I. 3D hydrodynamic code sova for multimaterial flows, application to Shoemakerlevy 9 comet impact problem. Int. J. Impact Eng. 1999, 23, 847–858. [Google Scholar] [CrossRef]
  28. Andreyev, S.G.; Babkin, A.V.; Baum, F.A.; Imkhovik, N.A.; Kobylkin, I.F.; Kolpakov, V.I.; Ladov, S.V.; Odintsov, V.A.; Orlenko, L.P.; Okhitin, V.N.; et al. Explosion Physics, 3rd ed.; Fizmatlit: Moscow, Russia, 2004; Volume 1, p. 823. (In Russian) [Google Scholar]
  29. Andreyev, S.G.; Babkin, A.V.; Baum, F.A.; Imkhovik, N.A.; Kobylkin, I.F.; Kolpakov, V.I.; Ladov, S.V.; Odintsov, V.A.; Orlenko, L.P.; Okhitin, V.N.; et al. Explosion Physics, 3rd ed.; Fizmatlit: Moscow, Russia, 2004; Volume 2, p. 648. (In Russian) [Google Scholar]
  30. Vasil’yev, A.A.; Zhdan, S.A. Parameters of a shock wave in the explosion of a cylindrical explosive charge in air. Fiz. Goreniya Vzryva 1981, 17, 99–105. (In Russian) [Google Scholar]
  31. Kuznetsov, N.M. Thermodynamic Functions and Shock Adiabats of Air at High Temperatures; Mashinostroyeniye: Moscow, Russia, 1965; p. 465. (In Russian) [Google Scholar]
  32. Tompson, S.L.; Lauson, H.S. Improvements in the Chart D Radiation-Hydrodynamic CODE III: Revised Analytic Equation of State; Report SC-RR-71 0714; Sandia National Laboratory: Albuquerque, NM, USA, 1974; p. 121.
  33. Teterev, A.V. Cratering model of asteroid and comet impact on a planetary surface. Int. J. Impact Eng. 1999, 23, 921–932. [Google Scholar] [CrossRef]
  34. Nigmatulin, R.I. Dynamics of Multiphase Media; Hemisphere Publishing Corporation: New York, NY, USA, 1990; Volume 2, p. 507. [Google Scholar]
  35. Landau, L.D.; Lifshitz, E.M. Course of theoretical physics. In Fluid Mechanics, 2nd ed.; Pergamon Press: Oxford, UK, 1987; Volume 6, p. 554. [Google Scholar]
  36. Zatevakhin, M.A.; Kuznetcov, A.E.; Nikulin, D.A.; Strelets, M.K. Numerical simulation of the process of levitation of a system of high-temperature turbulent thermals in an inhomogeneous compressible atmosphere. High Temp. 1994, 32, 42–55. [Google Scholar]
  37. Harlow, F.H.; Welch, J.E. Numerical calculation of time-dependent viscous incompressible flow of fluid with free surface. Phys. Fluids 1965, 8, 2182. [Google Scholar] [CrossRef]
  38. Viecelly, J.A. A computing method for incompressible flows bounded by moving walls. J. Comp. Phys. 1971, 8, 119–143. [Google Scholar] [CrossRef]
  39. Lesier, M.; Metais, O. New trends in large-eddy simulations of turbulence. Annu. Rev. Fluid Mech. 1996, 28, 45–82. [Google Scholar] [CrossRef]
  40. Hazins, V.M. Approach in Problems on floating up of high temperature thermals in stratified atmosphere. High Temp. 2010, 48, 402–410. [Google Scholar] [CrossRef]
  41. Launder, B.E.; Spalding, D.B. The numerical computation of turbulent flows. Comput. Methods Appl. Mech. Eng. 1974, 3, 269–289. [Google Scholar] [CrossRef]
  42. Anderson, D.A.; Tannehill, J.C.; Pletcher, R.H. Computational Fluid Mechanics and Heat Transfer; Hemisphere Publishing Corporation: New York, NY, USA, 1984; p. 599. [Google Scholar]
  43. Sreekantha, B.; Anand, S.; Ikkurthi, V.R.; Chaudhury, P.; Sapra, B.K.; Mayya, Y.S.; Chaturvedi, S. Evolution of particle metrics in a buoyant aerosol cloud from explosive releases. Aerosol Sci. Technol. 2020, 54, 656–667. [Google Scholar] [CrossRef]
  44. Ivanov, B.A.; Bazilevskiy, A.T. On the fragment-size distribution of ejecta of impact craters. In Proceedings of the Lunar and Planetary Science XIV, Houston, TX, USA, 14–18 March 1983; pp. 345–346. [Google Scholar]
  45. Brode, H.L. The Blast Wave in Air Resulting from a High Temperature, High Pressure Sphere of Air (U); RAND Corporation: Santa Monica, CA, USA, 1956; Available online: https://www.rand.org/pubs/research_memoranda/RM1825.html (accessed on 30 August 2020).
  46. Rozhdestvenskiy, V.B.; Khristoforov, B.D.; Yur’yev, V.L. Influence of the Rayleigh-Taylor instability on the radiation characteristics of an explosive explosion in air. Prikl. Mekhanika Tekhnicheskaya Fiz. 1989, 5, 107–114. (In Russian) [Google Scholar] [CrossRef]
  47. State Standard 4401-81: Standart Atmosphere: Parameters; Izdatel’stvo Standartov: Moscow, Russia, 1982; p. 181. Available online: https://files.stroyinf.ru/Data2/1/4294823/4294823872.pdf (accessed on 30 August 2020). (In Russian)
  48. Church, H. Cloud Rise from High-Explosives Detonations; Office of Scientific and Technical Information (OSTI): Albuquerque, NM, USA, 1969. [Google Scholar]
  49. Kansa, E.J. Time-Dependent Buoyant Puff Model for Explosive Sources; Technical Report UCRL-ID-128733; Lawrence Livermore National Laboratory: Livermore, CA, USA, 1997.
  50. Spidell, M.T.; Gordon, J.M.; Pitz, J.; Gross, K.C.; Perram, G.P. High speed radiometric measurements of IED detonation fireballs. SPIE Def. Secur. Sens. 2010, 7668, 76680. [Google Scholar] [CrossRef]
  51. Morton, B.R.; Taylor, G.I.; Turner, J.S. Turbulent gravitational convection from maintained and instantaneous sources. Proc. R. Soc. Lond. Ser. A Math. Phys. Sci. 1956, 234, 1–23. [Google Scholar] [CrossRef]
  52. Gualtieri, C.; Angeloudis, A.; Bombardelli, F.; Jha, S.; Stoesser, T. On the values for the turbulent Schmidt number in environmental flows. Fluids 2017, 2, 17. [Google Scholar] [CrossRef] [Green Version]
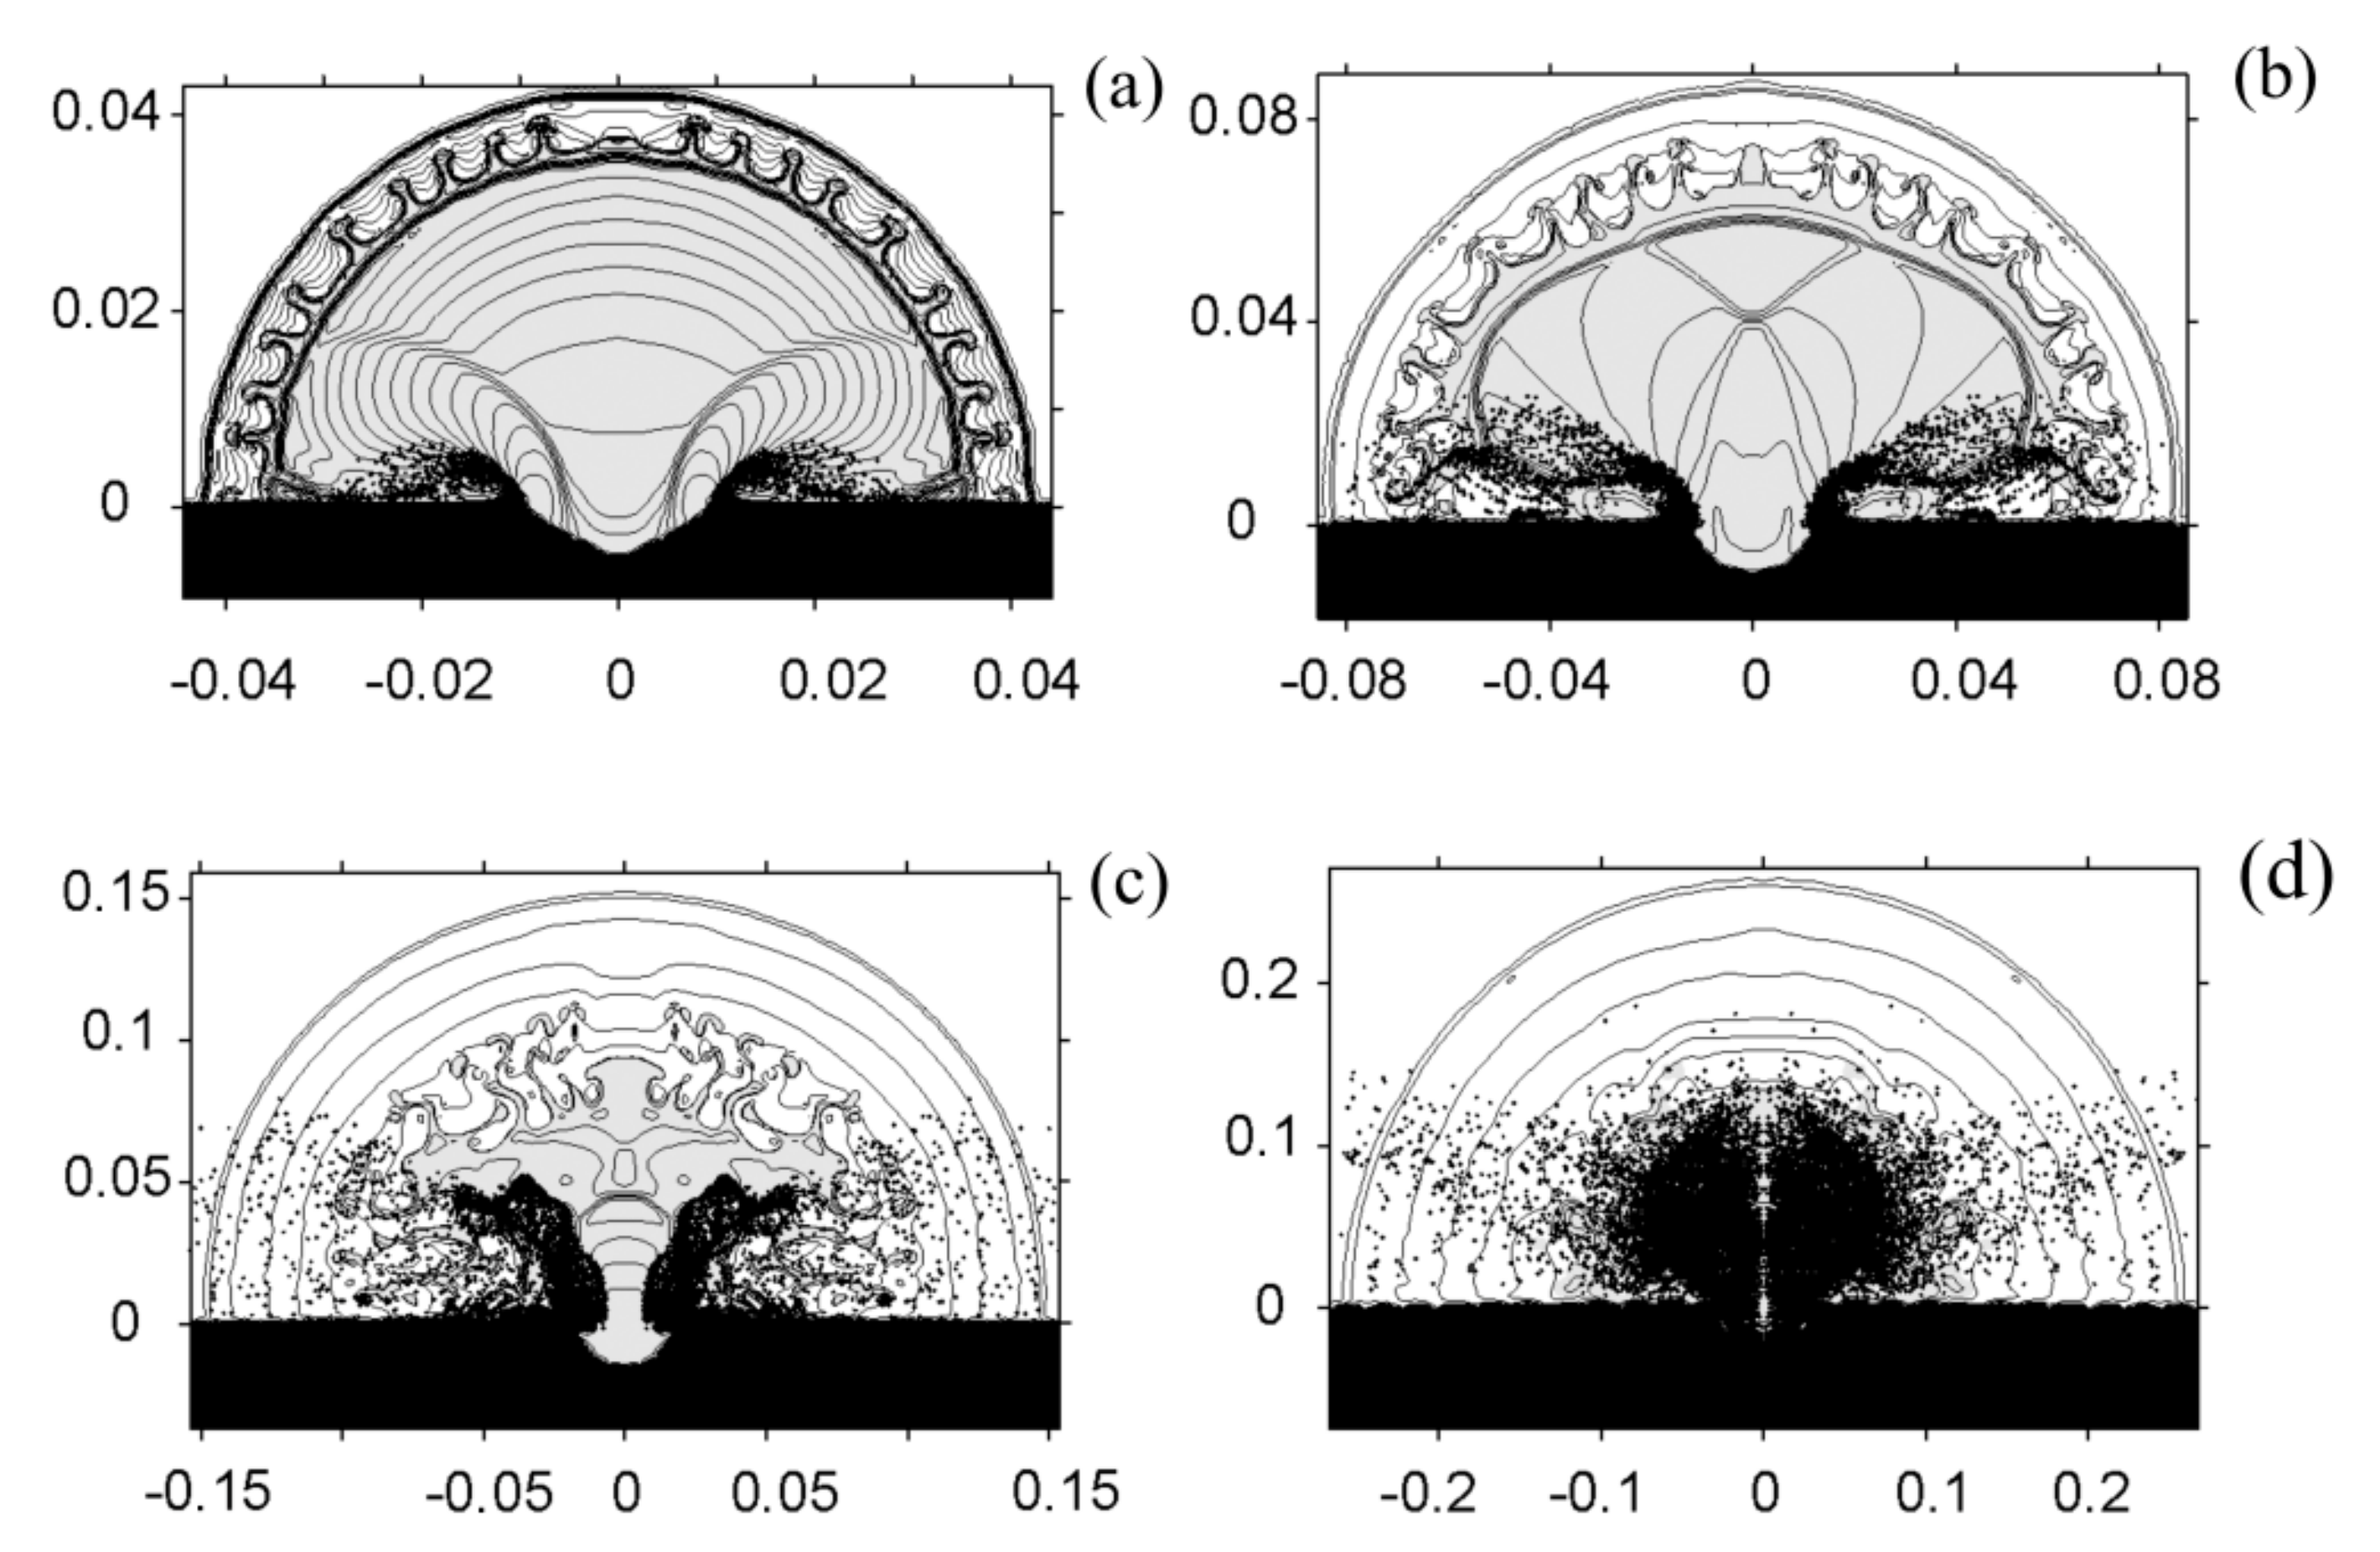
Figure 1. Density isolines. The black-filled areas correspond to rock. The grey-colored areas mark the products of detonation. The dots show the distribution of dust particles. Distance in kilometers is plotted on the axes. Time after the detonation of explosive: (a) 10 ms, (b) 30 ms, (c) 100 ms, (d) 300 ms.
Atmosphere 11 01112 g001
Figure 2. Temperature distribution at the initial stage of the explosion. The lighter shade corresponds to a higher temperature; white corresponds to values: (a) 5300 K, (b) 3300 K, (c) 1900 K, (d) 1200 K Distance in kilometers is plotted on both axes. Time periods corresponding to each image are the same as in Figure 1.
Atmosphere 11 01112 g002
Figure 3. Dependence of the gas and dust cloud radius on time. The grey color line depicts the experimental data, black color line—the calculated data.
Atmosphere 11 01112 g003
Figure 4. Time dependency of the position of the upper edge of the gas-dust cloud: 1—experimental dependence for the explosion in 1985; 2—experimental dependence of explosion in 1987; yellow rectangles show a numerical simulation of the Euler equations; yellow circles show a numerical simulation of the Euler equations in the case of additional 30% of energy release; curves 3 and 4 describe the numerical simulation by the Navier–Stokes LES code with different values of the Smagorinsky coefficient (see Section 4.1).
Atmosphere 11 01112 g004
Figure 5. (a) The photo of the gas-dust cloud at 15 s after detonation. (b) The calculated data and the isolines of the density of the explosion products (gray lines on the left part) and the dust (dots on the right part) at the same timepoint. The distances in kilometers are plotted along the axes.
Atmosphere 11 01112 g005
Figure 6. The predicted time dependency of the relative rock particles mass (i.e., divided by the explosive mass) remaining in the atmosphere.
Atmosphere 11 01112 g006
Figure 7. The distributions of the relative density of pollution compared to the velocity field (a,c) and buoyancy (b,d) shown in the radial section of the gas and dust cloud at 2 and 4 min (panels (a,b) and (c,d), respectively). Brown shades (panels (a,c)) indicate changes in the relative dust concentration (divided by the initial concentration). Dust concentration values are given in color bars. Shades of color (panels (b,d)) indicate changes in buoyancy values. The buoyancy values are given in color bars. The maximum values of velocities are given in rectangles on panels (a,c). Distance in kilometers is plotted on both axes.
Atmosphere 11 01112 g007
Figure 8. The distributions of the relative density of particles with a size of 0.4 mm (panels (a,b)) and 0.8 mm (panels (c,d)), at 2 min (panels (a,c)) and 4 min (panels (b,d)), respectively. Shades of color are the same as in Figure 7a. Distance in kilometers is plotted on both axes.
Atmosphere 11 01112 g008
Figure 9. The distributions of the relative density of pollution particles are similar to those shown in Figure 8 (panels (a,b)) and 0.8 mm (panels (c,d)), at 2 min (panels (a,c)) and 4 min (panels (b,d)), but these do not account for diffusion. Shades of color are the same as in Figure 7a. Distance in kilometers is plotted on both axes.
Atmosphere 11 01112 g009
Figure 10. (a) The dependence of the Smagorinsky parameter C sm on the charge mass W, the charge-mass dependent maximum height H m / r T of the cloud upper edge, and charge-mass dependent maximum radius R m / r T of the gas and dust cloud cap. The two latter are obtained for this dependence C sm (W). (b,c) The time dependences of the upper-edge height H / r T and the cloud cap radius R / r T for 3-, 30-, and 500-t TNT explosions (curves 1, 2, 3, respectively).
Atmosphere 11 01112 g010
Figure 11. A 500 t TNT explosion: (a) The time dependence of the mass fraction of particles with radius r p in CDP (related to the mass of particles with this radius in CDP and SDP); (b) the upper edge height of the cloud of particles with radius r p ; (c) the radius of CDP of particles with radius r p . Curves 1–6 correspond to r p = 1.5 × 10⁻⁴, 9.5 × 10⁻³, 0.019, 0.075, 0.15, 0.3 cm.
Atmosphere 11 01112 g011
Figure 12. The curves for the one-tonne TNT explosion: (a) The time dependence of the mass fraction of particles with radius r p in CDP (related to the mass of particles with this radius in CDP and SDP); (b) the upper edge height of the cloud of particles with radius r p ; (c) the radius of CDP of particles with radius r p . Curves 1–4 correspond to r p = 1.5 × 10⁻⁴, 4.75 × 10⁻³, 9.5 × 10⁻³, 0.019 cm.
Atmosphere 11 01112 g012
Figure 13. A 500 t TNT explosion: The distribution of dust particles mass by size at the initial moment of time (black squares), at 30 s (blue dots), and at 5 min (red triangles) after the detonation.
Atmosphere 11 01112 g013
Publisher’s Note: MDPI stays neutral with regard to jurisdictional claims in published maps and institutional affiliations.