1. Introduction
Atmospheric turbulence can pose serious problems to aviation. The most hazardous type of turbulence occurs in lower troposphere, affecting take-off/landing procedures (i.e., [
1]). In the upper troposphere as well as in the lower stratosphere (UTLS), turbulence manifests as an unexpected, dangerous and often elusive phenomenon, commonly known as clear air turbulence (CAT) [
2,
3].
The upper troposphere turbulence has a significant impact on the safety of air traffic because it can cause structural damage to aircraft and can lead to passenger injuries and even fatalities. Turbulence can also increase operational costs which are passed on to consumers [
4]. For this reasons we must identify the areas most frequently associated with turbulence, and in particular with clear-air turbulence. “Clear-air turbulence (CAT) is defined as the bumps of in-flight aircraft directly induced by small-scale turbulent eddies in free atmosphere within cloud free or stratiform clouds” [
5]. Recent studies [
2,
3] provide exhaustive analysis results regarding aviation operations related to meteorological phenomena. Mazon et al. [
2] focus on the relative contributions of meteorological phenomena to weather-related aircraft accidents, between 1967–2010, showing that while turbulence was associated with 66% of the cruise flight accidents and 56% of accidents that occur during descent. CAT accounted for 13% of accidents during cruise flights and 7% of accidents during descent.
Moderate to severe localized turbulence generally occurs in areas characterized by strong wind shear, which may be generated by a variety of phenomena including: jet stream, upper-level fronts, unbalanced flow, mountain waves, thunderstorms and gravity waves [
4,
6,
7,
8,
9,
10]. It is no surprise that certain regions within clouds and thunderstorms are usually turbulent, however, thunderstorm-generated turbulence can extend well cloud boundaries. In such circumstances it is referred to as near-cloud turbulence [
11]. Also, the Kelvin Helmholtz instability generated by the strong vertical wind shear on the northern edge of the jet, associated with a jet frontal system can be a major cause for generation of the CAT. [
12]
In cloud-free areas, CAT is associated with wind shear, particularly occurring between a jet stream’s core and the surrounding air. In a study of 44 aviation accidents caused by turbulence (i.e., CAT, convection, close to mountain), Kaplan et al. [
13] indicated a prevalence of severe accident-producing turbulence within the entrance region of the polar or subtropical jet stream, at the synoptic-scale. Their results showed that the most consistent predictor for turbulence was the upstream curvature of the synoptic-scale flow. In most of the cases studied by Kaplan et al. [
13], upward vertical motions, low vorticity and an increase of wind shear in time were observed (i.e., conditions associated with the entrance and exit regions of the polar and subtropical jet stream). Recent advancements such as those regarding Doppler LIDAR turbulence measurements [
14] have not yet led to a complete explanation of this type of turbulence [
15]. Observational studies have indicated that CAT can be caused by Kelvin–Helmholtz instability [
16] or that gravity waves (e.g., generated by airflow over mountains) can increase wind shear locally and thus contributing to the generation of CAT [
17].
As CAT occurs in cloud-free areas, ice clouds or higher concentration of water vapor, these can be observed and used as hints, indicating the presence of CAT. CAT is difficult to avoid by pilots because it cannot be observed using satellite or radar imagery, neither through the use of on-board radar [
15]. Pilots must instead rely on reports of turbulence from preceding flights or CAT forecasting methods such as the graphical turbulence guidance (GTG). GTG uses the output from a numerical weather prediction model to derive several turbulence diagnostics, which are then combined, and the result is validated by the pilot’s reports of turbulence during flight [
18]. A third option for CAT prediction is to utilize water vapor imagery, numerical weather prediction models and radar data to detect regions in which tropopause folds occur. Tropopause folds are extrusions of stratospheric air into the troposphere, occurring near an upper-level frontal zone beneath the polar and subtropical jet streams. An aircraft will experience CAT when flying in the proximity of a tropopause fold [
5,
19]. To our knowledge, there are no pertinent studies concerning CAT over the south-eastern European airspace, and in particular the Romanian airspace. This study aims to detect CAT areas by accounting for the presence of tropopause folds and by computing four indices (e.g., [
20,
21]) which have been previously used as CAT indicators. These indices were calculated for 13 of CAT cases, namely those for which diagnostic was found to have a direct or indirect link with tropopause folds. These 13 cases were selected from those turbulence cases reported by aircraft pilots, between June 2017 and December 2018, in the Romanian airspace.
Our study shows that of the four indices analyzed, only two can be considered relevant markers for the presence of CAT associated with tropopause folds: the horizontal temperature gradient (
) and the Brown index. The present article is structured as follows:
Section 2 details the main aspects of tropopause folds and CAT detection.
Section 3 describes the datasets and the methodology used in this article to identify CAT and indices that could be used in CAT associated with tropopause folds.
Section 4 presents the results of the performance of turbulence indices and the validation with pilot weather reports or aircraft air-reports (AIREP). The relationship between tropopause folds and prone areas for CAT is detailed for three cases. Finally,
Section 5 summarizes the results of this article.
2. Theoretical Considerations on Tropopause Folds and Tropopause Folds Detection
In general, CAT is observed horizontally over distances of 80–500 km in the along-wind direction and 20–100 km in the across-wind direction. Vertical dimensions are 500–1000 m and the life span of CAT is between 30 min and 24 h [
22]. CAT can occur in areas with strong horizontal and/or vertical wind shear. Wind shear is most intense on the side of the jet stream with the lowest temperatures, the underside of the jet stream, and on the area between the jet stream and the tropopause. Even if clear-air turbulence is related to the jet stream, not all jet streams contain CAT [
22,
23]. CAT also can be explained by the Kelvin-Helmholtz instability (KHI). KHI occurs in stably stratified shear flow when the local Richardson number is lower than 0.25 [
5]. These conditions are favored by strong wind shear and a large stability [
5].
Many cases of CAT occur in areas with strong horizontal and/or vertical wind shear. Wind shear is most intense on the side of the jet stream with the lowest temperatures, the underside of the jet stream, and on the area between the jet stream and the tropopause. Roughly 60% of CAT reports are near jet streams. Clear-air turbulence is often related to the jet stream, but not all jet streams contain CAT [
22]. Detection of CAT has to be based on its causes (e.g., tropopause folds, mountain waves, fronts, jet streams). Here we only focus on the detection of CAT associated with tropopause folds.
2.1. Tropopause Folds
Tropopause folds are extrusions of stratospheric air into the troposphere occurring near an upper-level frontal zone beneath the polar and subtropical jet streams [
19,
24].
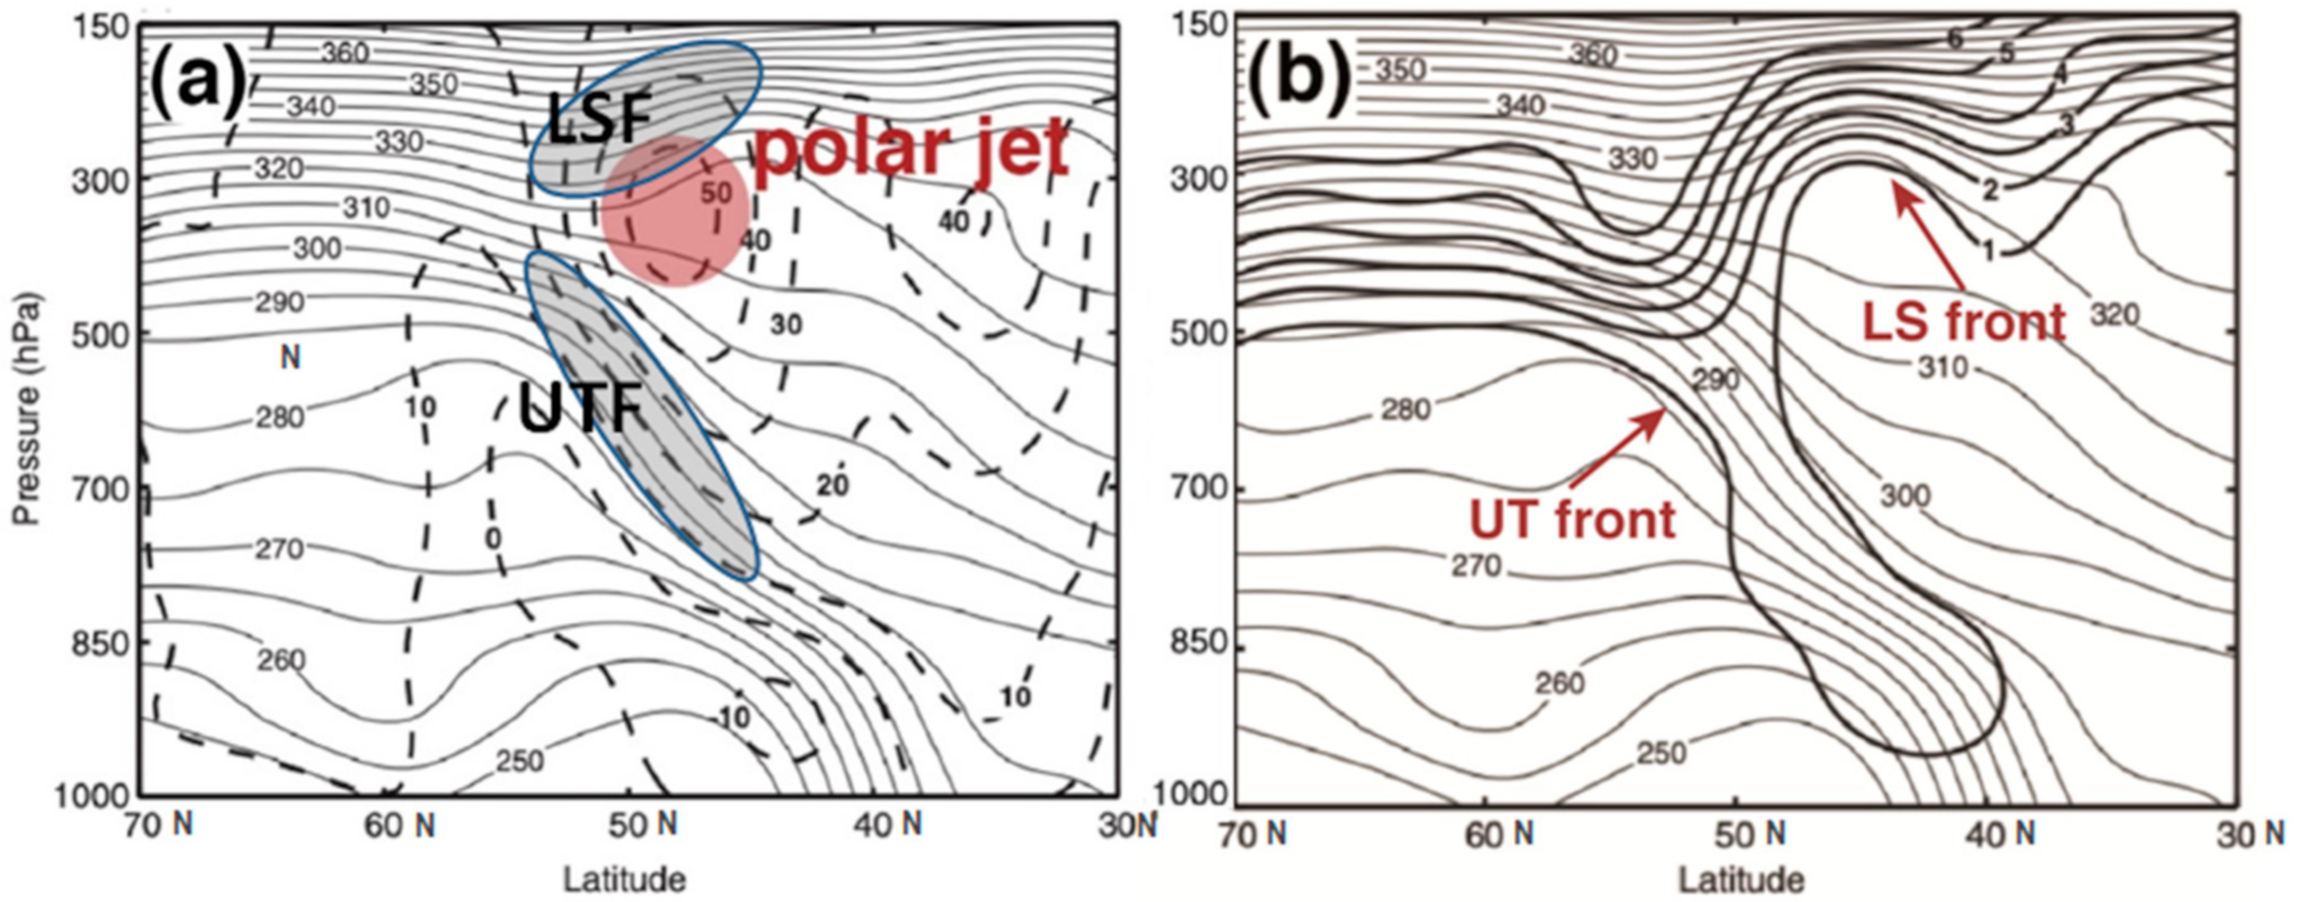
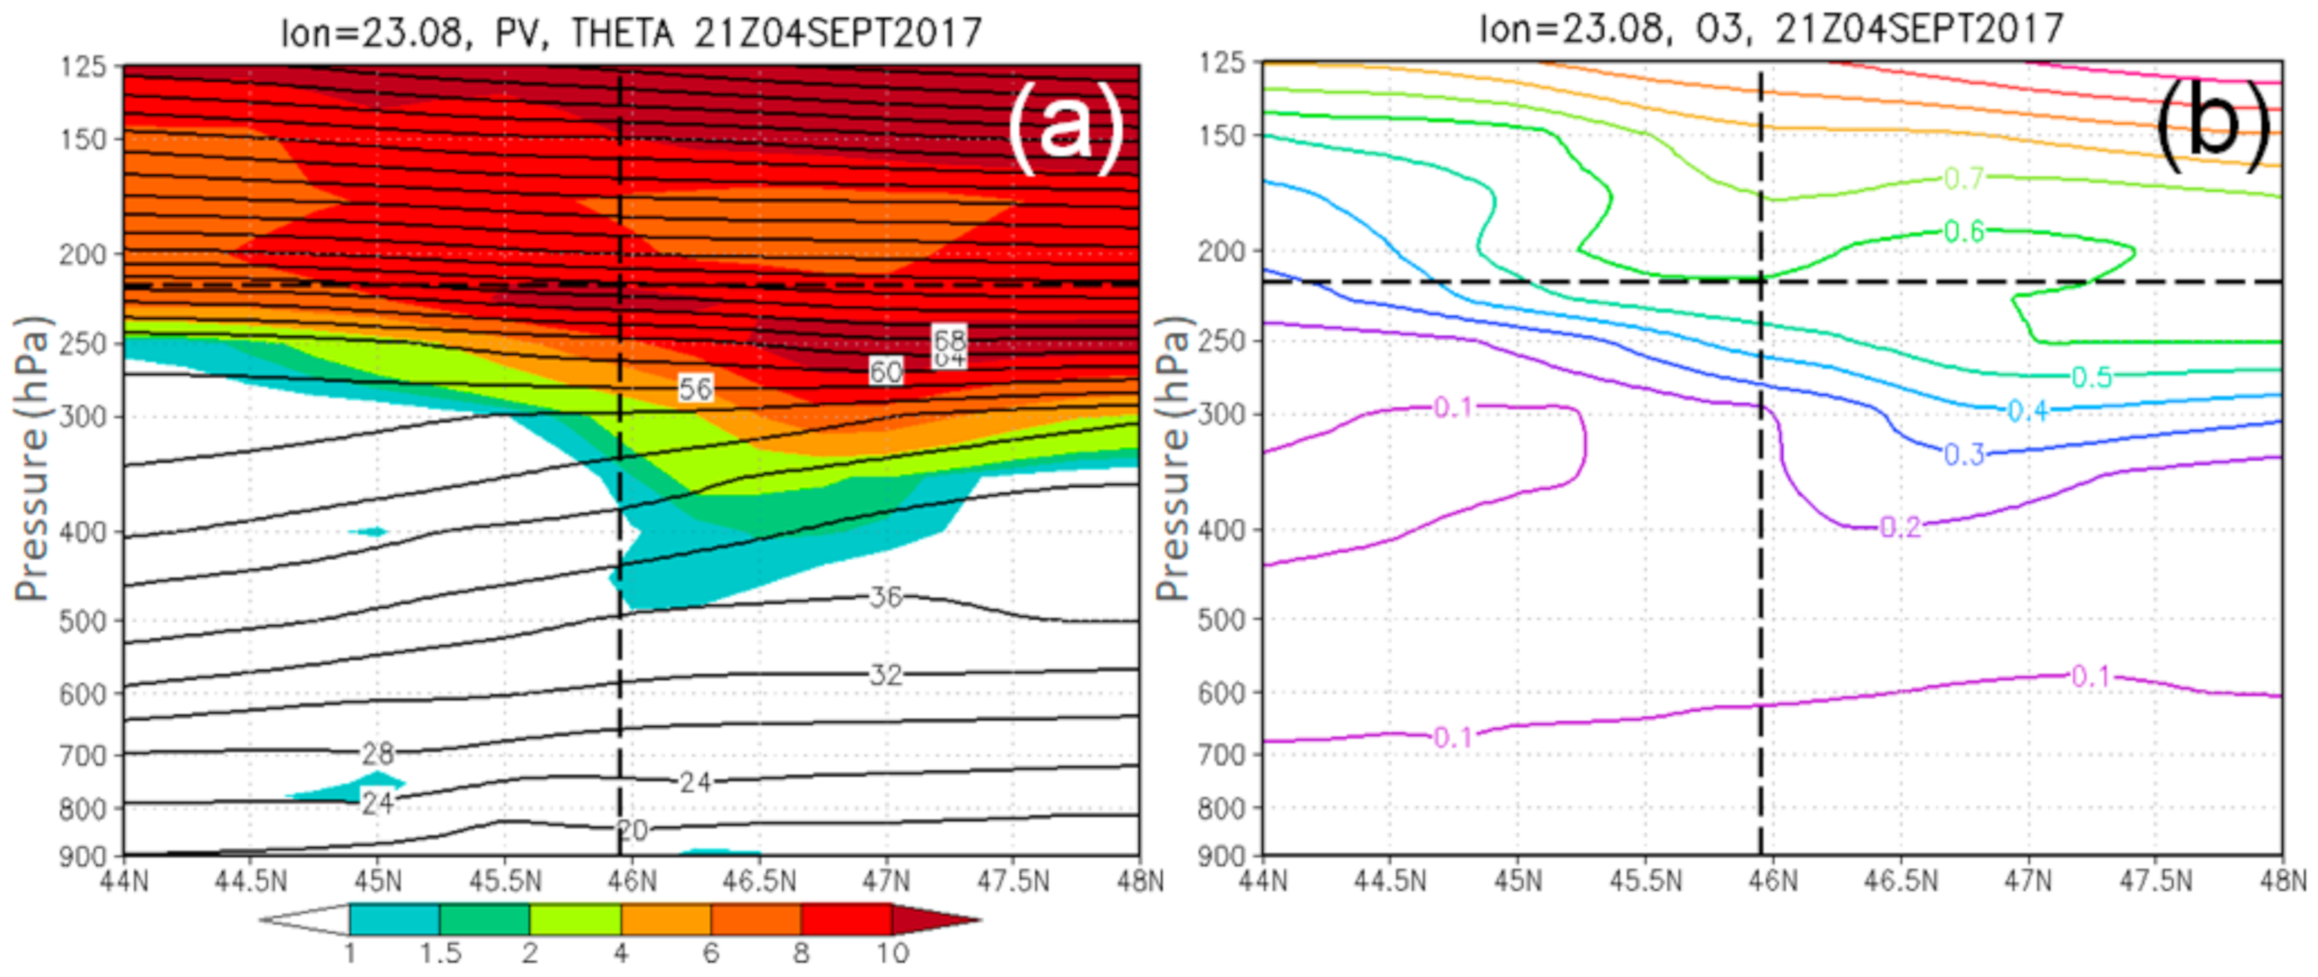
Figure 1a shows a strong polar jet core above a cold front at the surface. In this case, the potential vorticity (PV) contours intrude deep into the troposphere from the stratosphere (
Figure 1b). As high values of PV are markers of stratospheric air, the surface of 1.5 or 2 PVU (1 PVU = 1.0 × 10
−6 m
2 s
−1K kg
−1) is considered the dynamic tropopause and its topography is used to identify tropopause folds [
25].
Synoptic scale disturbances tend to develop preferentially in regions where the temporal average of maximum zonal wind is associated with jets. Planetary flow in the zone of jet stream has an extremely high degree of baroclinicity [
26].
The potential temperature field shows that the lower stratosphere is characterized by higher static stability compared with the upper troposphere. This makes stratospheric air above the lower, polar air mass tropopause, warmer than the stratospheric air above the higher, tropical air mass tropopause, thus creating a discontinuity in the potential temperature field on isobaric surfaces (
Figure 1a,b). Berggren [
28] proposed and Shapiro [
29] confirmed the existence of these frontal-scale transitions within the lower stratosphere [
29], later referred by Lang and Martin [
27] as lower stratospheric fronts (LSF). In upper level jet-front (ULJF) systems, the LSF is associated with the upper tropospheric front (UTF), both encompassing the jet stream core, as in
Figure 1a [
27]. As the isentropes cross the tropopause in the vicinity of the jet, there is a mass change between the troposphere and the stratosphere (
Figure 1b). In this region (i.e., upper troposphere and lower stratosphere, UTLS) the vertical wind shear associated with the jet stream together with the ageostrophic convergence of polar, subtropical and stratospheric air results in tropopause folding (i.e., a downward intrusion of stratospheric air into the troposphere), a region usually associated with CAT [
30]. Tropopause folds are marked by gradients of potential vorticity (PV). PV is a convenient conservative tracer for stratospheric air, but the boundaries of high PV areas (PV anomalies) are also indicative of the location of vertical shear, which can lead to turbulence. The vicinity of the polar jet is characterized by large wind shear. The presence of wind shear in a region also characterized by large stability favors KHI. CAT events can also occur associated to upper-level frontogenesis. Kim and Chun [
5] showed that turbulence has been reported near tropopause and near the borders of the upper cold front associated to the tropopause fold.
2.2. Algorithms to Detect Tropopause Fold
A series of algorithms have been proposed to detect tropopause folds. Because tropopause folds are characterized by high values of ozone mixing ratio, high PV, and low relative humidity, these algorithms, as indicated by Antonescu et al. [
31] are based on in situ measurements (i.e., ozone, temperature, humidity) [
22,
32,
33] or meteorological analyses to derive diagnostic quantities (i.e., PV, Q-vector) [
23,
25,
34,
35]. For example, Sprenger et al. [
35] used higher-resolution analyses from ECMWF to identify tropopause folds globally. The algorithm identified tropopause folds as areas of multiple crossings of the dynamic tropopause (defined as the 2 PVU surface).
Because the tropopause fold marks the change in the height of the dynamic tropopause and describes the downward intrusion of stratospheric air characterized by high PV and low humidity into the troposphere, on the satellite imagery (i.e., WV imagery) it is marked by gradients in the upper-level moisture. Thus, for satellite data, the algorithm uses the Spinning Enhanced Visible and Infrared Imager (SEVIRI) 6.2 µm channel which is sensitive to upper tropospheric water vapor (WV 6.2 µm), SEVIRI IR channel at 9.7 µm (very useful for ozone detection) and SEVIRI IR 10.8 µm. Another algorithm that uses satellite data is that from NOAA NESDIS–Center for Satellite Application and Research Algorithm version 2.0 [
30]. This has been developed to provide a prediction of turbulence associated with tropopause folding (Tropopause Folding Turbulence Prediction, TFTP) [
36] and thus to indicate turbulent flight conditions for aircraft. The gradients in WV channel of the Advanced Baseline Imager flown on the GOES-R, are used as an indication of the distribution of folds. A NWP model is then used to constrain these features vertically in the atmosphere. The algorithm provides the lower and upper bounds of the tropopause folds. Once found, vertical boundaries indicate the vertical width of the atmospheric layers prone to tropopause fold-induced CAT. Based on the above, the study used a subjective identification of tropopause folds by the examination of SEVIRI 6.2 µm WV channel imagery.
4. Results
The analysis of the 80 AIREP reports for severe and moderate turbulence showed that 13 reports (16% of all reports) were associated with tropopause folds. Of these, one report was during winter (DJF), two during summer (JJA), six during spring (MAM), and four during autumn (SON). In a study on the role of tropopause folds in summertime tropospheric ozone over the eastern Mediterranean and the Middle East, Akritidis et al. [
48] indicated that 3% of all identified tropopause folds between 1979 and 2013 occurred during summer over Romania.
In this study, a summary of the characteristics of the severe turbulence reports associated with tropopause folds was presented in
Table 2. For the 13 AIREP reports associated with tropopause fold induced CAT four indices were calculated, according to
Section 3.2: TI2, E,
, and Brown (
Table 2).
We selected indices that provide values higher than the calculated threshold on the subset of 13 TF (tropopause folding) cases. Our study shows that in 10 out of 13 (77%) TF events are associated to horizontal thermal gradient exceeding the severe turbulence threshold events followed by the Brown index showing values higher than severe turbulence threshold in eight out of 13 (62%) cases (
Table 2). Dutton and Ellrod TI2 indices exhibit values higher than severe turbulence threshold in only 54% and 31% respectively of tropopause folding-induced CAT. Our results suggest that
and the Brown index could be used as proxies for tropopause fold induced CAT, being thus of real use in the aeronautical forecast of this CAT type.
4.1. Case Studies
To highlight meteorological conditions associated with CAT risk area in complex orography of Romanian airspace, three events with severe turbulence, reported by the pilots were analyzed in detail.
4.1.1. Case Study 4 September 2017
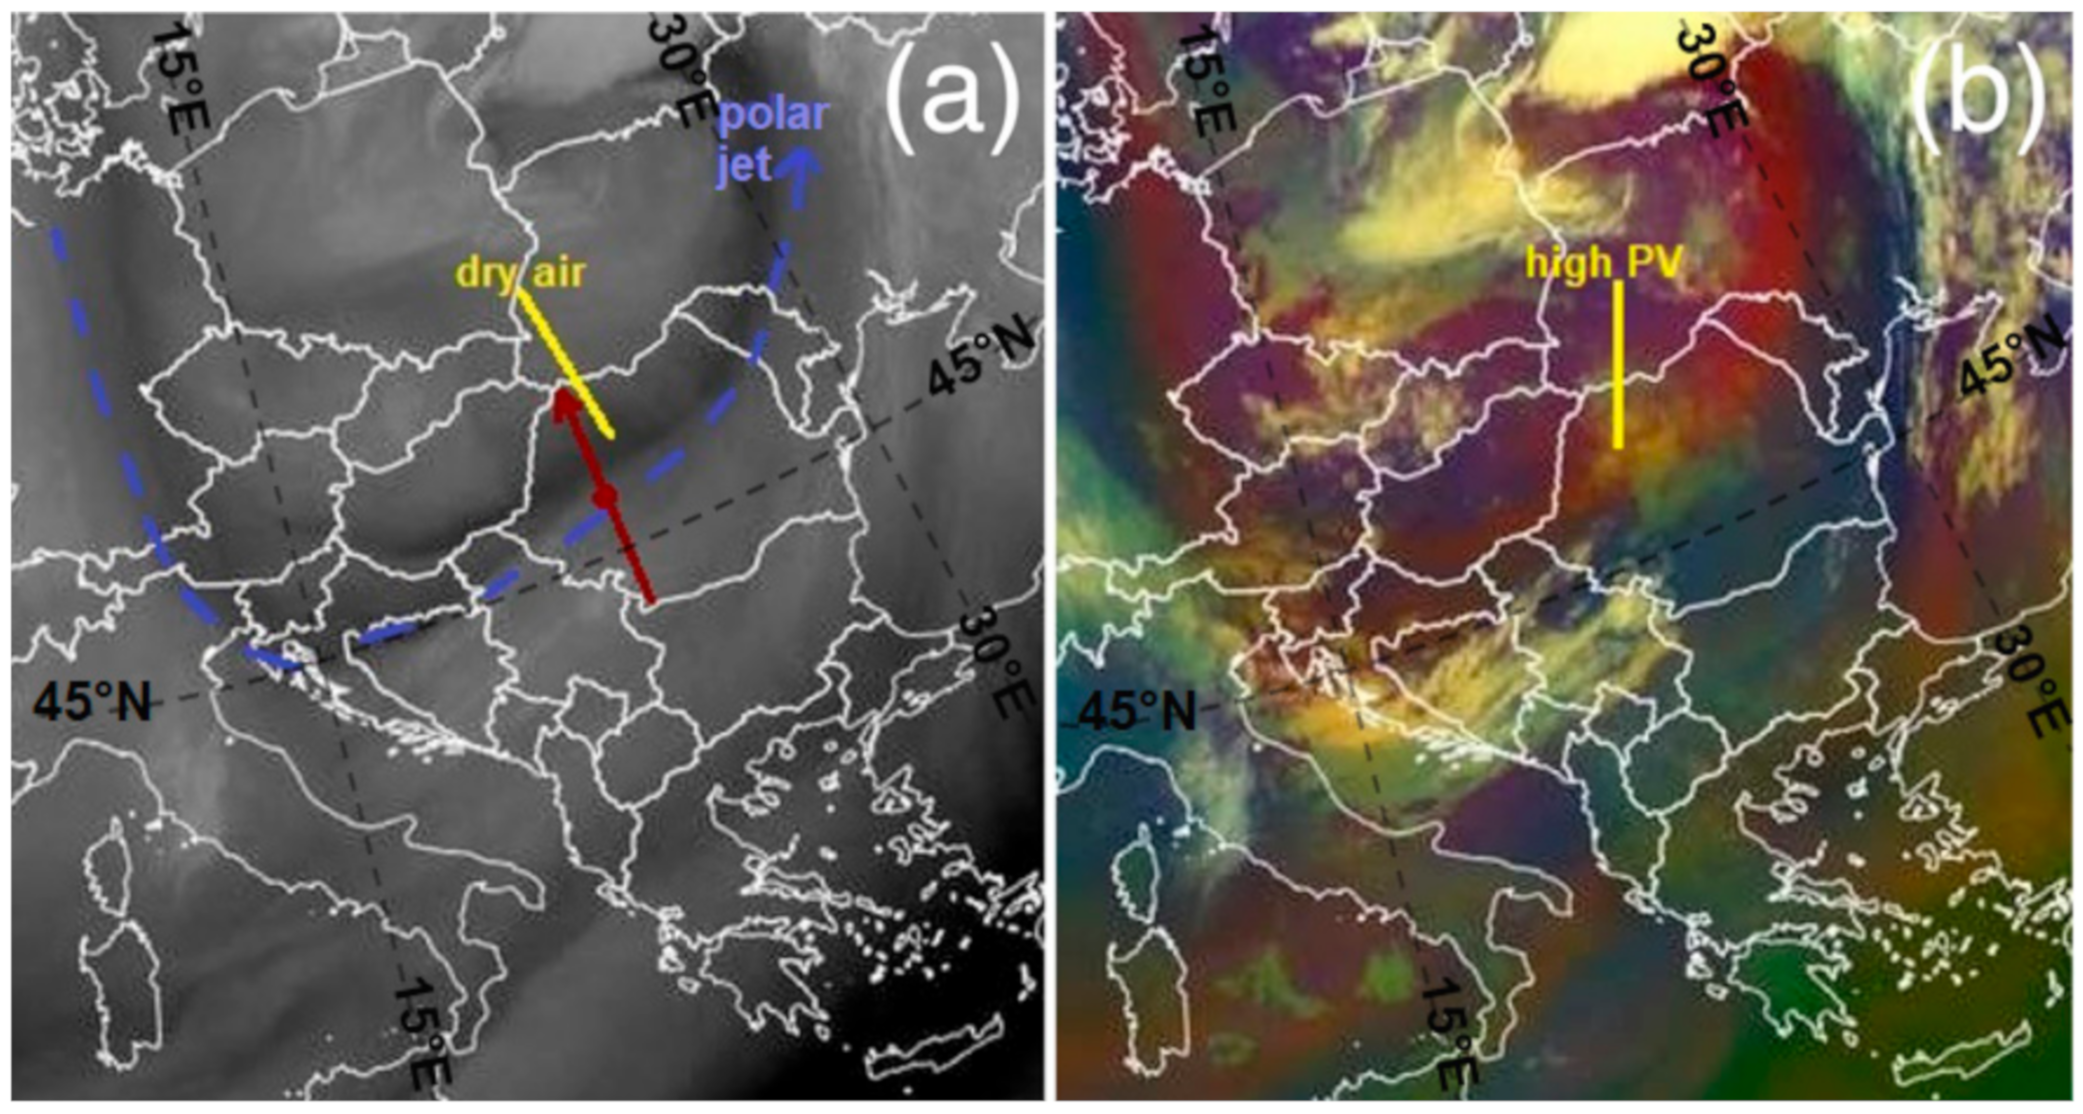
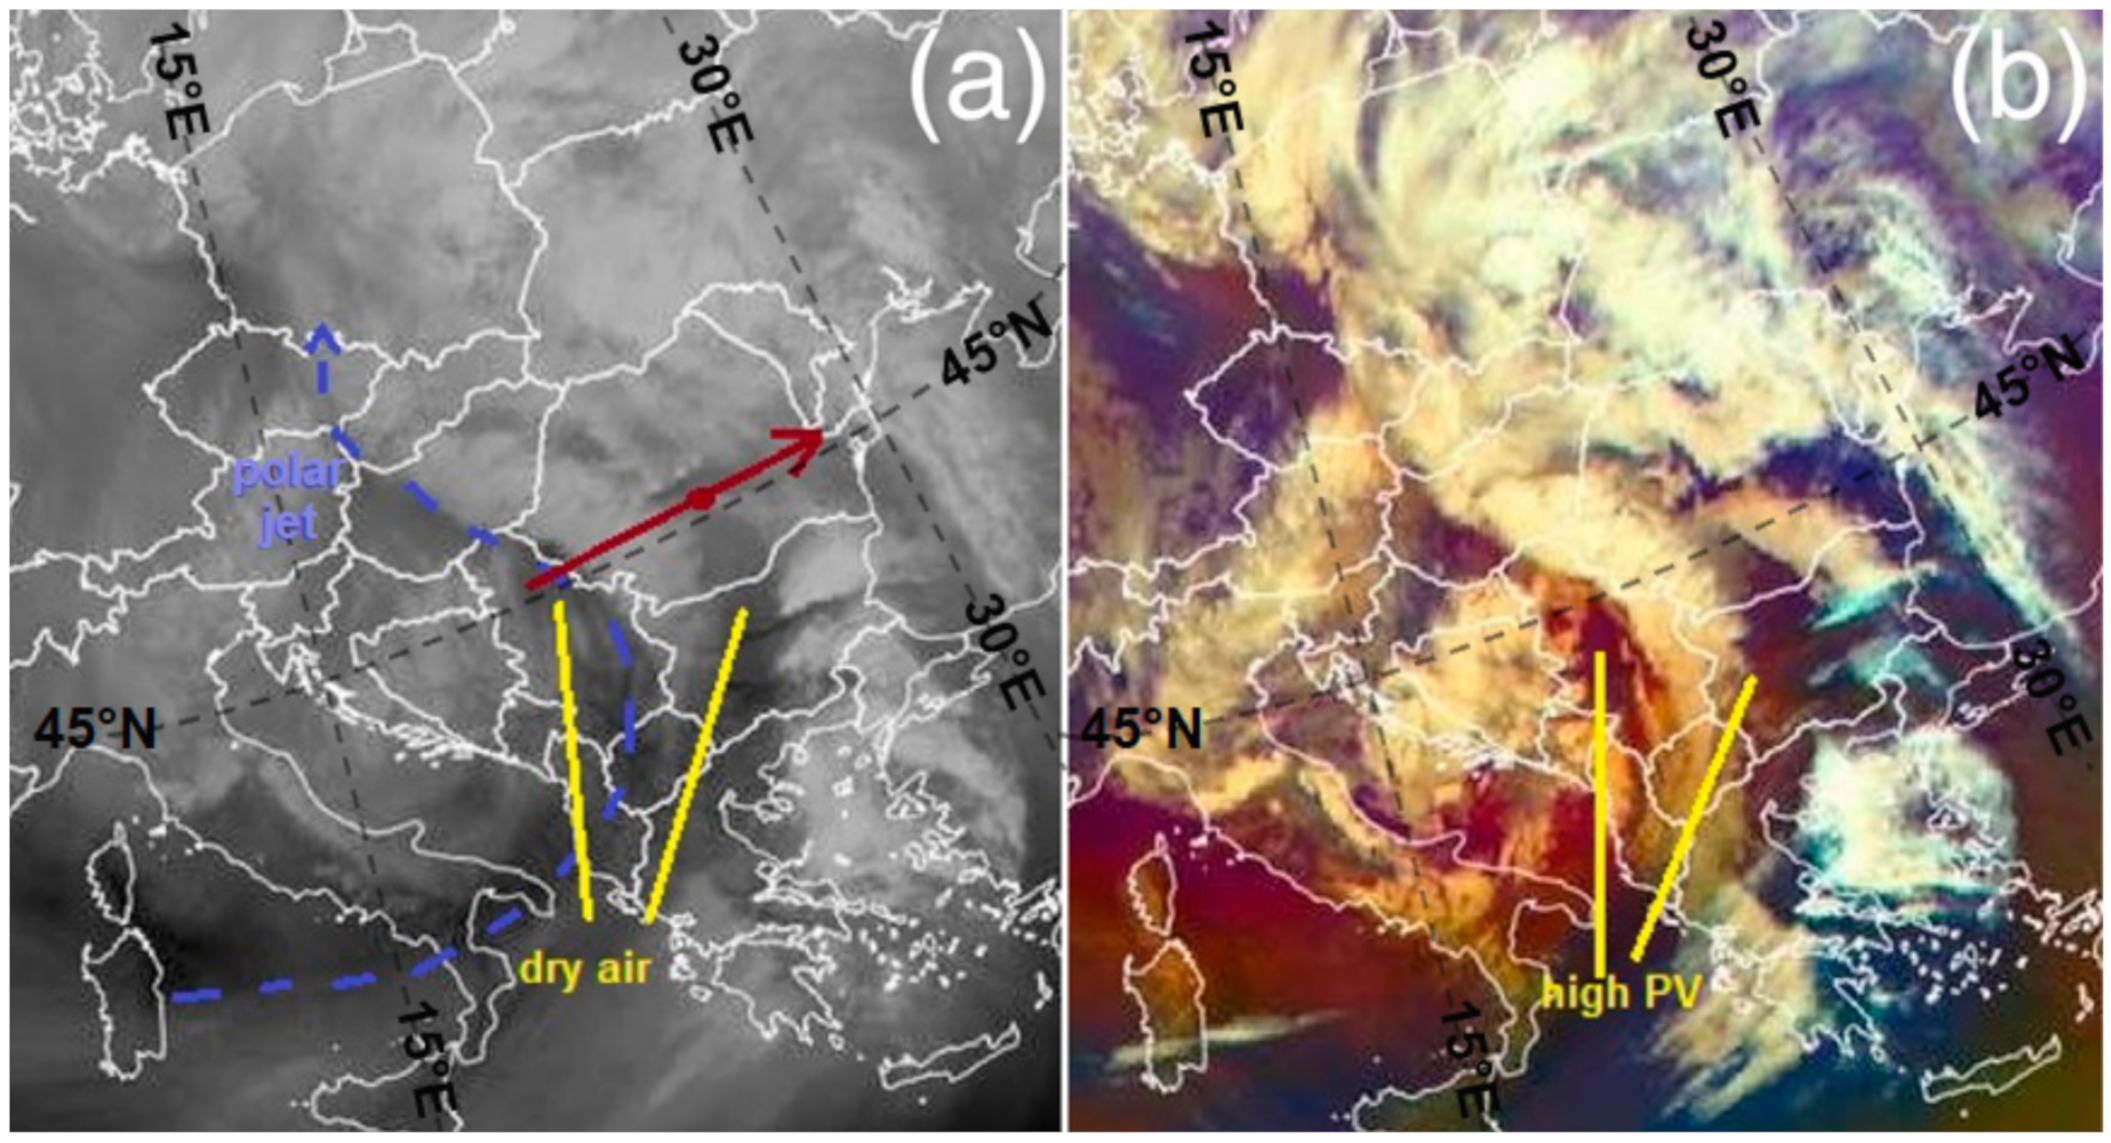
On 4 September 2017 at 21:11 UTC, pilots reported severe turbulence at FL 370 (11,300 m altitude and 216 hPa pressure level), at about 45.95°N and 23.08°E, the closest city to the ground being Alba Iulia (in central Romania). The fastest, but not very accurate, method of identifying the conditions for turbulence in the upper atmosphere is satellite imagery analysis. From the water vapor channel satellite image (WV6.2) it appears that the turbulence was reported near the edge of an area of subsiding dry air, in the medium to upper troposphere (dark grey band), and to the southern boundary of a polar jet (
Figure 3a).
Furthermore, the reddish color featured by air mass RGB, in the same area, is a sign of ozone-rich descending stratospheric air, to lower and warmer levels (
Figure 3b). Stratospheric intrusions are associated with high potential vorticity anomalies [
31] and typically occur poleward of the jet stream axis in tropopause folds [
6], as in this case. This situation is one in which a meteorologist can expect turbulence to occur and most likely this turbulence is CAT.
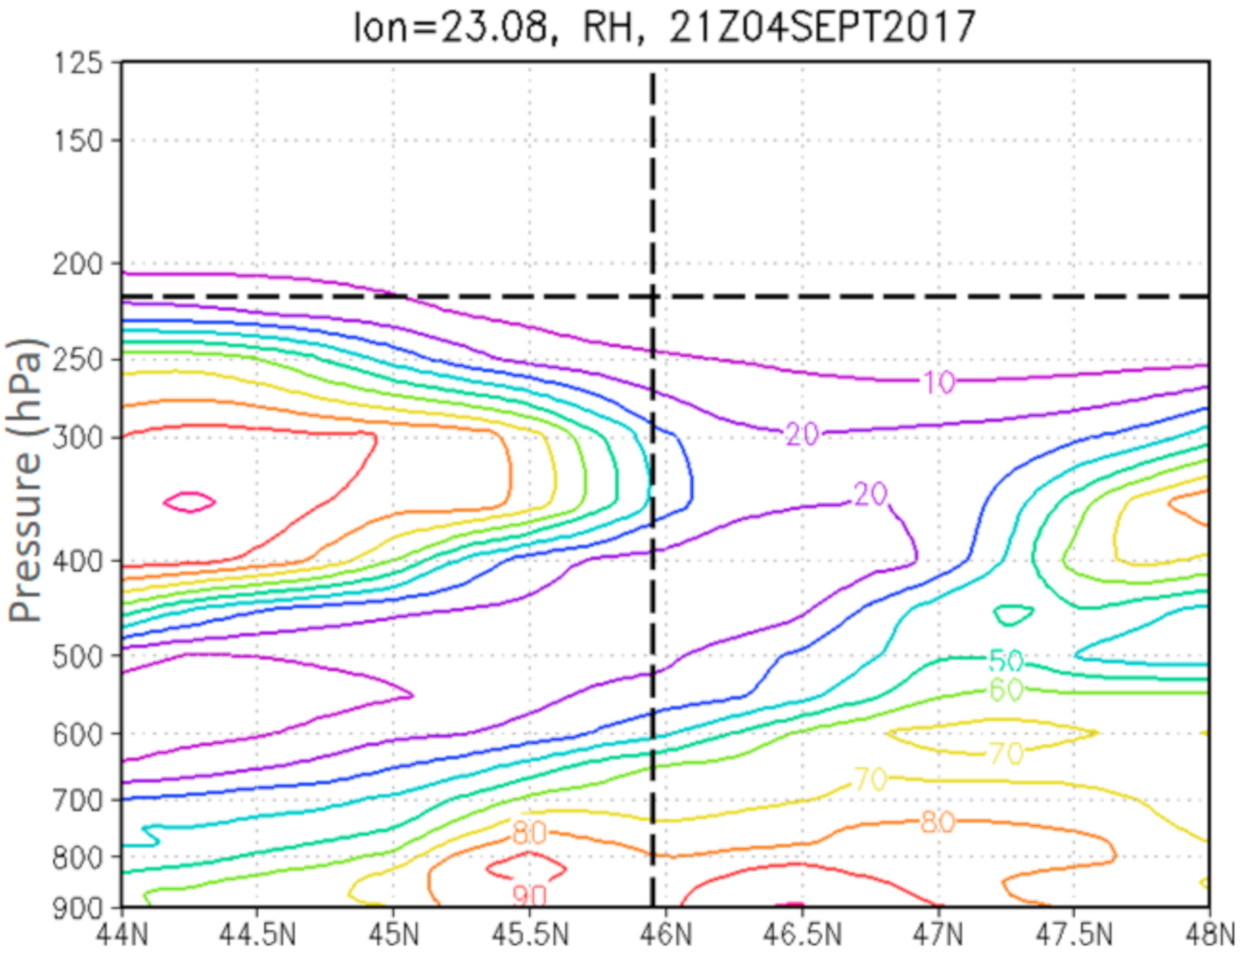
At the coordinates where turbulence was reported, the relative humidity is low (<20%) (
Figure 4). Below this level the humidity was rising, and most likely suggests the presence of stratiform clouds. Above these clouds the air was dry and the sky clear.
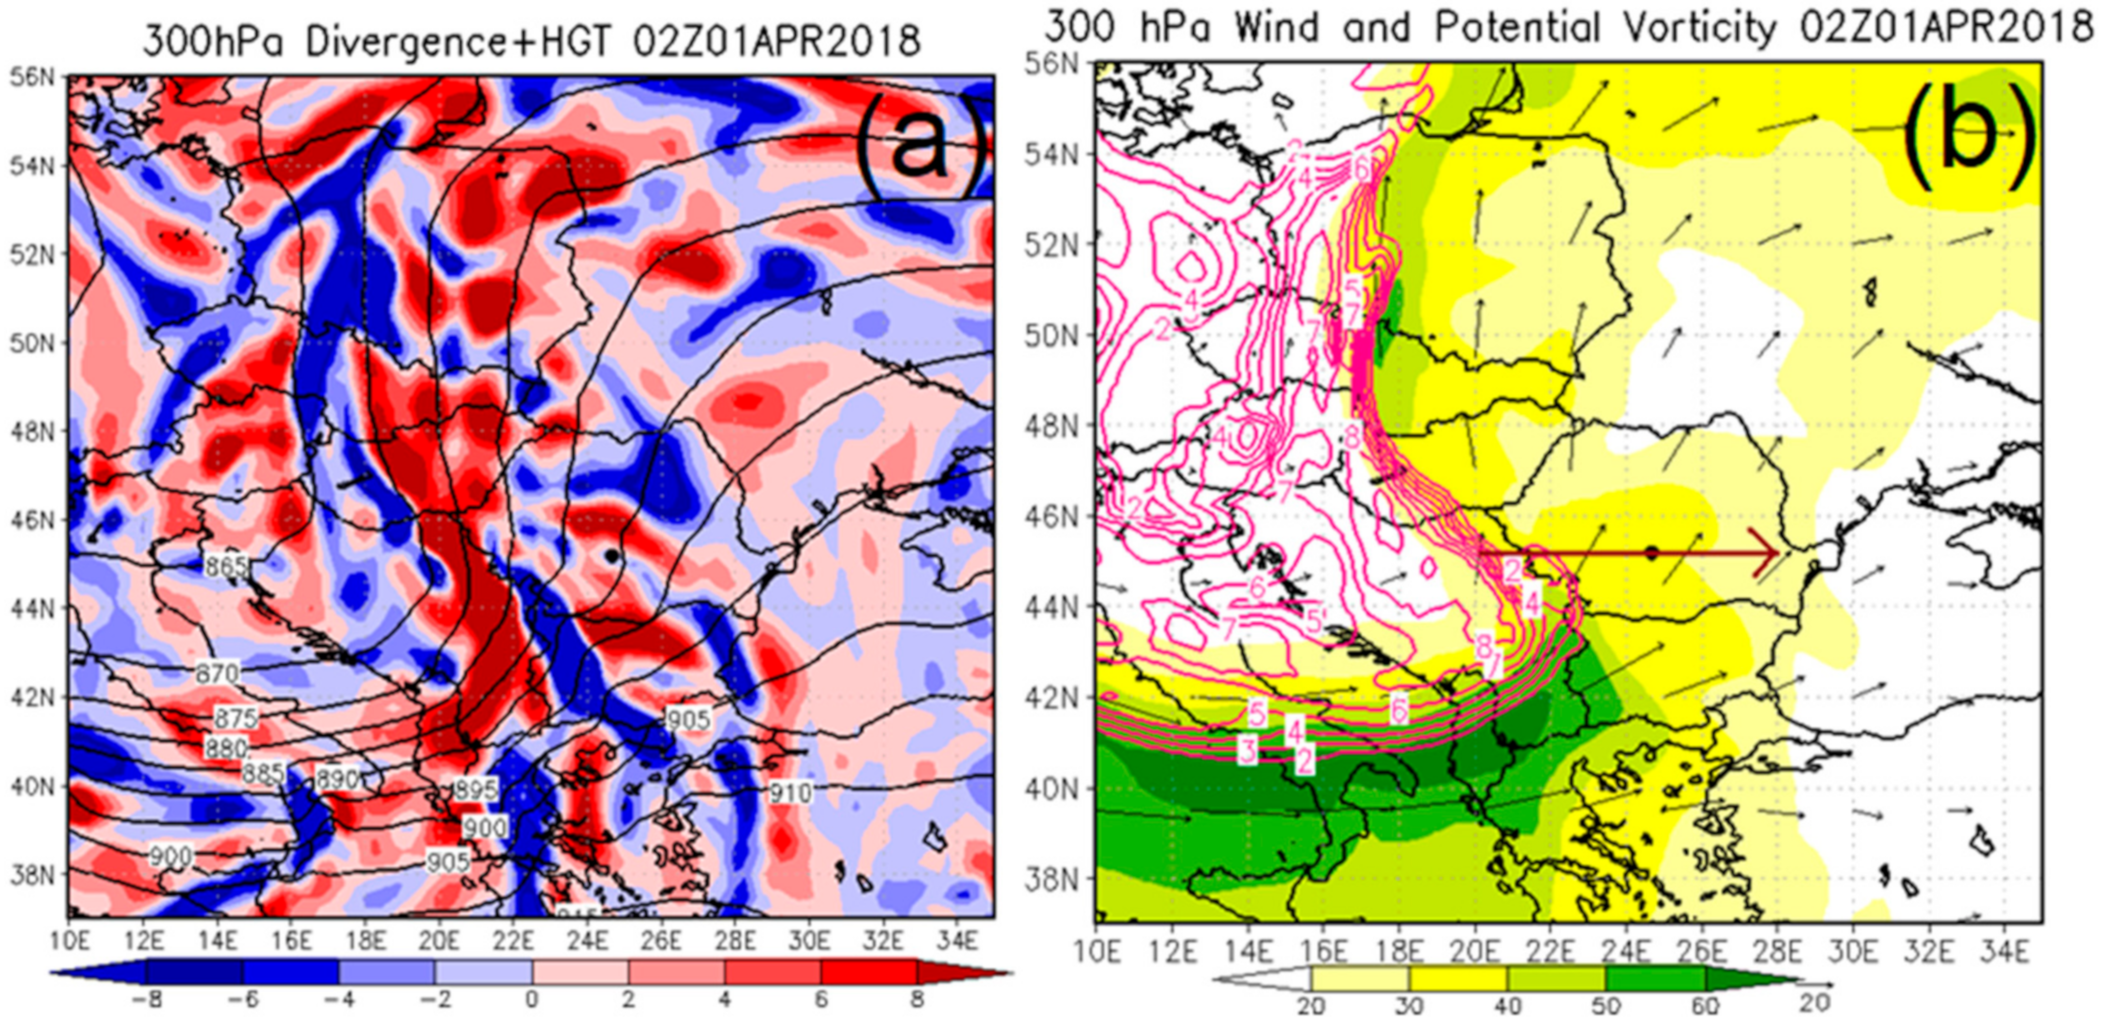
To the NNW of Romania, a cut-off low, extended to the upper troposphere, was inducing an intense WSW circulation at 300 hPa above northern Balkans. (
Figure 5a) A polar jet streak was situated over Romania and the severe turbulence occurred immediately poleward of its axis (
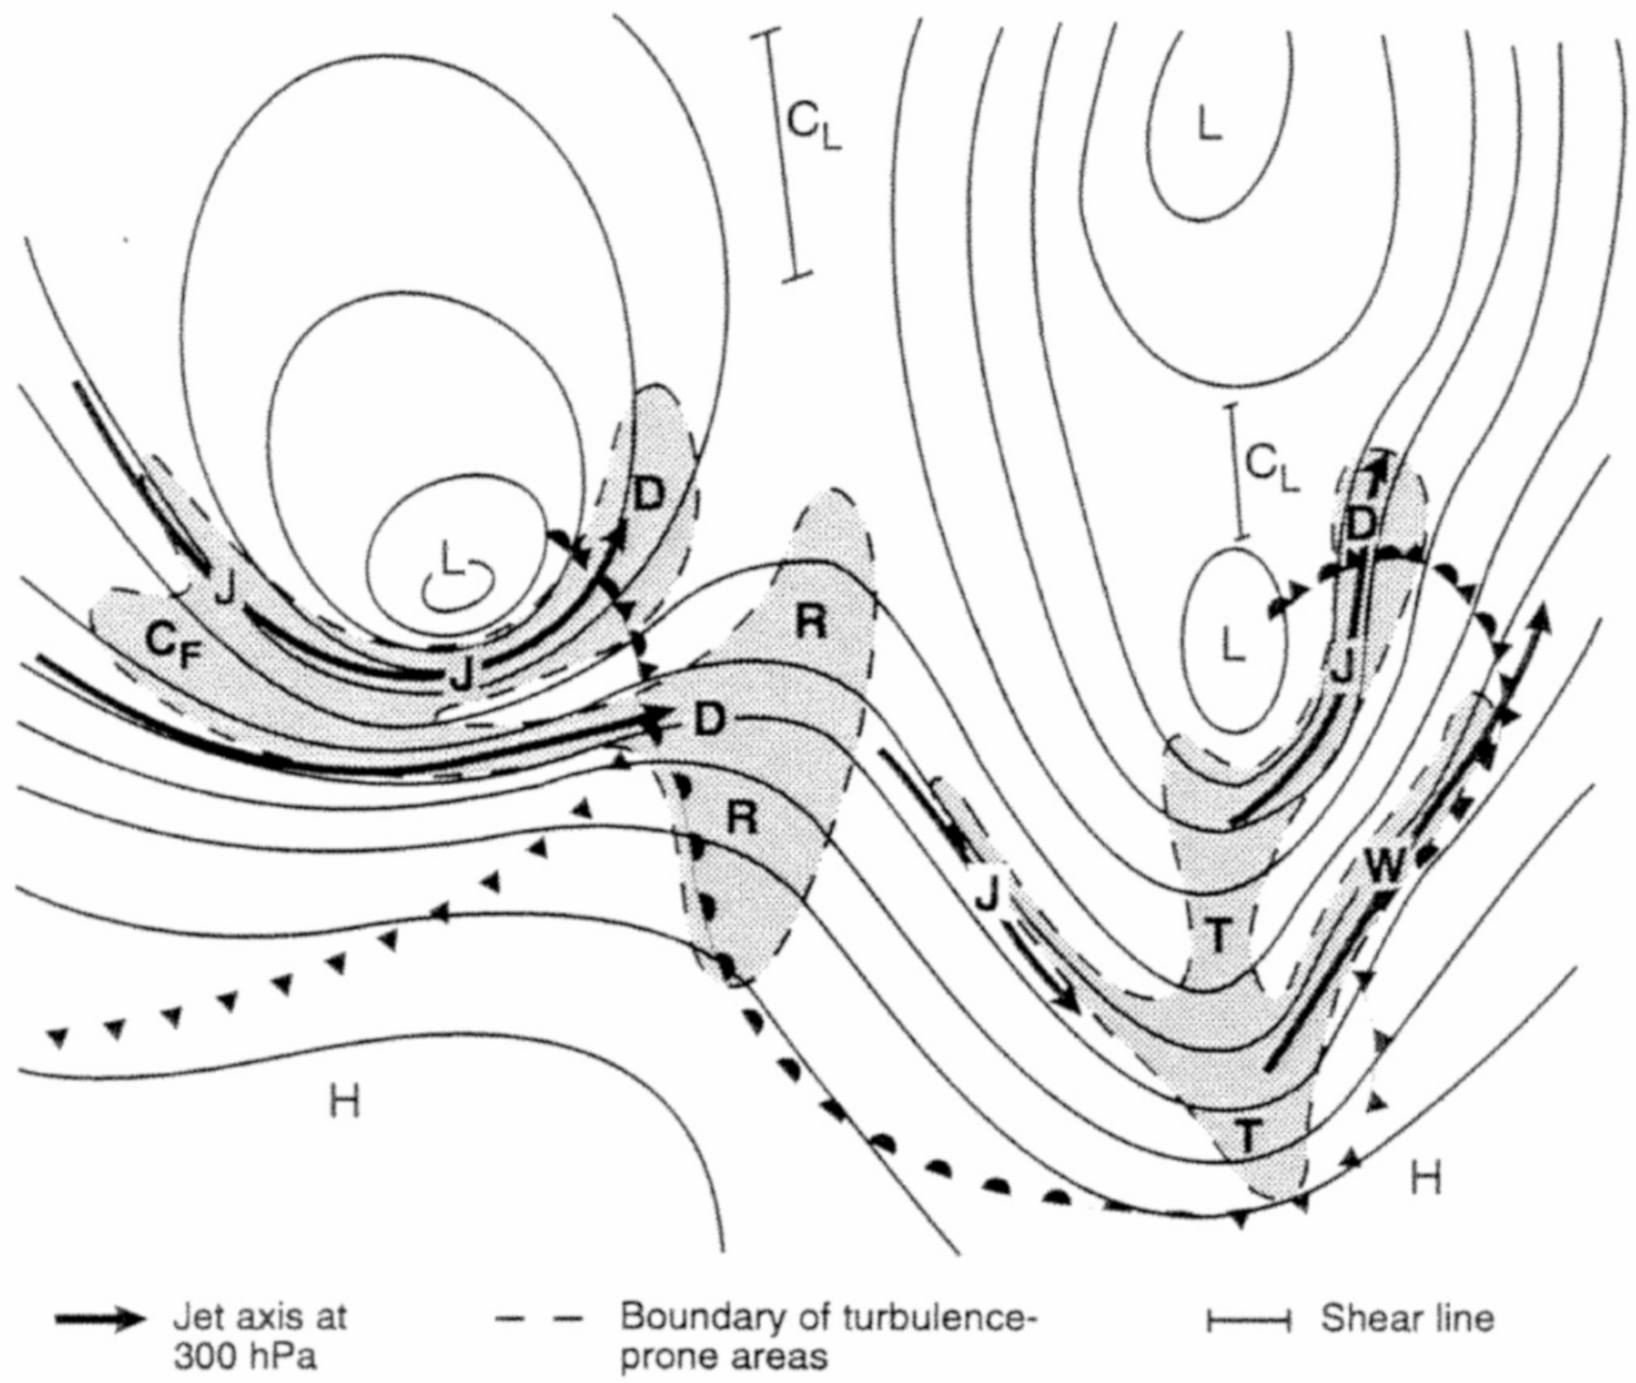
Figure 5b), an area favorable to this type of phenomenon (J area from
Figure 2). Moreover,
Figure 5b shows that the event occurs at the southern edge of a positive PV anomaly.
The surface of 1.5 PVU (dynamical tropopause) dropped to around the 400 hPa level (
Figure 6a). The ozone concentration longitudinal cross section near 23°E shown in
Figure 6b, confirms the presence of a tropopause fold, i.e., values over 0.2 ppm above 400 hPa level north of 46°N (see also [
49]).
The maximum wind speed at 200 hPa (the altitude of the reported turbulence) clearly shows the upper trough stretching NE-SW over north-western Romania, wind speed exceeding 40 m s
−1 above the reported point (
Figure 5b and
Figure 7a). The color gradient (yellow to green) shows a significant amount of both horizontal and vertical wind shear, implying that turbulence can result.
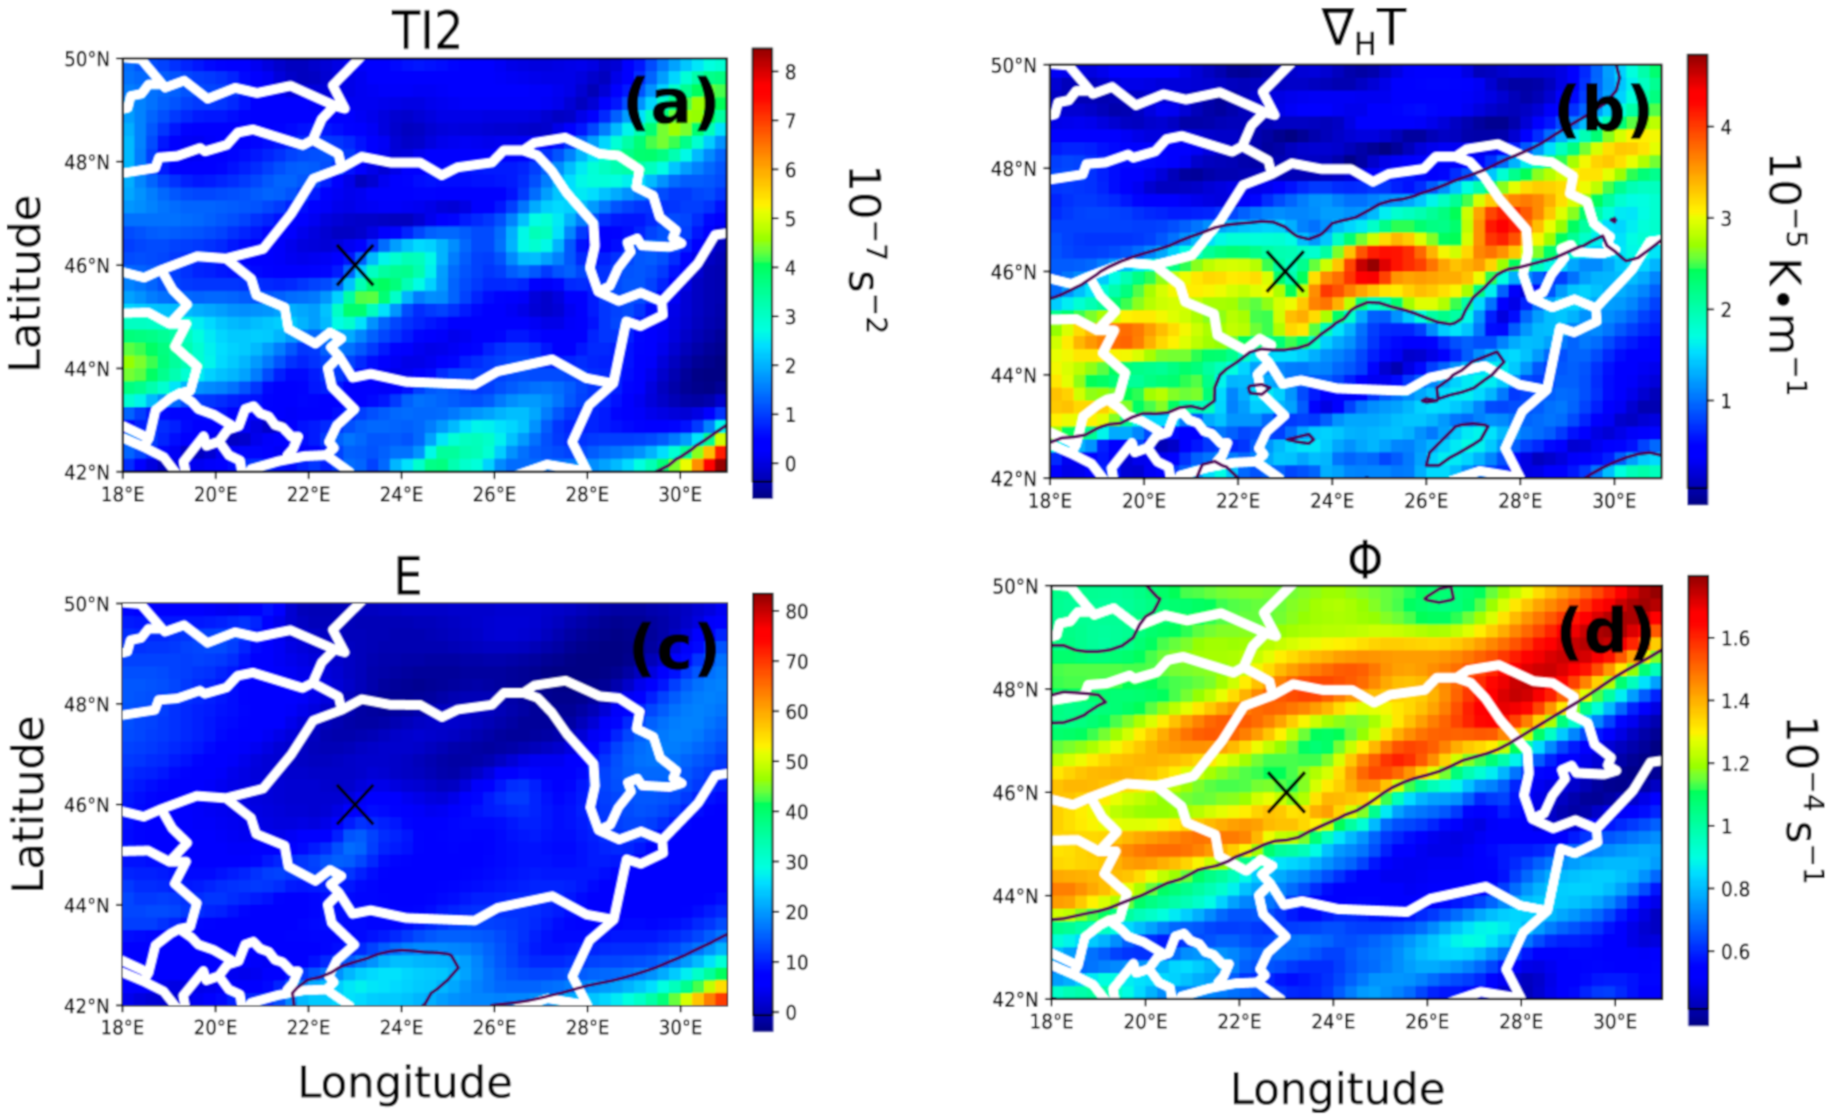
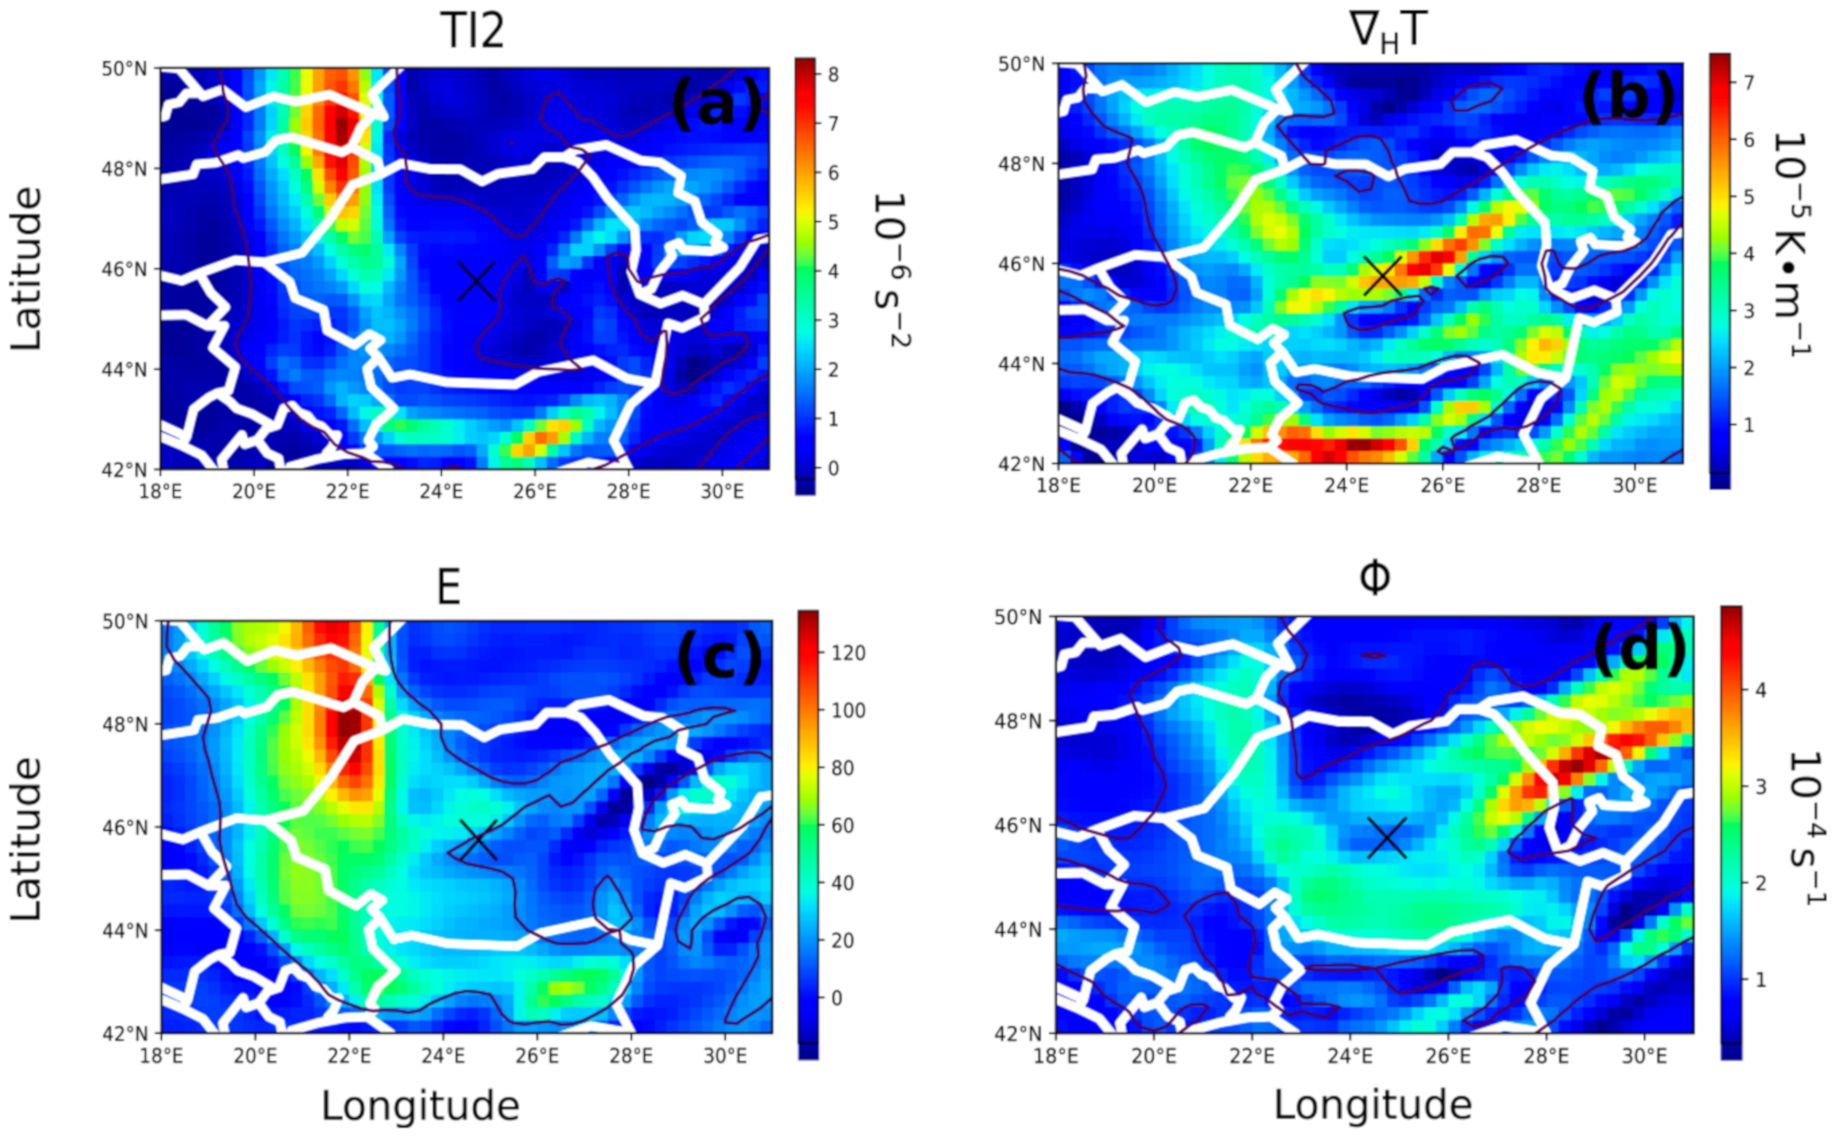
Figure 8 depicts the four turbulence indices fields over Romania for the 4 September 2017 at 21:00 UTC. On the one hand, over the region of interest, both TI2 and E show values well below the severe turbulence thresholds (
Table 2). On the other hand,
exceeds the severe threshold value, indicating turbulence producing conditions within a delimited continuous SW–NE orientated band. The Brown index (Φ) suggests a wider area of turbulence comprising the entire northern region (
Figure 8d). These results are in agreement with the presence of a frontal zone in the upper troposphere (
Figure 6a), on a rearward sloping cold front moving to south-east (
Figure 7b) and also with a band of high cyclonic relative vorticity poleward of the SW-NE orientated jet stream (
Figure 5b and
Figure 7a); the latter corresponds to the potential vorticity anomaly within the tropopause fold (
Figure 5b).
The horizontal thermal gradient (
) at the turbulence report level is associated to the LSF, having an opposite sign to the UTF temperature gradient (see
Figure S1 in the Supplementary Material) (e.g., [
27,
45]). North of 46°N, above the tropopause fold, the thicker more stable stratospheric air is warmer than the air outside the tropopause fold on the same isobaric surfaces, thus creating a warm stratospheric pool inside the fold. This, in turn, leads to a reversal of the thermal wind direction above the tropopause which generates vertical wind shear, due to wind speed rapidly decreasing above the jet core (
Figure 7a). Note that this wind shear is at a maximum just south of the report location, above the jet stream axis, contributing, jointly with an upper convergence zone (
Figure 5a), to a local maximum of the TI2 marginal to the severe turbulence threshold (
Figure 7b).
The low values of the Dutton index in the report area are accounted for by the cyclonic shear vorticity poleward of the jet axis (
Figure 7a) which partially offsets the effect of the vertical wind shear. Similarly, the relatively low values of the second Ellrod index outside the mentioned maximum are due to the lower contribution of deformation in areas of horizontally homogeneous, relatively low curvature flow (
Figure 7c).
4.1.2. Case Study 1 April 2018
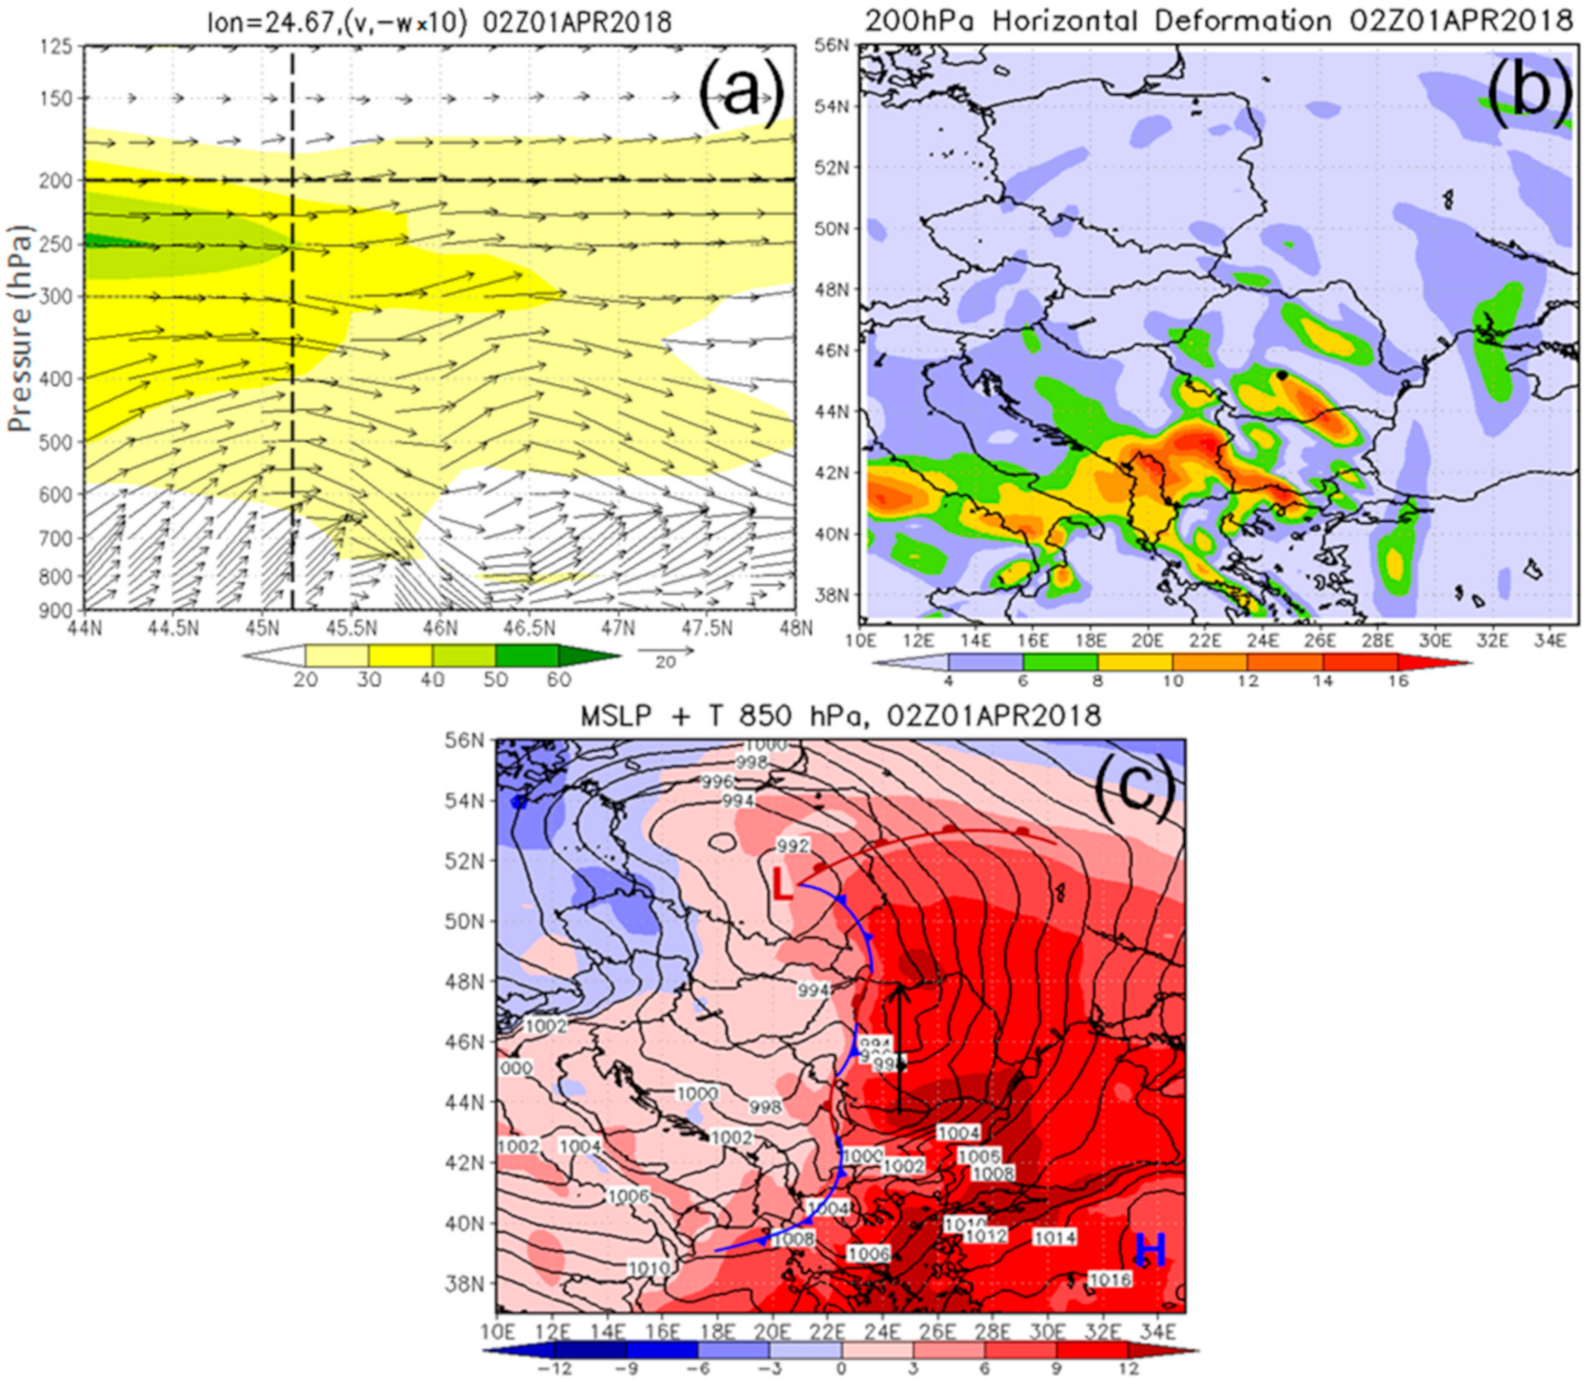
The event of 1 April 2018 occurred at 02:07 UTC, when the pilots reported severe turbulence at FL 390 (12 km altitude and 200 hPa pressure level), at approximately 45.17°N and 24.67°E, the closest city to the ground being Curtea de Argeș, southern Romania.
As it can be seen from satellite images (
Figure 9), the turbulence occurred above an area with quite a high humidity gradient. In the WV 6.2 μm (
Figure 9a) grey and dark grey areas are associated with intrusion of stratospheric dry air, and light grey and white areas indicate more moisture. In the Air mass RGB product, the humidity contrast is clearer between the two bands (one dark brown and the other one whiter). This can be also seen in relative humidity cross-section through the point where the report was transmitted (
Figure 10a). The vertical relative humidity cross-section (
Figure 10a) reveals that above 300 hPa level the air was very dry.
At 300 hPa level the turbulence report area was ahead of a trough extended from Germany to northern Greece, behind a developing upper ridge (
Figure 11a), and on the left exit of a jet streak (
Figure 11b). Thus, the turbulence appeared in an area with upper level divergence (similar to the R and D areas from
Figure 2).
In the area of the reported severe turbulence, the surface of 1.5 PVU was near the 300 hPa level (
Figure 12a). An indication of the tropopause level, can also be seen in
Figure 12b, in the ozone cross-section. The altitude at which the trubulence was reported (approximately 12 km) was within the stratosphere, in low humidity, cloud free conditions (
Figure 9a and
Figure 10a), which supports the classification of the event as CAT.
In the South-West of Romania, a high potential vorticity anomaly (
Figure 11b) indicated the presence of a tropopause fold, and ahead of this anomaly strong potential vorticity advection over the Romania-Serbia border area (
Figure 11b). This was forcing significant large-scale ascent (
Figure 10b) within a warm conveyor belt (WCB) structure which is evidenced by the baroclinic leaf cloud formation (
Figure 9) and also in the relative humidity zonal vertical cross-section (
Figure 10a).
Koch [
7] showed that upper tropospheric frontal zones often produce gravity–inertia waves, which propagate into the lower stratosphere within the high shear layer above the tropospheric jet stream. In turn, Shapiro [
49] related CAT to PV gradients and Kaplan et al. [
13] created a CAT predictor based on relative vorticity gradients. Turbulence may result from weak gravity waves when they modify the environmental stability and wind shear. Therefore, gravity waves are an indirect cause of CAT [
50], In our case, the satellite image show a wave pattern within the baroclinic leaf cloud formation in RGB AIRMASS image, clearly seen over western part of Romania (
Figure 9b).
As in the previous case (
Section 4.1), the horizontal temperature gradient and subsequent thermal wind reversal (
Figure 13a) in the lower stratosphere above the east-west sloping tropopause (
Figure 12) leads to increased values of
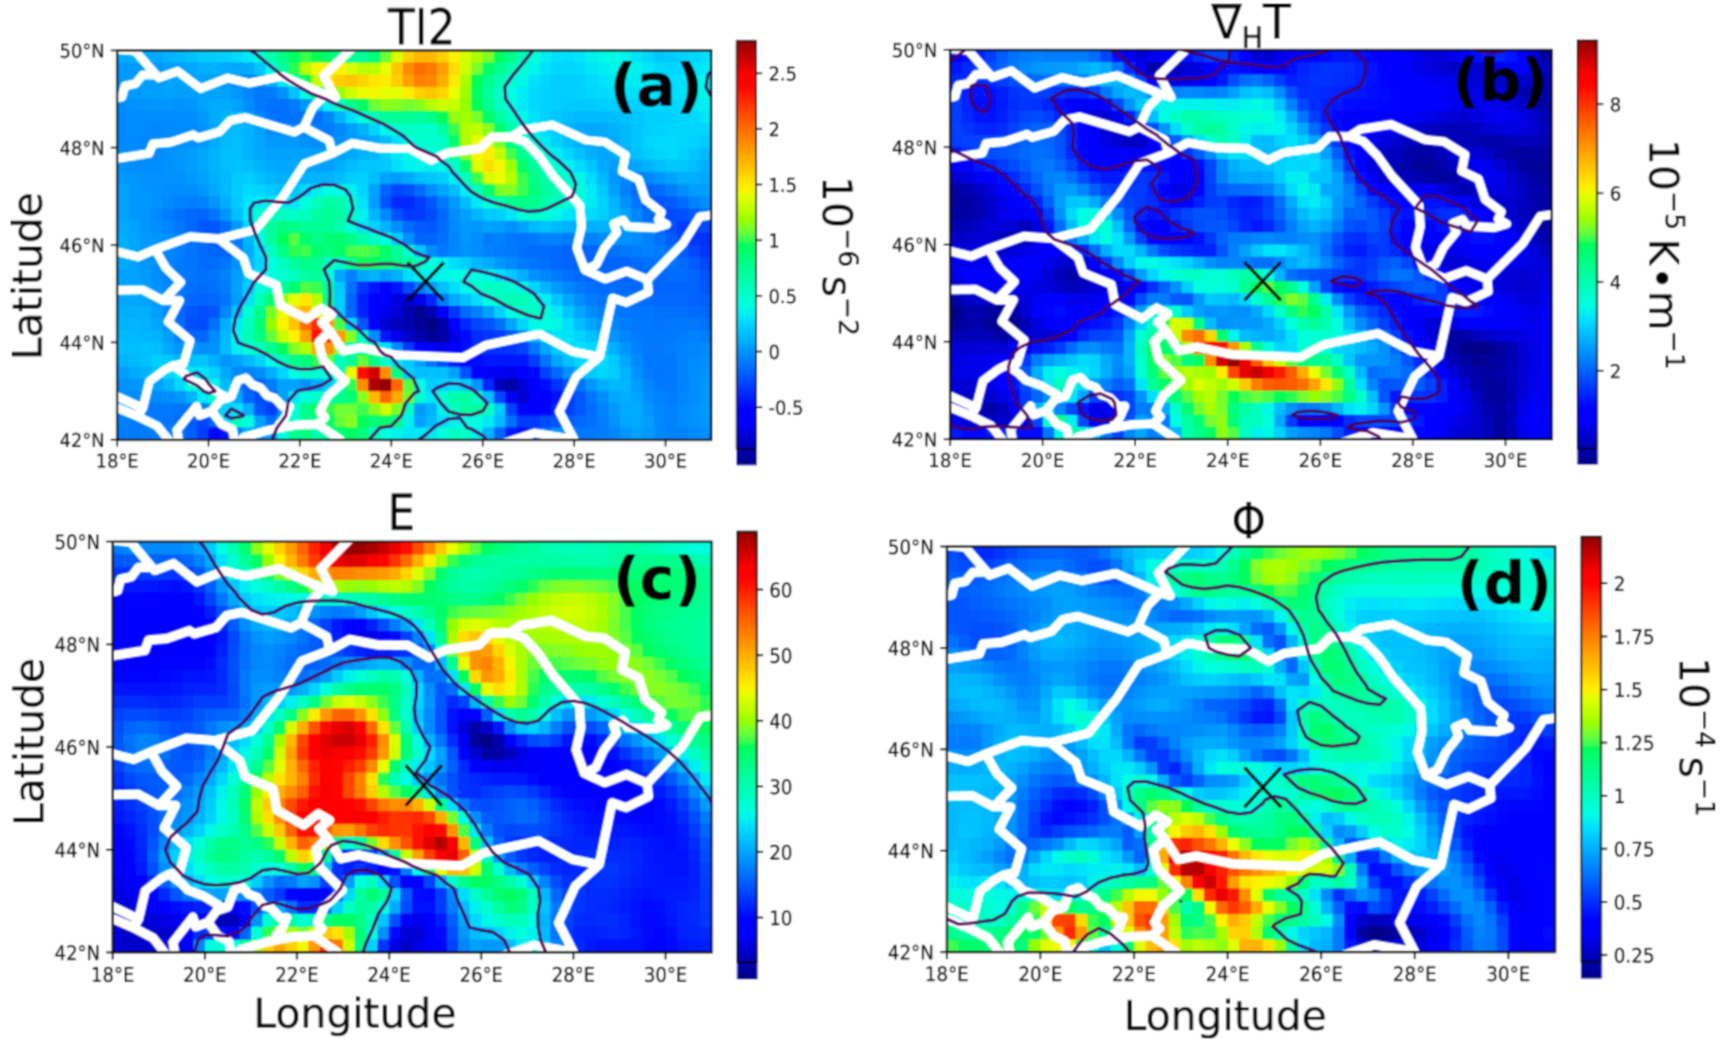
(exceeding almost 4 times the threshold for severe CAT) and vertical shear-related indices (E and TI2) at the level of the turbulence report. Furthermore, Dutton index (E) is also favored by the increasingly anticyclonic curvature of the upper flow ahead of the ridge (
Figure 14) and by a local deformation maximum associated with a shortwave trough embedded in the southwesterly flow (
Figure 11a and
Figure 13b). The divergence area ahead of the trough is keeping TI2 at lower values (just below the threshold). Very high values of cyclonic vorticity (through combined shear and curvature contributions) near the axis of the diffluent trough explain the maximum of the Brown index over SW Romania (
Figure 14). Although the per se tropopause fold is in this case positioned outside of Romanian territory, the zonal (eastward) sloping of the tropopause associated with a major frontal zone (
Figure 13c) influences all the turbulence indicators over large parts of Romania.
4.1.3. Case Study 24 October 2018
Another case of CAT associated with a tropopause fold occurred on 24 October 2018. Severe turbulence was reported at 1753 UTC, FL 450 (13700 m and 147 hPa pressure level) at approximately 45.67°N, 24.87°E and at 1817 UTC, FL 230 (7000m, 410 hPa pressure level), the closest city for both reports was Făgăraș (in central Romania).
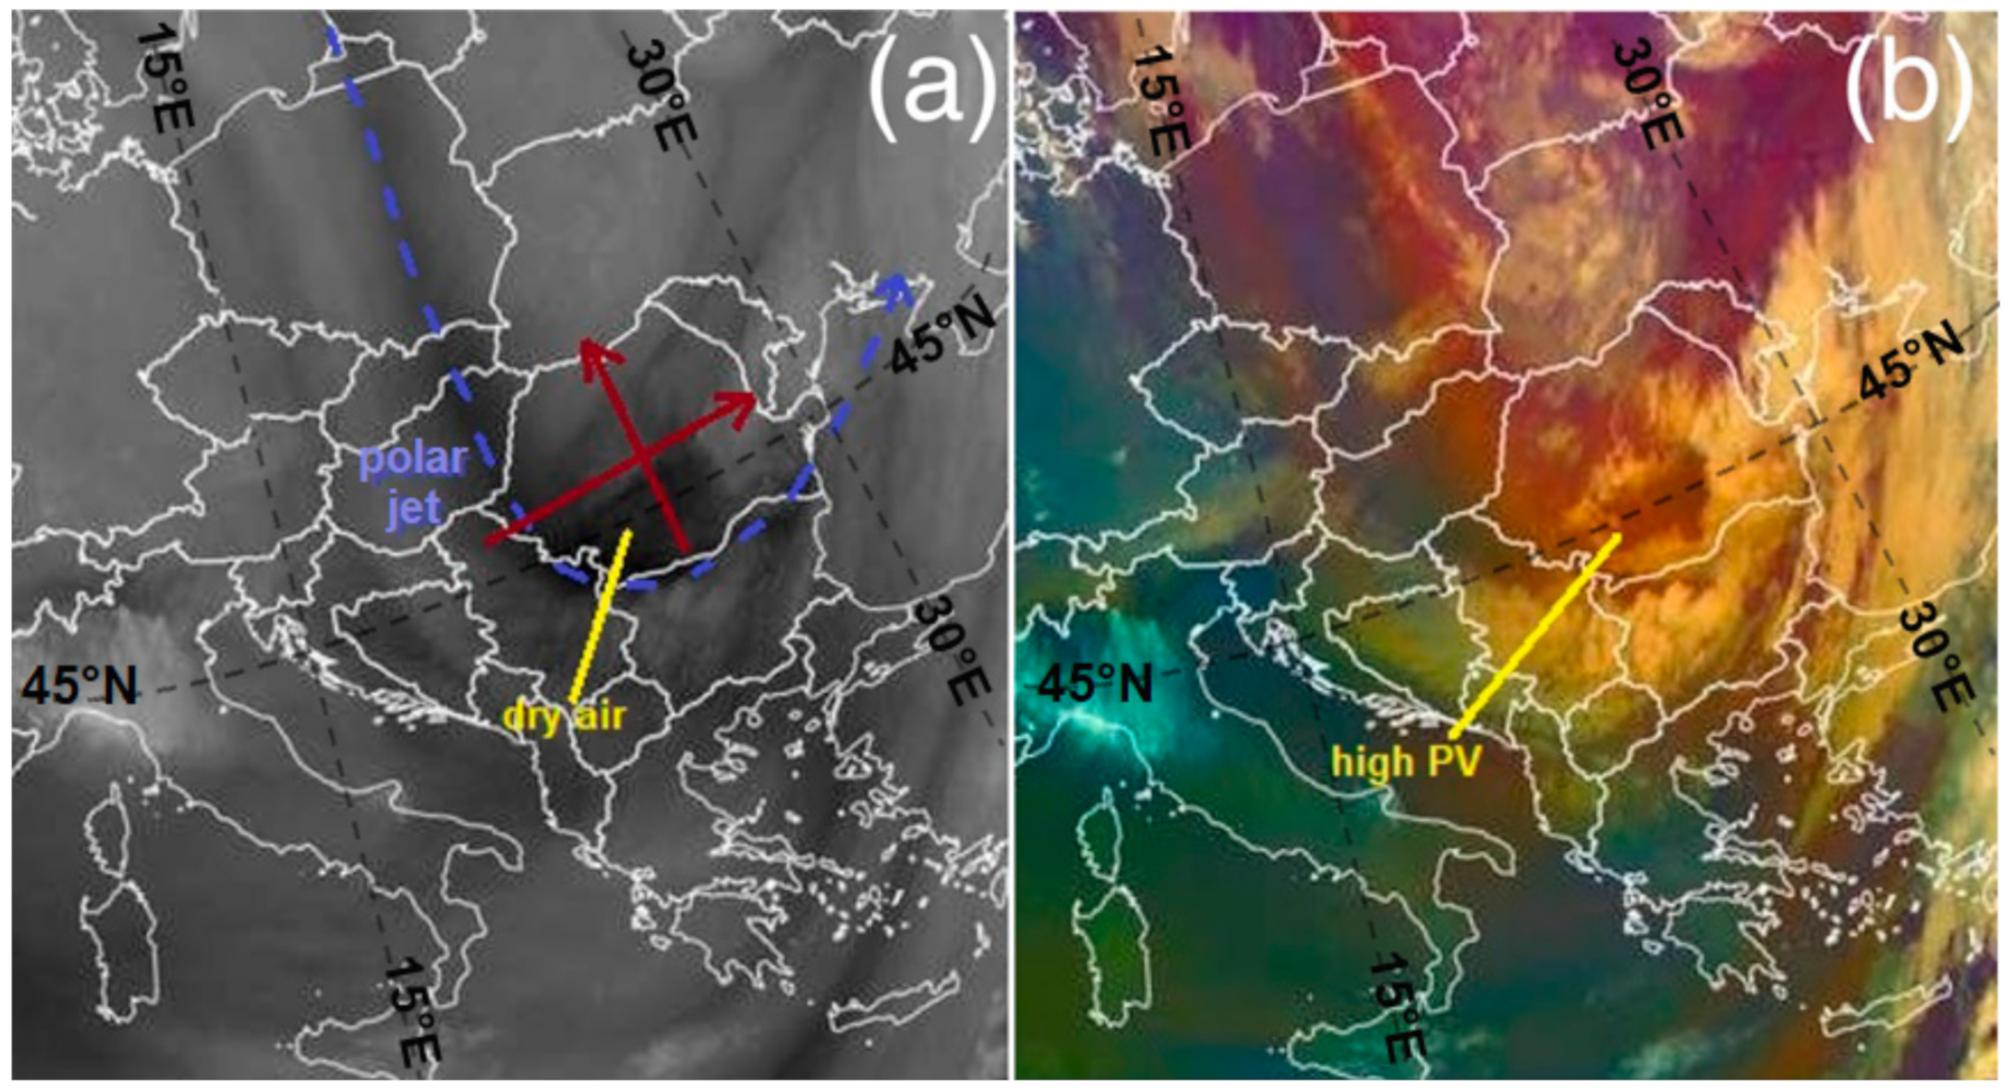
The satellite images reveal that the severe turbulence occurred in an area with few medium clouds (
Figure 15a, dark grey area), and a dry stratospheric air intrusion with high positive potential vorticity anomaly (
Figure 15b, reddish area). This agrees with the relative humidity meridional vertical cross-section through the observation point (
Figure 16). It indicates high humidity up to 500 hPa (low and medium clouds) and dry cloudless air above this level. Thus, turbulence from both reports was classified as CAT.
As shown in
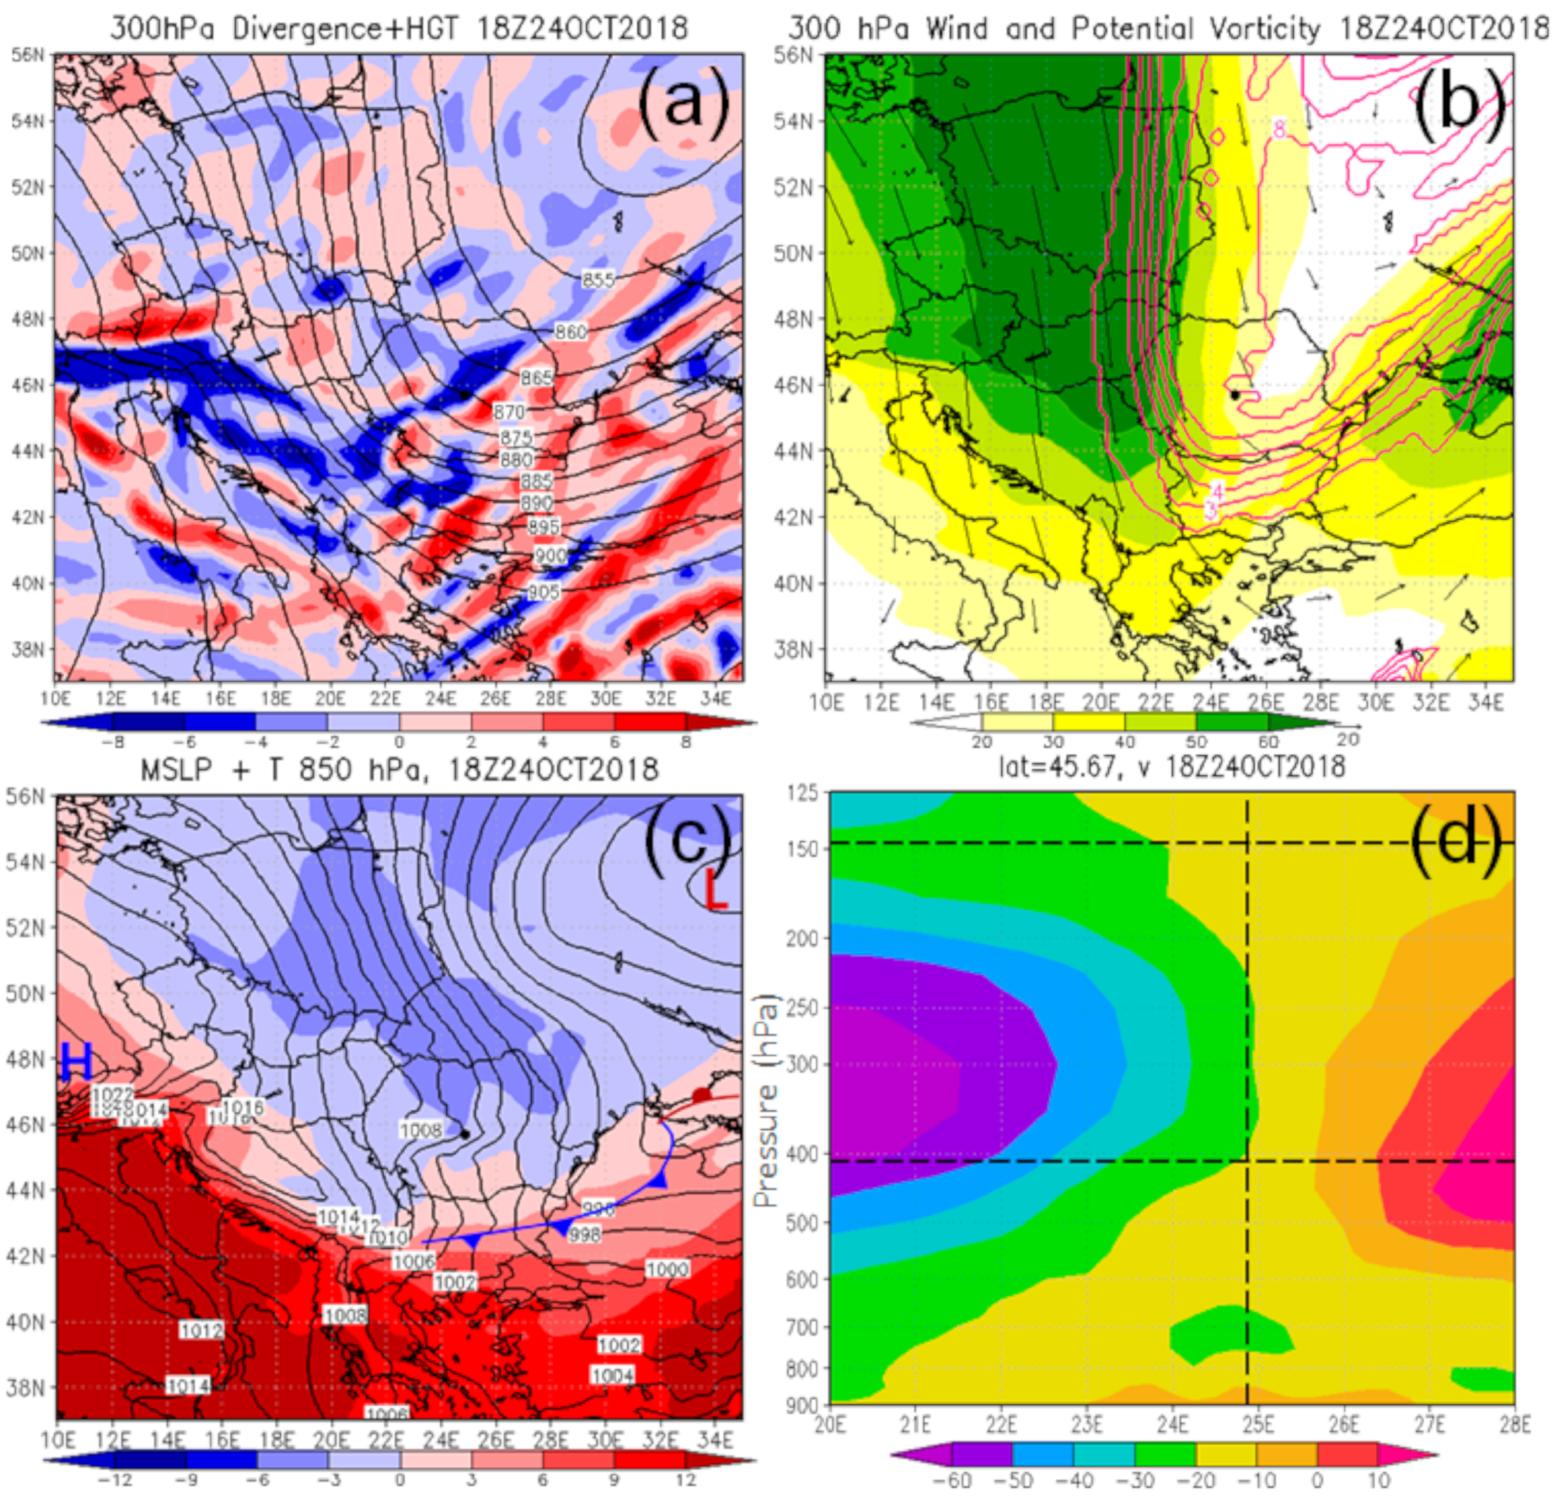
Figure 17, the reported severe turbulence occurred on the axis of an upper air trough (a) (T area from
Figure 2), and near the eastern boundary of a polar jet branch (b) (J area from
Figure 2)-areas in which usually turbulence can occur.
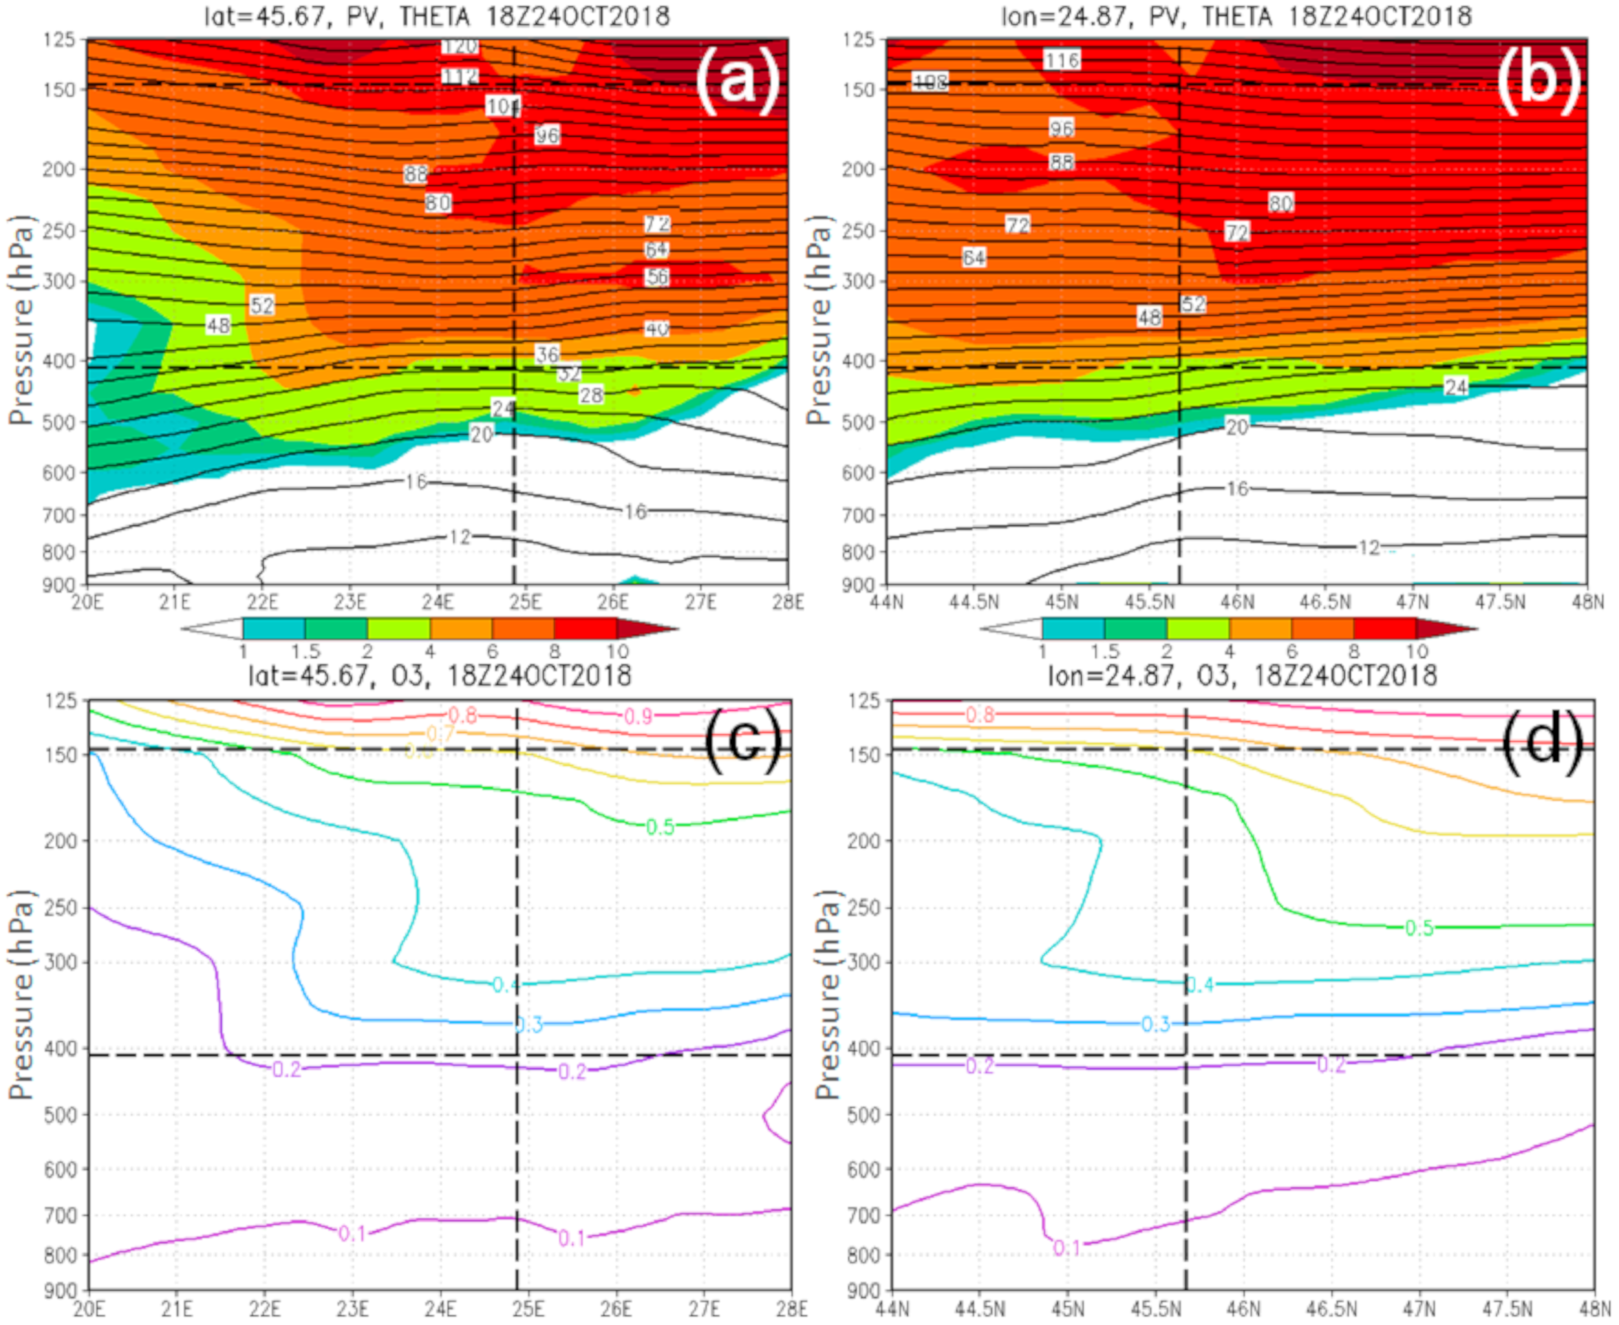
The CAT area lies within a high positive PV anomaly (
Figure 17b). The 1.5 PVU surface (dynamic tropopause) descended to the middle of the troposphere (between 500 and 600 hPa level) (
Figure 18a,b) indicating the presence of a tropopause fold. The tropopause fold is also indicated in the ozone concentration vertical cross section (
Figure 18c,d) which shows a strong transport between the stratosphere and the troposphere.
As shown in
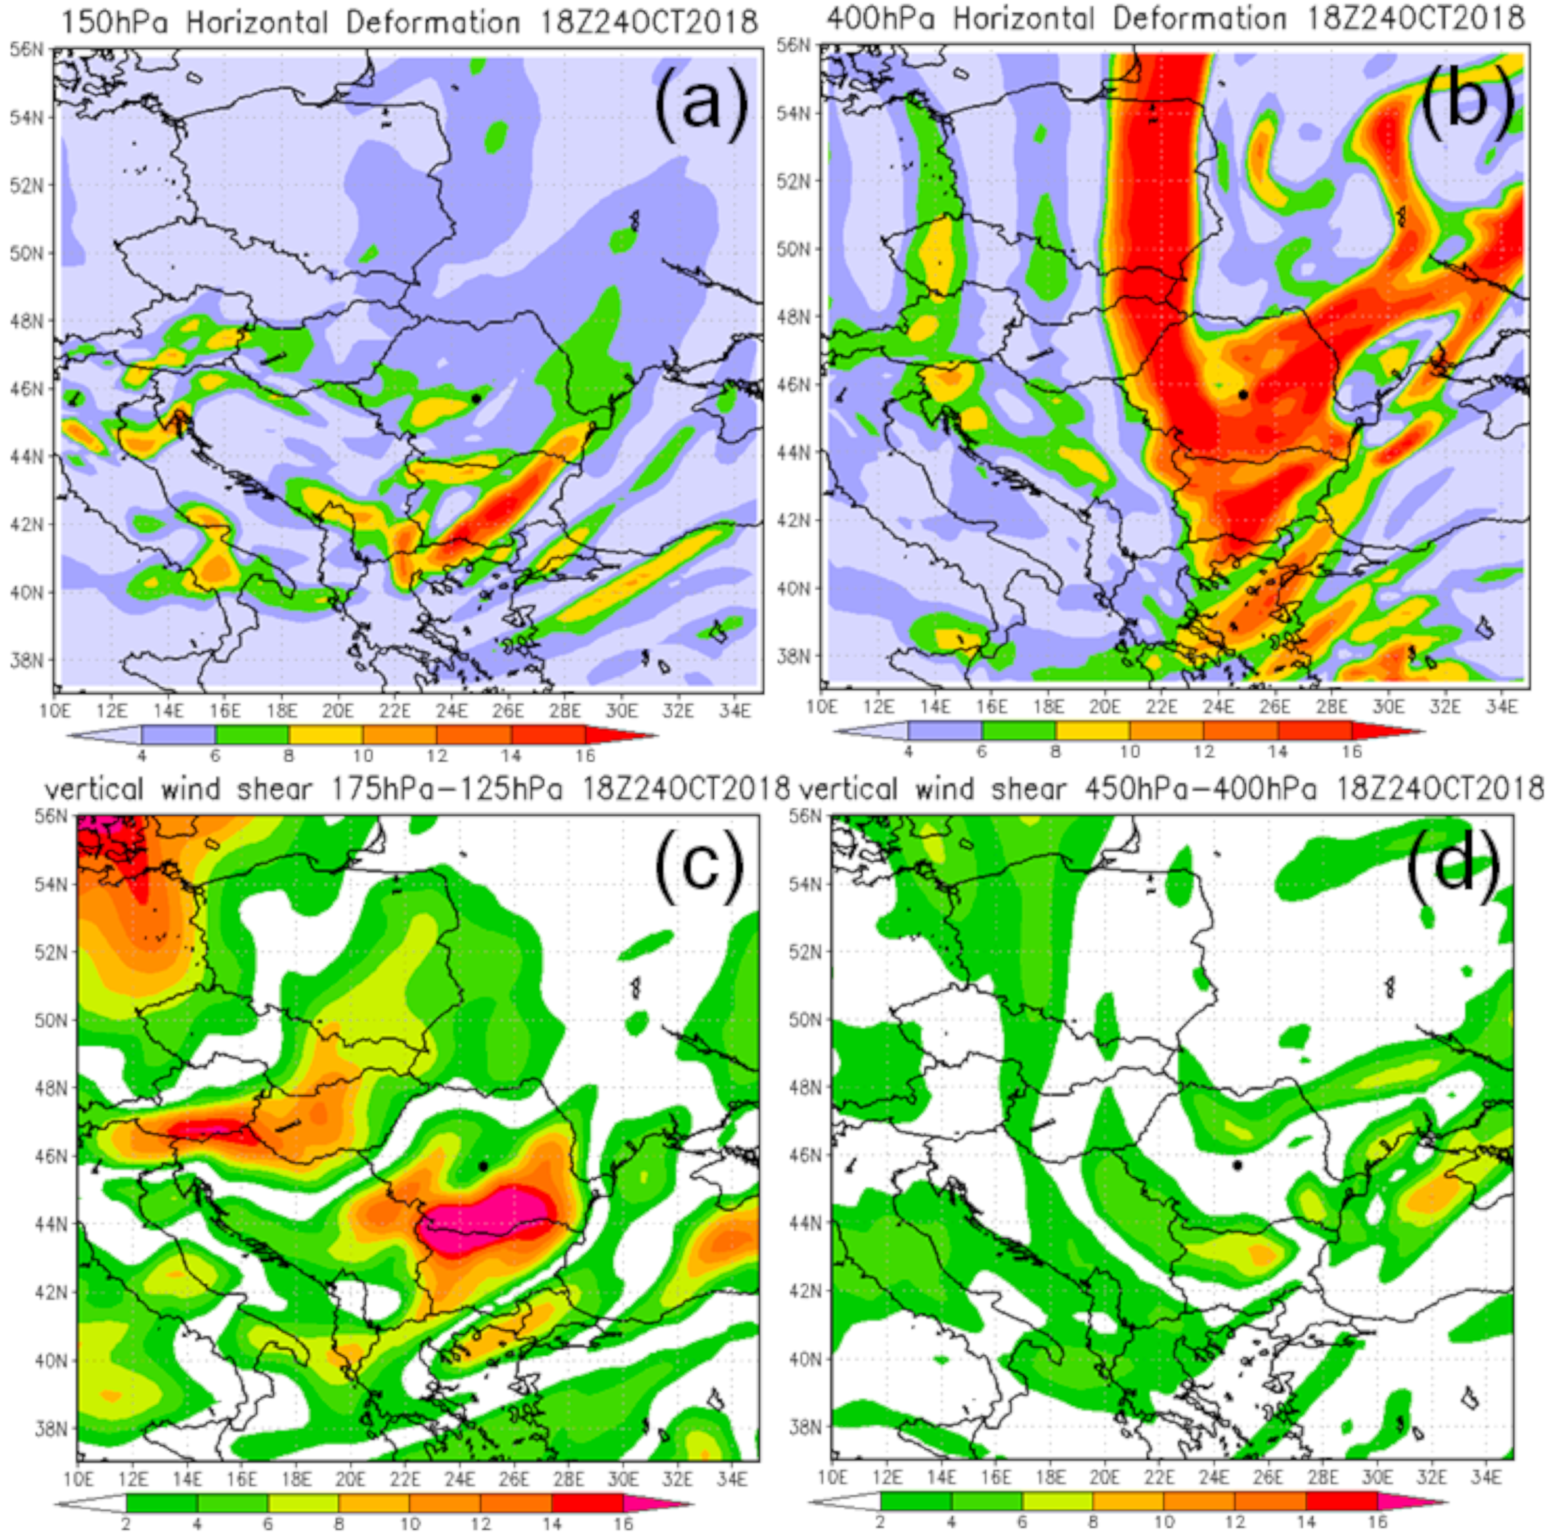
Figure 17c, Romania was behind of a cold front, and MSLP was rising due to strong descending motions caused by the cold advection and negative vorticity advection leading to upper level convergence behind the upper trough axis. In this case, the
TI2 maximum is mostly caused by the strong convergence behind the trough axis (
Figure 17a) and by the horizontal shear (of the v component) and shearing deformation caused by the flow curvature, especially at the lower report level (
Figure 17d and
Figure 19a,b), while the maximum of the Brown index-by the high values of vorticity near the trough axis (
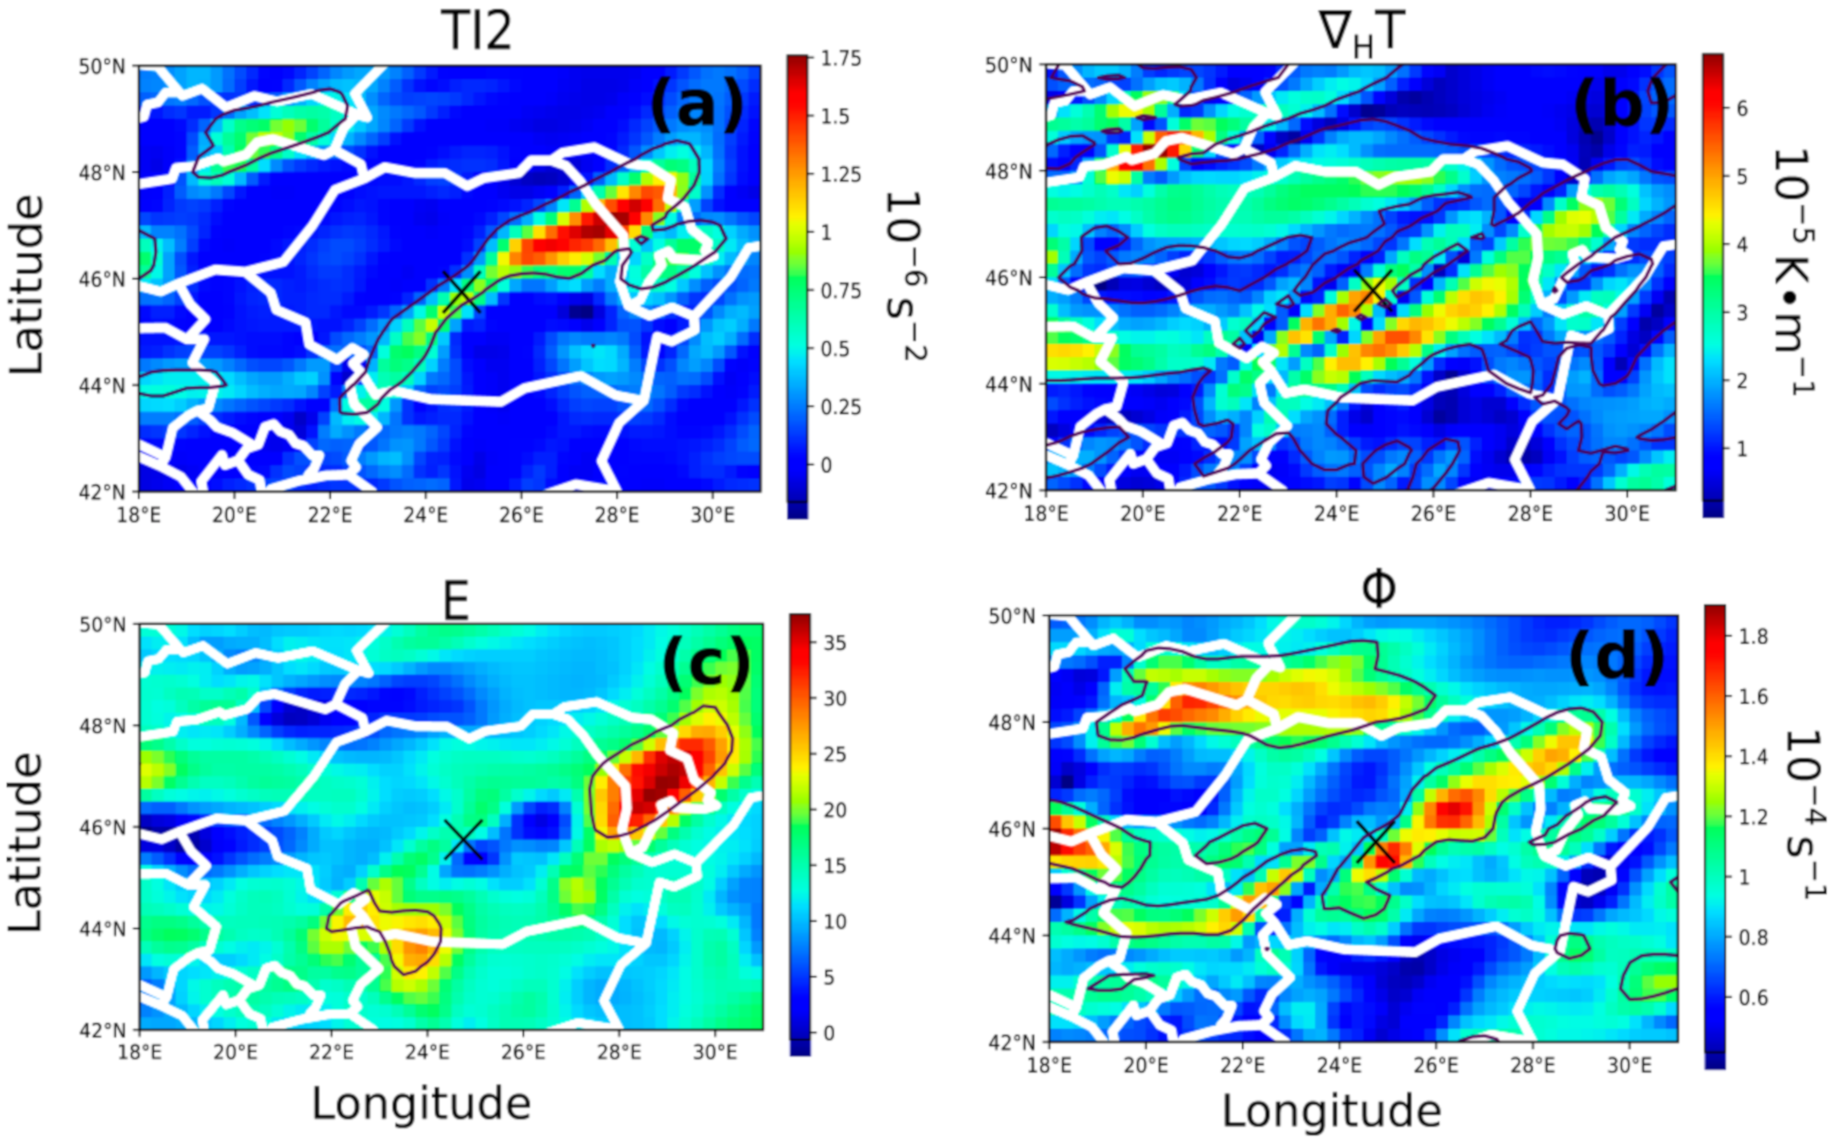
Figure 17b). As for
, which exceeds almost three times the threshold value for severe turbulence at the location of the reports (
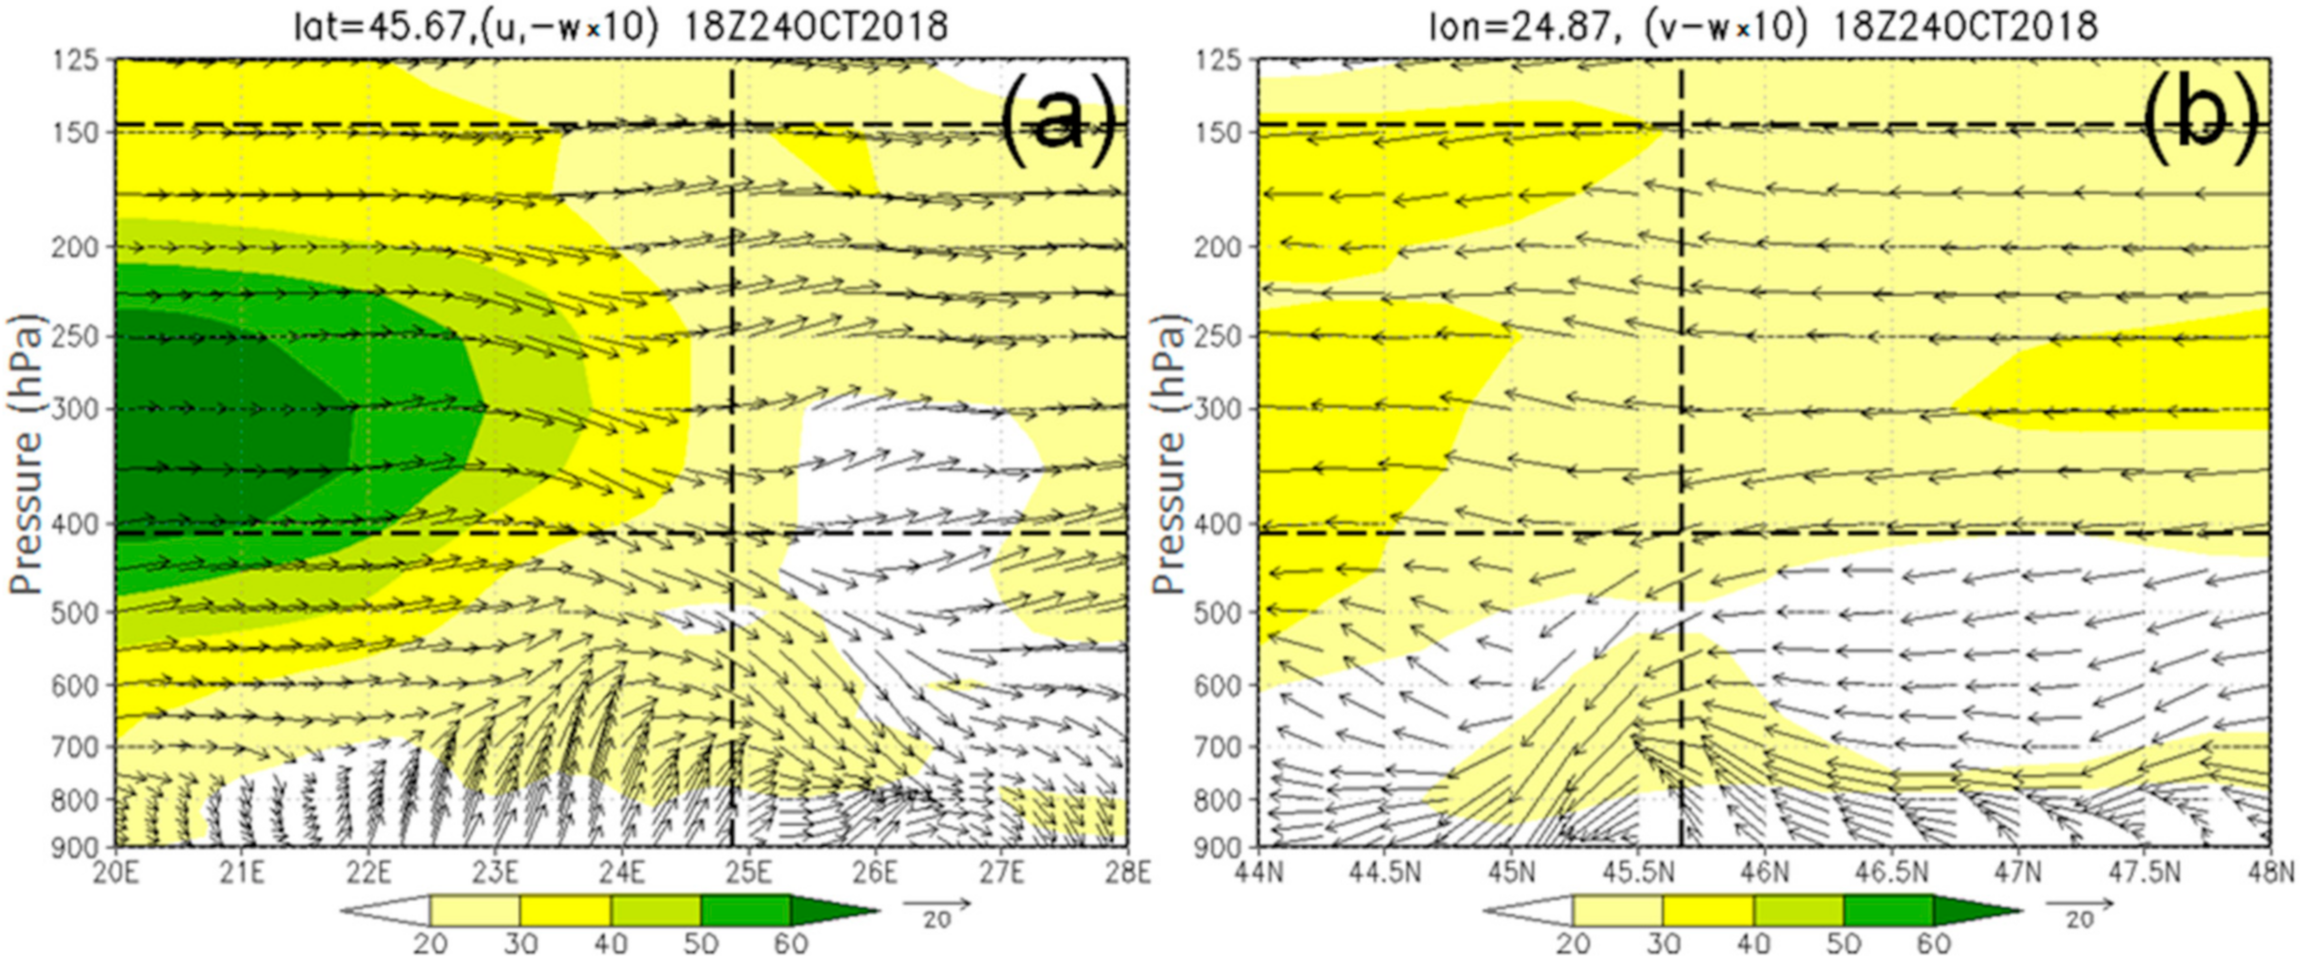
Table 2), it is the result of temperature gradients of opposed signs at the levels of the two reports. As in the previous cases, the marked meridional and zonal slope of the tropopause is causing a reversal of the horizontal temperature gradient from its tropospheric values, with warmer air lying in the lower stratosphere at the upper report level to the North and East (
Figure 18a,b). This, in turn, generates a south-easterly thermal wind and provides the vertical shear in the lower stratosphere at or near the upper report location (
Figure 19c and
Figure 20a,b). Conversely, the horizontal temperature gradient near the lower report location is the tropospheric gradient related to the upper cold front, with warmer air lying to the South (
Figure 18a,b).
This generates a westerly thermal wind and corresponding vertical shear near the lower report location (
Figure 19d and
Figure 20a), but the horizontal shearing deformation around the trough axis appears to be the main factor in this case.
The Dutton (E) index is the only one that presents relatively low values over the reports area, mostly due to the prevalence of cyclonic shear (
Figure 21 and
Figure 22).
The two reports are thus connected to the shear layers representing the upper and lower boundaries of the tropospheric jet stream and to the stratospheric and tropospheric layers of horizontal temperature gradients forming the upper frontal zones (see also [
5,
24,
27]).
5. Conclusions
Romania is a country with an important role in international air transport, with over 107 thousand jobs in aviation and economic activity exceeding 2.3 billion euros, the 23rd place in Europe [
51] Romania’s airspace is very important, since it serves Europe-Asia traffic, with 19.317 million passengers out of a total of over 1.105 billion transiting Europe in 2018 [
52]. From this point of view, the study of the meteorological conditions over the Romanian airspace of the country it is important for the safety of international air traffic routes.
Through this study we contribute to a more accessible and faster way of forecasting CAT associated with tropopause folds, based on NWP calculated indices (model diagnostics). To better understand the threat of CAT in the Romanian airspace, pilot reports for turbulence between June 2017 and December 2018 were analyzed. Our study focuses on the influence of tropopause folds on higher than moderate CAT events and is aimed at finding appropriate indices which can be quickly and easily used by meteorological forecast centers.
To analyze CAT events, a series of turbulence indices previously proposed by different authors have been calculated (i.e., Ellrod, Dutton, Brown and horizontal temperature gradient). Reanalysis data and satellite imagery were also used to characterize the environments associated with CAT.
A total of 420 turbulence reports were analyzed, with severe turbulence being reported in 80 cases of which 13 cases where associated with tropopause folding. The results showed that the most useful indices for identifying tropopause folding related CAT are the horizontal temperature gradient and Brown index (77% of TF cases are associated to exceeding severe turbulence threshold and 62% of TF cases showed Brown index exceeding severe turbulence threshold). Thus, these two indices, used together, could offer a good indication of CAT related tropopause folding development for aeronautical forecasters everywhere in Europe and not only.
To give more robustness to our results, three relevant case studies of CAT associated with tropopause fold were analyzed and the main conclusions are:
- (1)
In all three cases, the turbulence was reported above the dynamic tropopause, where strong stability provides one of the ingredients for KHI. Horizontal temperature gradients and the related vertical shear induced in the lower stratosphere by tropopause folds or tropopause sloping in frontal zones adds to provide the other KHI ingredient, thus increasing the risk of clear air turbulence, especially when combined with vorticity and/or deformation fields.
- (2)
is the only one index which present extremely high values in all three case studies presented here. Therefore, this index can be associated to this special case of CAT suggesting that it can be used as a proxy for turbulence originating from tropopause folding.
- (3)
All the three cases were located in proximity of a tropospheric jet stream, either polweard of the jet core (case 1), or at its entrance/exit (cases 2 and 3).
As most of the air traffic within the Romanian airspace occurs at high levels (300–150 hPa), when tropopause lowers, the aircraft sample the lower stratosphere, well above the tropopause. Therefore, a complete study of turbulence occurences around the tropopause folds, needs to be based on a large number of air traffic reports within the troposphere. For instance a terminal area of a major airport (e.g., Bucharest Otopeni) where both ascending and descending flights take place in large numbers. For statistical significance, it will need to extend over a longer period of time, due to the more limited spatial extent of the domain sampled by air traffic in this case. Further work is also needed to investigate the use of Richardson number in TF induced CAT and to test the performance of TF induced CAT forecasts.
Nevertheless, the case studies show that tropopause folds and their connected dynamical processes can be the trigger for CAT events well above and away from the tropopause surface.
