A Comparison of Precipitation Measurements with a PWS100 Laser Sensor and a Geonor T-200B Precipitation Gauge at a Nival Glacial Zone in Eastern Tianshan, Central Asia
Abstract
1. Introduction
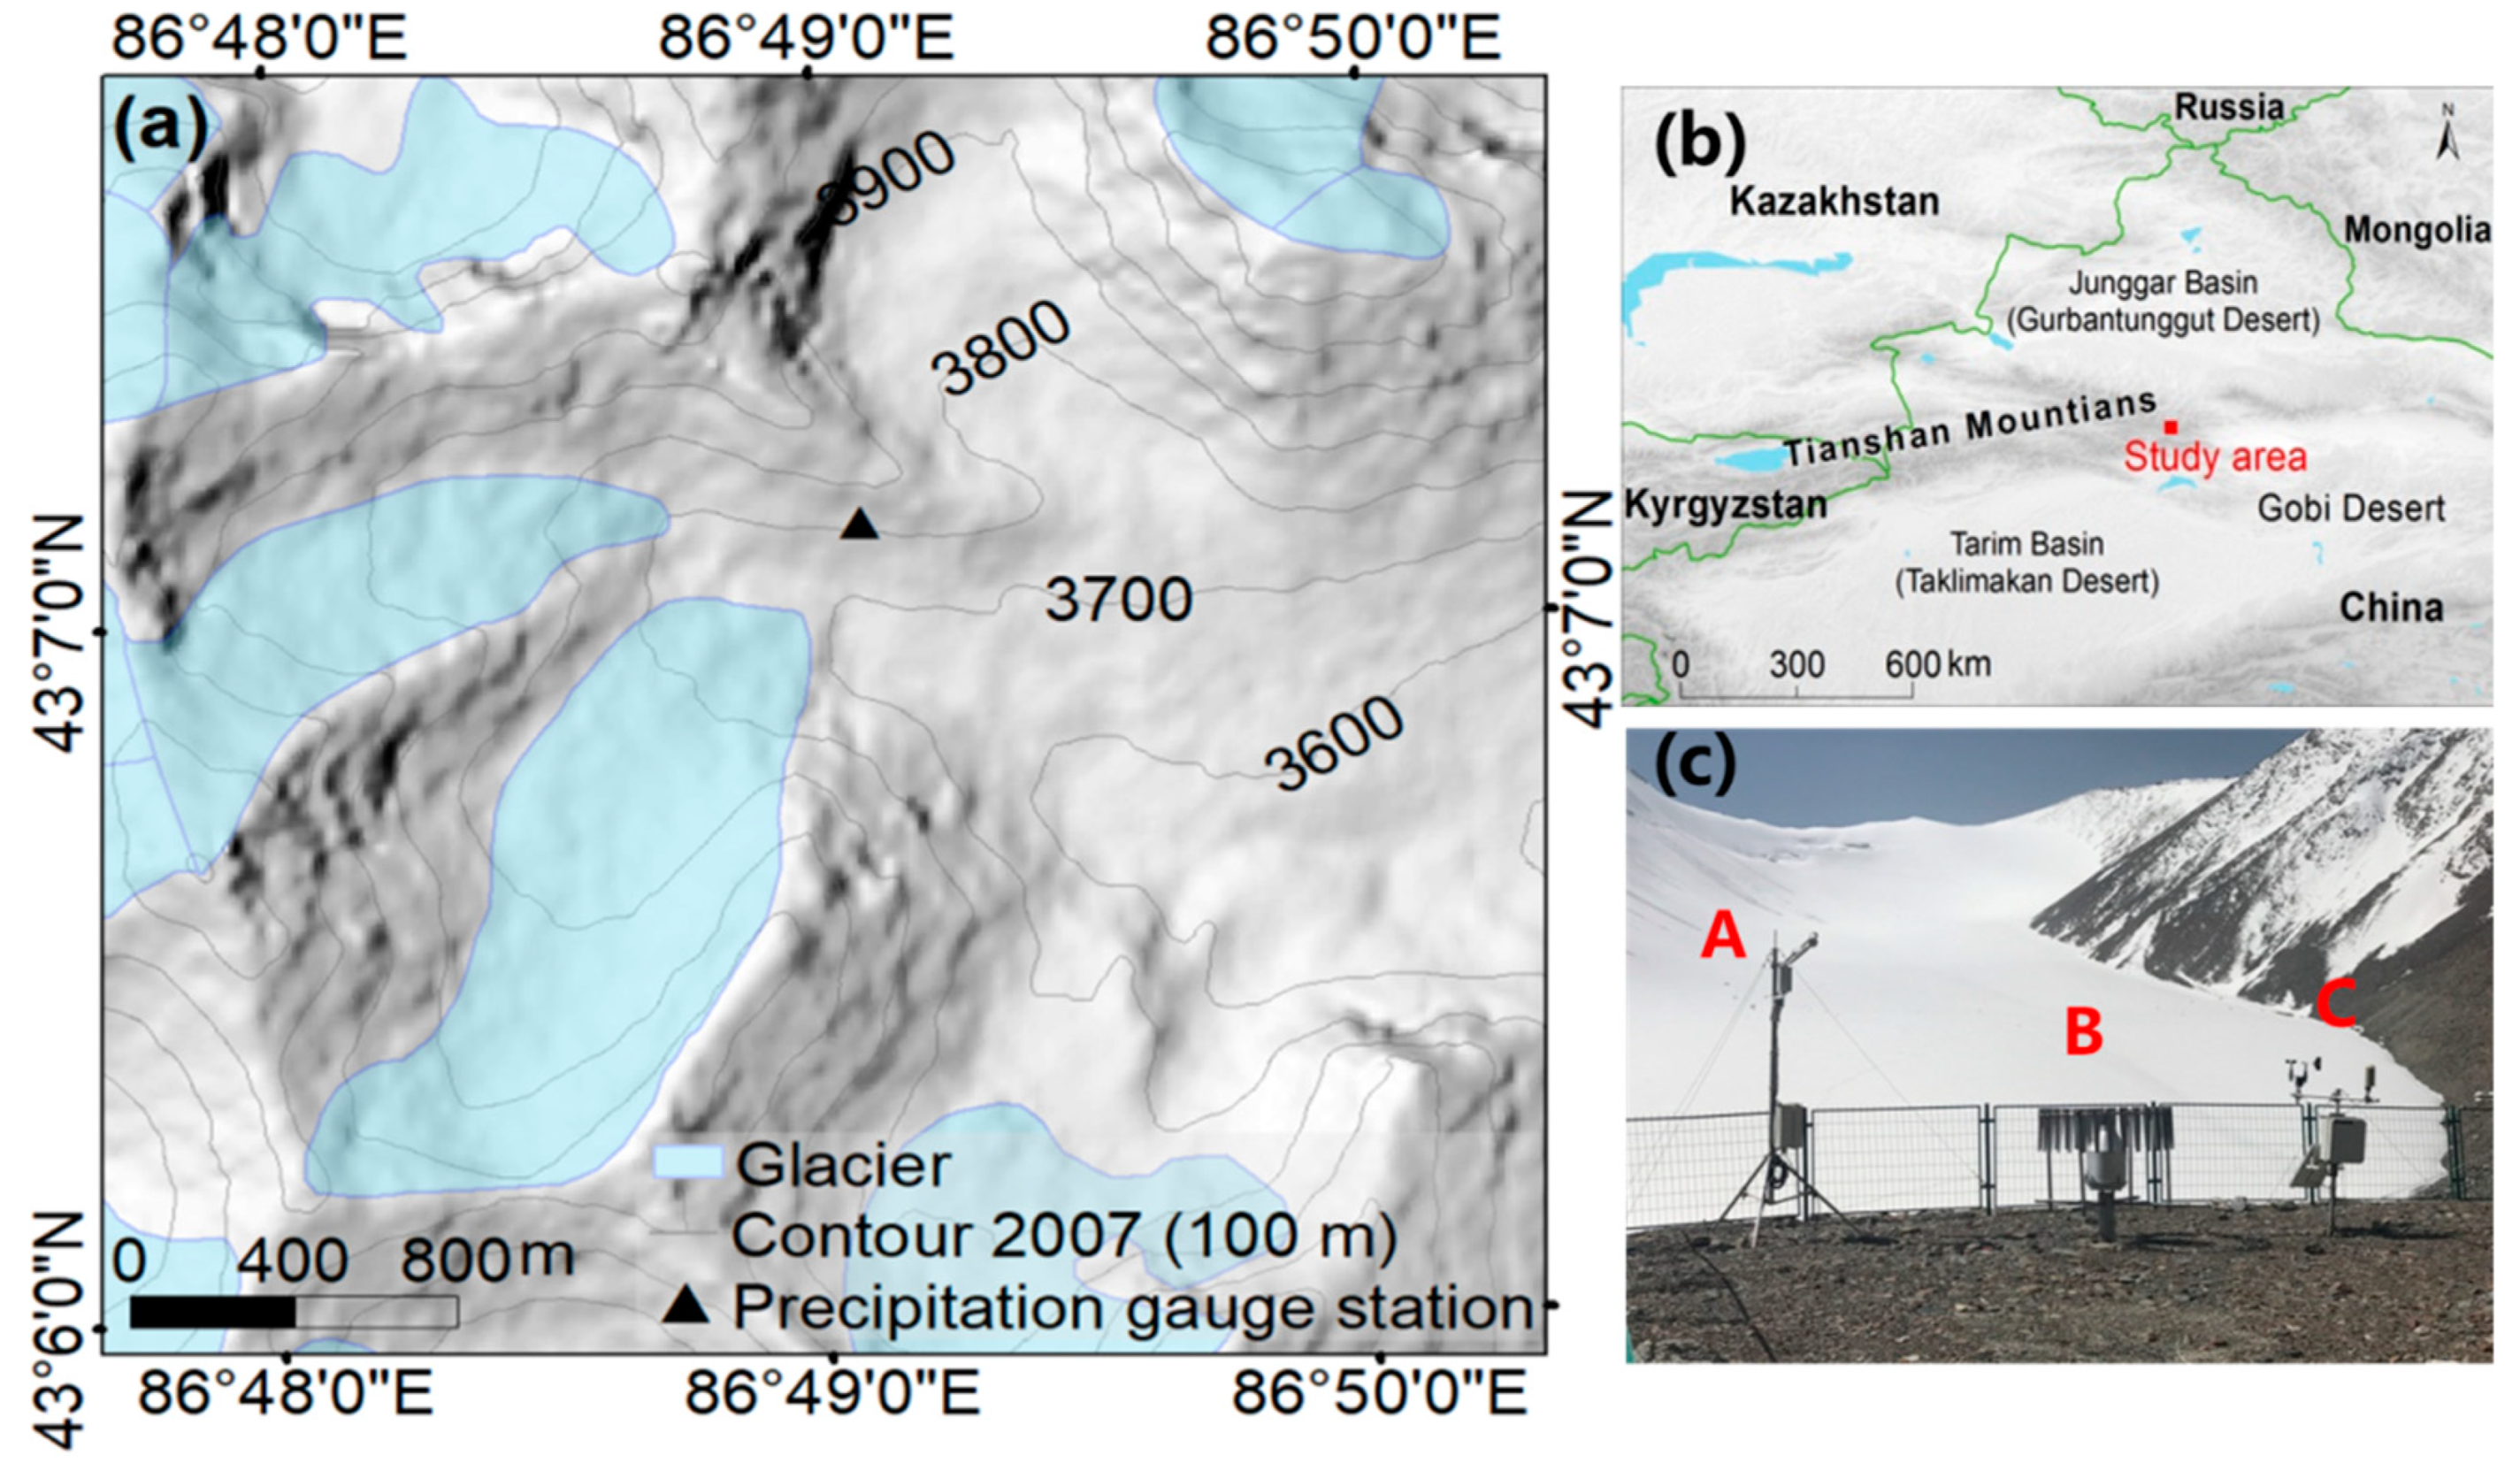
2. Experiment Site, Instrument and Data
2.1. Experiment Site
2.2. Instrument and Data
2.2.1. Geonor T-200B
2.2.2. PWS100
2.2.3. Data
3. Results and Discussion
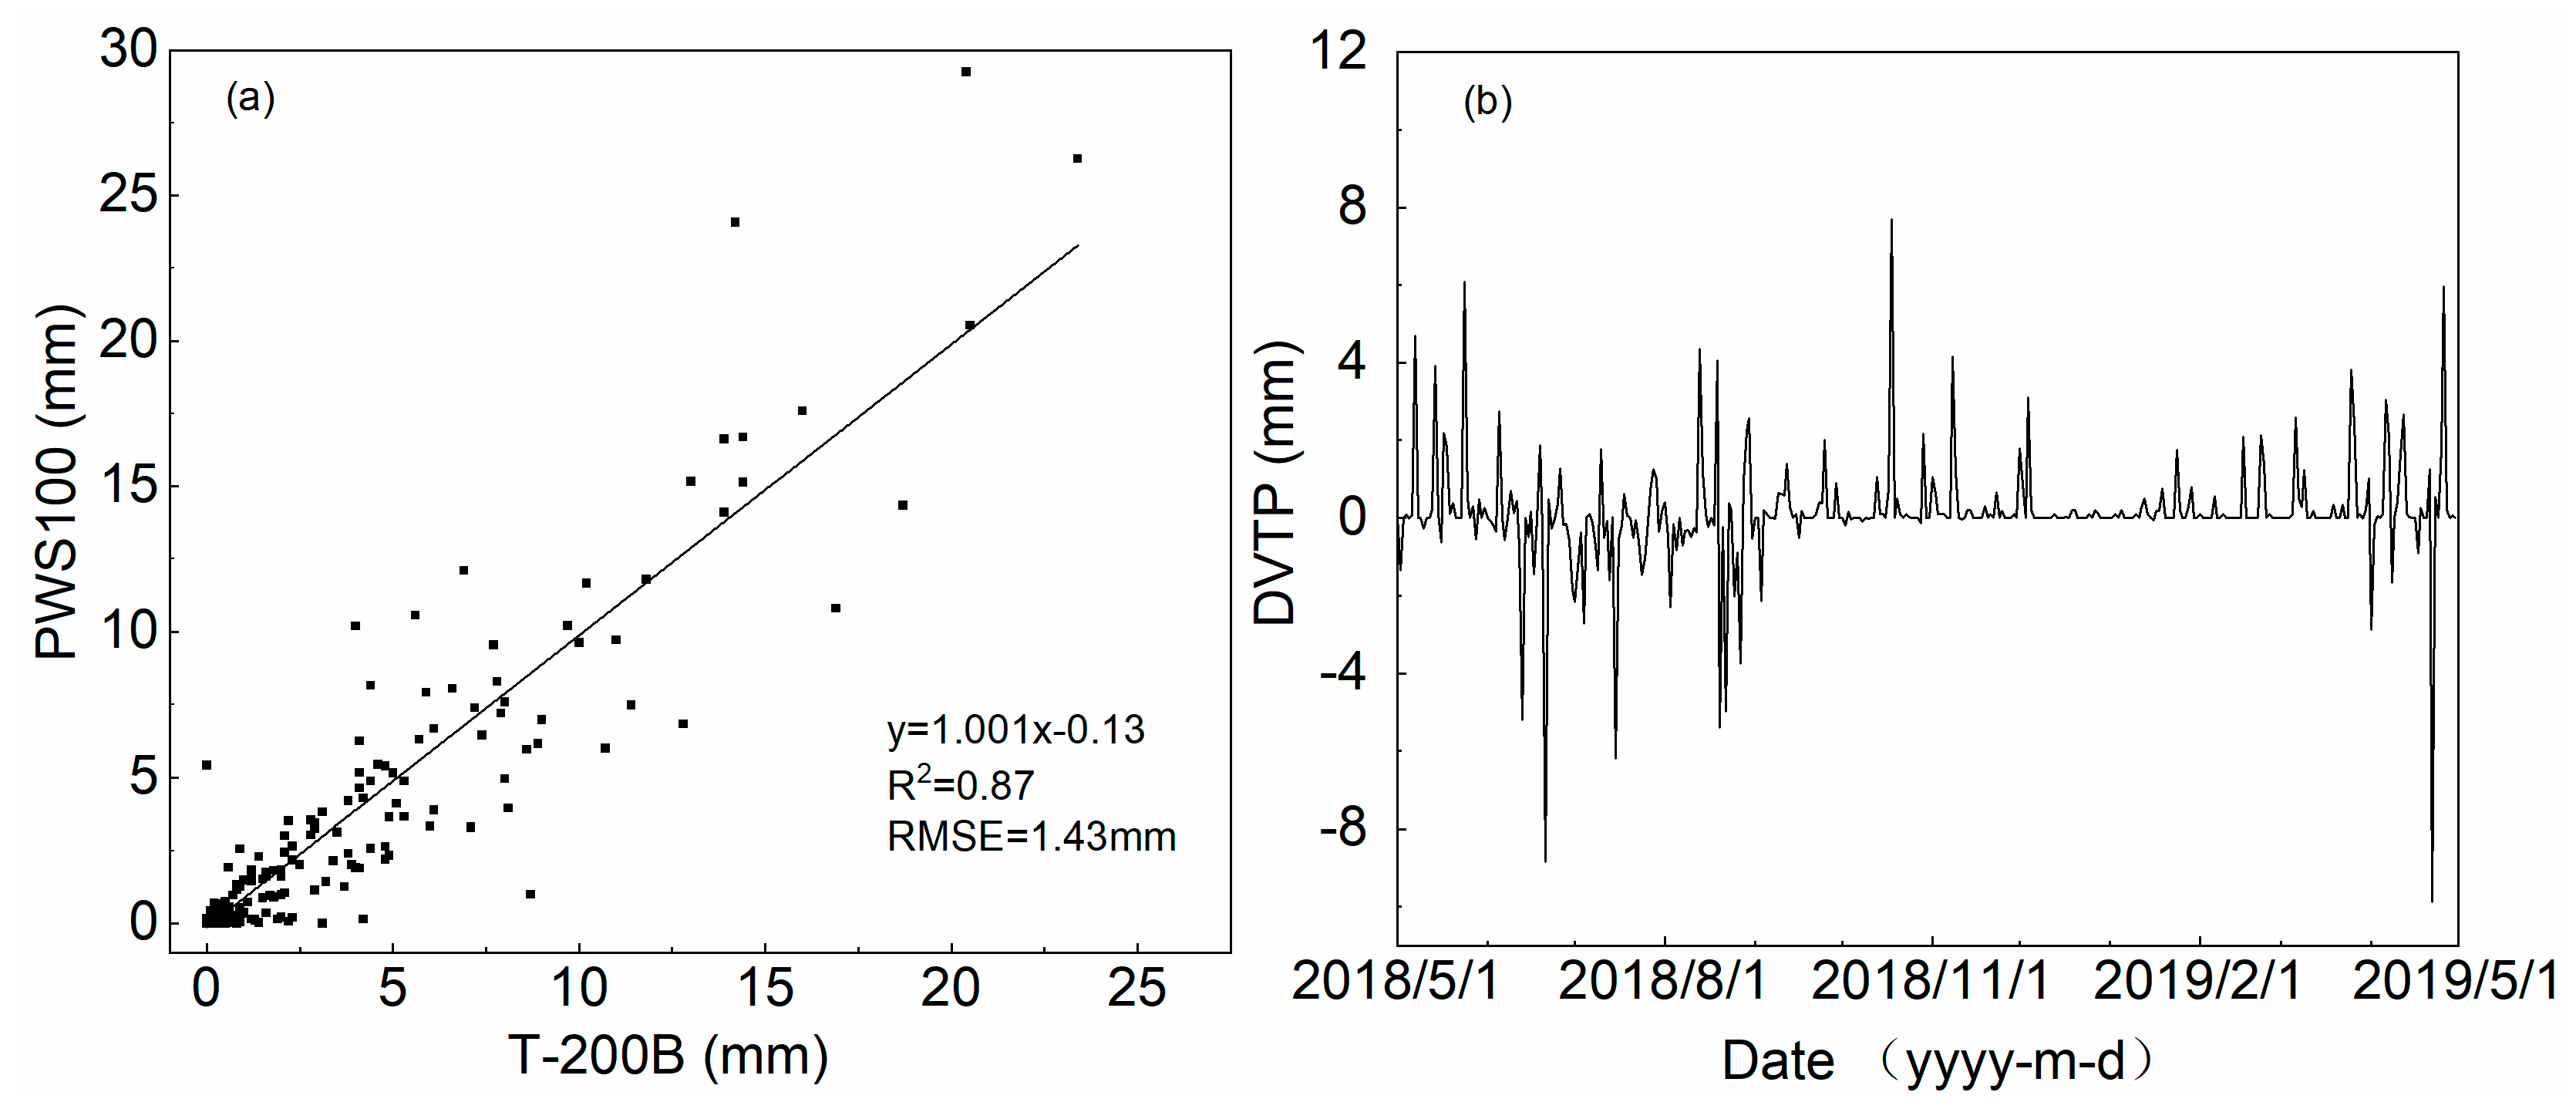
3.1. Comparison of Measured Precipitation from Two Instruments
3.1.1. Daily Precipitation Amount and Days
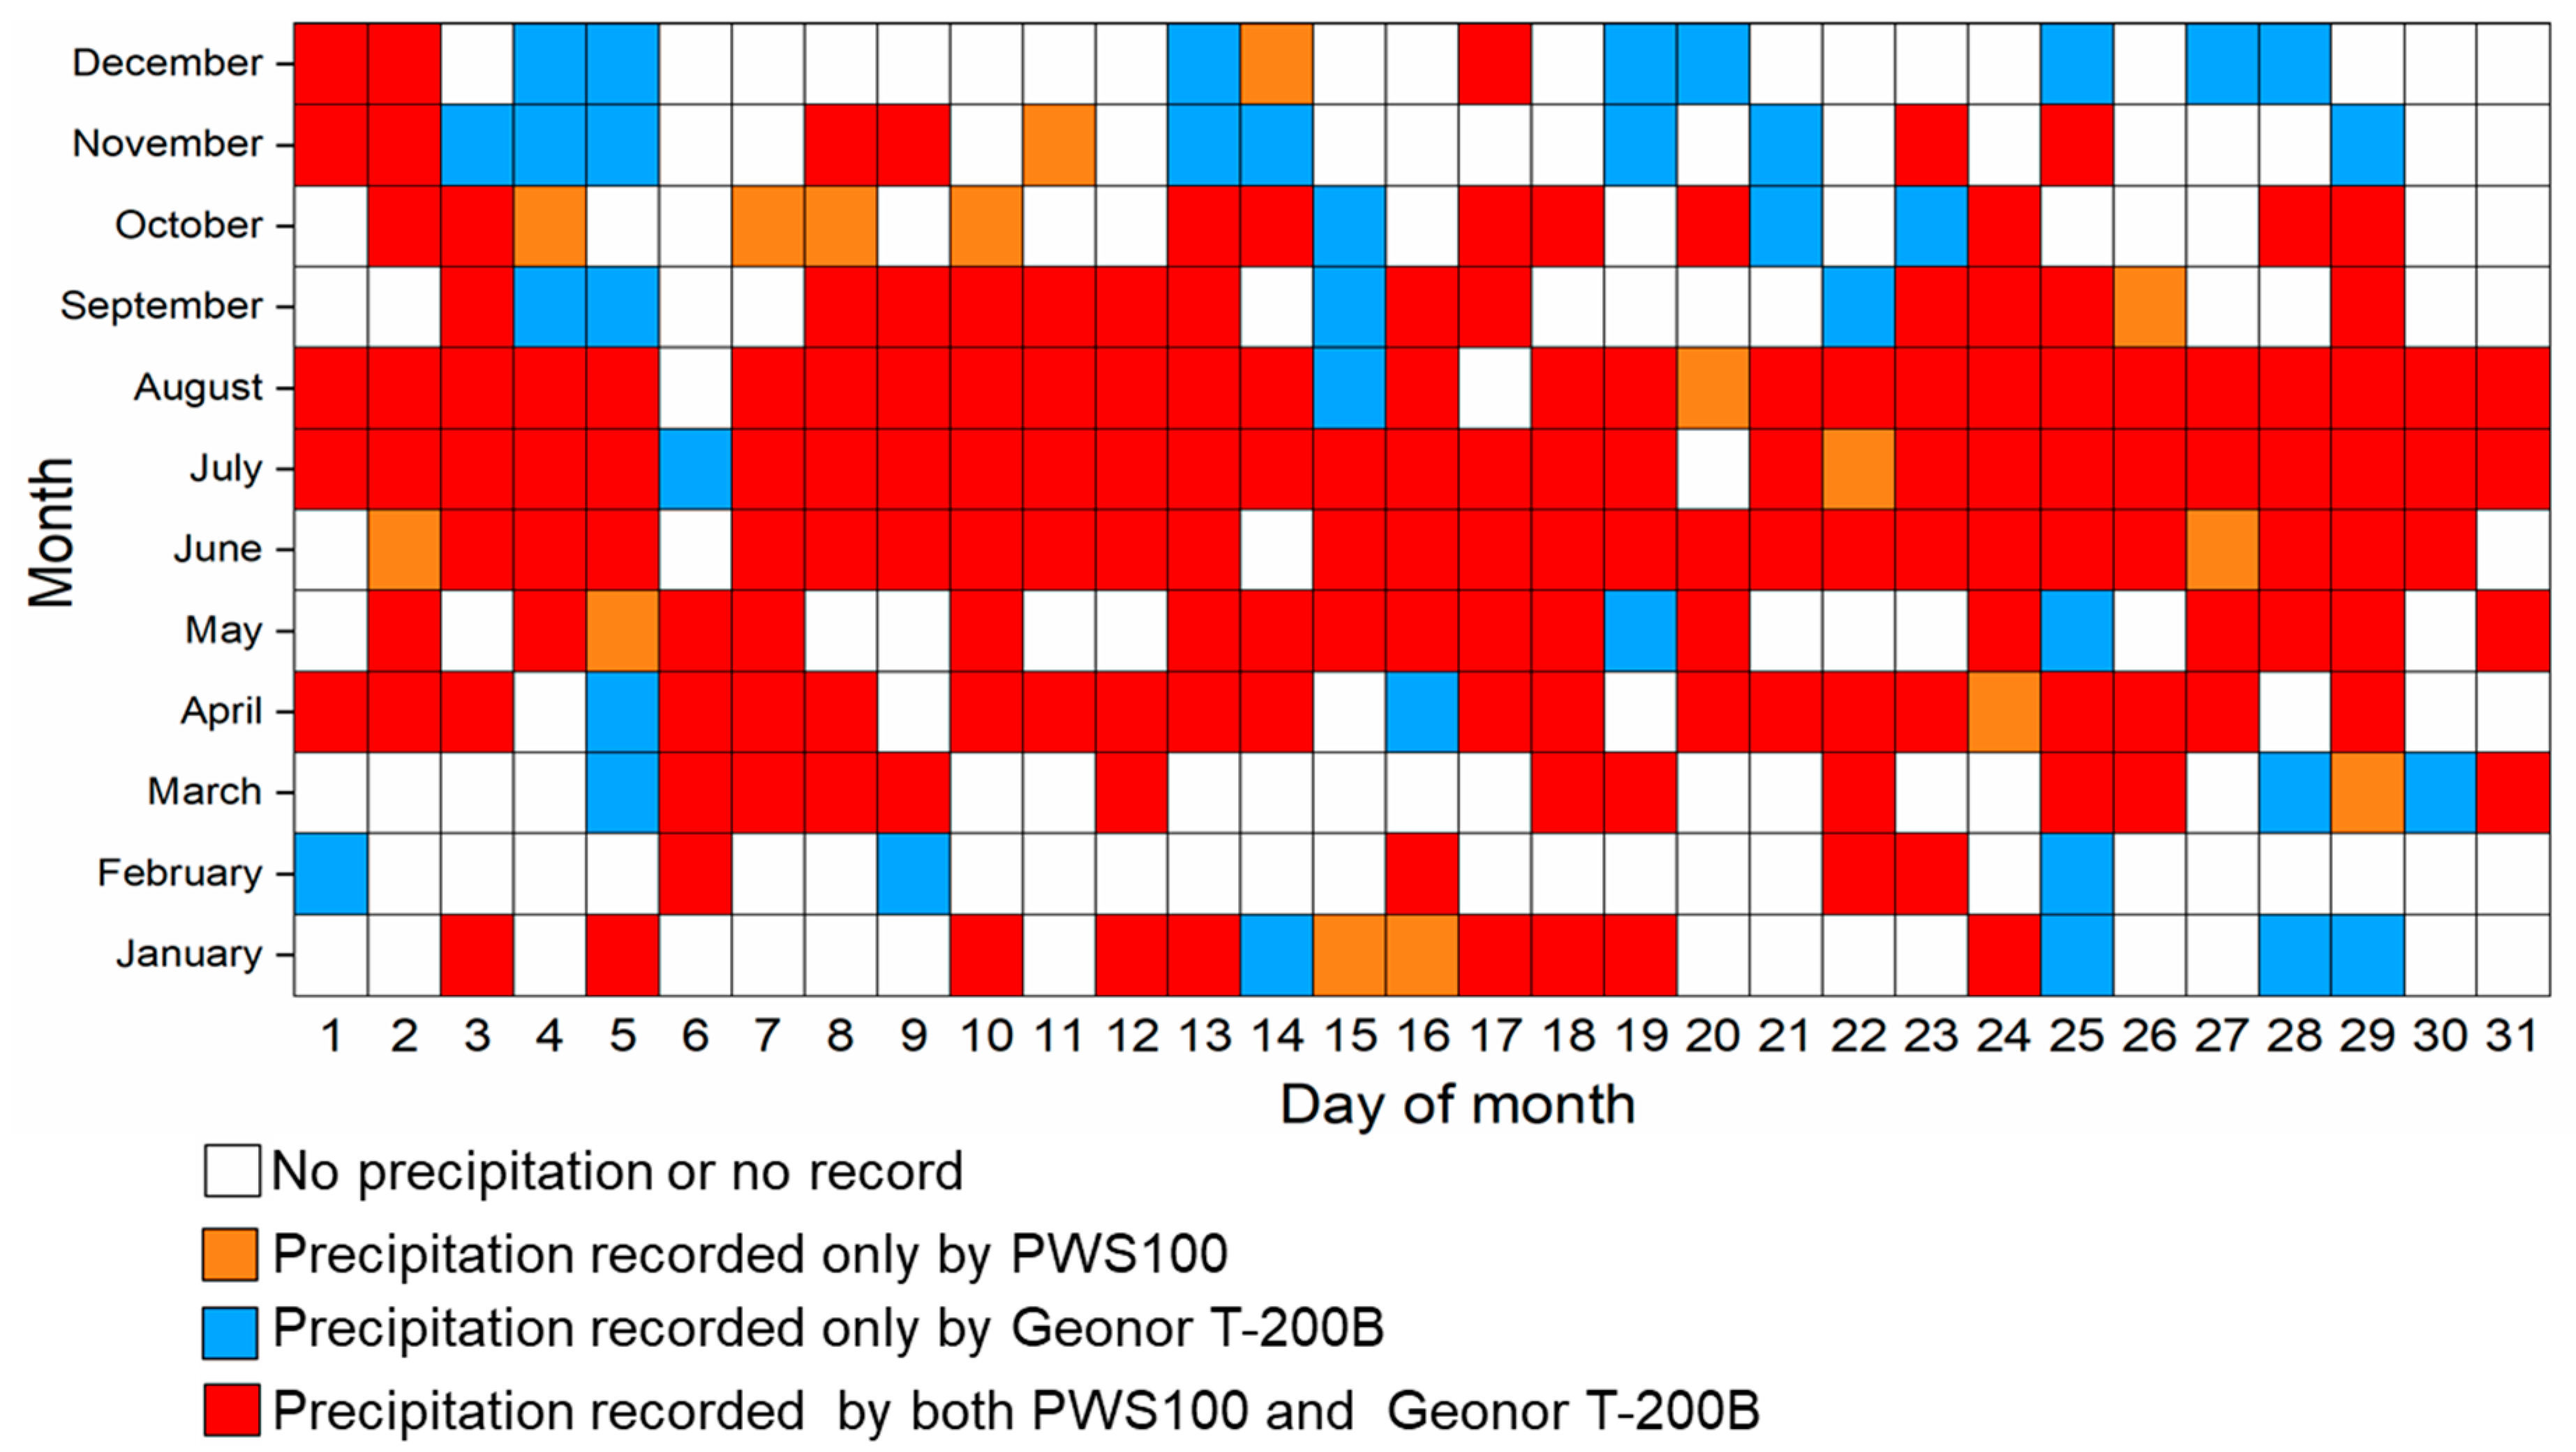
3.1.2. Monthly Precipitation Amount and Days
3.2. Influencing Factors of Precipitation Measurement
3.2.1. Precipitation Type
3.2.2. Winds
3.3. Temperature Threshold of Different Types of Precipitation
3.3.1. Characteristics of Precipitation Types
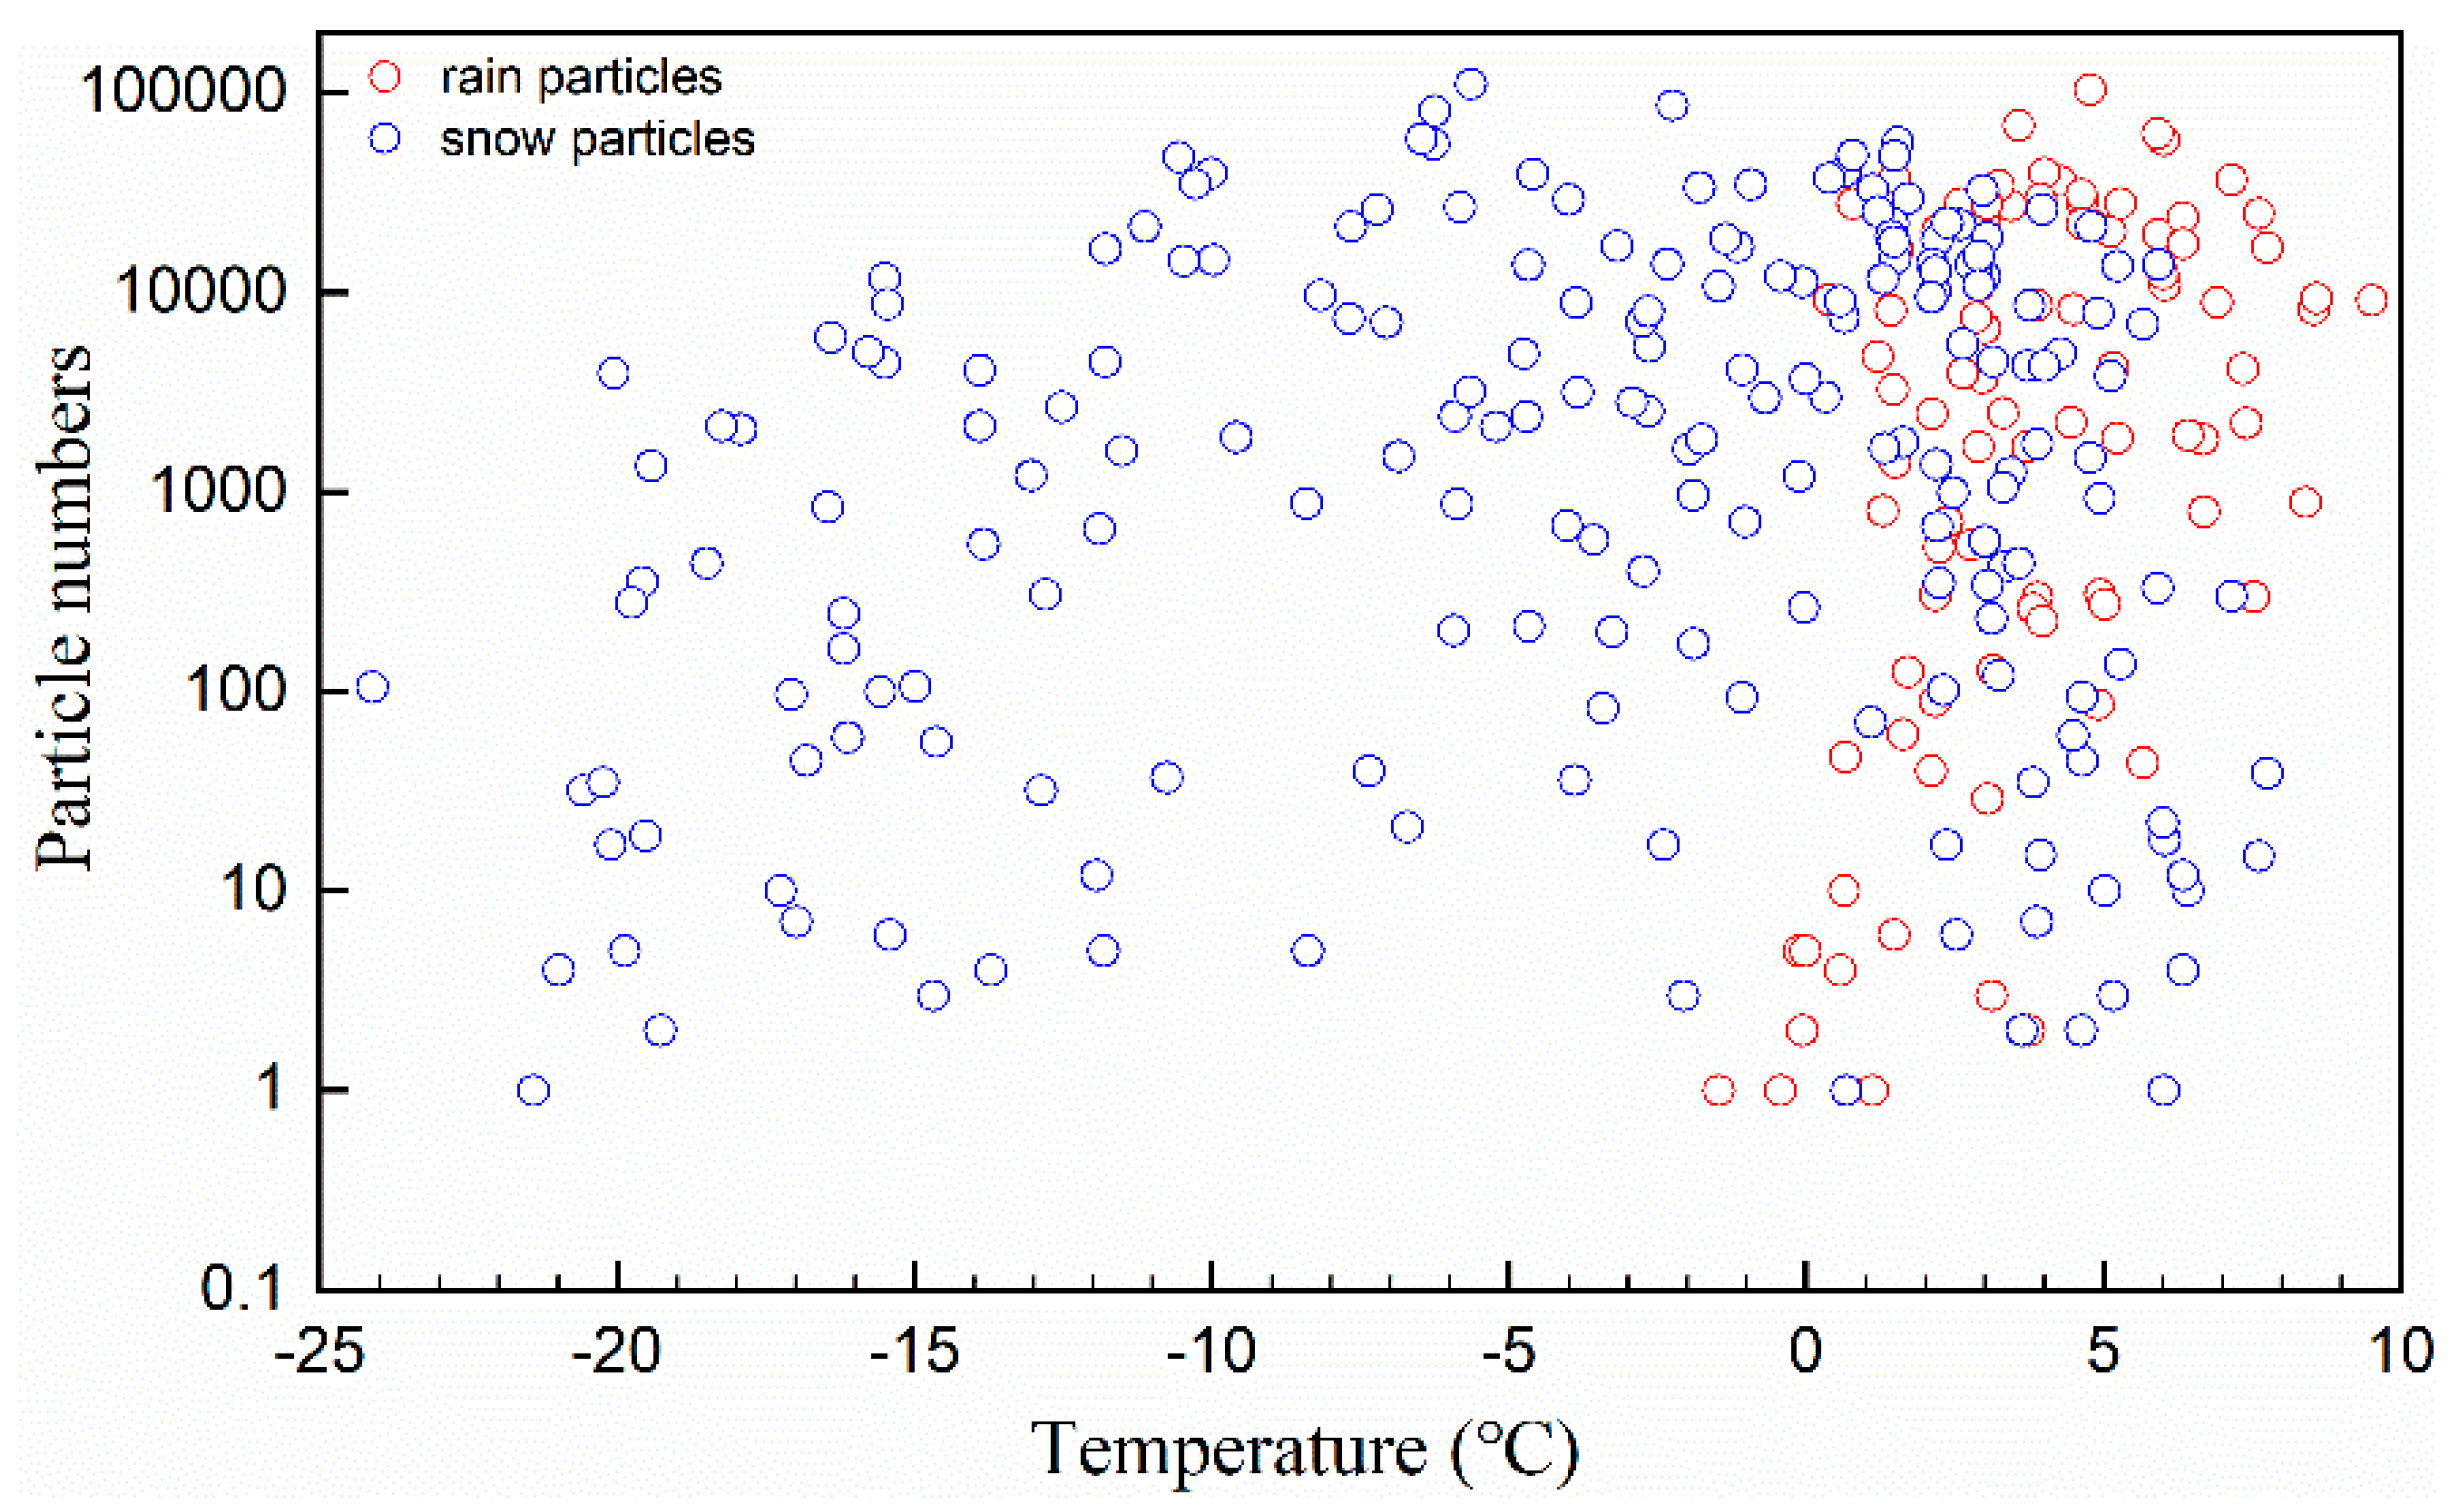
3.3.2. Relationship between Precipitation Types and Temperature
4. Summary and Conclusions
- During the experiment period of 1 May 2018 to 30 April 2019, Geonor T-200B recorded 213 precipitation days with a total amount of 674 mm precipitation. At the same time, the PWS100 recorded 190 precipitation days with a total amount of 627 mm precipitation. In spite of the slightly lower precipitation recorded by the PWS100, there was a strong correlation (R2 = 0.87, p < 0.01) between the daily data observed by the two instruments. This indicates that both instruments are suitable in terms of solid precipitation measurement in a high mountainous environment.
- There was a small seasonal difference between these two observed data sets: compared to the precipitation amount measured by the PWS100, the data from Geonor T-200B were 36 mm lower in June to August, when the precipitation was dominated by rainfall, and 120 mm higher in the remaining months, when the precipitation was dominated by solid particles. As a result, we found that that Geonor T-200B is more efficient than the PWS100 in terms of catching small solid particles in precipitation measurements, and the PWS100 may be more efficient in recording heavy precipitation in liquid forms.
- The data from the PWS100 measurements show that the experiment site was dominated by solid precipitation at the annual scale. The total number of rain-related particles (drizzle, freezing drizzle, rain and freezing rain) and solid particles (snowflakes, snow grains, ice pellets, hail and graupel) account for 40% and 60% of the total particles, respectively. On a monthly scale, June to August had the highest total number of particles, while rain-related particles and solid particles account for 61 and 39% of total particle numbers, respectively. For the other months, solid particles dominated, accounting for 99% of the total number of particles.
- Based on the precipitation particle and in-situ air temperature measurements, a set of temperature thresholds have been established to discriminate rain, sleet and snow. The threshold temperatures of rainfall and snowfall are −1.5 °C and 8 °C, respectively, indicating that rain particles occur when Ta > −1.5 °C and snow particles occur when Ta < 8 °C. The temperature threshold for snowfall is higher than the results from the previous studies possibly because of the high elevation of the experiment location and because the different method based on the measurement of individual precipitation particles. When air temperature is between −1.5 °C and 8 °C, sleet occurs, while the ratio of rain to snow depends on air temperature.
Author Contributions
Funding
Acknowledgments
Conflicts of Interest
References
- Michaelides, S.; Levizzani, V.; Anagnostou, E.; Bauer, P.; Kasparis, T.; Lane, J.E. Precipitation: Measurement, remote sensing, climatology and modeling. Atmos. Res. 2009, 94, 512–533. [Google Scholar] [CrossRef]
- Testik, F.Y.; Barros, A.P. Toward elucidating the microstructure of warm rainfall: A survey. Rev. Geophys. 2007, 45, RG2003. [Google Scholar] [CrossRef]
- Yan, J.; Gebremichael, M. Estimating actual rainfall from satellite rainfall products. Atmos. Res. 2009, 92, 481–488. [Google Scholar] [CrossRef]
- Montero-Martínez, G.; Torres-Pérez, E.F.; García-García, F. A comparison of two optical precipitation sensors with different operating principles: The PWS100 and the OAP-2DP. Atmos. Res. 2016, 178, 550–558. [Google Scholar] [CrossRef]
- Chen, R.; Liu, J.; Kang, E.; Yang, Y.; Han, C.; Liu, Z.; Song, Y.; Qing, W.; Zhu, P. Precipitation measurement intercomparison in the Qilian Mountains, north-eastern Tibetan Plateau. Cryosphere 2015, 9, 1995–2008. [Google Scholar] [CrossRef]
- Daly, C.; Smith, J.W.; Smith, J.I.; McKane, R.B. High-resolution spatial modeling of daily weather elements for a catchment in the Oregon Cascade Mountains, United States. J. Appl. Meteorol. Climatol. 2007, 46, 1565–1586. [Google Scholar] [CrossRef]
- Wang, L.; Chen, R.S.; Song, Y.X.; Yang, Y.; Liu, J.F.; Han, C.T.; Liu, Z.W. Precipitation–altitude relationships on different timescales and at different precipitation magnitudes in the Qilian Mountains. Theor. Appl. Climatol. 2017, 134, 875–884. [Google Scholar] [CrossRef]
- Yang, D.; Shi, Y.; Kang, E.; Zhang, Y.; Yang, X. Results of solid precipitation measurement intercomparison in the Alpine area of Urumqi River basin. Chin. Sci. Bull. 1991, 36, 1105–1109. [Google Scholar]
- Aizen, V.B.; Aizen, E.M.; Melack, J.M. Precipitation, melt and runoff in the northern Tien Shan. J. Hydrol. 1996, 186, 229–251. [Google Scholar] [CrossRef]
- Adam, J.C.; Clark, E.A.; Lettenmaier, D.P. Correction of global precipitation products for orographic effects. J. Clim. 2006, 19, 15–38. [Google Scholar] [CrossRef]
- Chen, R.S.; Song, Y.X.; Kang, E.S.; Han, C.T.; Liu, J.F.; Yang, Y.; Qing, W.W.; Liu, Z.W. A Cryosphere-Hydrology Observation System in a Small Alpine Watershed in the Qilian Mountains of China and Its Meteorological Gradient. Arct. Antarct. Alp. Res. 2014, 46, 505–523. [Google Scholar] [CrossRef]
- Wolff, M.A.; Isaksen, K.; Petersen-Øverleir, A.; Ødemark, K.; Reitan, T.; Brækkan, R. Derivation of a new continuous adjustment function for correcting wind-induced loss of solid precipitation: Results of a Norwegian field study. Hydrol. Earth Syst. Sci. 2015, 19, 951. [Google Scholar] [CrossRef]
- Pierre, A.; Jutras, S.; Smith, C.; Kochendorfer, J.; Fortin, V.; Anctil, F. Evaluation of catch efficiency transfer functions for unshielded and single-Alter-shielded solid precipitation measurements. J. Atmos. Ocean. Technol. 2019, 36, 865–881. [Google Scholar] [CrossRef]
- Yang, D.Q. Research on Analysis and Correction of Systematic Errors in Precipitation Measurement in Urumqi River Basin, Tianshan. Ph.D. Thesis, Lanzhou Institute of Glaciology and Geocryology, Chinese Academy of Sciences, Lanzhou, China, 1988; p. 169. [Google Scholar]
- Yang, D.Q. Double Fence Intercomparison Reference (DFIR) vs. Bush Gauge for ‘true’ snowfall measurement. J. Hydrol. 2014, 509, 94–100. [Google Scholar] [CrossRef]
- Tokay, A.; Kruger, A.; Krajewski, W.F. Comparison of drop size distribution measurements by impact and optical disdrometers. J. Appl. Meteorol. 2001, 40, 2083–2097. [Google Scholar] [CrossRef]
- Lyth, D. Results from UK Met Office investigations into new technology present weather sensors. In Proceedings of the WMO Technical Conference on Instruments and Methods of Observation, IOM 96 (TD 1462), WMO, St. Petersburg, Russia, 7–9 July 2008; p. 13. [Google Scholar]
- Lanza, L.G.; Vuerich, E. The WMO field intercomparison of rain intensity gauges. Atmos. Res. 2009, 94, 534–543. [Google Scholar] [CrossRef]
- Johannsen, L.L.; Zambon, N.; Strauss, P. Comparison of three types of laser optical disdrometers under natural rainfall conditions. Hydrolg. Sci. J. 2020, 65, 524–535. [Google Scholar] [CrossRef] [PubMed]
- Kochendorfer, J.; Earle, M.E.; Hodyss, D.; Reverdin, A.; Roulet, Y.-A.; Nitu, R.; Rasmussen, R.; Landolt, S.; Buisan, S.; Laine, T. Undercatch Adjustments for Tipping-Bucket Gauge Measurements of Solid Precipitation. J. Hydrometeorol. 2020, 21, 1193–1205. [Google Scholar] [CrossRef]
- Weiss, L.L. Relative catches of snow in shielded and unshielded gages at different wind speeds. Mon. Weather Rev. 1961, 89, 397–400. [Google Scholar] [CrossRef]
- Larson, L.W.; Peck, E.L. Accuracy of precipitation measurements for hydrologic modeling. Water Resour. Res. 1974, 10, 857–863. [Google Scholar] [CrossRef]
- Hanson, C.L. Precipitation Catch Measured by the Wyoming Shield and the Dual-Gage System. J. Am. Water Resour. Assoc. 2007, 25, 159–164. [Google Scholar] [CrossRef]
- Goodison, B.E.; Louie, P.Y.T.; Yang, D. WMO Solid Precipitation Measurement Intercomparison; Final Report, WMO/TD 872; World Meteorological Organization: Geneva, Switzerland, 1998. [Google Scholar]
- Yang, D.Q.; Kane, D.L.; Hinzman, L.D.; Goodison, B.E.; Metcalfe, J.R.; Louie, P.Y.T.; Leavesley, G.H.; Emerson, D.G.; Hanson, C.L. An evaluation of the Wyoming gauge system for snowfall measurement. Water Resour. Res. 2000, 36, 2665–2677. [Google Scholar] [CrossRef][Green Version]
- Sugiura, K.; Ohata, T.; Yang, D. Catch characteristics of precipitation gauges in high-latitude regions with high winds. J. Hydrometeorol. 2006, 7, 984–994. [Google Scholar] [CrossRef]
- Smith, C. The relationship between snowfall catch efficiency and wind speed for the Geonor T-200B precipitation gauge utilizing various wind shield configurations. In Proceedings of the 77th Western Snow Conference, Canmore, AB, Canada, 20 April 2009; pp. 115–121. [Google Scholar]
- Agnew, J. Final Report on the Operation of a Campbell Scientific PWS100 Present Weather Sensor at Chilbolton Observatory; Science & Technology Facility Council: Swindon, UK, 2013; p. 12. [Google Scholar]
- Li, Z.Q.; Li, C.J.; Li, Y.F.; Wang, F.T.; Li, H.L. Preliminary results from measurements of selected trace metals in the snow–firn pack on Urumqi glacier No. 1, eastern Tien Shan, China. J. Glaciol. 2007, 53, 368–373. [Google Scholar]
- Sun, M.P.; Li, Z.Q.; Yao, X.J.; Zhang, M.J.; Jin, S. Modeling the hydrological response to climate change in a glacierized high mountain region, northwest China. J. Glaciol. 2015, 61, 127–136. [Google Scholar] [CrossRef]
- Li, Z.Q.; Wang, W.B.; Zhang, M.J.; Wang, F.T.; Li, H.L. Observed changes in streamflow at the headwaters of the Urumqi river, eastern Tianshan, Central Asia. Hydrol. Process. 2010, 24, 217–224. [Google Scholar] [CrossRef]
- Gires, A.; Tchiguirinskaia, I.; Schertzer, D. Multifractal comparison of the outputs of two optical disdrometers. Hydrol. Sci. J. 2016, 61, 1641–1651. [Google Scholar] [CrossRef]
- Wauben, W.; Mathijssen, T.; Oudshoorn, C. Field evaluation of sensors for precipitation type discrimination. In Proceedings of the WMO Technical Conference on Meteorological and Environmental Instruments and Methods of Observation (CIMO TECO 2016), Madrid, Spain, 27–30 September 2016; pp. 27–30. [Google Scholar]
- Ellis, R.A.; Sandford, A.P.; Jones, G.E. New laser technology to determine present weather parameters. Meas. Sci. Technol. 2006, 17, 1715–1722. [Google Scholar] [CrossRef]
- Fortin, V.; Therrien, C.; Anctil, F. Correcting wind-induced bias in solid precipitation measurements in case of limited and uncertain data. Hydrol. Process. 2008, 22, 3393–3402. [Google Scholar] [CrossRef]
- Smith, C.D.; Kamp, G.; Arnold, L.; Schmidt, R. Measuring precipitation with a geolysimeter. Hydrol. Earth Syst. Sci. 2017, 21, 5263–5272. [Google Scholar] [CrossRef]
- He, X.B.; Ye, B.S.; Ding, Y.J. Bias correction for precipitation mesuament in Tanggula Mountain Tibetan Plateau. Adv. Water Sci. 2009, 20, 403–408. (In Chinese) [Google Scholar]
- Zhang, L.L.; Zhao, L.; Xie, C.W.; Liu, G.Y.; Gao, L.M.; Xiao, Y.; Shi, J.Z.; Qiao, Y.P. Intercomparison of Solid Precipitation Derived from the Weighting Rain Gauge and Optical Instruments in the Interior Qinghai-Tibetan Plateau. Adv. Meteorol. 2015, 2015, 936724. [Google Scholar] [CrossRef]
- Wong, K.; Earle, M.; Hoover, J. The Relationship Between Manual and Geonor Automatic Gauge Measurements of Solid Precipitation in DFIR Shields During SPICE. In Proceedings of the 17th Symposium on Meteorological Observation and Instrumentation, Atlanta, GA, USA, 9–13 June 2014. [Google Scholar]
- Campbell Scientific, Inc. PWS100 Present Weather Sensor; Instruction Manual. Revision 9/15; Campbell Scientific, Inc.: Logan, UT, USA, 2015. [Google Scholar]
- Tokay, A.; Wolff, D.B.; Petersen, W.A. Evaluation of the new version of the laseroptical disdrometer, OTT Parsivel2. J. Atmos. Ocean. Technol. 2014, 31, 1276–1288. [Google Scholar] [CrossRef]
- Smith, C.D. Correcting the wind bias in snowfall measurements made with a Geonor T-200B precipitation gauge and Alter wind shield. In Proceedings of the 14th SMOI, San Antonio, TX, USA, 9–12 December 2007. [Google Scholar]
- Ding, B.; Yang, K.; Qin, J. The dependence of precipitation types on surface elevation and meteorological conditions and its parameterization. J. Hydrol. 2014, 513, 154–163. [Google Scholar] [CrossRef]
- Loth, B.; Graf, H.F.; Oberhuber, J.M. Snow cover model for global climate simulations. J. Geophys. Res. Atmos. 1993, 98, 10451–10464. [Google Scholar] [CrossRef]
- Kang, E.S. Energy, water and mass balance, and discharge modeling in the Tianshan glaciated basin. Sci. China. Ser. B 1994, 24, 983–991. (In Chinese) [Google Scholar]
- Wigmosta, M.S.; Vail, L.W.; Lettenmaier, D.P. A distributed hydrologyvegetation model for complex terrain. Water Resour. Res. 1994, 30, 1665–1679. [Google Scholar] [CrossRef]
- Yang, Z.L.; Dickinson, R.E.; Robock, A.; Vinnikov, K.Y. Validation of the snow submodel of the biosphere-atmosphere transfer scheme with Russian snow cover and meteorological observational data. J. Clim. 1997, 10, 353–373. [Google Scholar] [CrossRef]
- Kang, E.S.; Cheng, G.D.; Lan, Y.C.; Jin, H.J. A model for simulating the response of runoff from the mountainous watersheds of inland river basins in the arid area of northwest China to climatic changes. Sci. China Ser. D Earth Sci. 1999, 42, 52–63. [Google Scholar] [CrossRef]
- Clark, M.P.; Slater, A.G.; Barrett, A.P.; Hay, L.E.; McCabe, G.J.; Rajagopalan, B.; Leavesley, G.H. Assimilation of snow covered area information into hydrologic and land-surface models. Adv. Water Resour. 2006, 29, 1209–1221. [Google Scholar] [CrossRef]


| Date | T-200B | PWS100 | Ta | WS | ||
|---|---|---|---|---|---|---|
| Precipitation (mm) | Precipitation Day | Precipitation (mm) | Precipitation Day | °C | m/s | |
| May-2018 | 55 | 19 | 37 | 18 | −1.2 | 2.04 |
| June-2018 | 135 | 25 | 148 | 27 | 2.8 | 1.65 |
| July-2018 | 154 | 29 | 171 | 29 | 4.0 | 1.61 |
| Auguest-2018 | 116 | 28 | 122 | 28 | 5.2 | 1.9 |
| September-2018 | 28 | 17 | 23 | 14 | 0.4 | 2.12 |
| October-2018 | 26 | 13 | 13 | 14 | −5.5 | 1.98 |
| November-2018 | 15 | 14 | 6 | 7 | −12.2 | 2.39 |
| December-2018 | 7 | 11 | 0.3 | 4 | −16.5 | 2.5 |
| January-2019 | 6 | 13 | 0.3 | 11 | −16.4 | 1.98 |
| February-2019 | 7 | 7 | 0.4 | 4 | −15.3 | 2.41 |
| March-2019 | 22 | 14 | 9 | 12 | −9.7 | 2.02 |
| April-2019 | 103 | 23 | 98 | 22 | −3.4 | 1.94 |
| Annual | 674 | 213 | 627 | 190 | −5.7 | 2.05 |
| Date | Drizzle | Freezing Drizzle | Rain | Freezing Rain | Snow Grains | Snowflakes | Ice Pellets | Hail | Graupel | Ta (°C) | RH (%) |
|---|---|---|---|---|---|---|---|---|---|---|---|
| May-2018 | 438 | 1660 | 355 | 248 | 88,525 | 85,355 | 292 | 49 | 97 | −1.2 | 55 |
| June-2018 | 51,487 | 2277 | 362,149 | 135 | 105,012 | 201,351 | 19,842 | 578 | 85 | 2.8 | 74 |
| July-2018 | 56,407 | 1147 | 371,717 | 66 | 83,952 | 160,857 | 19,392 | 853 | 63 | 4 | 74 |
| August-2018 | 59,594 | 3022 | 393,426 | 78 | 82,073 | 127,689 | 14,775 | 468 | 193 | 5.2 | 69 |
| September-2018 | 1182 | 689 | 440 | 28 | 57,999 | 63,193 | 1231 | 88 | 69 | 0.3 | 54 |
| October-2018 | 0 | 438 | 0 | 10 | 48,451 | 42,951 | 8 | 10 | 40 | −5.5 | 50 |
| November-2018 | 0 | 0 | 0 | 0 | 43,040 | 18,727 | 0 | 0 | 59 | −12.2 | 47 |
| December-2018 | 0 | 0 | 0 | 0 | 3293 | 1005 | 12 | 0 | 12 | −16.5 | 42 |
| January-2019 | 0 | 0 | 0 | 0 | 8977 | 1527 | 0 | 0 | 12 | −16.4 | 40 |
| February-2019 | 0 | 0 | 0 | 0 | 15,310 | 2143 | 0 | 0 | 25 | −15.3 | 40 |
| March-2019 | 0 | 2 | 0 | 0 | 64,082 | 32,680 | 3 | 1 | 65 | −9.7 | 42 |
| April-2019 | 294 | 4886 | 17 | 313 | 265,109 | 267,500 | 479 | 194 | 305 | −3.4 | 66 |
| Annual | 169,402 | 14,121 | 1,128,104 | 878 | 865,823 | 1,004,978 | 56,034 | 2241 | 1025 | −5.7 | 54 |
© 2020 by the authors. Licensee MDPI, Basel, Switzerland. This article is an open access article distributed under the terms and conditions of the Creative Commons Attribution (CC BY) license (http://creativecommons.org/licenses/by/4.0/).
Share and Cite
Jia, Y.; Li, Z.; Xu, C.; Jin, S.; Deng, H. A Comparison of Precipitation Measurements with a PWS100 Laser Sensor and a Geonor T-200B Precipitation Gauge at a Nival Glacial Zone in Eastern Tianshan, Central Asia. Atmosphere 2020, 11, 1079. https://doi.org/10.3390/atmos11101079
Jia Y, Li Z, Xu C, Jin S, Deng H. A Comparison of Precipitation Measurements with a PWS100 Laser Sensor and a Geonor T-200B Precipitation Gauge at a Nival Glacial Zone in Eastern Tianshan, Central Asia. Atmosphere. 2020; 11(10):1079. https://doi.org/10.3390/atmos11101079
Chicago/Turabian StyleJia, Yufeng, Zhongqin Li, Chunhai Xu, Shuang Jin, and Haijun Deng. 2020. "A Comparison of Precipitation Measurements with a PWS100 Laser Sensor and a Geonor T-200B Precipitation Gauge at a Nival Glacial Zone in Eastern Tianshan, Central Asia" Atmosphere 11, no. 10: 1079. https://doi.org/10.3390/atmos11101079
APA StyleJia, Y., Li, Z., Xu, C., Jin, S., & Deng, H. (2020). A Comparison of Precipitation Measurements with a PWS100 Laser Sensor and a Geonor T-200B Precipitation Gauge at a Nival Glacial Zone in Eastern Tianshan, Central Asia. Atmosphere, 11(10), 1079. https://doi.org/10.3390/atmos11101079


