Article

Impacts of the Tropical Pacific–Indian Ocean Associated Mode on Madden–Julian Oscillation over the Maritime Continent in Boreal Winter

1
College of Meteorology and Oceanography, National University of Defense Technology, Nanjing 211101, China
2
State Key Laboratory of Numerical Modeling for Atmospheric Sciences and Geophysical Fluid Dynamics (LASG), Institute of Atmospheric Physic, Chinese Academy of Sciences, Beijing 100029, China
3
Troop 32021 of People’s Liberation Army (PLA), Beijing 100094, China
*
Author to whom correspondence should be addressed.
Atmosphere 2020, 11(10), 1049; https://doi.org/10.3390/atmos11101049
Submission received: 26 August 2020 / Revised: 22 September 2020 / Accepted: 25 September 2020 / Published: 30 September 2020
(This article belongs to the Section Climatology)

Abstract

:
Based on the observation and reanalysis data, the relationship between the Madden–Julian Oscillation (MJO) over the Maritime Continent (MC) and the tropical Pacific–Indian Ocean associated mode was analyzed. The results showed that the MJO over the MC region (95°–150° E, 10° S–10° N) (referred to as the MC–MJO) possesses prominent interannual and interdecadal variations and seasonally “phase-locked” features. MC–MJO is strongest in the boreal winter and weakest in the boreal summer. Winter MC–MJO kinetic energy variation has significant relationships with the El Niño–Southern Oscillation (ENSO) in winter and the Indian Ocean Dipole (IOD) in autumn, but it correlates better with the tropical Pacific–Indian Ocean associated mode (PIOAM). The correlation coefficient between the winter MC–MJO kinetic energy index and the autumn PIOAM index is as high as −0.5. This means that when the positive (negative) autumn PIOAM anomaly strengthens, the MJO kinetic energy over the winter MC region weakens (strengthens). However, the correlation between the MC–MJO convection and PIOAM in winter is significantly weaker. The propagation of MJO over the Maritime Continent differs significantly in the contrast phases of PIOAM. During the positive phase of the PIOAM, the eastward propagation of the winter MJO kinetic energy always fails to move across the MC region and cannot enter the western Pacific. However, during the negative phase of the PIOAM, the anomalies of MJO kinetic energy over the MC is not significantly weakened, and MJO can propagate farther eastward and enter the western Pacific. It should be noted that MJO convection is more likely to extend to the western Pacific in the positive phases of PIOAM than in the negative phases. This is significant different with the propagation of the MJO kinetic energy.

1. Introduction

The tropical Pacific and Indian Ocean exhibit the most significant interannual variations of the sea surface temperature (SST) on a global scale and play a critical role in modulating the interannual variations of the global climate, especially in Asia. The El Niño–Southern Oscillation (ENSO) is the dominant component of the interannual variability in the tropical Pacific, while the Indian Ocean Dipole (IOD) is the most famous interannual variability in the tropical Indian Ocean. In the early stage, they were studied independently, however, more and more research has shown that there are strong interactions between the tropical Pacific and Indian Ocean [1,2,3,4], so that the ENSO and IOD should be considered as a whole. Based on this idea, researchers have analyzed the Pacific–Indian Ocean SST anomaly by using the empirical orthogonal function (EOF) decomposition. The first mode shows that when the equatorial central–eastern Pacific and tropical central–western Indian Ocean are abnormally warmer (colder), the equatorial western Pacific and eastern Indian Ocean are correspondingly colder (warmer), and this mode is recognized as the Pacific–Indian Ocean associated mode (PIOAM) [5,6].
The discovery of the PIOAM has received wide attention, and its characteristics, evolution, and mechanism are preliminarily discussed in the following researches [7,8,9]. It has further been pointed out that the PIOAM in the subsurface is more prominent than that at the surface and it can better reflect the opposite zonal variation of the tropical sea surface temperature anomaly (SSTA) [8,9]. Moreover, both surface and subsurface PIOAM can be well reproduced in the ocean circulation model [10] and coupled an ocean–atmosphere general circulation model [11]. The PIOAM also plays a crucial role in climate anomaly. Yang and Li et al. [6] studied the influences of the PIOAM on the South Asian High (SAH) and regional climate change [12,13]. These influences are quite different from that of the conditions when ENSO and the IOD are discussed separately [13]. However, the investigations above mainly focused on the climatic impacts of the PIOAM in the extra equatorial region on the interannual scale, and the influences of the PIOAM in the equatorial region on the intraseasonal scale remain to be investigated.
The intraseasonal oscillation (ISO) dominates the intraseasonal variability in the tropical atmosphere. The ISO near the equator is also called Madden–Julian Oscillation (MJO) [14,15]. It is a planetary-scale circulation anomaly coupled with convection, and it exhibits significant interannual and interdecadal variations [16]. Many studies have indicated that the MJO has direct relationships with the monthly and seasonal climate variables such as [17,18,19,20,21,22] and has significant impacts on the weather and climate around the world [23,24] such as the precipitation anomalies in many regions [25,26]; the activity of tropical cyclones [27,28]; the onset, break and retreat of the Asian summer monsoon [29]; and the evolution of El Niño events [30,31,32]. Thus, it is the bridge connecting weather and climate variations [23]. MJO convection always initiates in the western equatorial Indian Ocean, then propagates eastward into the Pacific along the equator, and finally weakens and dies out near the dateline [33]. MJO activity mainly occurs over the Indo-Pacific warm pool regions. Therefore, SSTA over the Indian and Pacific oceans (e.g., the ENSO and the IOD) play an important role in the variability of MJO.
Previous studies have shown that the warm and cold phases of ENSO (corresponding to El Nino and La Nina, respectively) affect the MJO activity (including the intensity, propagation speed and distance of MJO, etc.) significantly [16,32,34,35,36,37], and the impacts of different types of El Niño are also different [38,39,40,41]. According to recent observations and simulations, the IOD has significant impacts on the intensity and propagation of the MJO [42,43,44,45], and its influence is even more important than that of ENSO. Considering that the PIOAM is the reflection of the Pacific–Indian Ocean temperature characteristics as a whole, which includes both ENSO signal and the IOD signal. Its influence on the MJO activity over the MC region is probably more significant than either of these two separate components. Based on the above considerations, this paper will discuss the relationships between the PIOAM and MJO activity over the MC region (MC–MJO) including the impacts of the PIOAM on the intensity, propagation, and structure of the MC–MJO. The rest of this paper is organized as follows. In Section 2, the data and methods of analysis adopted in this study are described. The differences of the MC–MJO intensity, propagation, and structure between positive and negative PIOAM phases are presented in Section 3, respectively. Possible causes are also given in Section 3. The discussion and conclusions make up the final section.

2. Data and Methods

The reanalysis data used in this paper included the daily atmospheric circulation from the National Center for Environmental Prediction/National Center for Atmospheric Research (NCEP/NCAR) with a horizontal resolution of 2.5° × 2.5° and from the European Center for Medium-Range Weather Forecasts Interim Re-Analysis (ERA-Interim; [46]) with a horizontal resolution of 1.5° × 1.5°. These two types of data were adopted to better verify our conclusions. Daily outgoing longwave radiation (OLR) with a horizontal resolution of 2.5° × 2.5° from the National Oceanic and Atmospheric Administration (NOAA; [47]) were also utilized. The monthly sea surface temperature (SST) data were from the UK’s Hadley Center for Climate Prediction and Research, with a resolution of 1.0° × 1.0° [48]. SST and wind covered the period January 1951 to December 2011, and the OLR data were selected from June 1979 to December 2011.
Climatological mean and long-time linear trend of reanalysis data were removed, and the MJO signal was obtained using a 30–90 day Lanczos band-pass filter [49]. MJO amplitude refers to the standard deviation of the MJO zonal wind at 850 hPa (MJO OLR) with a 3-month sliding window [31]. The surface PIOAM associated mode index (SAMI) described by Yang and Li [6] was calculated using the HadISST data. Anomalous PIOAM years were defined as the autumn SAMI exceeding ±1.0 standard deviations. Based on this criterion, seven positive phase years (1982, 1986, 1987, 1994, 1997, 2002, 2006) and seven negative years (1988, 1996, 1998, 2001, 2005, 2007, 2010) were identified from 1979 to 2011. The MC was described as the area within 10° S–10° N, 95°–150° E (Figure 1). The MJO kinetic energy intensity index over the MC region is defined as the standard deviation of the regional averaged MJO zonal wind with the climatological mean removed. Index values greater than 1.0 standard deviation were selected as strong MJO kinetic energy intensity cases, and index values less than −1.0 standard deviation were chosen as weak MJO kinetic energy intensity cases.

3. Results

3.1. Differences of Madden–Julian Oscillation (MJO) Intensity over the Maritime Continent (MC) between Positive and Negative Phases of Pacific–Indian Ocean Associated Mode (PIOAM)

MJO intensity is one of the important characteristics of the MJO activity, and is usually described by the MJO kinetic energy and OLR amplitude [39].
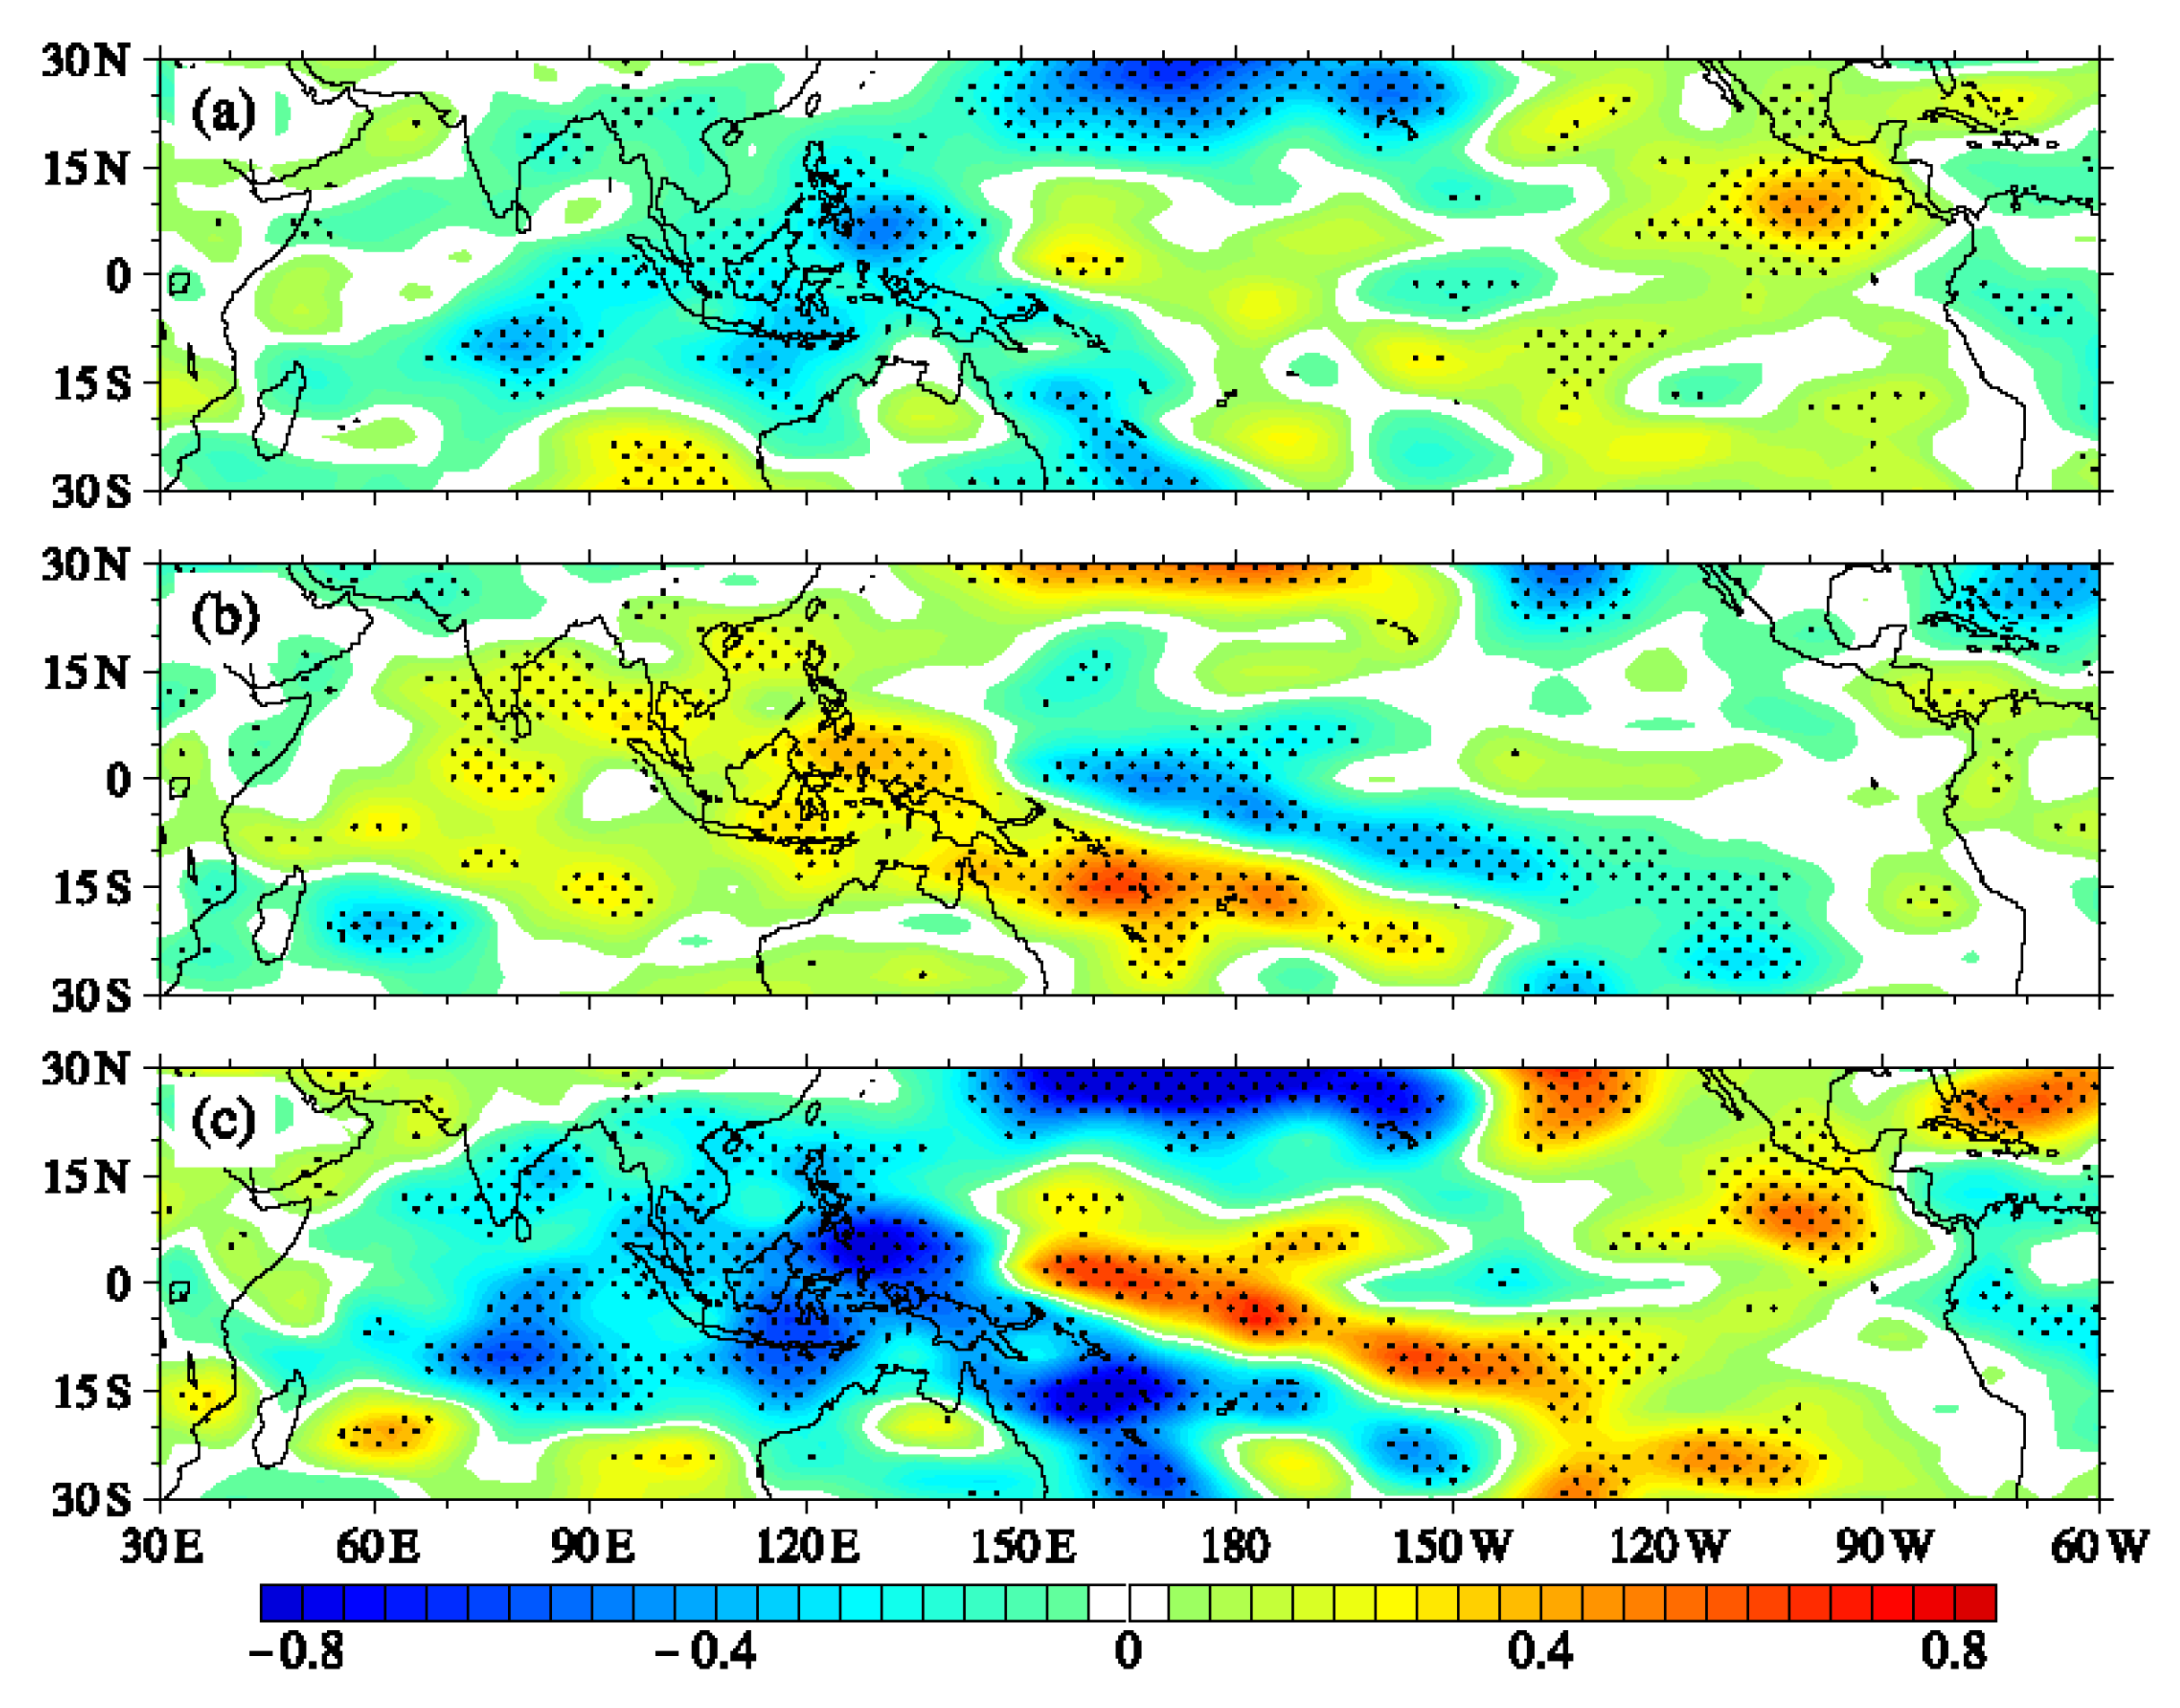
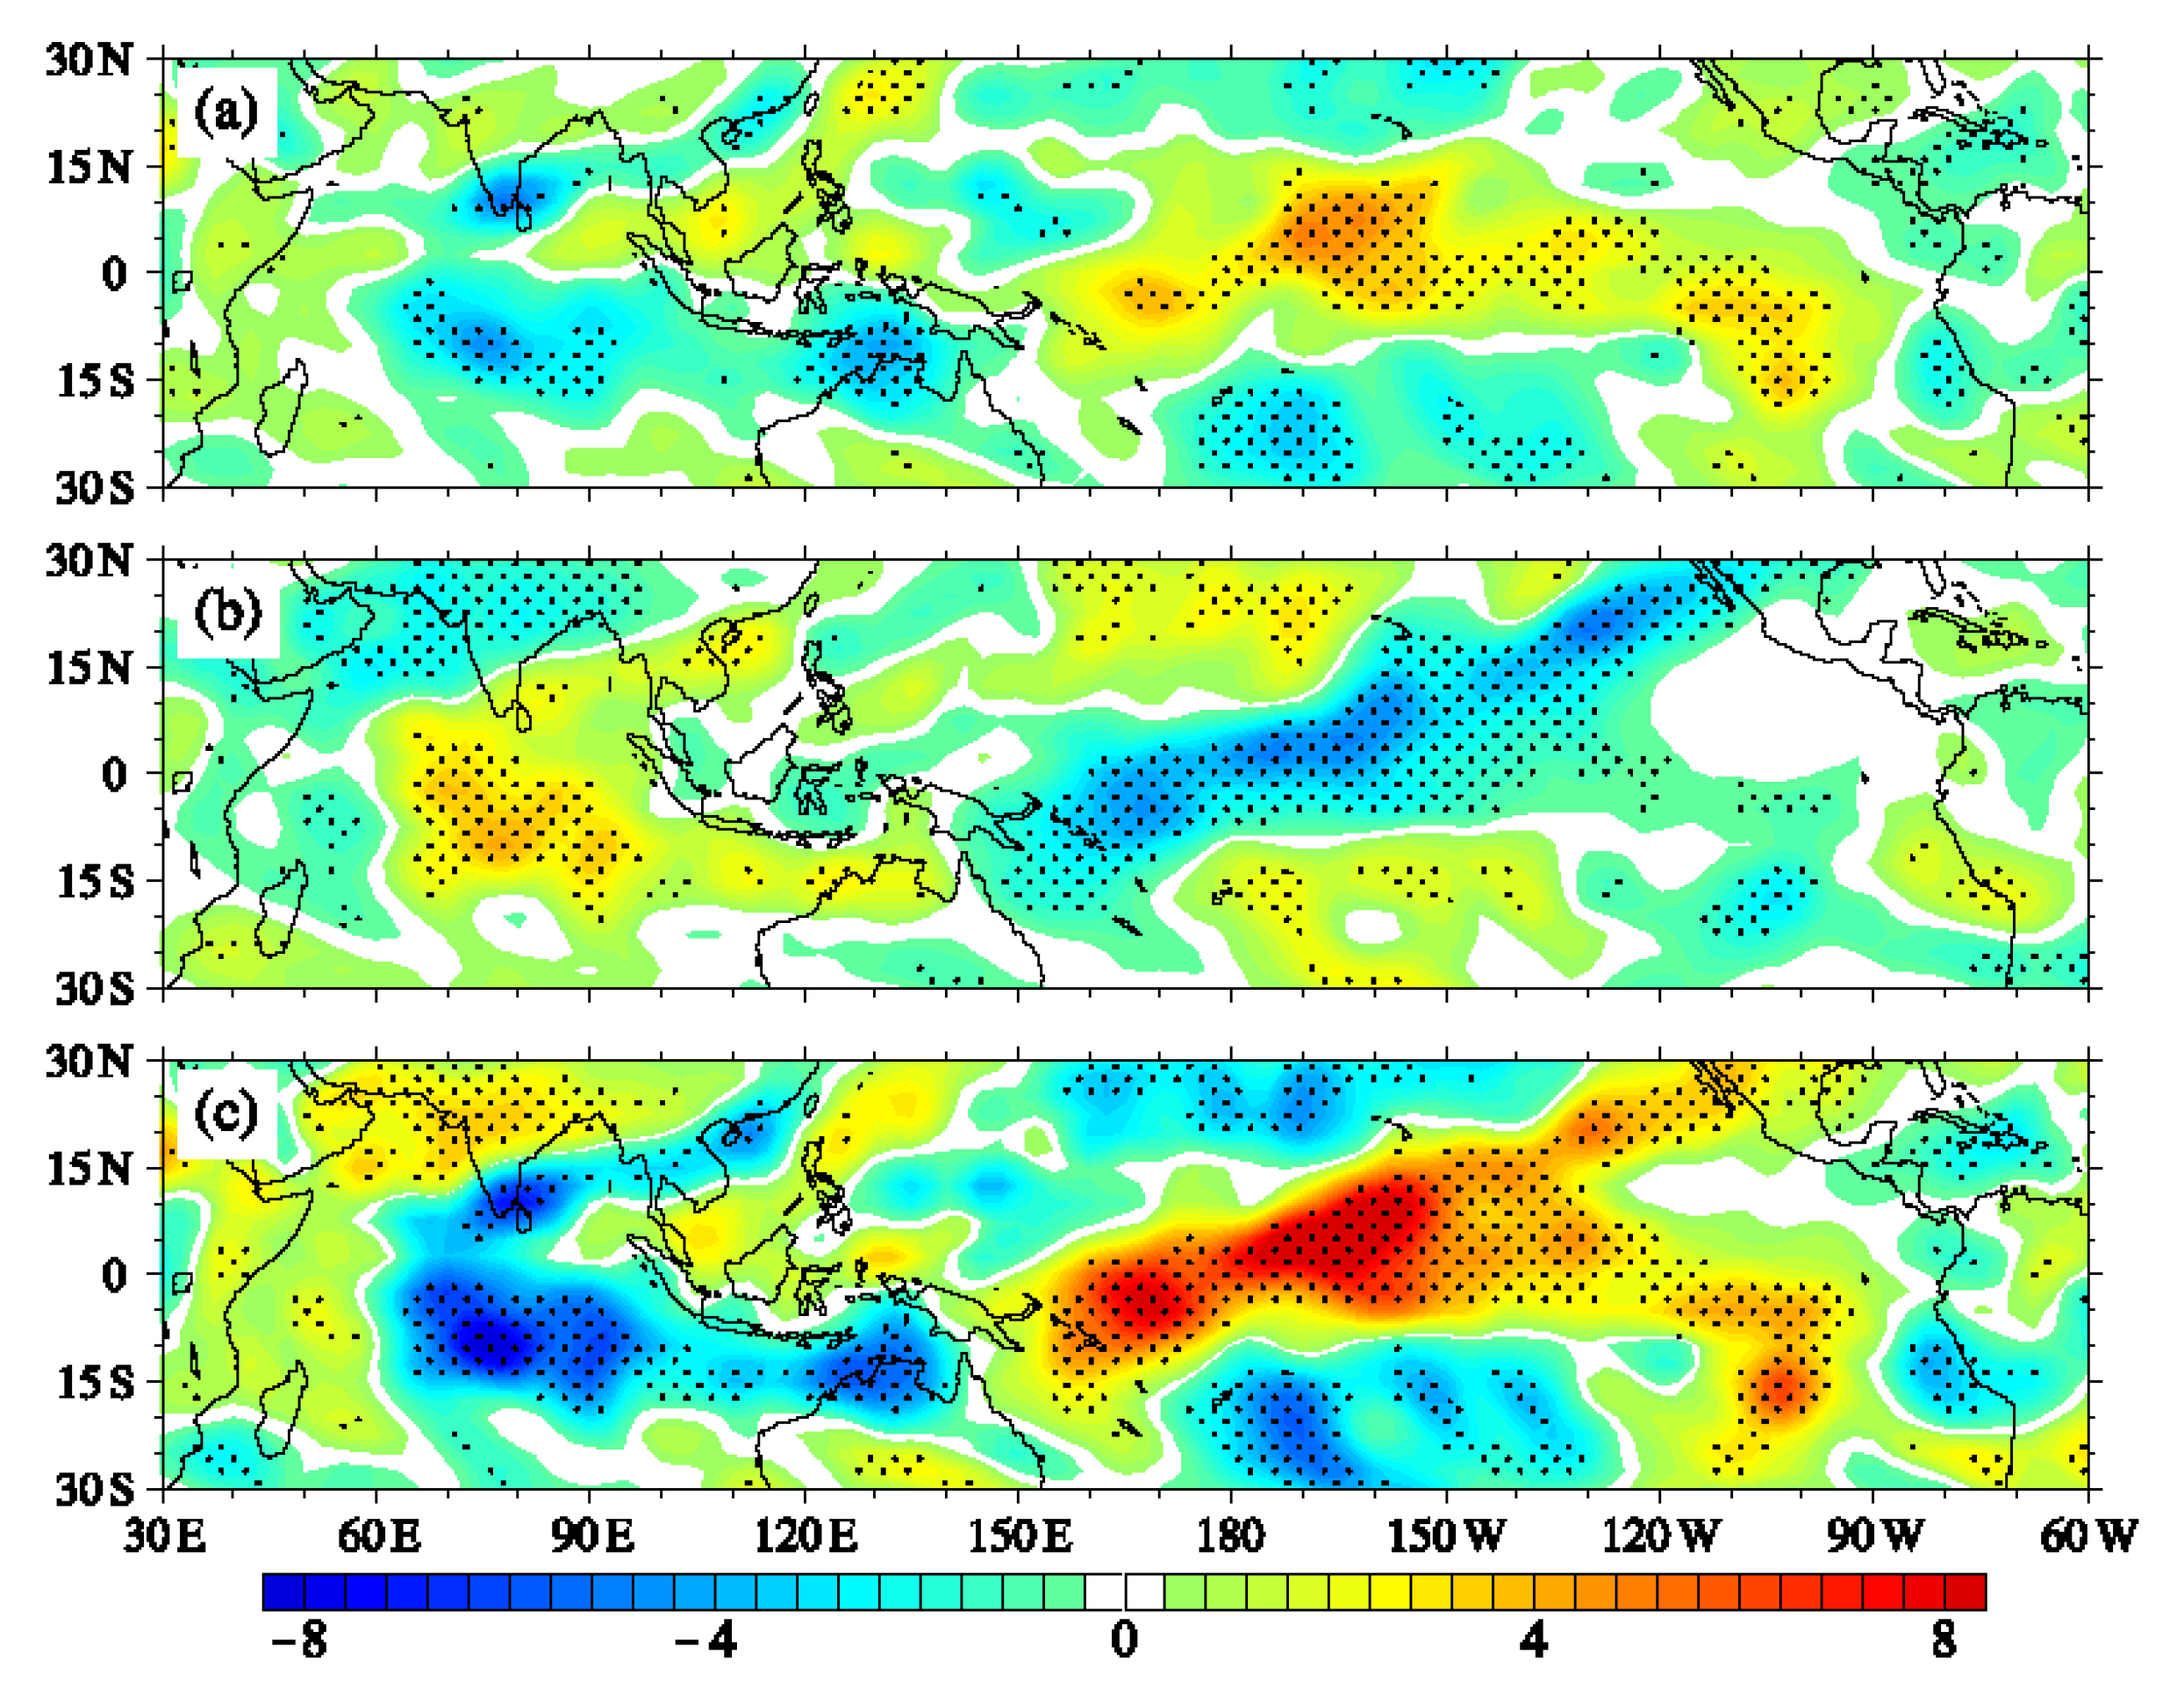
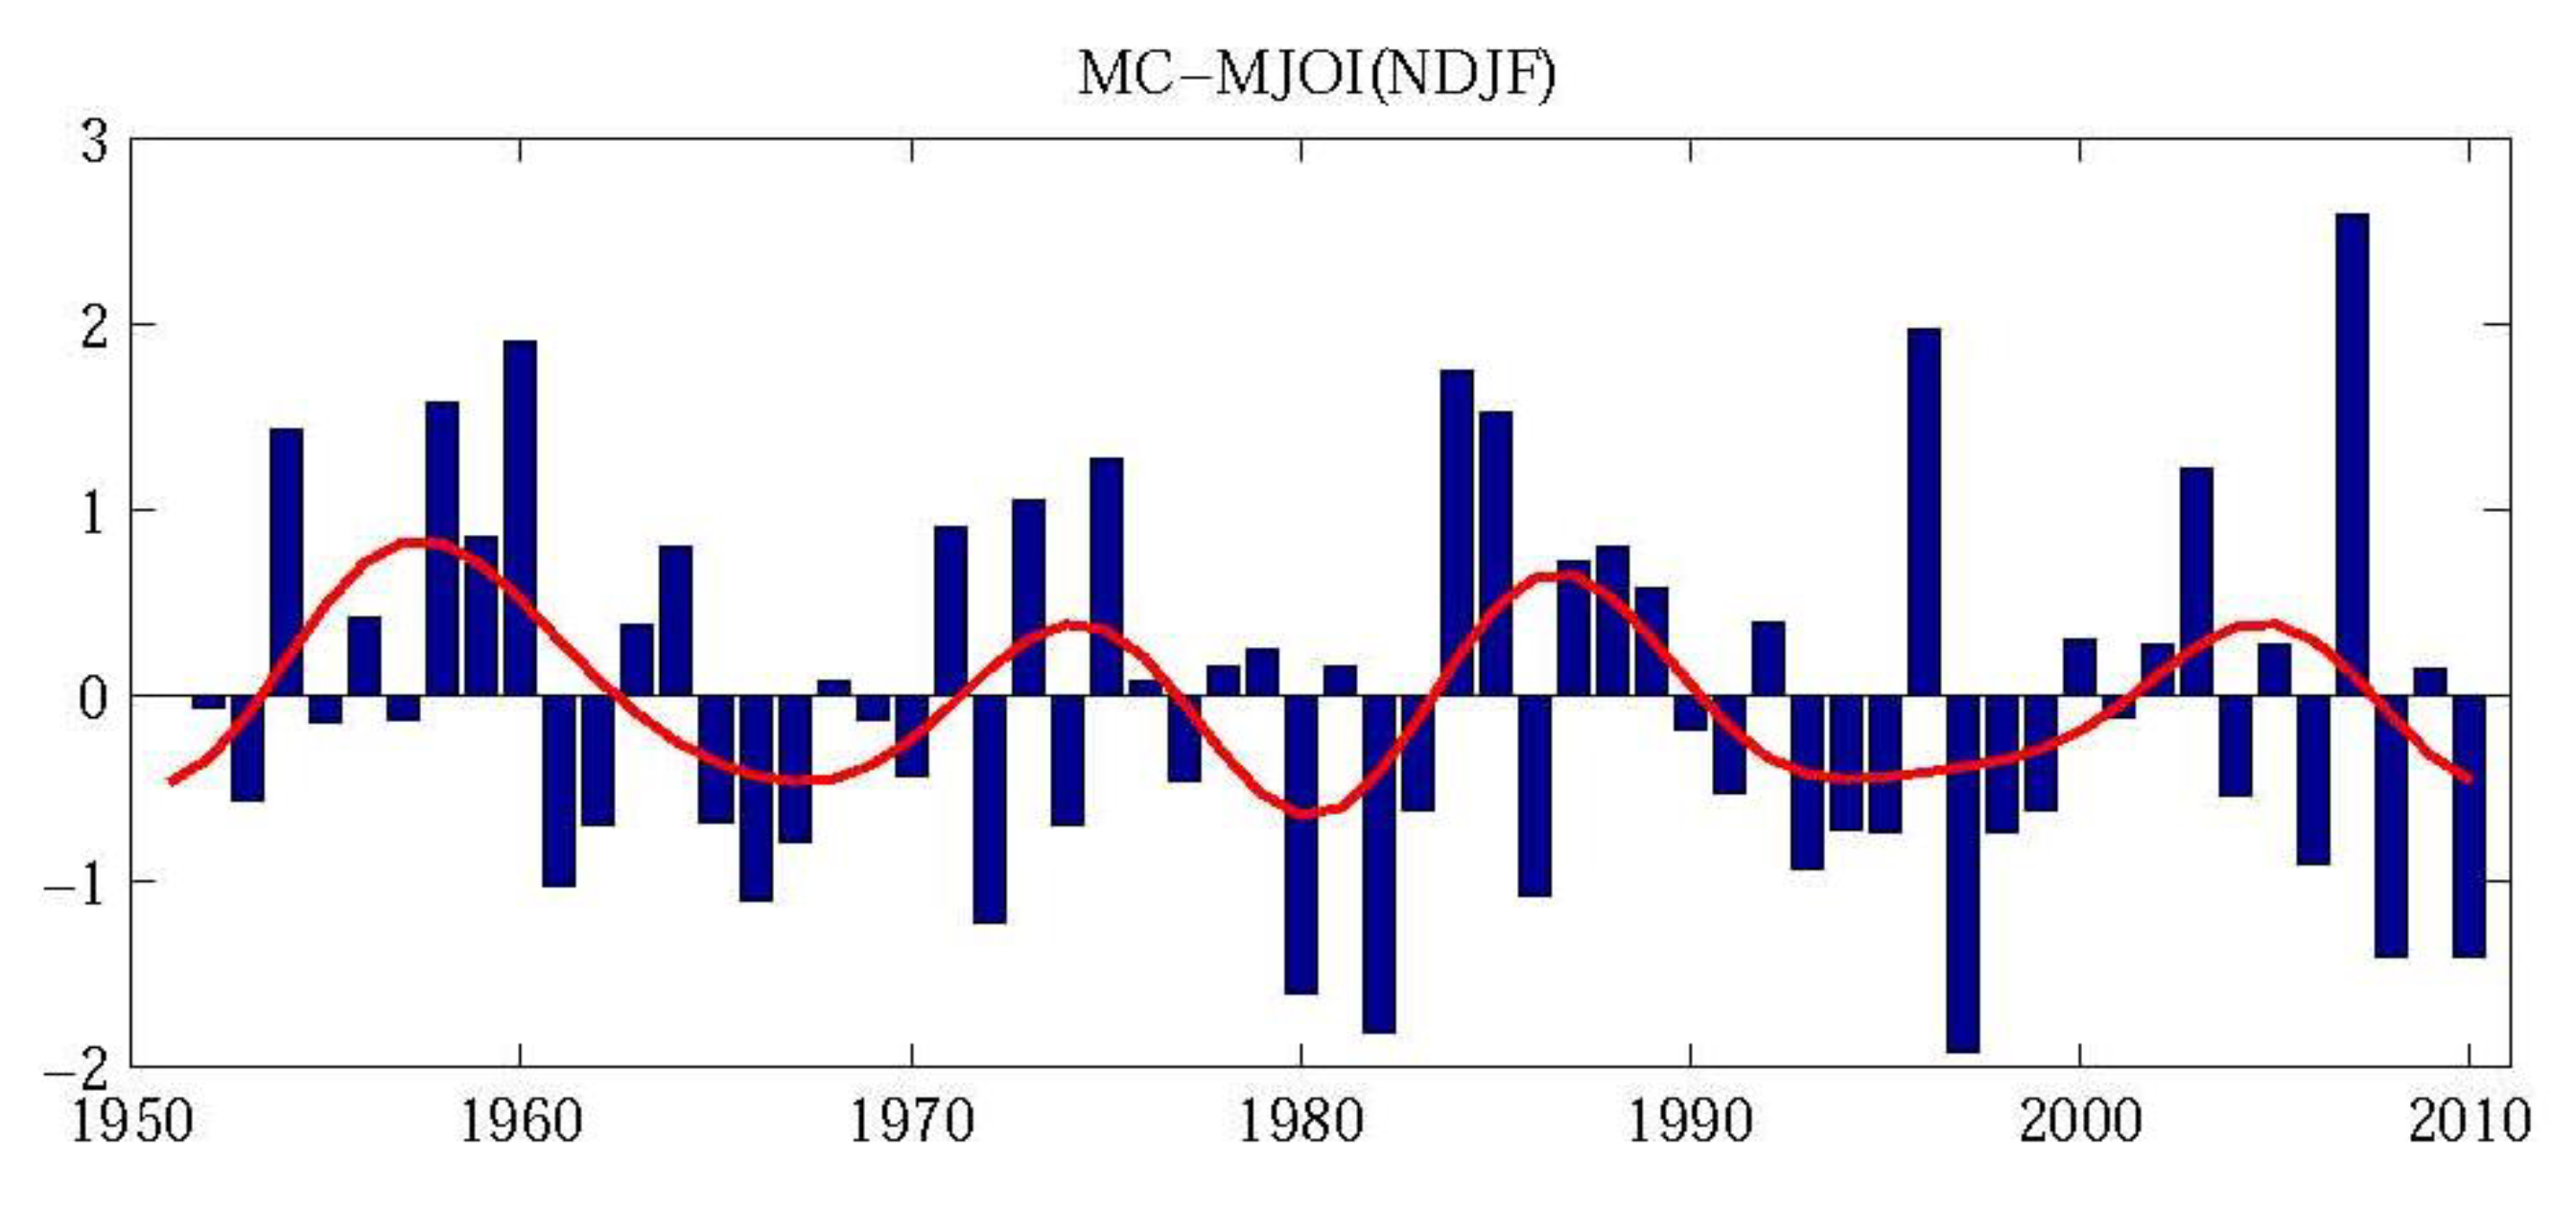
Composite MJO kinetic energy in autumn and winter, spring, and summer between the positive and negative phases of the PIOAM were conducted chronologically and the results indicate that the largest differences occurred in winter. Thus, this paper mainly focused on the MJO activity in winter in the positive and negative phases of the PIOAM. Composite MJO kinetic energy in the positive and negative phases of the PIOAM (Figure 2) showed that the MJO kinetic energy over the equatorial eastern Indian Ocean and the Maritime Continent was significantly weakened in the positive phase years. These were significantly enhanced over the equatorial eastern Indian Ocean, the Maritime Continent, and Australia’s northeast coast in negative phase years, and the MJO kinetic energy decreased significantly over the equatorial western Pacific and central-southern Pacific. It is obvious that there are prominent differences in the MJO intensity between positive and negative phases of the PIOAM, especially over the Maritime Continent. In contrast, the differences in MJO OLR amplitudes between positive and negative PIOAM phases were far less significant than that of MJO kinetic energy, and showed a seesaw pattern in the meridional direction (Figure 3). Similar results were acquired when correlation analyses of the PIOAM index with the MJO kinetic energy and OLR amplitude were carried out (figure omitted). These results indicate that, to some extent, there are significant differences between the MJO activity and the MJO convection, and the causes will be analyzed in another paper. Here, we focused on the relationships between the PIOAM and the MJO activity in winter over the MC region. The yearly evolution of MJO kinetic energy index (Figure 4) shows that besides interannual variation, the MJO kinetic energy in winter also exhibited significantly decadal and interdecadal variation. It enhanced notably in the 1950s, the early and middle 1970s, the middle and late 1980s to the early 1990s, and the early and middle 2000s, while it weakened remarkably in the 1960s, the late 1970s to the early 1980s, the 1990s, and the late 2000s.
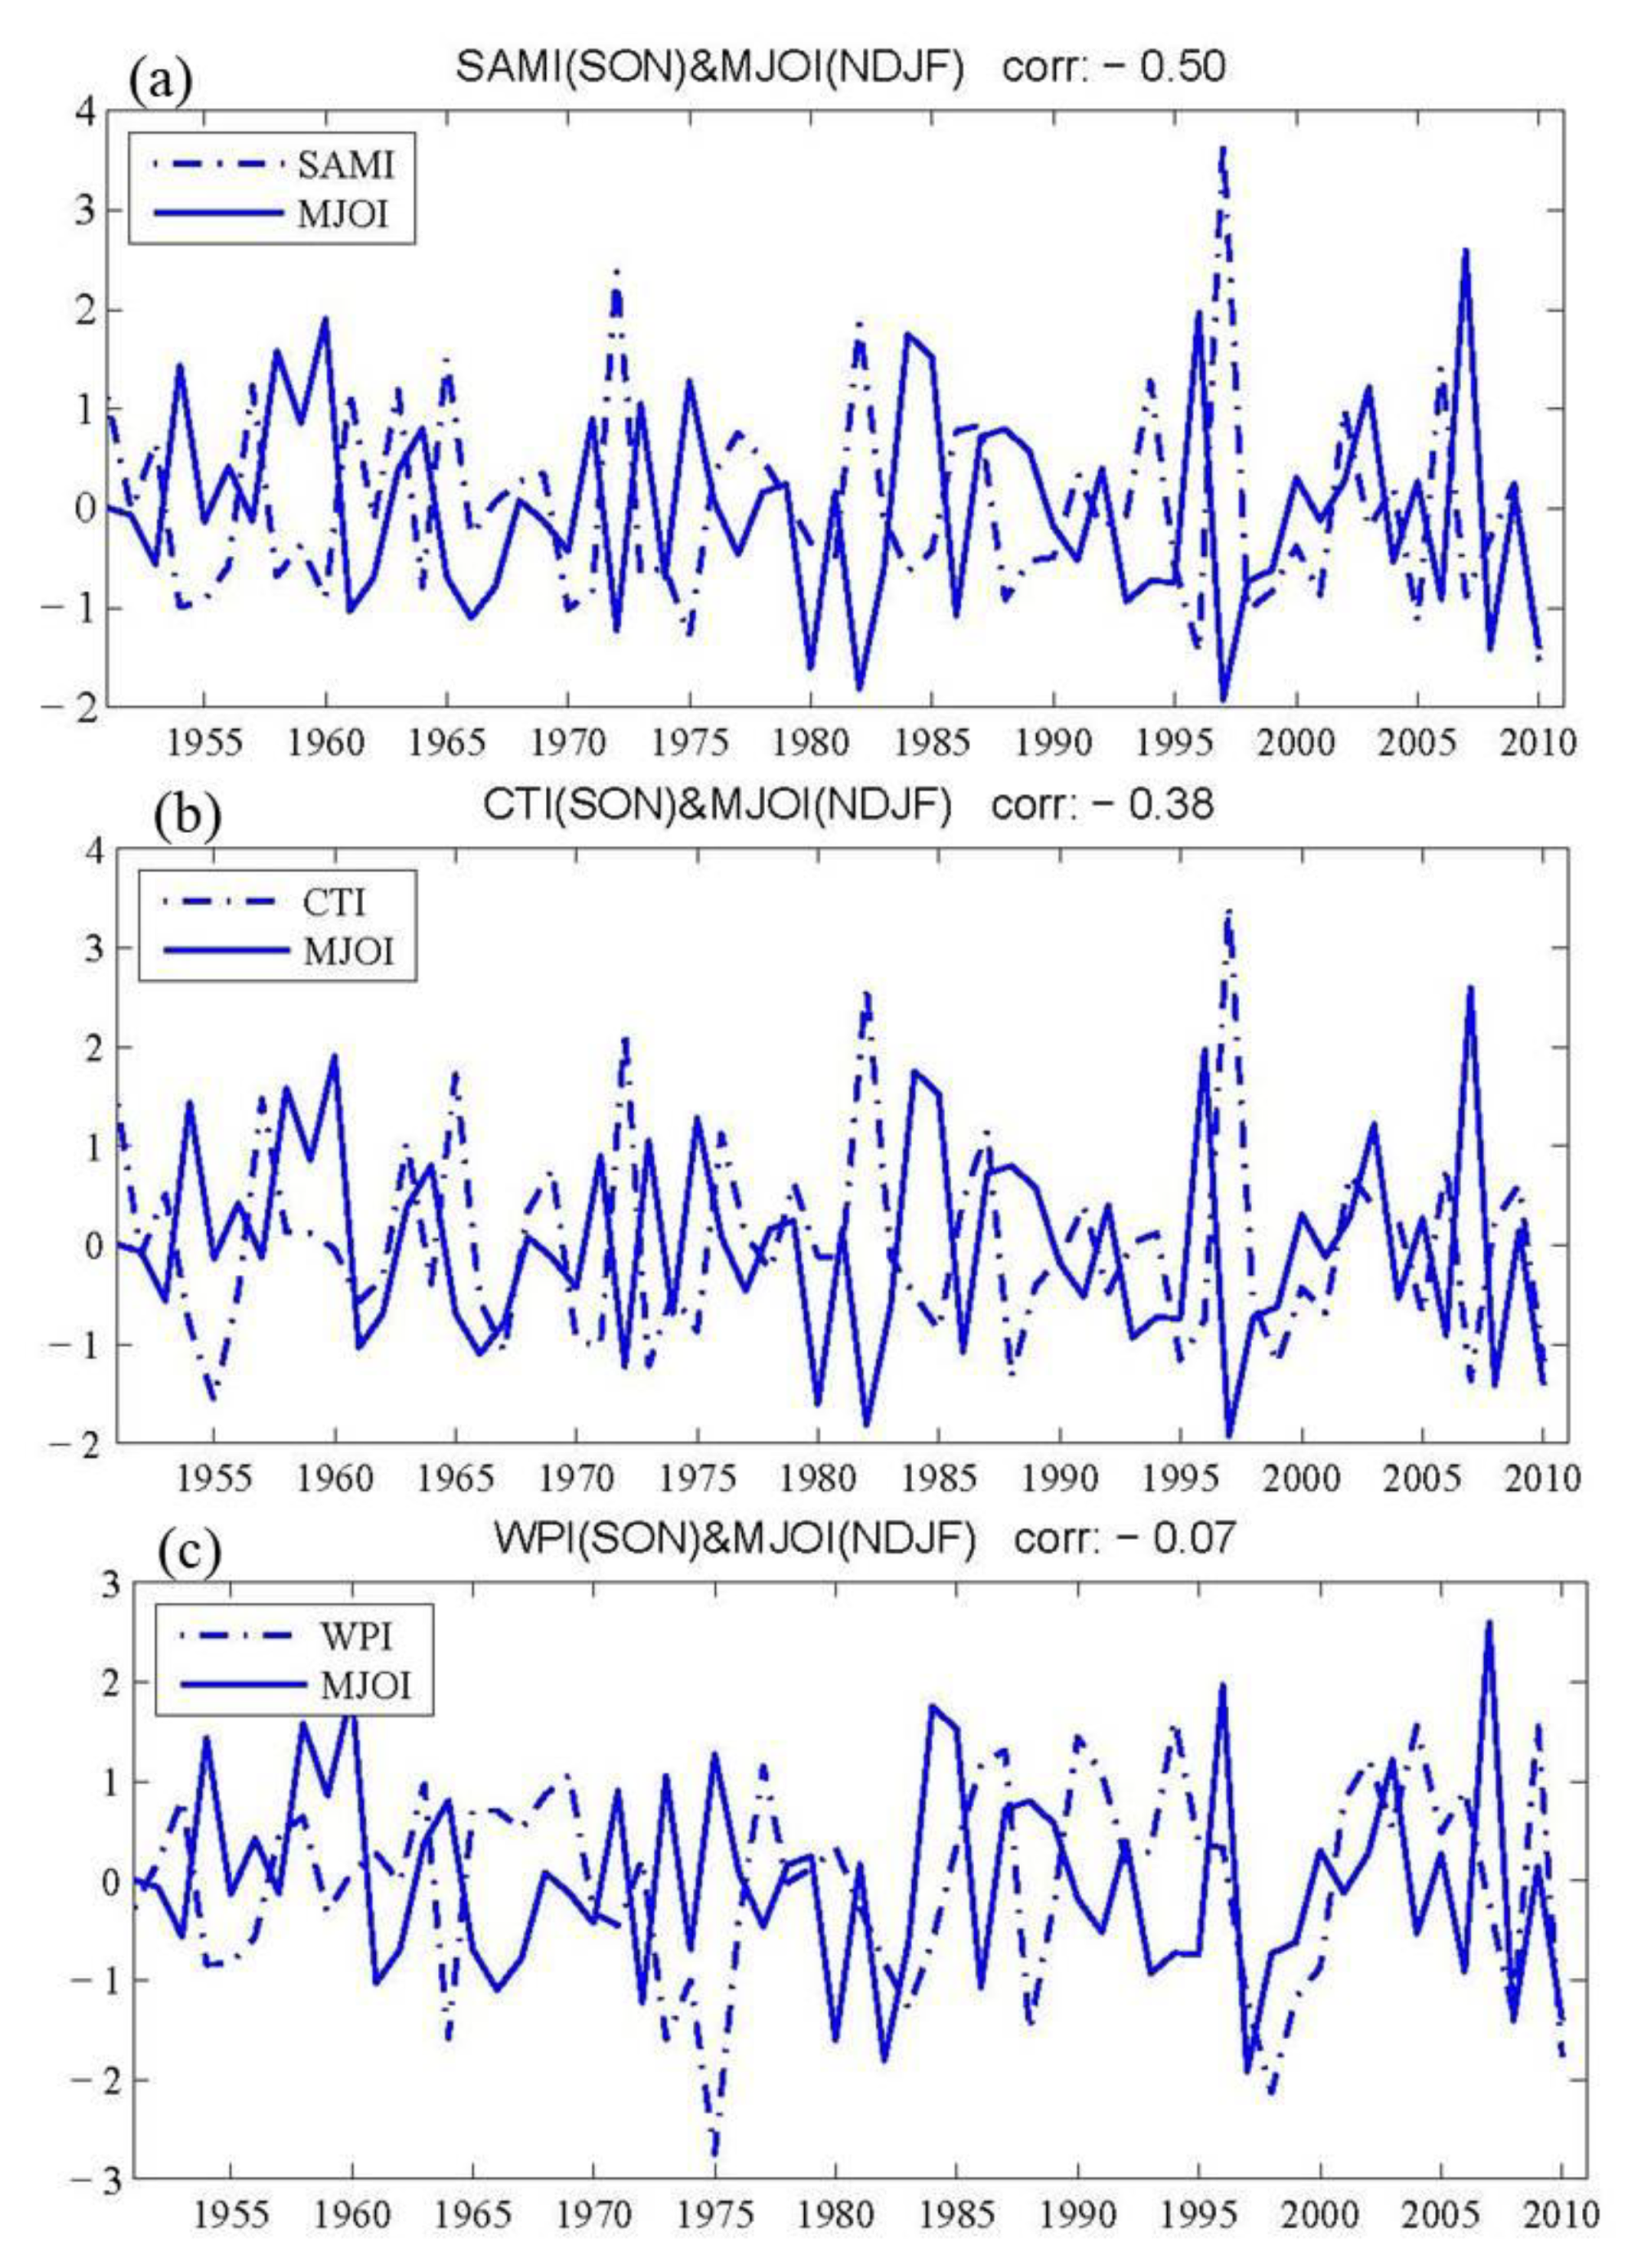
Correlations between the winter (November to February in the following year) MJO kinetic energy index and the SAMI in summer (June to August), autumn (September to November), winter (December to February in the following year) were calculated, respectively. Results show that the autumn SAMI had the best correlation with the winter MJO index, with a high coefficient up to −0.50, which exceeded the significance test at the 99% confidence level (Figure 5a). This means that when the positive autumn PIOAM anomaly strengthens, the MJO kinetic energy over the winter MC region weakens, and vice versa. Figure 5b,c show the correlations between MC–MJO kinetic energy index and ENSO indices. It can be seen that the both the Cold Tongue Index (CTI, which represents the strength of Eastern Pacific ENSO, referred to Ren and Jin, [50]) and the Warm Pool Index (WPI, which represents the strength of Central Pacific ENSO, referred to Ren and Jin, [50]) has weaker correlations with the winter MJO index. The coefficient only reached −0.38 and −0.07, respectively. This indicates that PIOAM has more important impacts on the winter MJO activity over the MC region than that of ENSO, especially than that of the Central Pacific ENSO.
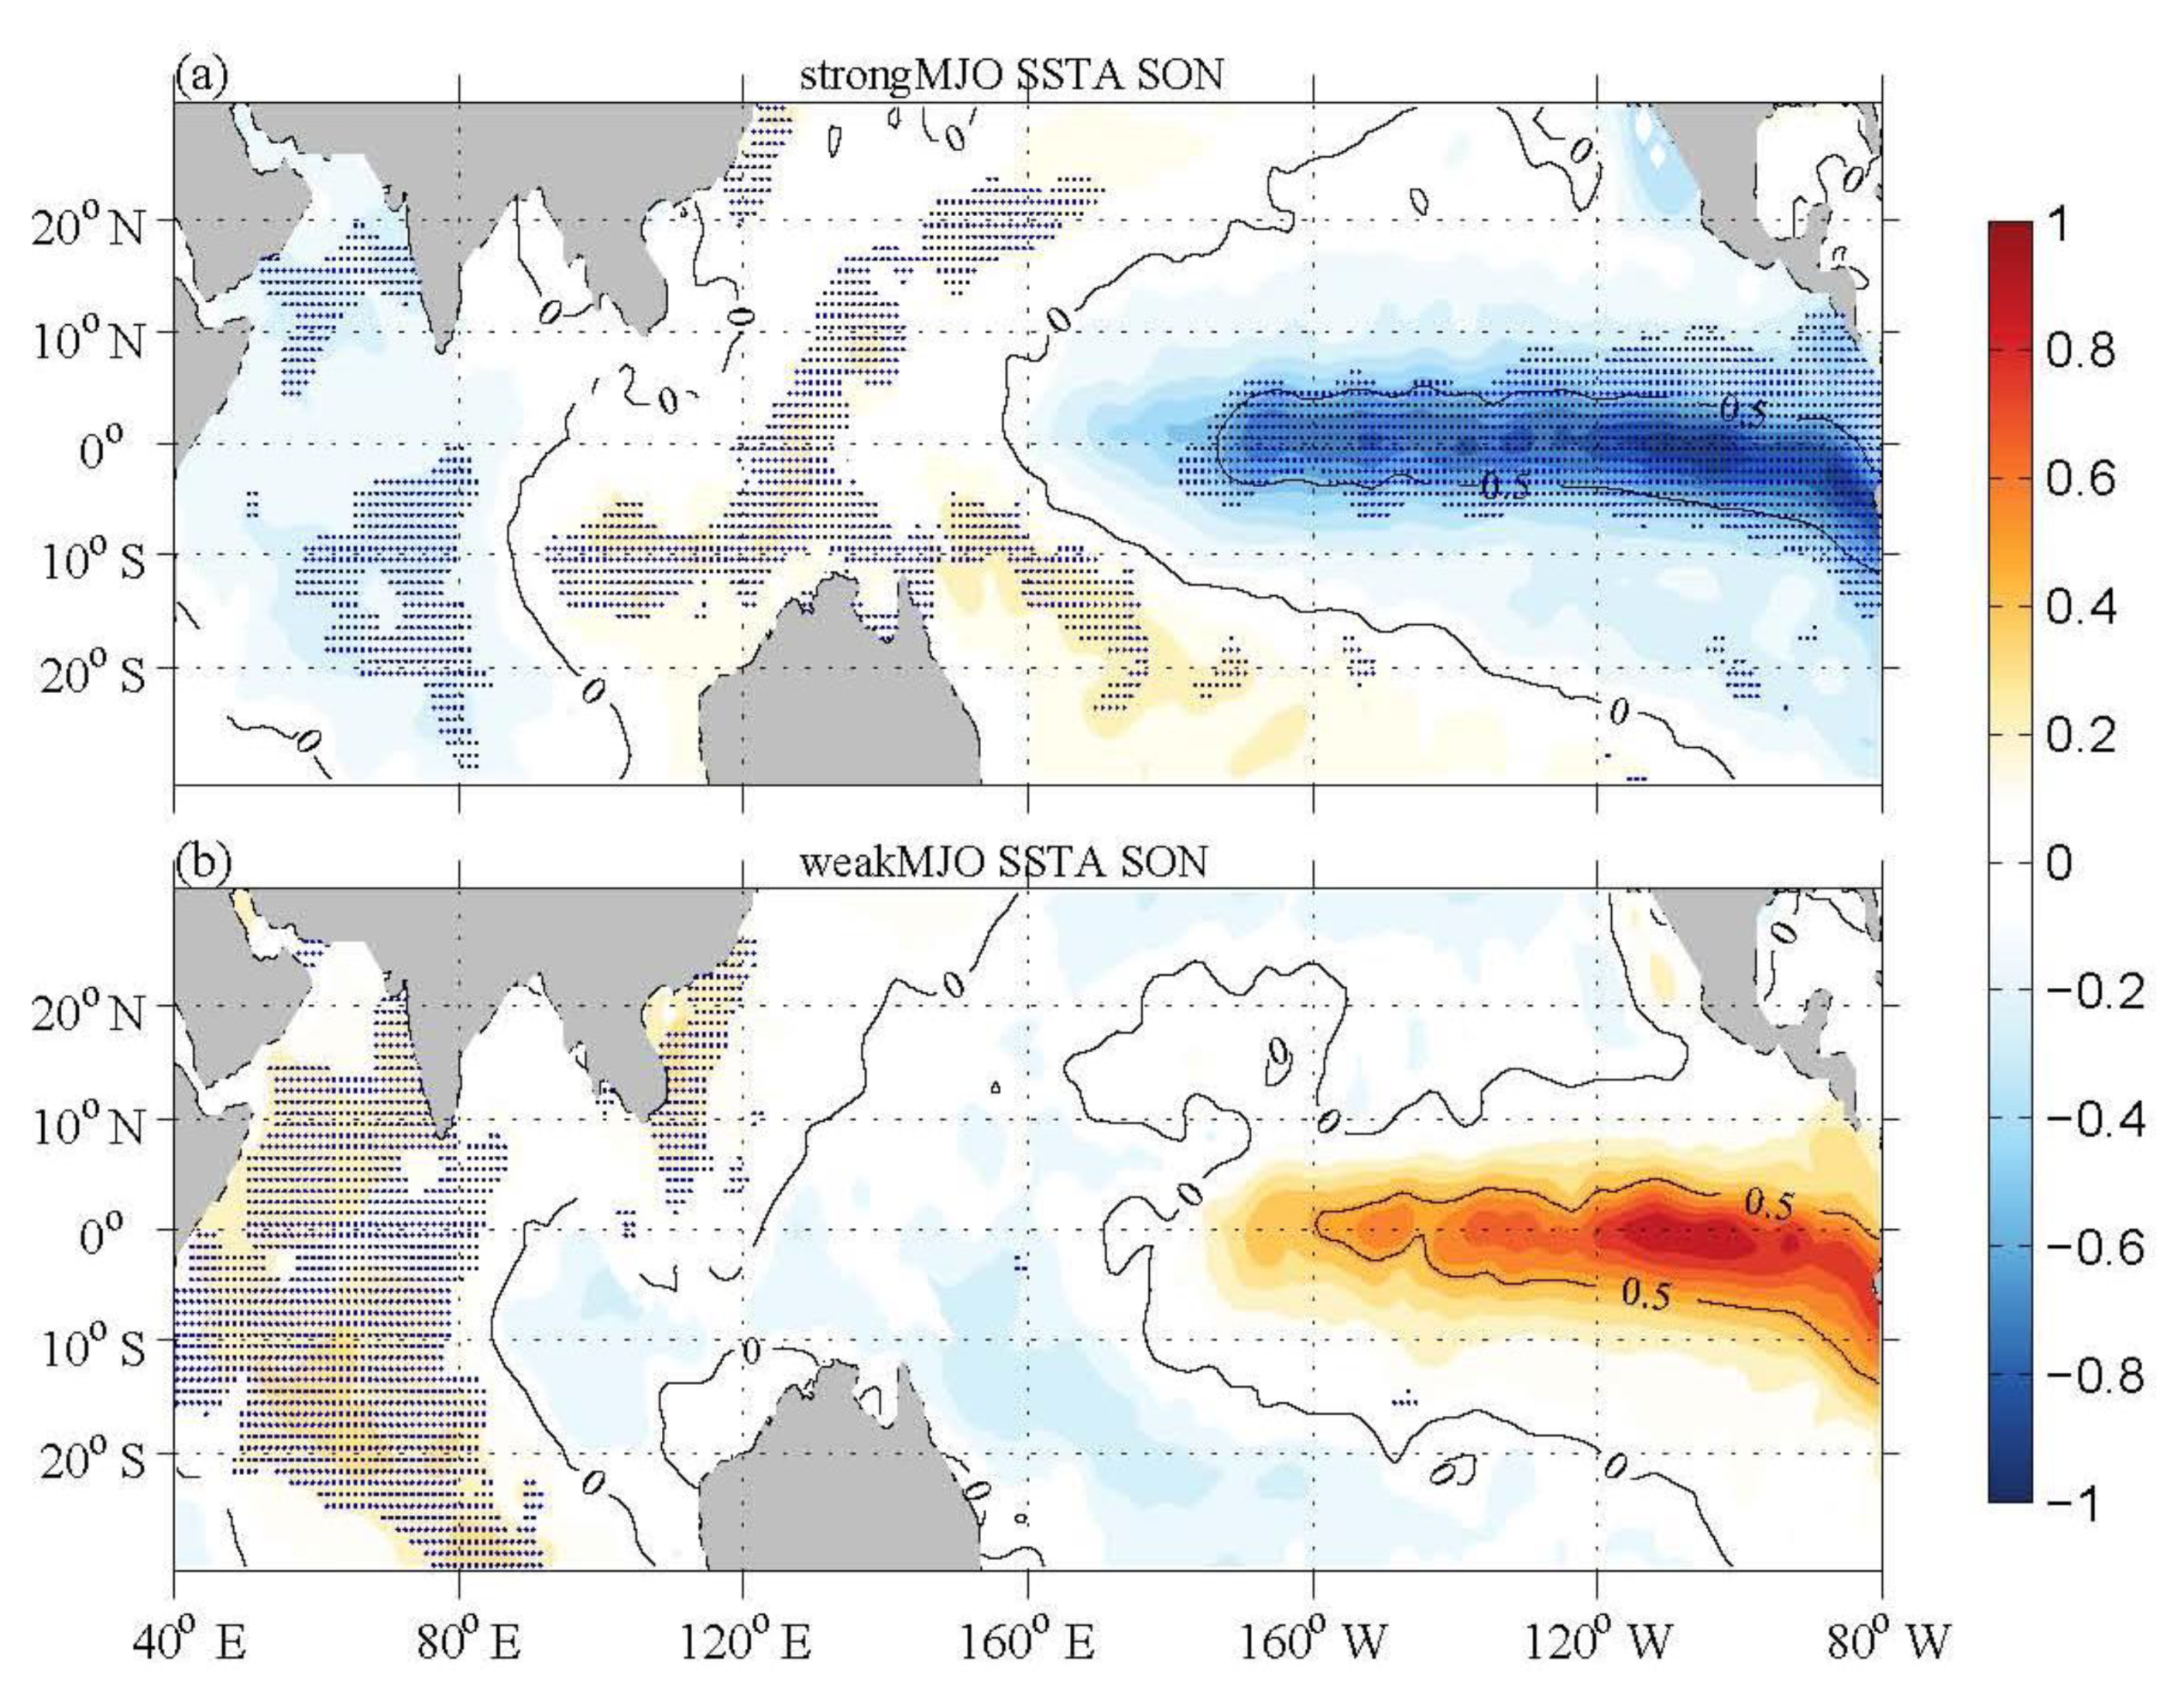
Strong and weak MC–MJO winters are defined as the MJOI exceeding one standard deviation. Ten strong cases (1954, 1958, 1960, 1973, 1975, 1984, 1985, 1996, 2003, 2007) and eleven weak cases (1961, 1966, 1972, 1980, 1982, 1986, 1997, 2008, 2010) were selected. Composite autumn SST in the strong and weak MC–MJO cases are shown in Figure 6. In strong MC–MJO cases, the equatorial southeastern Indian Ocean and tropical southwestern Pacific are significantly warmer, while the western Indian Ocean and central eastern Pacific are significantly colder. This pattern is similar to the negative phase of the PIOAM (Figure 6a). However, in the weak MC–MJO cases, the equatorial southeastern Indian Ocean and tropical southwestern Pacific are slightly colder, while the western Indian Ocean are significantly warmer (Figure 6b). The feature looks like the positive phase of the PIOAM except that the warm SST anomalies in central eastern Pacific did not pass the significance test at the 90% confidence level. These results suggest again that there are good correlations between the intensity of the MJO kinetic energy over the MC region and the PIOAM, especially in the negative phase of PIOAM.

3.2. Differences of the Eastward Propagation of MJO between Positive and Negative Phases of PIOAM

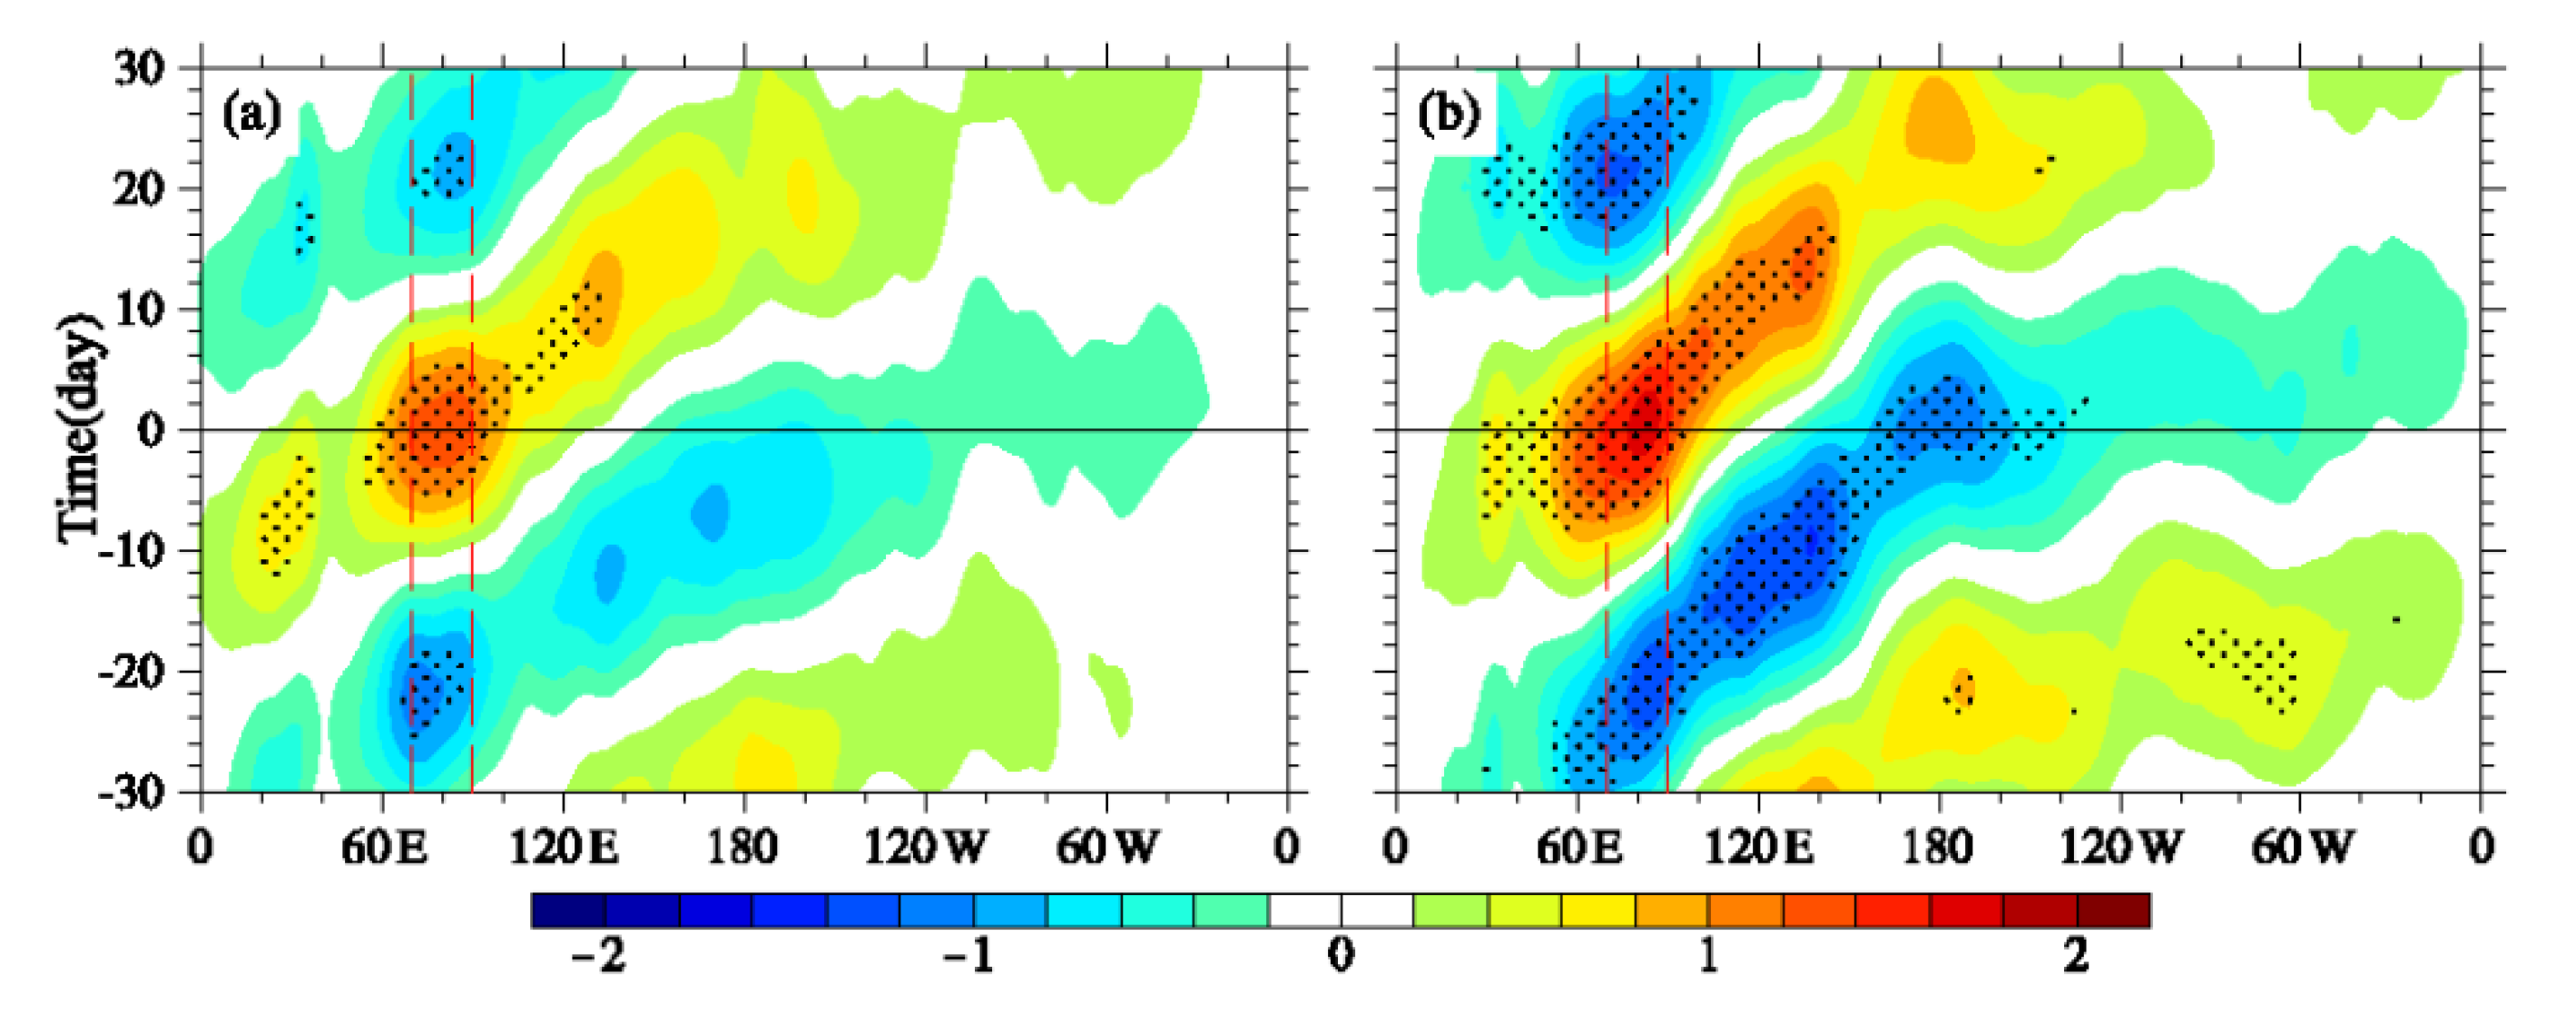
The eastward propagation of MJO kinetic energy along the equator is an important feature of MJO activity, which contributes to the initiation and eastward expansion of the equatorial westerly anomaly. Figure 7 shows MJO zonal winds at 850 hPa averaged over the 10° S–10° N lag regressed onto that averaged over the 10° S–10° N, 70°–90° E in positive and negative PIOAM phases. In the winter of the negative phase of the PIOAM, the MJO activity is significantly stronger, consistent with the results of composite analysis and correlation analysis. Accordingly, the eastward propagation of the MJO is more prominent, and can even propagate to the dateline. In the winter of the positive phase of the PIOAM, the MJO kinetic energy over the MC region is noticeably weaker. As a result, its eastward propagation is also significantly weaker and MJO generally is confined to the east of the Maritime Continent.
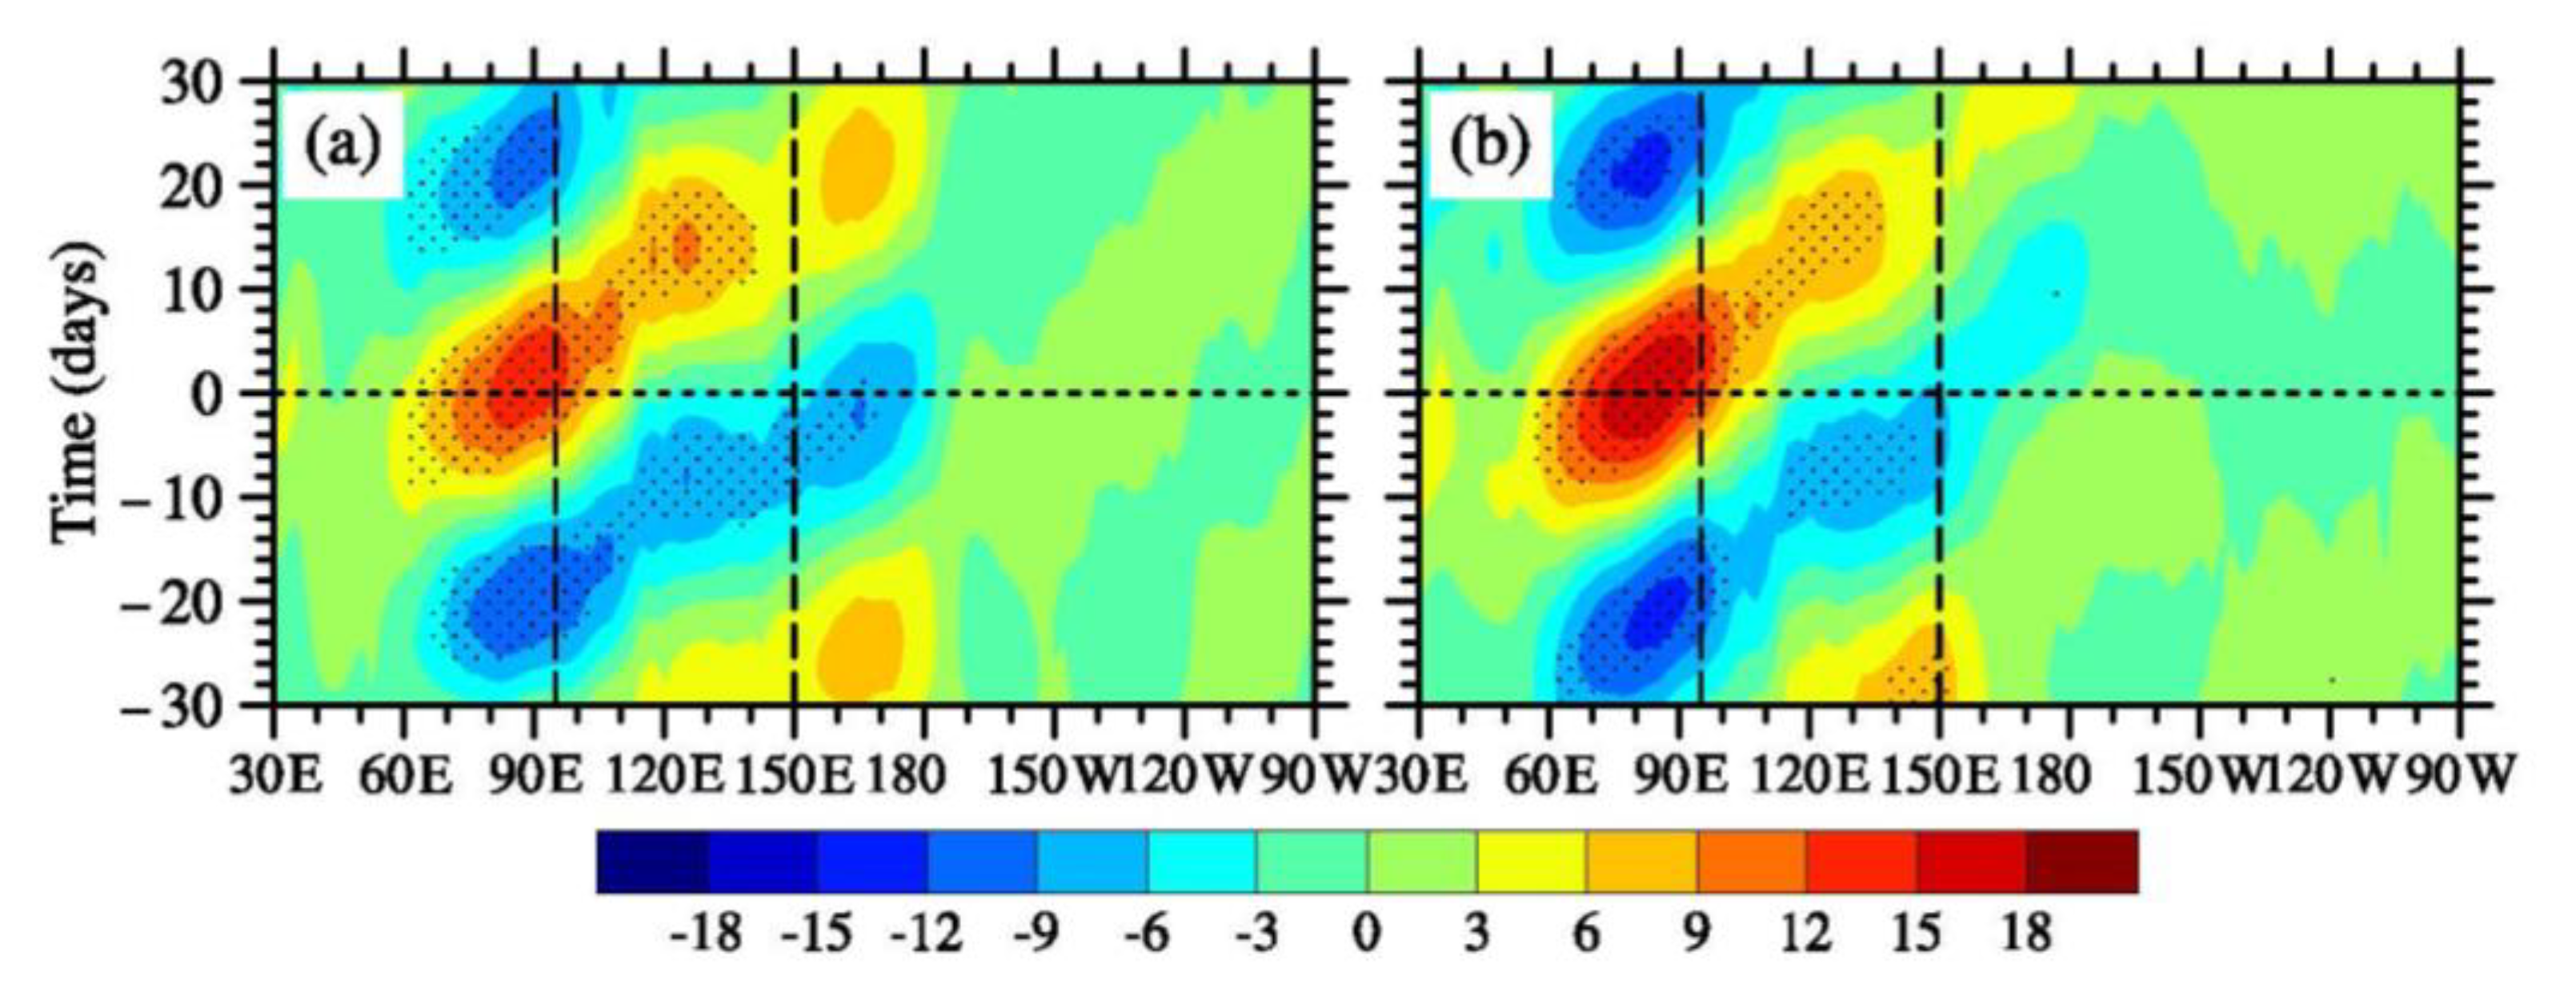
Figure 8 shows the regressed MJO OLR averaged over the 10° S–10° N onto that averaged over the 10° S–10° N, 70°–90° E. During the positive phase of the PIOAM, the MJO convection over the equatorial eastern Indian Ocean (corresponding to the third phase of the MJO) is weaker than that during the negative phase, while the MJO convection is stronger over the Maritime Continent and equatorial western Pacific (corresponding to the fourth and fifth phases of the MJO) than that during the negative phase. This means that the MJO can propagate farther east in the positive PIOAM phase, and the character is different from that of the propagation of the MJO kinetic energy, which indicates that the MJO kinetic energy and convection over the MC region do not completely correspond.
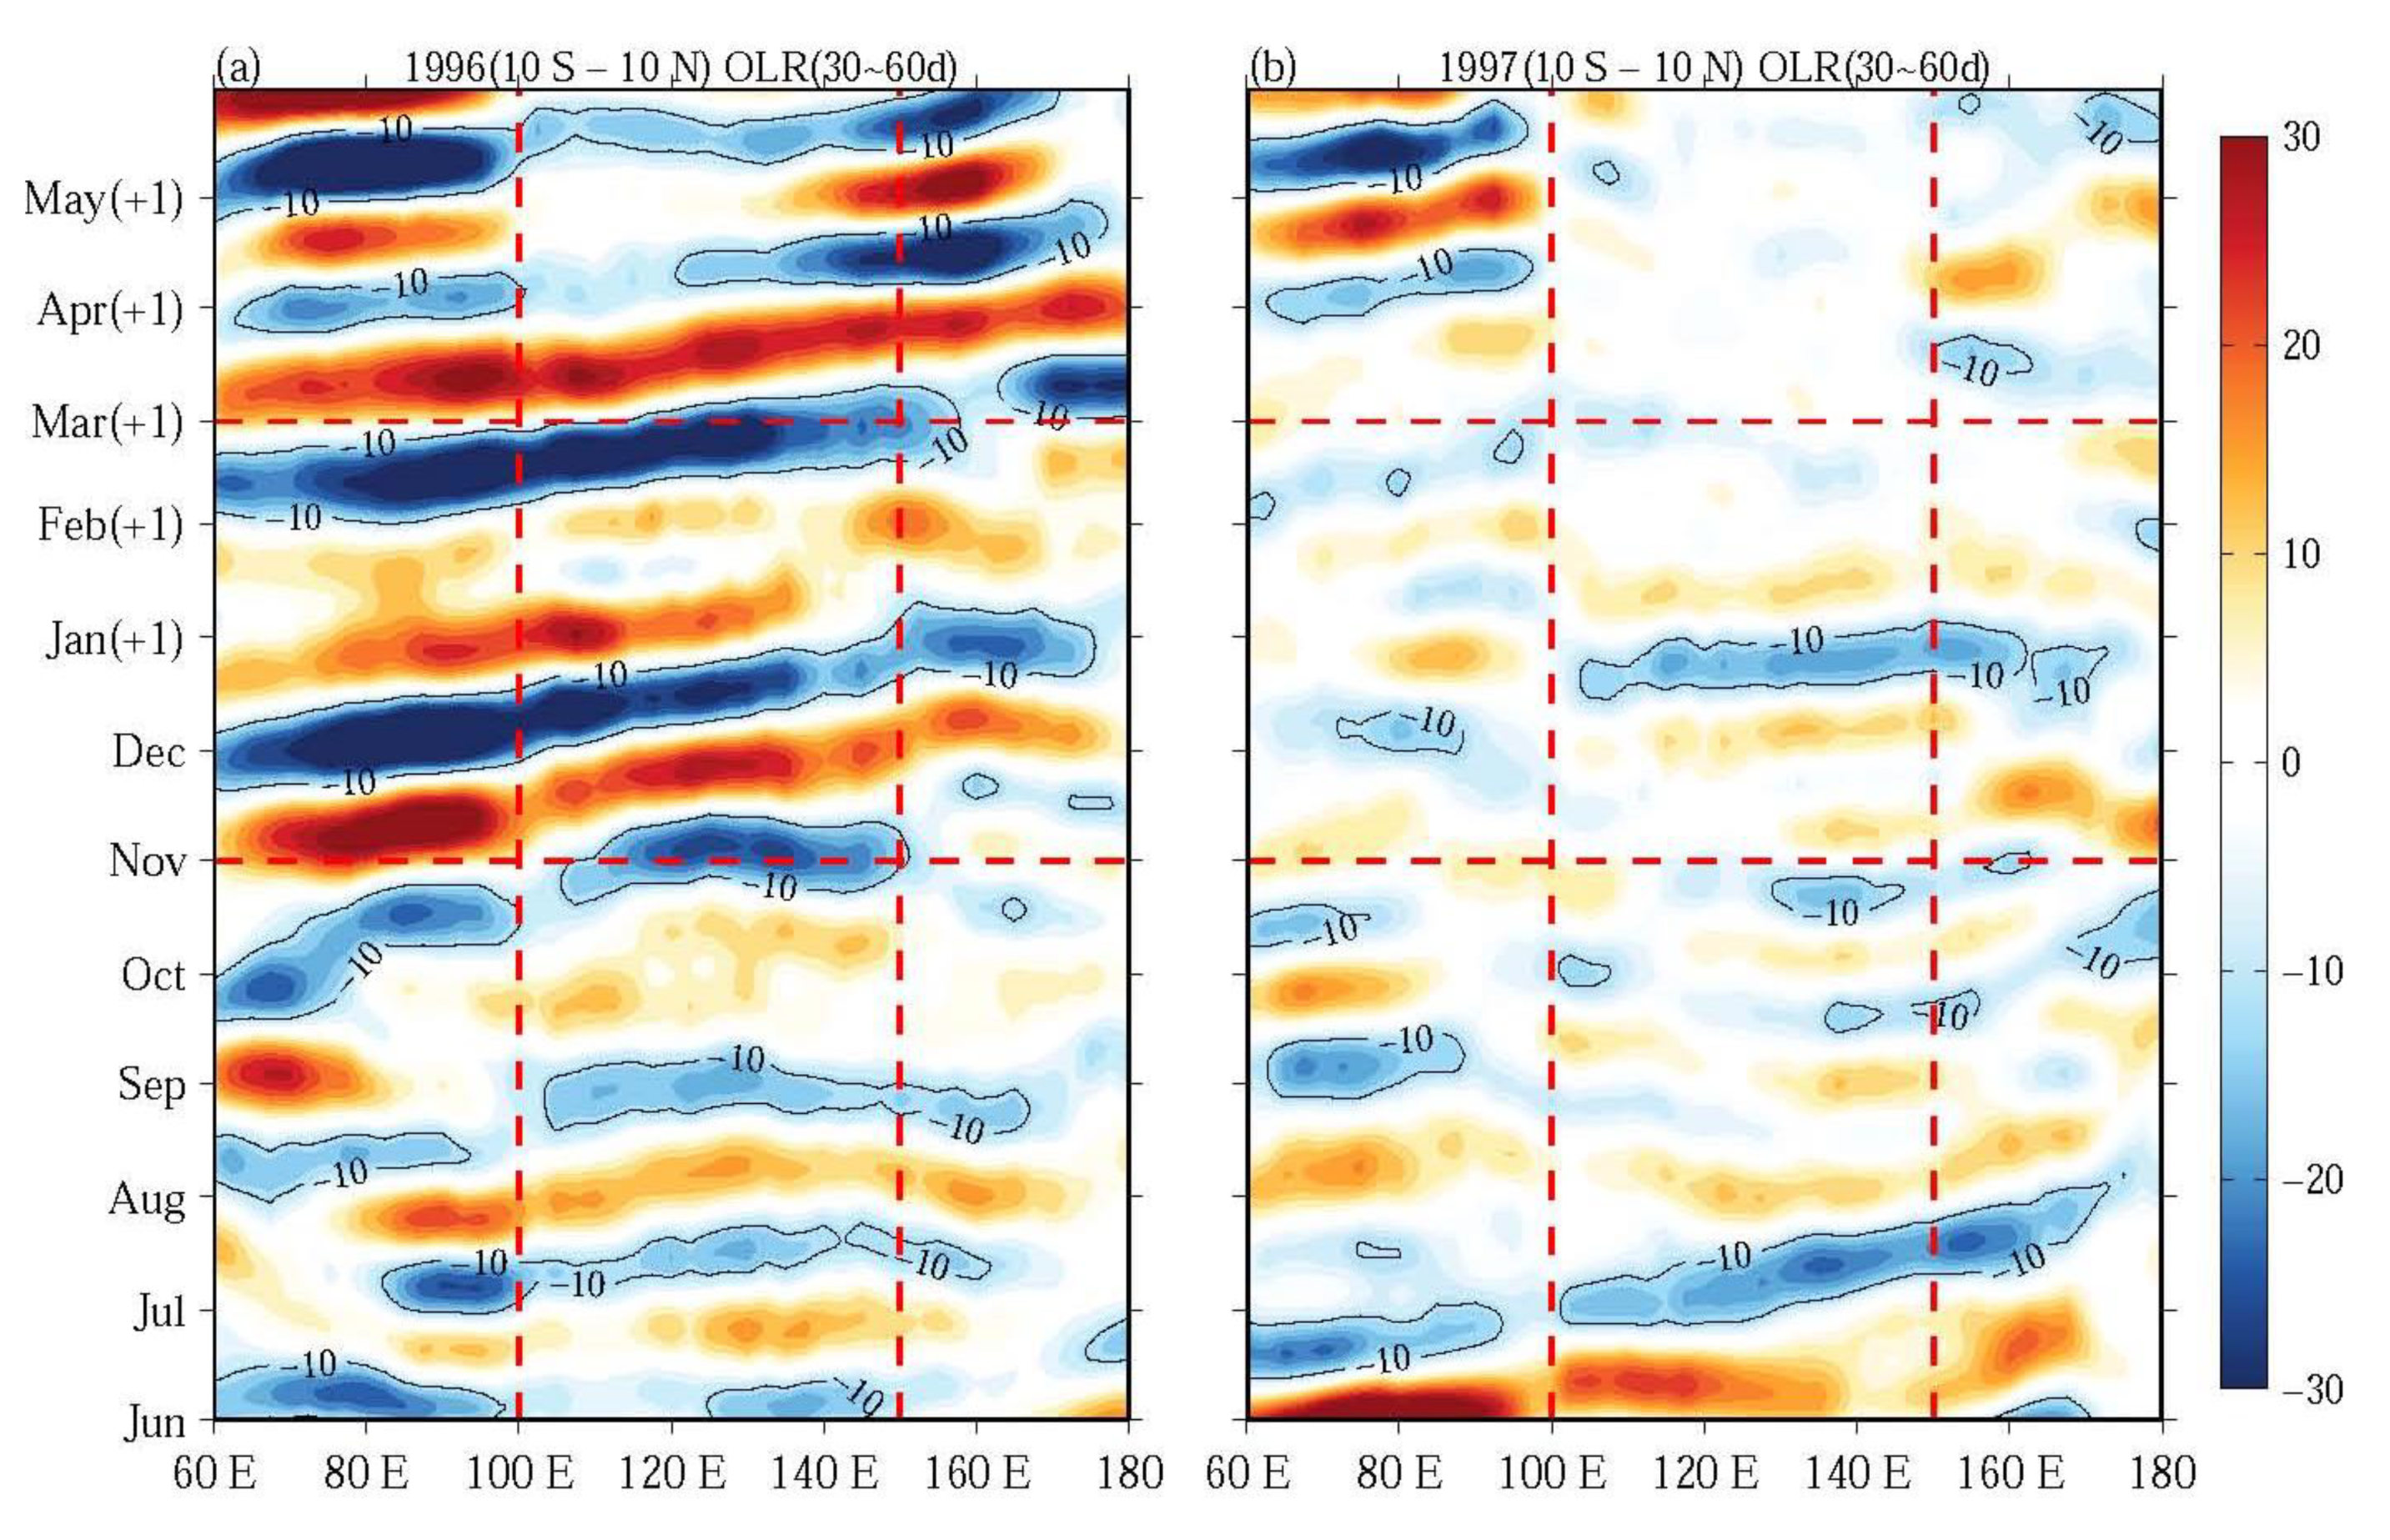
We further took 1996 and 1997 as typical examples for negative and positive PIOAM phases, respectively, to analyze the practical MJO propagation. The results demonstrate that compared with the condition in the winter (November to February in the following year) of the negative PIOAM phase, more MJO convection can extend to the western Pacific and even farther (Figure 9a,b) in the winter of the positive PIOAM phase. The MJO convections in other typical positive and negative phase years (such as 1987 and 1988, 2002 and 2001) were compared and analyzed, and similar conclusions were obtained (figure omitted).

3.3. Differences of the MJO Structure over the Maritime Continent between Positive and Negative Phases of PIOAM

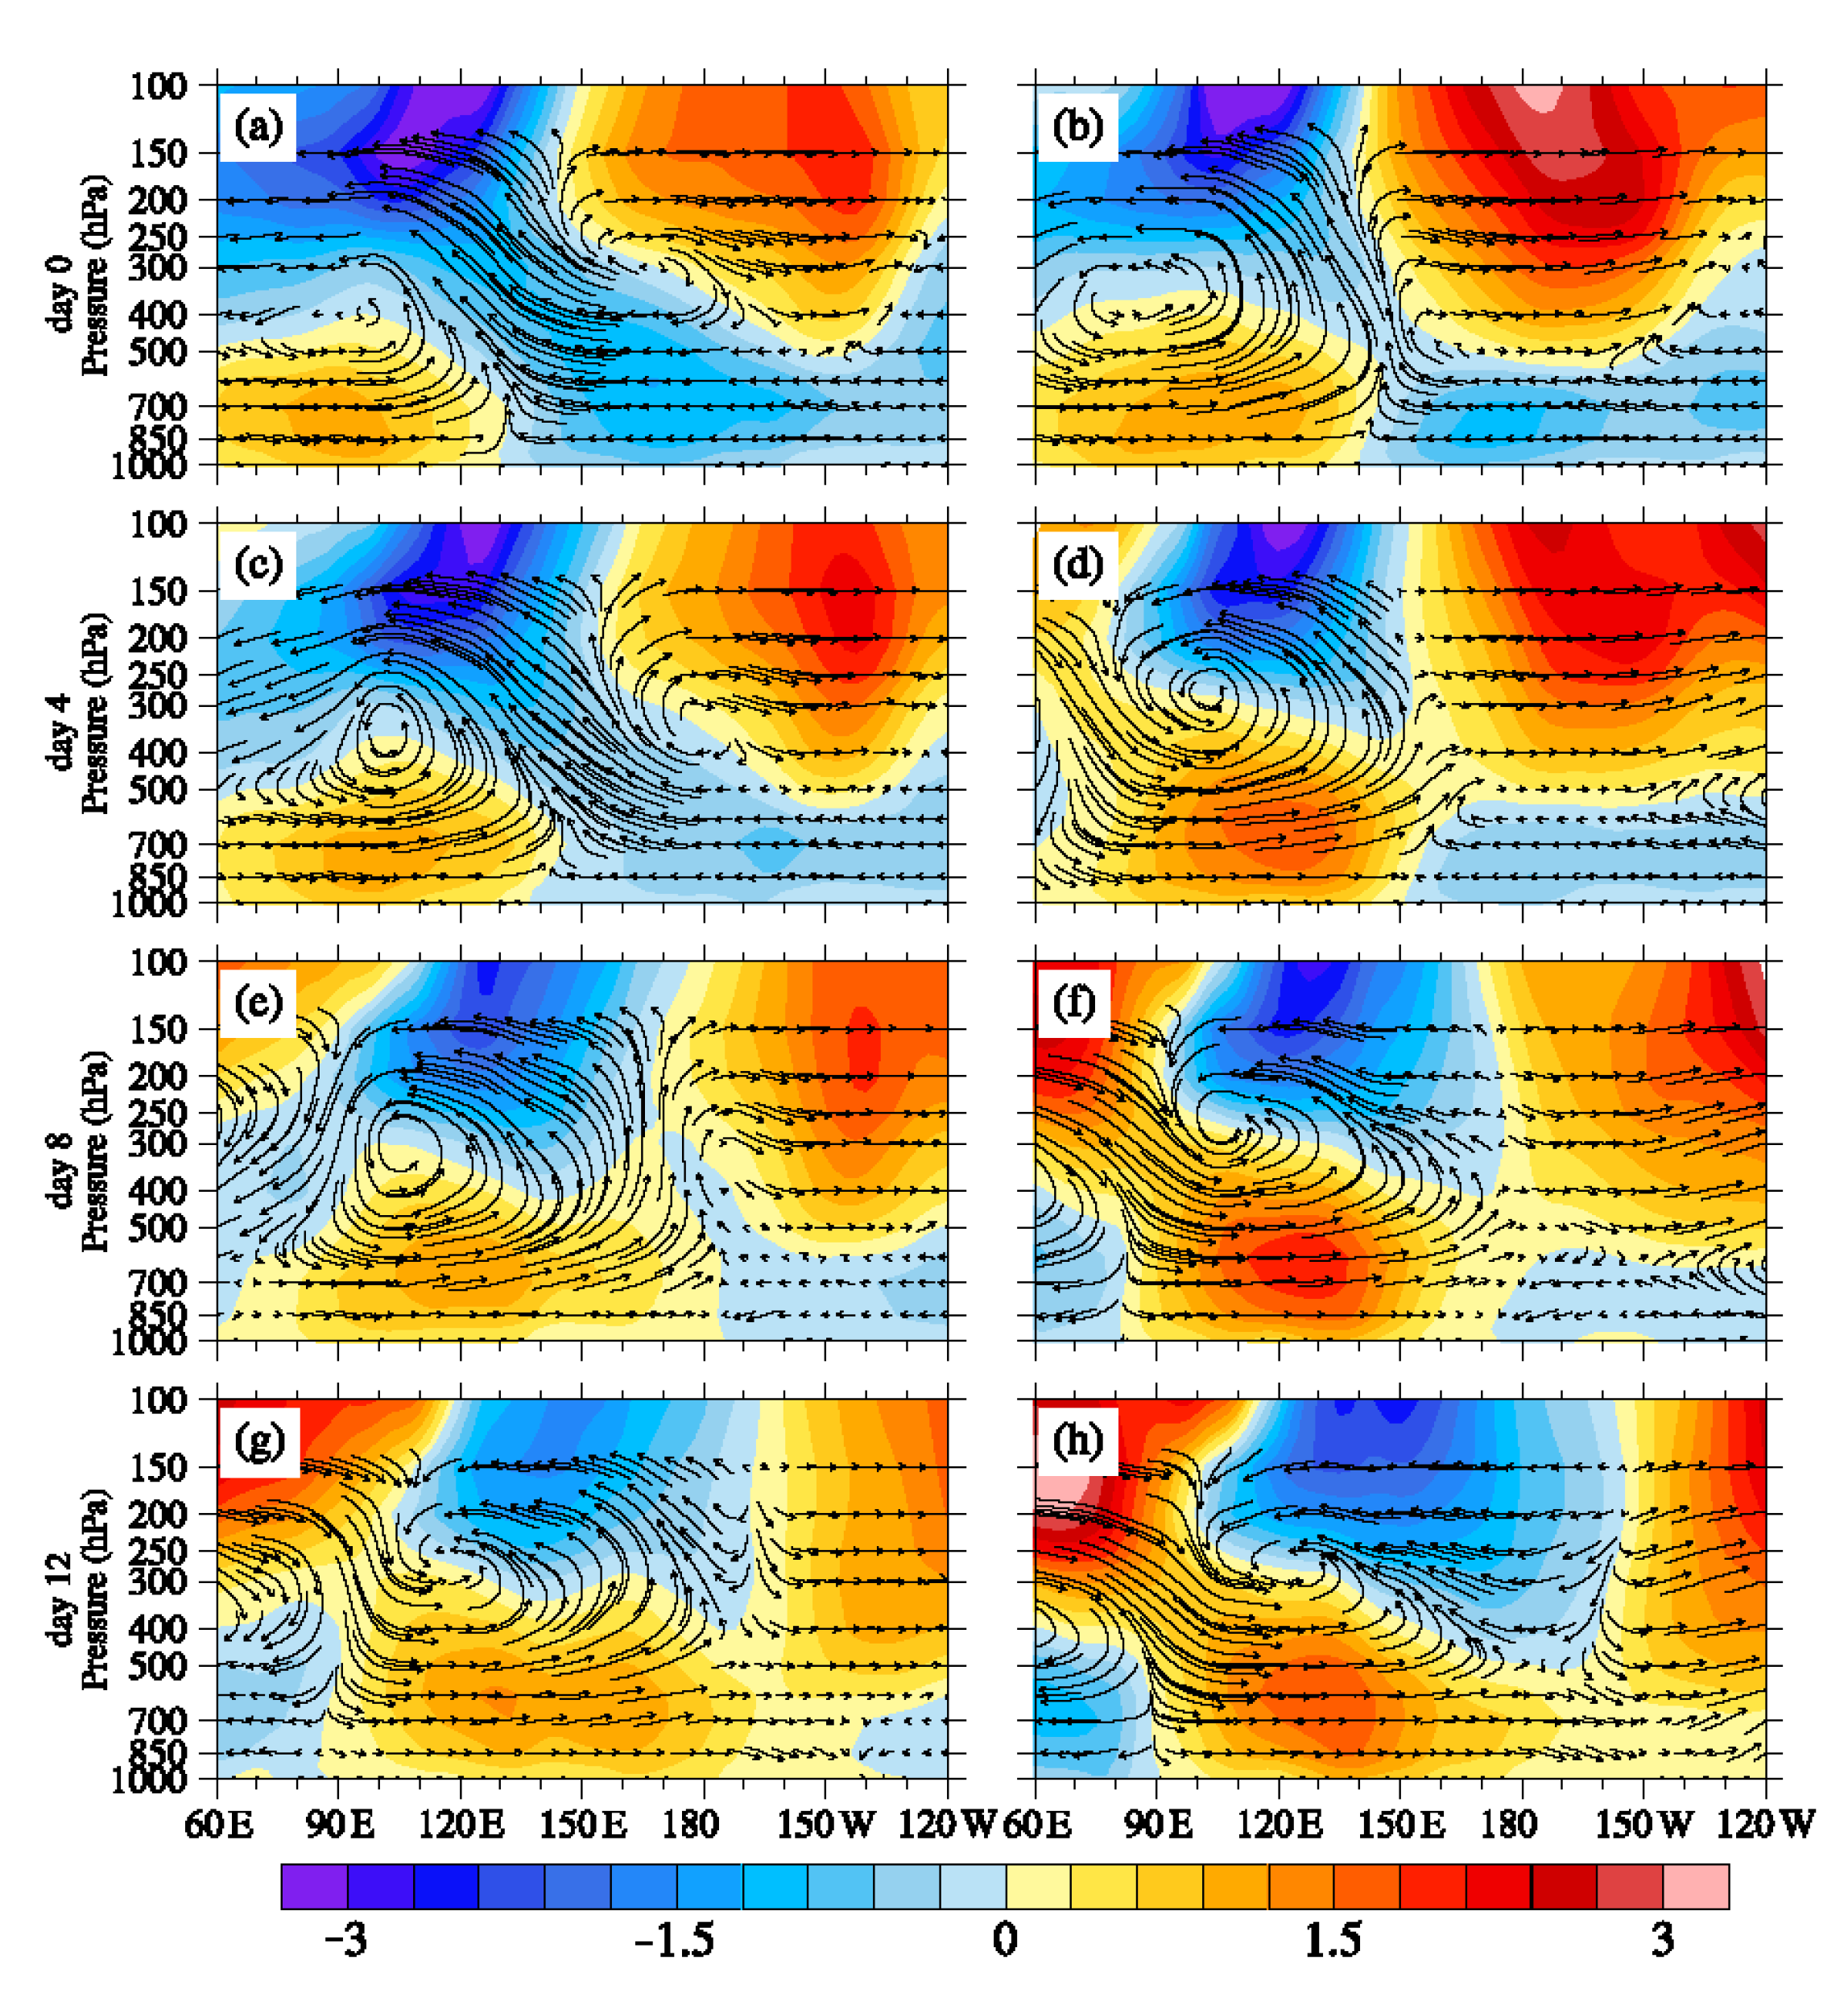
Figure 10 shows the regressed MJO zonal-vertical circulation on the winter MC–MJO OLR index. As can be seen, MJO circulation shows eastward propagation in both phases of the PIOAM. However, there were apparent differences between positive and negative PIOAM phases, especially over the Maritime Continent. In the winter of the positive phase of PIOAM, when MJO activity extended into the Maritime Continent, anomalous westerlies at the lower-level were significantly weaker than that in the negative phase of PIOAM, which corresponds with the above conclusion that the MC–MJO kinetic energy is stronger in the winter of the negative phase of PIOAM. Anomalous easterlies in the upper-level in the positive phase were also weaker in the positive phase of PIOAM, especially after day 8. There were no prominent differences in the vertical motion over the Maritime Continent region between the contrasting phases of PIOAM, which may explain why the MC-MJO OLR has no significant difference between the positive and negative phases of PIOAM.

3.4. Causes for the Different Characteristics in Positive and Negative Phases of PIOAM

3.4.1. Abnormal Distribution of SST

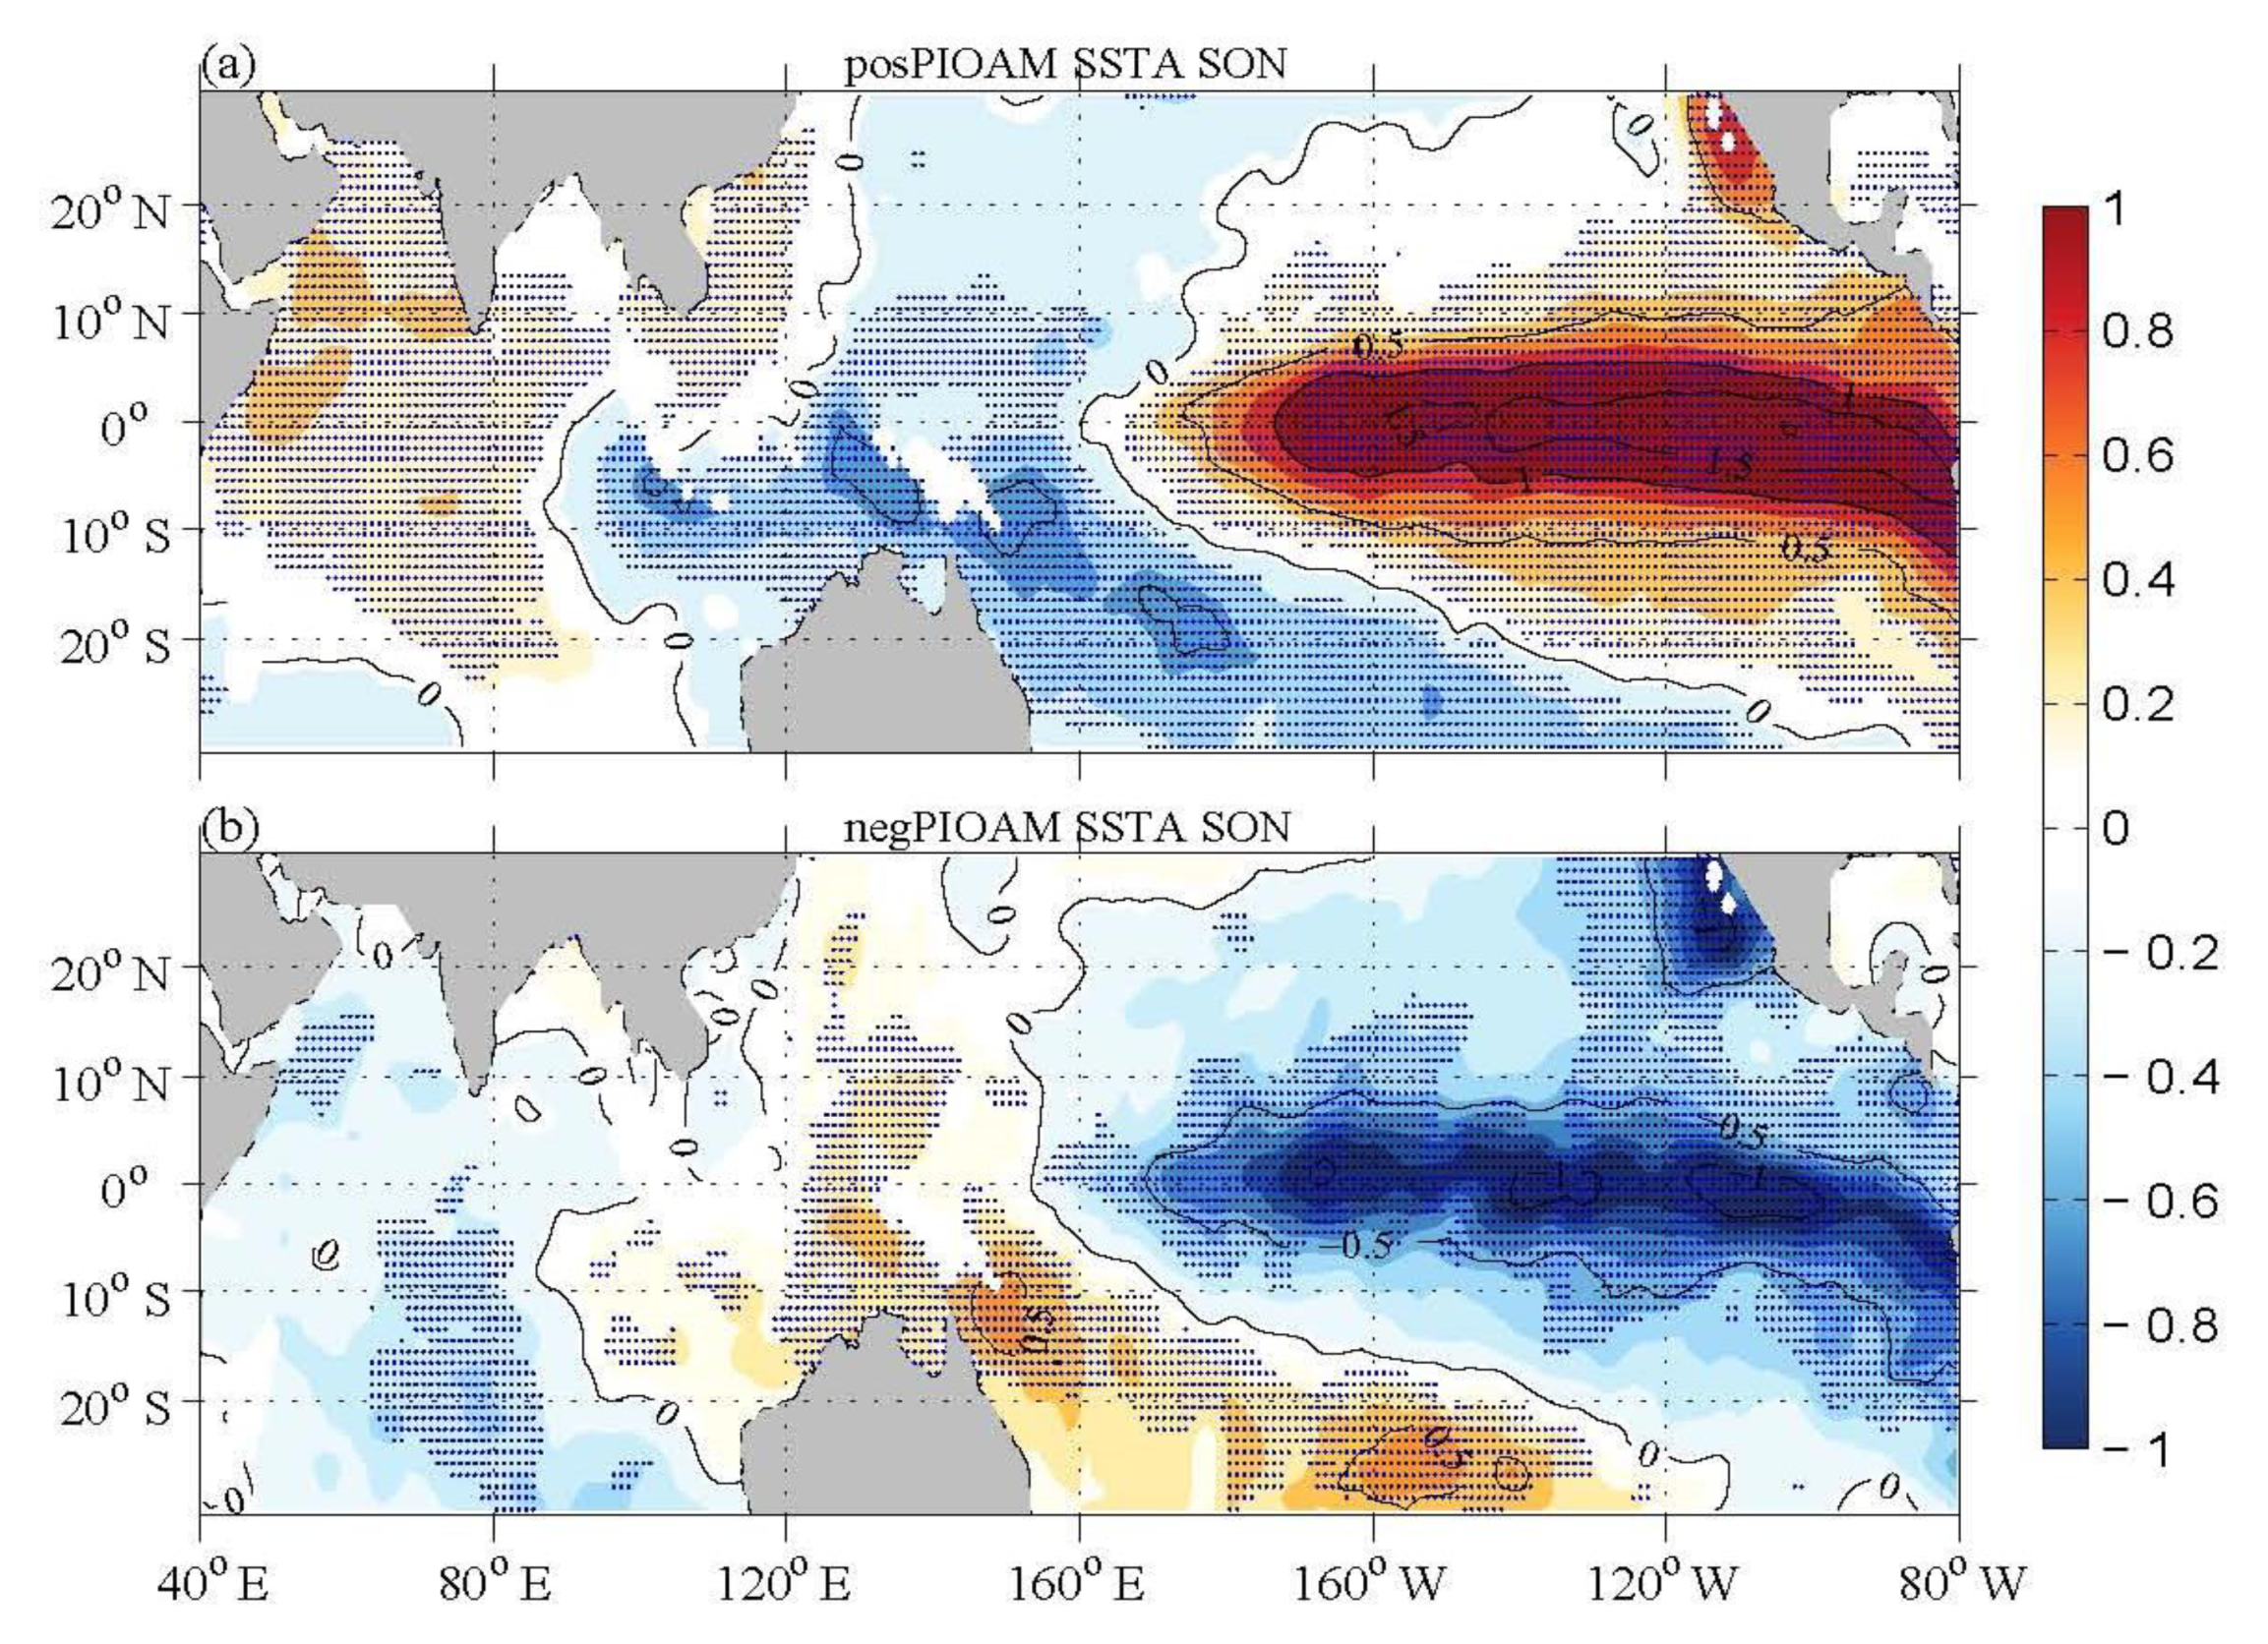
Previous studies have revealed that MJO intensity has close relationships with the underlying SST. Composite SSTA in autumn in the anomalous years of PIOAM are shown in Figure 11. In the positive phase of PIOAM, the Indian Ocean exhibits the positive phase of the IOD, while the Pacific presents a strong El Niño pattern with SST dropping significantly over the MC region and adjacent waters and vice versa. Wilson et al. [42] pointed out that based on analyses in the observational data, the MJO activity was significantly weak (strong) over the Indian Ocean and Maritime Continent during the positive (negative) phase of IOD. Li and Zhou [16] reported that after a strong El Niño event, MJO activities over the equatorial Indian Ocean and western Pacific were obviously reduced. As a result, during the positive phase of the PIOAM, the coordinated distribution of the positive IOD in the Indian Ocean and El Niño in the Pacific excites the reduction of the MJO activity over the Maritime Continent, while the negative IOD phase in the Indian Ocean and the strong La Niña in Pacific favor the enhancement of MC–MJO activity. Furthermore, local SSTA may also have an influence on the MJO intensity over the MC region. That said, positive SSTA contributes to strengthening the MJO activity, while negative SSTA does not.

3.4.2. Abnormal Distribution of Horizontal Wind Field

Many studies have proven that there are connections between the MJO activity and equatorial zonal wind at 850 hPa. Jia [51] found that tropical intraseasonal oscillation mainly occurs in mean westerlies and weak zonal winds and further pointed out that the impacts of zonal winds may be more important than that of SST. Composite horizontal wind anomalies in winter in the positive and negative phases of the PIOAM are shown in Figure 12. During the winter of the positive PIOAM phase, there is a strong easterly anomaly over the equatorial Indian Ocean and Maritime Continent, which weakens the MJO activity over the MC region. During the winter of the negative PIOAM phase, the significant westerly anomaly over the equatorial Indian Ocean and Maritime Continent strengthens the MJO activity over the MC region. Li [52] reported that the MJO activity also possessed a close association with the East Asian winter monsoon (EAWM). Strong (weak) EAWM can excite the enhancement (reduction) of MJO activity over the equatorial western Pacific. Compared with Figure 12a,b, EAWM weakens (strengthens) during the positive (negative) PIOAM phase, which may cause the MJO activity over the equatorial western Pacific and Maritime Continent to weaken (strengthen).

4. Conclusions and Discussions

Based on the HadISST, NCEP reanalysis data of the atmospheric circulation, and OLR datasets, the relationships between the MJO activity in the boreal winter over the Maritime Continent and the PIOAM were examined. The main conclusions are as follows.
(1)
MC–MJO possesses prominent seasonally “phase-locked” features, which means that the MJO is strongest in the boreal winter and weakest in the boreal summer. MC–MJO also exhibits significant interannual and interdecadal variations.
(2)
In winter (November to February in the following year), the interannual variation of the MC–MJO kinetic energy has more significant correlations with PIOAM than both types of ENSO (especially the Central Pacific ENSO). When the positive (negative) PIOAM anomaly in autumn is stronger (weaker), the MJO kinetic energy over the MC region in winter is lower (higher). However, the MC–MJO convection in winter has no such close association with the PIOAM.
(3)
The positive and negative PIOAM have different influences on the propagation of the MC–MJO. During the positive phase of the PIOAM, the MJO kinetic energy in winter usually fails to move across the Maritime Continent and arrives into the western Pacific, while during the negative phase of the PIOAM, the MJO kinetic energy over the MC region can propagate to the equatorial western Pacific without significant reduction. In contrast, the preliminary statistical results reveal that the MJO convection during the positive PIOAM phase tends to move across the Maritime Continent and arrive in the equatorial western Pacific more easily than in the negative PIOAM phase, which is not consistent with the propagation of the MC–MJO kinetic energy.
During the positive (negative) phases of the PIOAM in winter, the possible causes for the suppressed (enhanced) MC–MJO activity can be attributed to two reasons. One is the anomalous SSTA pattern and the other is the easterly (westerly) anomaly over the MC region. During the positive (negative) phase of the PIOAM, both the positive (negative) IOD phase in the Indian Ocean and the strong El Niño (La Niña) in the Pacific favor the enhancement (reduction) of the MC–MJO activity in winter. Local low (high) SST over the MC region also inhibits (promotes) the development of the MJO activity. On the other hand, during the positive (negative) phase of the PIOAM, the easterly (westerly) anomaly may play a more important role in the reduction (enhancement) in the MJO kinetic energy.
Why does MJO kinetic energy in the negative phase of PIOAM move across the MC region more easily than in the positive phase? Is it relevant to the fact that MC–MJO kinetic energy is stronger in the negative phase of PIOAM than that in the positive phase? What is the mechanism of the convective effective passage rate of the MC–MJO during positive and negative phases of the PIOAM? Furthermore, why are the influences of PIOAM on the MC–MJO convection and MC–MJO kinetic energy inconsistent? All these questions will be discuss further in a future paper.

Author Contributions

Conceptualization, X.L. and X.C.; Methodology, X.C.; Software, M.Y. (Ming Yin); Validation, X.L., M.Y. and F.X.; Formal analysis, M.Y. (Ming Yin) and C.Z.; Investigation, X.L. and L.L.; Resources, X.L.; Data curation, P.Y. and G.C.; Writing—original draft preparation, X.L.; Writing—review and editing, X.L., Y.L. and M.Y. (Ming Yin); Visualization, X.L. and M.Y. (Minghao Yang); Supervision, X.C. and X.L.; Project administration, X.L.; Funding acquisition, X.C. and X.L. All authors have read and agreed to the published version of the manuscript.

Funding

National Natural Science Foundation of China: Nos. 41605051, 41520104008 and 41490642. Key Research Program of National University of Defense Technology: ZK17-02-010.

Acknowledgments

This work was supported by the National Natural Science Foundation of China (Grant Nos. 41605051, 41520104008, and 41490642) and the Key Research Program of National University of Defense Technology (ZK17-02-010).

Conflicts of Interest

The authors declare no conflict of interest.

References

  1. Chao, J.P.; Yuan, S.Y. Concerted development of atmosphere-ocean interaction events in the tropical Indian Ocean and Pacific Ocean. Adv. Mar. Sci. 2002, 22, 247–252. [Google Scholar]
  2. Li, C.Y.; Mu, M.Q.; Pan, J. Indian Ocean temperature dipole and SSTA in the equatorial Pacific Ocean. Chin. Sci. Bull. 2002, 47, 236–239. [Google Scholar] [CrossRef]
  3. Annamalai, H.; Xie, S.P.; Mccreary, J.P.; Murtugudde, R. Impact of Indian Ocean sea surface temperature on developing El Niño. J. Clim. 2005, 18, 302–319. [Google Scholar] [CrossRef]
  4. Cai, Y.; Li, H.; Zhang, R.H. A study on relationship between ENSO and tropical Indian Ocean temperature. Acta Meteorlogica Sin. 2008, 66, 120–124. [Google Scholar]
  5. Ju, J.; Chen, L.; Li, C. The preliminary research of Pacific-Indian Ocean sea surface temperature anomaly mode and the definition of its index. J. Trop. Meteorol. 2004, 20, 617–624. (In Chinese) [Google Scholar]
  6. Yang, H.; Li, C. Effect of the Tropical Pacific-Indian Ocean Temperature Anomaly Mode on the South Asia High. Chin. J. Atmos. Sci. 2005, 29, 99–110. (In Chinese) [Google Scholar]
  7. Wu, H.; Li, C. The preliminary research of equatorial Pcacific-Indian Ocean temperature anomaly mode and subsurface ocean temperature anomalies. Acta Oceanol. Sin. 2009, 31, 24–33. (In Chinese) [Google Scholar]
  8. Li, X.; Li, C.; Tan, Y.; Zhang, R.; Li, G. Tropical Pacific-Indian Ocean thermocline temperature associated anomaly mode and its evolvement. Chin. J. Geophys. 2013, 56, 3270–3284. [Google Scholar]
  9. Li, X.; Xia, F.; Chen, X.; Shu, X.; Yang, M.; Li, L.; Wang, D. The interannual cycle features of the tropical Pacific-Indian Ocean associated mode and its mechanisms. J. Coast. Res. 2020, 99, 364–372. [Google Scholar] [CrossRef]
  10. Li, X.; Li, C. The tropical Pacific-Indian Ocean associated mode simulated by LICOM2.0. Adv. Atmos. Sci. 2017, 34, 1426–1436. [Google Scholar] [CrossRef]
  11. Yang, M.; Li, X.; Shi, W.; Zhang, C.; Zhang, J. The Pacific-Indian Ocean associated mode in CMIP5 models. Ocean Sci. 2020, 16, 469–482. [Google Scholar] [CrossRef] [Green Version]
  12. Yang, H.; Jia, X.; Li, C. The tropical Pacific-Indian Ocean temperature anomaly mode and its effect. Chin. Sci. Bull. 2006, 51, 2878–2884. (In Chinese) [Google Scholar] [CrossRef]
  13. Li, C.; Li, X.; Yang, H.; Pan, J.; Li, G. Tropical Pacific-Indian Ocean associated mode and its climatic impacts. Chin. J. Atmos. Sci. 2018, 42, 505–523. (In Chinese) [Google Scholar]
  14. Madden, R.A.; Julian, P.R. Detection of a 40-50 day oscillation in the zonal wind in the tropical Pacific. J. Atmos. Sci. 1971, 28, 702–708. [Google Scholar] [CrossRef]
  15. Madden, R.A.; Julian, P.R. Description of global-scale circulation cells in the tropics with a 40–50 day period. J. Atmos. Sci. 1972, 29, 1109–1123. [Google Scholar] [CrossRef]
  16. Li, C.; Zhou, Y. Relationship between Intraseasonal Oscillation in the tropical atmosphere and ENSO. Acta Geophys. Sin. 1994, 37, 17–26. (In Chinese) [Google Scholar]
  17. Li, C.; Li, Z.; Zhang, Q. Strong/weak summer monsoon activity over the South China Sea and atmospheric intraseasonal oscillation. Adv. Atmos. Sci. 2001, 18, 1146–1160. [Google Scholar]
  18. Hall, J.D.; Matthews, A.J.; Haroly, D.J. The modulation of tropical cyclone activity in Australian region by the Madden-Julian Oscillation. Mon. Weather Rev. 2001, 129, 2970–2982. [Google Scholar] [CrossRef]
  19. Donald, A.; Meinke, H.; Power, B.; Maia, A.; Wheeler, M.C.; White, N.; Stone, R.C.; Ribbe, J. Near-global impact of the Madden-Julian Oscillation on rainfall. Geophys. Res. Lett. 2006, 33, L09704. [Google Scholar] [CrossRef] [Green Version]
  20. Zhang, L.N.; Wang, B.Z.; Zeng, C.Q. Impacts of the Madden–Julian oscillation on summer rainfall in Southeast China. J. Clim. 2009, 22, 201–216. [Google Scholar] [CrossRef]
  21. Bai, X.; Li, C.; Tan, Y.; Guan, Z.-J. The impacts of the MJO (Madden–Julian Oscillation) on spring rainfall in East China. J. Trop. Meteorol. 2011, 27, 814–822. (In Chinese) [Google Scholar]
  22. Lv, J.; Ju, J.; Ren, J.; Gan, W. The influence of the Madden-Julian oscillation activity anomalies on Yunnan’s extreme drought of 2009–2010. Sci. China Earth Sci. 2012, 55, 98–112. (In Chinese) [Google Scholar]
  23. Zhang, C. Madden–Julian Oscillation: Bridging weather and climate. Bull. Am. Meteorol. Soc. 2013, 94, 1849–1870. [Google Scholar] [CrossRef]
  24. Li, C.; Ling, J.; Song, J.; Pan, J.; Tian, H.; Chen, X. Research progress in China on the tropical atmospheric intraseasonal oscillation. J. Meteorol. Res. 2014, 28, 671–692. [Google Scholar] [CrossRef]
  25. Mo, K.C.; Jones, C.; Paegle, J.N. Pan America. Intraseasonal Variability of the Atmosphere-Ocean Climate System, 2nd ed.; Springer: Berlin/Heidelberg, Germany, 2012; 641p. [Google Scholar]
  26. Recalde-Coronel, G.C.; Zaitchik, B.; Pan, W.K. Madden-Julian oscillation influence on sub-seasonal rainfall variability on the west of South America. Clim. Dym. 2020, 54, 2167–2185. [Google Scholar] [CrossRef]
  27. Maloney, E.D.; Hartmann, D.L. Modulation of hurricane activity in the Gulf of Mexico by the Madden-Julian Oscillation. Science 2000, 287, 2002–2004. [Google Scholar] [CrossRef] [PubMed]
  28. Li, C.; Zhou, W. Modulation of western North Pacific tropical cyclone activities by the ISO. Part 1: Genesis and intensity. J. Clim. 2013, 26, 2904–2918. [Google Scholar] [CrossRef]
  29. Singh, M.; Bhatla, R. Modulation of active-break spell of Indian summer monsoon by Madden Julian Oscillation. J. Earth Syst. Sci. 2019, 128, 70. [Google Scholar] [CrossRef] [Green Version]
  30. Lau, K.M.; Chan, P.H. The 40–50 day oscillation and the El Niño/Southern Oscillation: A new perspective. Bull. Am. Meteorol. Soc. 1986, 67, 533–534. [Google Scholar] [CrossRef] [Green Version]
  31. Hendon, H.H.M.C.; Wheeler, C. Zhang: Seasonal dependence of the MJO–ENSO relationship. J. Clim. 2007, 20, 531–543. [Google Scholar] [CrossRef]
  32. Chen, X.; Li, C.; Tan, Y. The influence of El Niño on MJO over the equatorial pacific. J. Ocean. Univ. China 2015, 14, 1–8. [Google Scholar] [CrossRef]
  33. Hsu, H.H.; Weng, C.-H.; Wu, C.-H. Contrasting characteristics between the northward and eastward propagation of the intraseasonal oscillation during the boreal summer. J. Clim. 2004, 17, 727–743. [Google Scholar] [CrossRef]
  34. Li, C.; Smith, I. Numerical simulation of the tropical intraseasonal oscillation and the effect of warm SSTS. Acta Meteorol. Sin. 1995, 9, 1–12. [Google Scholar]
  35. Kessler, W.S. EOF representations of the Madden-Julian Oscillation and its connection with ENSO. J. Clim. 2001, 14, 3055–3061. [Google Scholar] [CrossRef] [Green Version]
  36. Tam, C.Y.; Lau, N.C. Modulation of the Madden--Julian Oscillation by ENSO: Inferences from observations and GCM simulations. J. Meteorol. Soc. Jpn. 2005, 83, 727–743. [Google Scholar] [CrossRef] [Green Version]
  37. Pohl, B.; Matthews, A.J. Observed changes in the lifetime and amplitude of the Madden-Julian Oscillation associated with interannual ENSO sea surface temperature anomalies. J. Clim. 2007, 20, 2659–2674. [Google Scholar] [CrossRef] [Green Version]
  38. Gushchina, D.; Dewitte, B. Intraseasonal tropical atmospheric variability associated with the two flavors of El Niño. Mon. Weather Rev. 2012, 140, 3669–3681. [Google Scholar] [CrossRef] [Green Version]
  39. Yuan, Y.; Li, C.; Ling, J. Different MJO activities between EP El Niño and CP El Niño. Sci. Sin. Terrae 2015, 45, 318–334. (In Chinese) [Google Scholar]
  40. Chen, X.; Ling, J.; Li, C. Evolution of the Madden–Julian Oscillation in two types of El Niño. J. Clim. 2016, 29, 1919–1934. [Google Scholar] [CrossRef]
  41. Pang, B.; Chen, Z.; Wen, Z.; Lu, R. Impacts of two types of El Niño on the MJO during boreal winter. Adv. Atmos. Sci. 2016, 33, 979–986. [Google Scholar] [CrossRef]
  42. Wilson, E.A.; Gordon, A.L.; Kim, D. Observations of the Madden Julian oscillation during indian ocean dipole events. J. Geophys. Res. Atmos. 2013, 118, 2588–2599. [Google Scholar] [CrossRef]
  43. Yuan, Y.; Yang, H.; Li, C. Possible influences of the tropical Indian Ocean dipole on the eastward propagation of MJO. J. Trop. Meteorol. 2014, 20, 173–180. [Google Scholar]
  44. Benedict, J.J.; Pritchard, M.S.; Collins, W.D. Sensitivity of MJO propagation to a robust positive Indian Ocean dipole event in the superparameterized CAM. J. Adv. Model. Earth Syst. 2015, 7, 1901–1917. [Google Scholar] [CrossRef]
  45. Seiki, A.; Nagura, M.; Hasegawa, T. Seasonal onset of the Madden–Julian oscillation and its relation to the southeastern Indian Ocean cooling. J. Meteorol. Soc. Jpn. 2015, 93, 139–156. [Google Scholar] [CrossRef] [Green Version]
  46. Dee, D.; Coauthors, P. The ERA-Interim reanalysis: Configuration and performance of the data assimilation system. Q. J. R. Meteorol. Soc. 2011, 137, 553–597. [Google Scholar] [CrossRef]
  47. Liebmann, B.; Smith, C.A. Description of a Complete (Interpolated) Outgoing Longwave Radiation Dataset. Bull. Am. Meteorol. Soc. 1996, 77, 1275–1277. [Google Scholar]
  48. Rayner, N.A.; Parker, D.E.; Horton, E.B.; Folland, C.K.; Alexander, L.V.; Rowell, D.P.; Kent, E.C.; Kaplan, A. Global analyses of sea surface temperature, sea ice, and night marine air temperature since the late nineteenth century. J. Geophys. Res. 2003, 108, 4407. [Google Scholar] [CrossRef]
  49. Duchon, C.E. Lanczos filtering in one and two dimensions. J. Appl. Meteorol. 1979, 18, 1016–1022. [Google Scholar] [CrossRef]
  50. Ren, H.L.; Jin, F.F. Niño indices for two types of ENSO. Geophys. Res. Lett. 2011, 38, L04704. [Google Scholar] [CrossRef]
  51. Jia, X. Numerical Simulation of the Intraseasonal Oscillation. Ph.D. Thesis, Graduate University of Chinese Academy of Sciences, Beijing, China, 2006. (In Chinese). [Google Scholar]
  52. Li, C. New progress in the study of atmospheric Intraseasonal Oscillation. Adv. Nat. Sci. 2004, 14, 15–22. [Google Scholar]
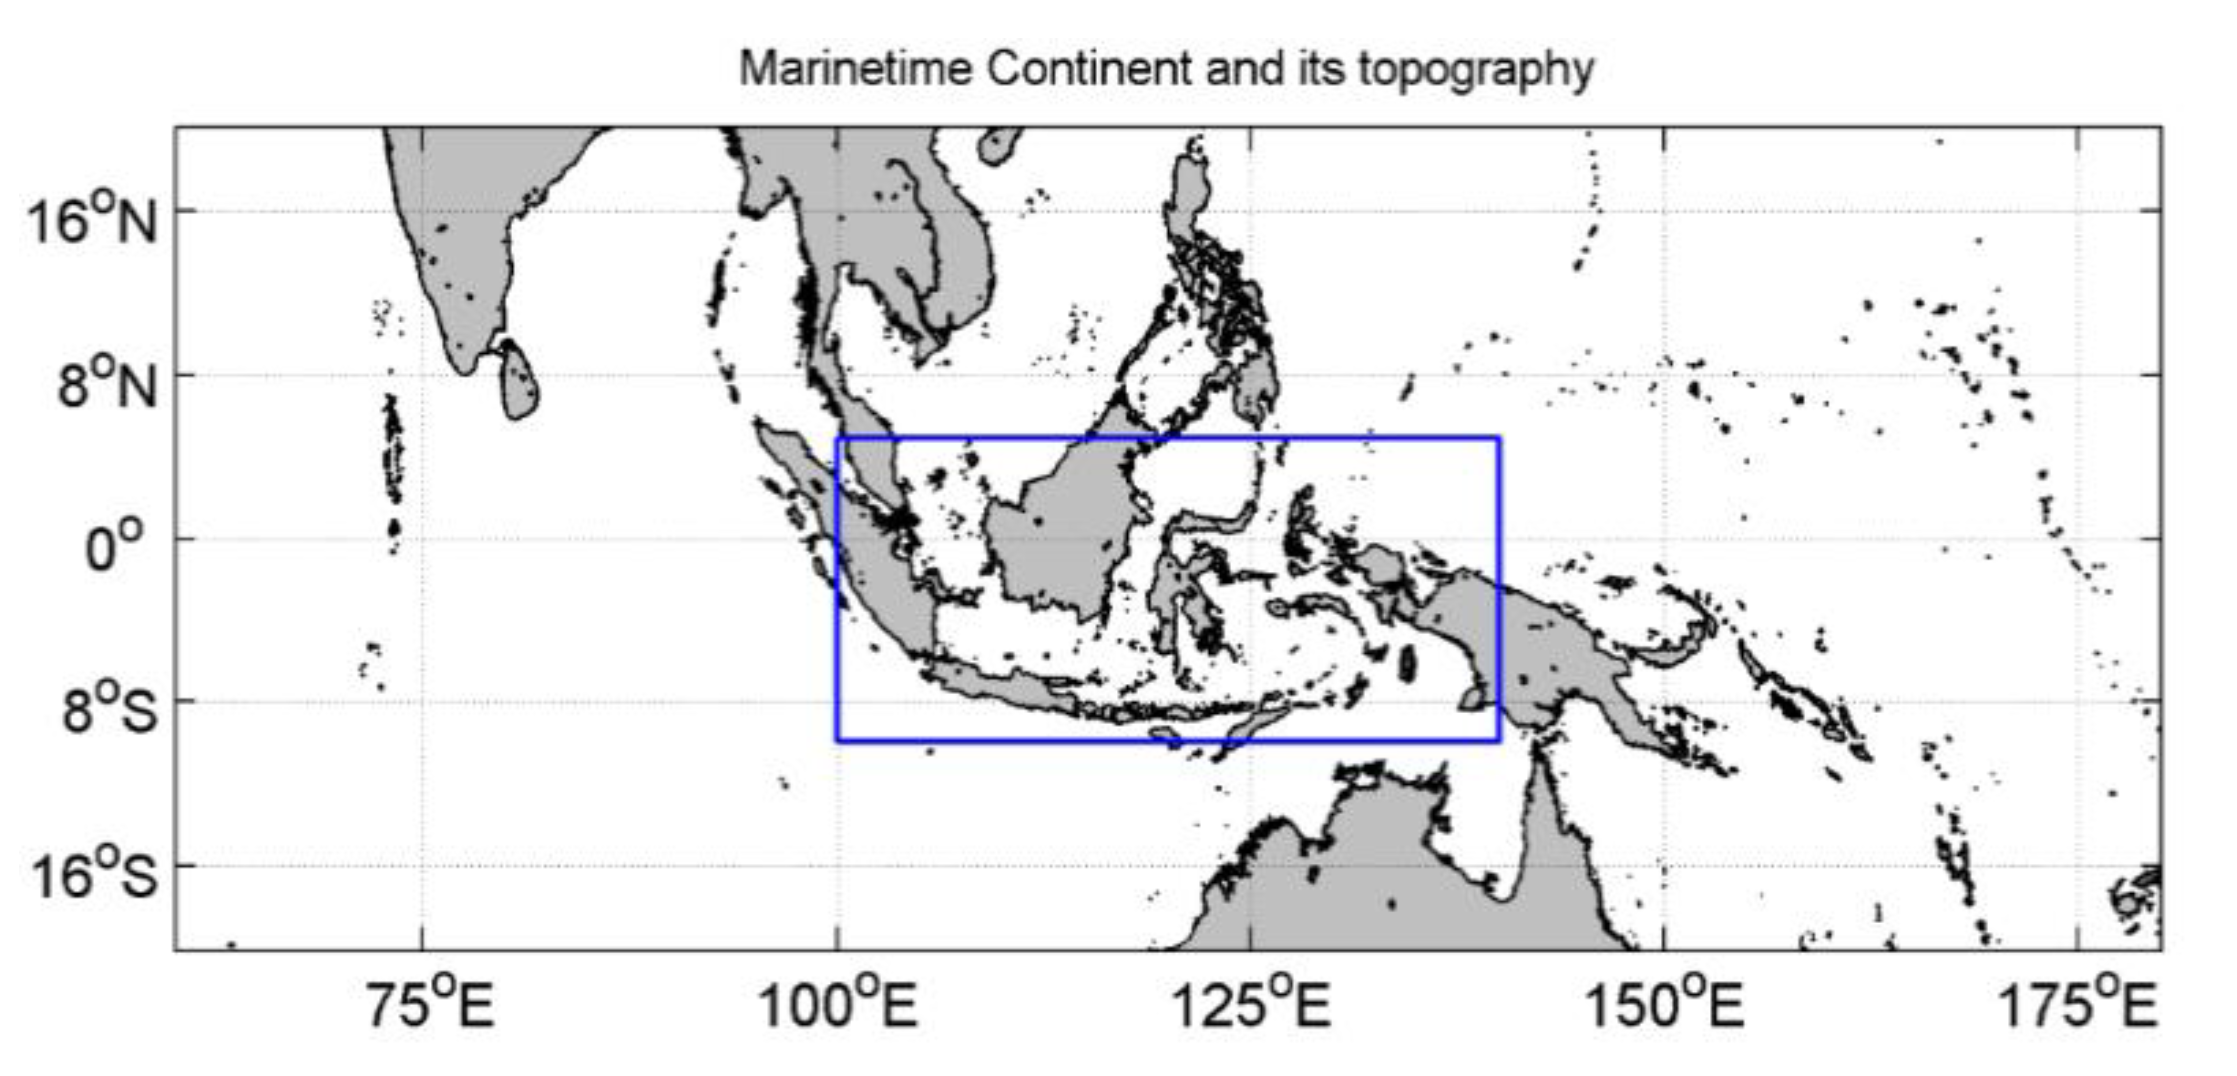
Figure 1. The terrain of the Maritime Continent (blue rectangle) and adjacent areas.
Atmosphere 11 01049 g001
Figure 2. Composite anomalous MJO zonal wind amplitude at 850 hPa (m·s−1) during the (a) positive and (b) negative phases of the PIOAM, and (c) their difference (positive minus negative). Results passing the significant test at the 90% confidence level are stippled.
Atmosphere 11 01049 g002
Figure 3. As in Figure 1, but for the anomalous MJO OLR amplitude (w·m−2). (a) positive phases, (b) negative phases, and (c) their difference.
Atmosphere 11 01049 g003
Figure 4. Yearly MC–MJO kinetic energy index in winter (bar). Results after nine point low pass filter are given in the red dashed line.
Atmosphere 11 01049 g004
Figure 5. Correlation coefficients of the winter MC–MJO index with the autumn (a) SAMI (surface PIOAM associated mode index), (b) CTI (Cold Tongue ENSO index), and (c) WPI (Warm Pool ENSO index).
Atmosphere 11 01049 g005
Figure 6. Composite distribution of SST anomalies (°C) in autumn during the (a) strong and (b) weak MC–MJO cases. Results passing the significance test at the 90% confidence level are stippled.
Atmosphere 11 01049 g006
Figure 7. Longitude-time diagram of the MJO zonal winds at 850 hPa averaged over the 10° S–10° N lag regressed onto that averaged over the 10° S–10° N, 70°–90° E during the (a) positive and (b) negative phases of PIOAM. Results passing the significance test at the 90% confidence level are stippled.
Atmosphere 11 01049 g007
Figure 8. Longitude-time diagram of the MJO OLR (w·m−2) averaged over the 10° S–10° N lag regressed onto that averaged over the 10° S–10° N, 70°–90° E during the (a) positive and (b) negative phases of PIOAM. Results passing the significance test at the 90% confidence level are stippled.
Atmosphere 11 01049 g008
Figure 9. Longitude-time diagram (colors, w·m−2) of the MJO OLR averaged over the 10° S–10° N during the (a) negative (1996) and (b) positive (1997) phases of PIOAM.
Atmosphere 11 01049 g009
Figure 10. MJO zonal vertical circulation (vectors, magnified 500 times in the vertical direction, colors represent zonal velocity) lag regressed onto the MC–MJO OLR index during the positive (left row) and negative (right row) phases of PIOAM, day 0 positive (a) and negative (b), day 4 positive (c) and negative (d), day 8 positive (e) and negative (f), and day 12 positive (g) and negative (h).
Atmosphere 11 01049 g010
Figure 11. Composite sea surface temperature anomalies (SSTA) (°C) in autumn during the (a) positive and (b) negative phases of PIOAM.
Atmosphere 11 01049 g011
Figure 12. Composite horizontal wind field at 850 hPa (m·s−1) in winter (November to February in the following year) during (a) positive and (b) negative phases of PIOAM.
Atmosphere 11 01049 g012