Abstract
Large meteoroids can be registered in infrasound recordings during their entry into the Earth’s atmosphere. A comprehensive study of 10 large fireball events of the years 2018 and 2019 highlights their detection and characterization using global infrasound arrays of the International Monitoring System (IMS) of the Comprehensive Nuclear-Test-Ban Treaty (CTBT). The study focuses on the observation and event analysis of the fireballs to estimate their respective location, yield, trajectory, and entry behavior. Signal characteristics are derived by applying the Progressive Multi-Channel Correlation method as an array technique. The comparison of the events with a NASA reference database as well as the application of atmospheric propagation modeling allows to draw conclusions about infrasound-based detection capability, localization accuracy, yield estimation, and source characterization. The infrasound technique provides a time- and location-independent remote monitoring opportunity of impacting near-Earth objects (NEOs), either independent or complementary to other fireball observation methods. Additionally, insights about the detection and localization capability of IMS infrasound stations can be gained from using large fireballs as reference events, being of importance for the continuous monitoring and verification of atmospheric explosions in a CTBT context.
1. Introduction
Infrasound, which is low-frequency sound below the threshold of human hearing (around 16–20 Hz), is generated by a large number of natural and anthropogenic phenomena [1,2]. While the monitoring and verification of man-made atmospheric explosions using infrasound array recordings is one of the main purposes of the infrasound observation technology [3,4,5], also the detection of natural explosions or shock waves, such as generated by large fireballs during meteoroid or asteroid entries into the Earth’s atmosphere, is a major topic of interest with respect to infrasound [6,7,8].
The infrasonic signatures of such fireball events are related either to the hypersonic trajectory of a meteoroid, resembling a line source that emits ablational waves, or to the explosive fragmentation of the near-Earth object (NEO) due to heat and friction, resembling a point source that emits a ballistic shock wave [9,10]. While there is a continuous entry of small meteoric material into the Earth’s middle and upper atmosphere (above around 70 km), only an exceptionally large NEO entering the atmosphere generates infrasound that can be recorded at the ground.
Studies in recent years include investigations of various large fireballs recorded with an infrasound network like the globally distributed infrasound arrays of the International Monitoring System (IMS) of the Comprehensive Nuclear-Test-Ban Treaty (CTBT) [11]. Six infrasound arrays observed the 2004 Antarctica, 2004 Indian Ocean, and 2006 Egypt bolides with 10–20 kilotons of trinitrotoluene (kt TNT) equivalent yield each [12]. About 20 infrasound arrays observed the 2009 Sulawesi and the 2010 North Pacific (super-)bolides with 30–50 kt yield each [13,14]. Finally, 32 signal arrivals from at least 20 infrasound arrays also along long orthodrome paths and after complete circumnavigations of the Earth were recorded for the 2013 Chelyabinsk superbolide with 500 kt yield [15,16]. Together with the 173 kt Bering Sea fireball of December 2018, investigated in this study, these infrasound studies cover the four largest fireball events of the last decades.
Large fireballs over populated areas can cause a lot of public attention. In the age of Social Media a huge amount of information is shared via various social media platforms as soon as an event happens. NEMO, the NEar real-time MOnitoring system for bright fireballs [17,18], is a project established to collect and combine information about such events in near real-time. For most fireball events it is possible to extract the date, time, and a rough location of an event from information shared only via Social Media. Using infrasound array data, it is furthermore possible to compute the yield and size of the entering object using the energy derived in the infrasound signals’ dominant period band [19].
Additional information about the object is usually available from other sources. One fast source is the American Meteor Society/International Meteor Organization (AMS/IMO) database for witness reports [20], which not only provides accurate information about the time and location of the event but also a trajectory of the fireball calculated from the reports [21]. If the fireball was recorded with local meteor or fireball networks, there is likely a lot of scientific information available about the event, such as the object’s velocity, trajectory, or even its orbit. Further details can also be obtained from space-based sources. Especially worthy of remark is the fireball database published by NASA’s Center for near-Earth object studies (CNEOS) at the Jet Propulsion Laboratory (JPL) of the California Institute of Technology which is based on events recorded by US government satellites [22], lightning detectors [23], and meteorological satellites [24]. Combining all available information about a fireball event makes it possible to maximize the knowledge about each event and validate the infrasound-derived findings.
This study aims at investigating meteoroid infrasound that is detected and located at multiple infrasound arrays in distances up to at least a few thousand kilometers. A total number of 10 recent fireball events during about one year (summer 2018 to summer 2019) is investigated within this study, directly following the Ozerki 2018 fireball [25]. The modeling of infrasound propagation and thus atmospheric attenuation along the propagation path from the source to the receivers allows to estimate the detection conditions, ducting behavior, and station performance when detecting or non-detecting an event. The estimation of the global detection capability of an infrasound network like the IMS strongly relies on reference events like large meteoroid shock waves.
Infrasound detection, localization, yield estimation and source characterization are investigated within this study as an either independent or complementary method to other fireball observations. Detailed analyses of selected fireball events are presented highlighting which parameters can be derived from infrasound observations, providing on the one hand reference events important for CTBT monitoring and verification of atmospheric explosions, and on the other hand a demonstration of usefulness of the infrasound technique for global fireball monitoring.
2. Data and Methods
Differential pressure data from infrasound arrays of the CTBT IMS with currently 51 certified stations all around the globe [11] were used to detect and analyze the 10 fireball events within this study. Since all IMS infrasound stations are arrays with at least four station elements each containing a microbarometer, array processing methods can be applied. Data and event analysis was performed using the Progressive Multi-Channel Correlation (PMCC) method [26]. It highlights event characteristics like origin time and direction, apparent velocity, and observed amplitude.
From the IMS infrasound array data the energy of the entering object that caused the fireball can be determined based on the dominant period of the observed infrasound signature [27,28]. Hence, the yield as a kt TNT equivalent and thus also the size and mass of the meteoroid, asteroid, or re-entering space debris can be estimated following the infrasound processing.
The cross-bearing approach adapted from [29] allowed locating the majority of the fireballs. The triangulation relies on the mean backazimuths of all PMCC detection pixels that are associated with an event. Here, different from the cited approach, no standard deviation was added to the backazimuths since the fireball events generally produce transient signals in the waveform data. The method is explicitly described in Figure 1, showing an event in the Caribbean in June 2019 (hereinafter referred to as case 02). For cases that are not detected by at least three stations, this method cannot be applied.
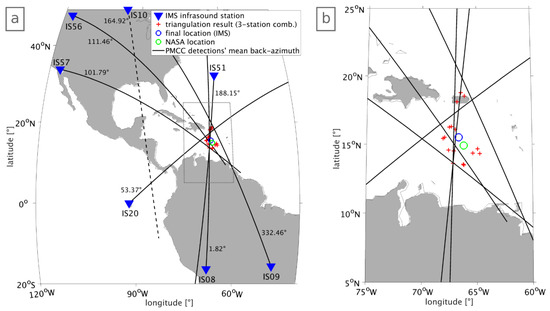
Figure 1.
(a) Overview of the triangulation method applied for the Caribbean fireball event in June 2019 and (b) map section around the determined location. For locating the fireballs using the International Monitoring System (IMS) infrasound network, the detected backazimuths are projected along the great-circle propagation path for three stations at a time. If three intersection points are found—i.e., all of these projections intersect—their geographical center is the triangulation result (red cross) of this three-station combination. This procedure is subsequently repeated for all conceivable combinations of three stations that detected the event. The actual location is calculated as the longitudinal and latitudinal mean (blue circle) of the single triangulation results. The location published by NASA’s Center for near-Earth object studies (CNEOS) [22] is denoted by a green circle. If a Progressive Multi-Channel Correlation (PMCC) backazimuth deviates from the latter by more than 10°—e.g., the dashed line of IS10 in (a)—it is disregarded for the localization if at least three other stations remain utilizable.
The propagation modeling of infrasound from the estimated source location to the IMS infrasound receivers that detected the respective event was performed using ray-tracing and parabolic equation (PE) methods. A two-dimensional finite-differences raytracer [30] as well as a two-dimensional PE method [31] were applied on the one hand to estimate the travel-time and celerity (propagation velocity over ground) and on the other hand to estimate the amplitude and attenuation along ducted propagation paths. The atmospheric variability was taken into account using range- and time-dependent ECMWF (European Centre for Medium-Range Weather Forecasts) [32] background profiles of the high-resolution operational model analysis for temperature and wind, merged above 70 km with climatological data (MSISE-00 [33], HWM-14 [34]).
An estimation of the global detectability of infrasound signatures by extraordinary strong fireball events was provided for the Bering Sea 2018 fireball within this study (hereinafter referred to as case 08). The method was applied in the same manner as for the Chelyabinsk 2013, Sulawesi 2009, and North Pacific 2010 cases [14,16] and compared to the detections at infrasound stations as listed in the Reviewed Event Bulletin (REB) of the International Data Center (IDC) of the CTBT. It highlights the combined effects of ducting, daytime, and directivity on the detection probability at all global IMS infrasound stations.
3. Results
3.1. Event Overview and Array Processing
This study is based on the analysis of 10 recent fireball events that occurred between summer 2018 and summer 2019. These events were selected and analyzed in the context of the NEMO project, since they were on the one hand highlighted by Social Media, eyewitness reports, or the international press and on the other hand detected by at least two IMS infrasound stations. This selection is also in good agreement with the fact that these events yielded the most energy during the period of observation, ranging from 30 to 173 kt of TNT equivalent for the exceptionally large Bering Sea fireball of December 2018. Figure 2 provides the location of these 10 events (Figure 2b: Bering Sea event no. 8, Figure 2a: the other nine cases) and the IMS infrasound stations that detected each of it. For four of the events, REB entries from the CTBT IDC were also available for comparison.
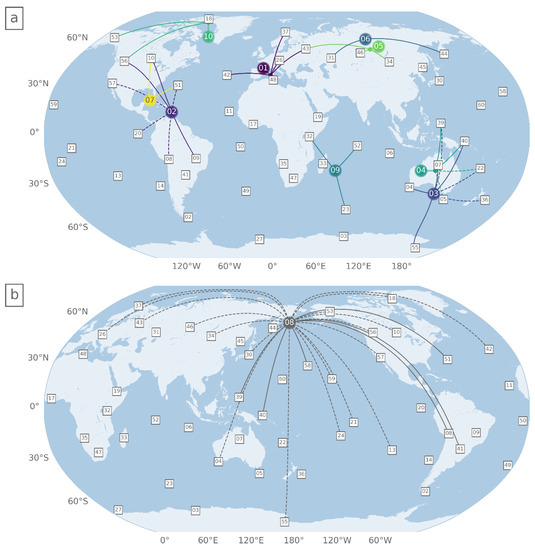
Figure 2.
Location of the 10 studied fireball events, numbered 01 to 10 in colored circles from the most recent to the oldest date. The positions of certified IMS infrasound stations are provided by numbered rectangles. Stations and fireball events are connected by event-colored lines if infrasound from an event was recorded at the respective station; the line is dashed, if the detection is also part of the Reviewed Event Bulletin (REB). Nine cases are shown in map (a), while the Bering Sea event with world-wide detections ranging to 15,000 km is shown in map (b).
A number of IMS stations were identified for each event that detected signatures related to the respective fireball. The PMCC method was applied to the IMS arrays’ differential pressure data to derive azimuth, apparent velocity, time, and frequency information and to associate the given signatures to the respective fireball. These parameters allow event localization and yield estimation purely based on infrasound data.
3.2. Localization Procedure and Yield Estimation
The localization results using the PMCC directions of infrasound detections are summarized in Table 1. In addition to the determined location, the absolute deviation from the location provided by CNEOS [22] is indicated. According to the description of the method using case 02 in Figure 1, the number of stations used for the localization can be lower than the number of detecting stations indicated in Figure 2 and Table 1. This also applies to fireballs no. 01 (IS43: deviation 18°), no. 03 (IS07: deviation 25°), and no. 04 (IS40: deviation 11°). In addition to the backazimuth criterion, the triangulations are conducted using a finite range of 60° (around 6660 km). This is particularly relevant for the extraordinary large event no. 08 (Figure 2b). For its localization, 13 of 25 detecting stations remain—IS39 is the most distant within this range. Two of these stations do not meet the backazimuth criterion (IS58: deviation 19°, IS46: deviation14°) and are thus excluded, too.

Table 1.
Localization and yield estimation for the 10 fireball events analyzed within this study using infrasound array recordings. Values in brackets quantify the deviation from the CNEOS database.
Note that for events that were detected by only three stations, these are used for the localization irrespectively of the back-azimuth criterion. However, it is noted here that the PMCC results for fireballs no. 09 and 10 partly disagree with the CNEOS location. For case 09, the backazimuth of IS32 deviates by 19° from the theoretical one; hence, the three-station triangulation results in a larger uncertainty (deviation of 8.21° to the north). Similarly, for case 10, the deviation of IS53 is around 16°, whereas IS18 shows different features which will be focused on in more detail in Section 3.3.1.
For estimating the yield, the infrasound data were analyzed for each station using PMCC and the signal related to the fireball was identified. The bandpass filter was then adapted to the frequency components in which this signal was found and used on the waveforms of all sensors with good data. These waveforms were stacked, and the resulting beam was extracted. From this beam, the period at maximum amplitude was determined using the zero crossings of the wave.
This period is in direct relation to the energy deposited into the atmosphere according to the Equations (1) and (2), see [27], where P is the period at maximum amplitude (in seconds) and E is the energy in kt TNT equivalent:
Based on [28] the mean value of the periods of all stations that recorded the fireball was computed and used for the energy estimation. The respective columns of Table 1 list the yield estimates derived from this approach, as well as the deviations from the CNEOS estimation (positive if higher and negative if lower).
3.3. Propagation and Characterization of Near-Field, Far-Field, and Global Range Observations
3.3.1. The Greenland Fireball: Short-Range Propagation and Source Mechanism Characterization
The Greenland fireball (case 10 of Table 1) occurred in close distance to an IMS infrasound array, here IS18 in Greenland, and is therefore a favorable object to study the near-field infrasound from a prominent fireball event. The short horizontal distance of about 65 km permits to study the different source effects that are visible and discernible in infrasound array recordings [35,36]. The close distance furthermore allows to utilize direct infrasound arrivals from the main pressure pulse of the fireball to estimate the source height of the event [8]. Finally, the three-dimensional trajectory can be estimated from the PMCC analysis of the fireball infrasound taking into account direction and apparent velocity from the line source signatures of the atmospheric entry and resulting shock waves [10].
Figure 3 provides the waveform beam of the differential pressure recordings of the eight elements of IS18 as well as the results from PMCC analysis with the time- and frequency-dependent pixel information for azimuths and apparent velocities. It also highlights the different portions of the main signal that are associated with the different source effects observable at an infrasound array.
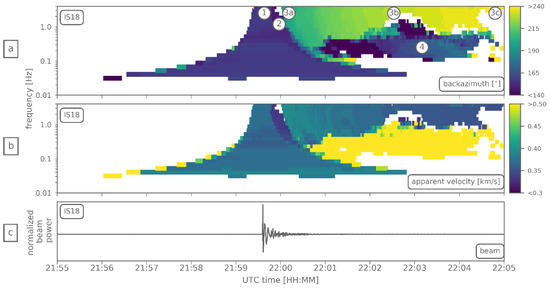
Figure 3.
PMCC results for 10 min around the main signal arrival from the Greenland fireball at infrasound array IS18. (a) Backazimuth information between 0.02 and 4 Hz in a 100° angular segment towards the fireball location and trajectory. Different source effects are marked by numbers 1–4 (corresponding to the numbered list in the text). (b) Apparent velocity information as observed between the array elements. (c) Beam towards the main signal, bandpass-filtered from 0.2 to 4 Hz.
The source effects, which are assigned to the signals in Figure 3 using the same labels, are
- Explosive fragmentation, resembling a point source and corresponding to the brightest observation and largest amplitude signal near the end of the visible/audible trajectory;
- Final descent (and potential meteorite impact) at the very end of the trajectory, observable by low apparent velocities and thus very shallow incident angles relative to the horizontal;
- Atmospheric entry, resembling a line source and observable by backazimuths changing with time due to the incoming signal from different points along the trajectory;
- Air-to-ground coupling, where acoustic energy from the previous effects is converted to seismic (surface) waves, observable by apparent velocities having seismic values.
The PMCC analysis provides the following values for backazimuth and apparent velocity, supporting the distinction in the four source processes: the point-source fragmentation (label 1) is observed from a nearly constant backazimuth of 157° and with an apparent velocity of 0.37 km/s. The final descent (label 2) is observed from a slightly more eastward backazimuth of 150° and with a lower apparent velocity of 0.335 km/s pointing at a much shallower incident angle and thus lower source height. The line-source trajectory is estimated at three points (labeled 3a, 3b, 3c) and is located westward of the fragmentation, arriving from backazimuths of 200° to 240°. The lowest, and thus the latest point of the trajectory is observed first (3a), since it is nearest to the station IS18. The time it takes the bolide to travel from the beginning to the end of the observed trajectory is negligible compared to the travel time of the infrasound signals since the bolide moves at supersonic speeds of about Mach 70 [22]. The apparent velocity descends from 0.4 km/s (at 3a) to 0.35 km/s at (3c), indicating a shallower angle due to the higher distances (which dominates over the higher steepness since coming from an earlier and higher altitude part of the trajectory). The air-to-ground coupling (label 4) is observed from directions of 120° to 170° (which is over land) and with seismic (surface) wave speeds of 0.7 to 2 km/s.
The source height of the main airburst (due to the explosive fragmentation near the end of the trajectory) can be estimated using the travel time between the origin time of the main explosion and the arrival time of the strongest infrasound signature at the observing array. For the origin time in this study, the CNEOS database entry was chosen (2018-07-25, 21:55:26 UTC); in principle any other related instrument observation (meteor camera, radar, seismometer, satellite image) or information derived from eyewitness reports, videos or Social Media entries can be used for a first estimate of the origin time. For the arrival time, the center of the PMCC family around the strongest amplitude signal was chosen (2018-07-25, 21:59:38 UTC), resulting in a source-to-receiver travel time of 252 s. This travel time was compared to ray-tracing calculations of the travel time between sources at different altitude levels and the station IS18. Calculations were performed for 0.5 km steps in altitudes between 30 and 60 km, as shown in Figure 4a. Curvature of acoustic rays in this case is negligible and a nearly direct and linear source-receiver connection results from the ray-tracing. The altitude level, at which the difference between modeling and detection is lowest, is derived after interpolation between the two points with lowest positive and lowest negative time deviation. It results in 45.2 km (label 1*), which is in good agreement with the value of 43.2 km published by CNEOS.
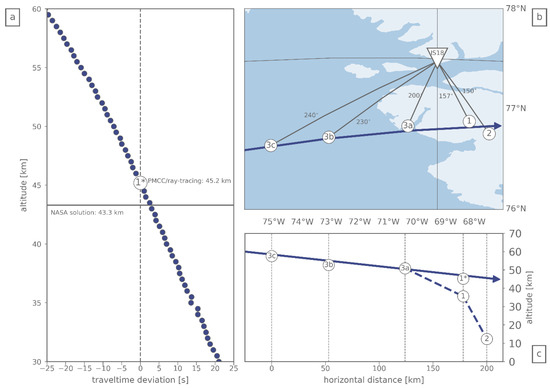
Figure 4.
Calculated results for the height and trajectory estimation from PMCC derived parameters and ray-tracing. (a) Height estimation using the PMCC main amplitude signal and acoustic ray-tracing to estimate the altitude where the time difference between observation and modeling is lowest (label 1*) (b) Top view of the ground-projected location of the trajectory (arrow) estimated from five selected points (labeled circles), also including backazimuth values towards infrasound array IS18 (triangle). (c) Side view on the trajectory (arrow) derived from three of the selected points (3a to 3c) and the ray-tracing derived height estimation (1*). The dashed line represents the other two selected points (1 and 2), indicating a fast descent at the end of the trajectory.
Taking all the PMCC-derived backazimuths, apparent velocities and arrival times into account for a set of five different points (labels 1, 2, and 3a to 3c for those parts of the signal from the air), it is possible to estimate the complete audible part of the trajectory from the infrasound recordings at IS18. The differences of the arrival times and the origin time (see above) are therefore converted to total distances; the apparent velocities are converted to incident angles, triangulating them with an effective sound speed of 0.32 km/s (derived as the 0–50 km average from ECMWF [32]); the incident angles and total distances are finally converted to altitudes and distances over ground to the five selected points. Figure 4b presents a top view, Figure 4c a side view of the resulting trajectory. The approximate three-dimensional position of the acoustically defined part of the line-source trajectory is nearly perpendicular to IS18, having an azimuth angle of about 77.6° from the north and a very shallow elevation angle of approximately 3.1° from the horizontal.
3.3.2. The Great Australian Bight Fireball: Medium-Range Propagation and Multidirectional Detection
The Great Australian Bight fireball (case 03 of Table 1) represent an excellent example to study infrasound propagation of an elevated atmospheric source to IMS infrasound stations in distances of 2000 to 5000 km. It is a favorable use case for propagation modeling, as performed here by applying the range-dependent PE method, since multidirectional detections were made at IMS stations in all four cardinal directions.
Signatures of the fireball occurring near Tasmania were detectable to the west at IS04 in Australia, to the north up to IS39 in Palau, to the east up to IS36 in New Zealand, and to the south at IS55 in Antarctica. The predominant zonal stratospheric wind and thus ducting direction for a source during Austral winter conditions is eastward, which corresponds with the clearest observations at stations in this direction. Nevertheless, due the elevated source characteristic of a meteoroid airburst (here occurring at 31.5 km altitude [22]), propagation within mostly elevated ducts into the other directions is modeled and detections in the vicinity of elevated ducts can be expected for sources that are strong enough. Detections from a fireball event are therefore likely, also in the other directions, if the bottom level of the elevated duct is low enough or leaky towards the surface.
Figure 5 provides the PE propagation modeling for four directions/stations, indicating the described favorable ducting conditions to the east and elevated ducts to the other directions. An average PE frequency of 1 Hz was applied to all propagation runs and the transmission loss due to geometric spreading, atmospheric attenuation, and ducting effects was range-dependently calculated.
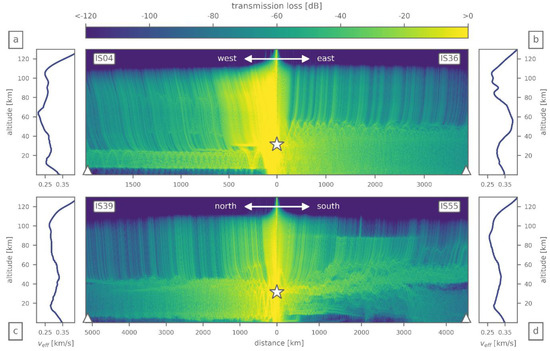
Figure 5.
Propagation modeling using range-dependent parabolic equation (PE) from the Great Australian Bight fireball at 31.5 km altitude (star) towards stations (triangles) in the four different cardinal directions, namely (a) IS04 to the west, (b) IS36 to the east, (c) IS39 to the north, and (d) IS55 to the south. Color-coded is the transmission loss in dB relative to 1 km reference distance. Different source-to-station distances on the x-axes have to be noted. Average effective sound speed profiles (combining temperature and wind along the propagation path) are provided for each station.
The eastward propagation towards IS36 is subject to a stable stratospheric duct with effective sound speed ratios above one between the upper stratosphere (around 60 km) and the ground. The propagation towards IS04 in western and towards IS39 in northern direction takes the shape of elevated ducts between approximately 5 to 10 km at the lower boundary and 25 to 40 km at the upper boundary. The southward propagation towards IS55 is affected by changing atmospheric background conditions that support an elevated duct up to higher altitudes for the first part of the propagation path, which is shifted down and leaky towards the surface for the second part of the way.
It can be observed from the PE quantification of transmission loss that most of the acoustic energy is trapped in the abovementioned ducts, whereas the rest is escaping to altitudes of 100 km and above and subsequently attenuated in the thermosphere. Just the reduction by geometric spreading over thousands of kilometers can be noted.
3.3.3. The Bering Sea Fireball: Long-Range Propagation and Global Detectability Estimation
The Bering Sea fireball (case 08 of Table 1) is a quite unique example for infrasound generation of an asteroid entering the Earth’s atmosphere since it was an exceptionally strong event (the second largest after the Chelyabinsk fireball within the last 20 and more years). Consequently, strong infrasound signatures at low dominant periods were generated that propagated over very large distances all around the world. This event is thus theoretically detectable at each of the existing IMS infrasound stations, and a study similar to [14,16] can be conducted to estimate which factors influence the global detectability.
A combination of three potential influence factors on the infrasound signal detectability of the Bering Sea fireball is provided in Figure 6. These influences are (1) the ducting behavior of the acoustic waves travelling from the source to any of the globally distributed receivers along a direct propagation path (called short orthodrome Ig1 here); (2) the daytime, during which the signal arrival at the infrasound array takes place; (3) the directivity of the station towards the source, representing a line source emitting most of the energy perpendicular to its trajectory. Ideal conditions correspond to quiet nighttime conditions, a 90° perpendicular direction towards the line source trajectory, and the availability of a stratospheric ducting with high effective sound speed ratio.
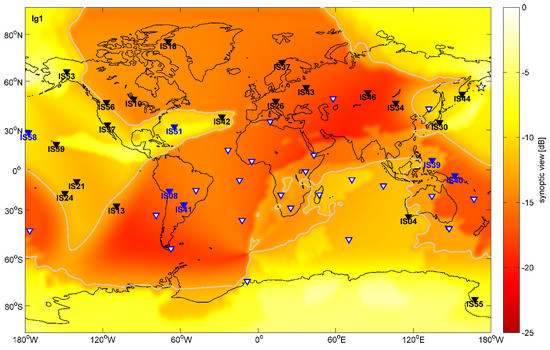
Figure 6.
Synoptic view of the detection capability (including ducting, daytime, and directivity influences) for the Bering Sea fireball (white star) at all global stations up to 20,000 km distance (along short orthodrome Ig1). Color values are provided in dB (intensity reduction), respective to 0 dB for nighttime noise levels, perpendicular directions, and stratospheric ducting with high effective sound speed ratio. A contour line shows the mean value at −12.7 dB, distinguishing regions above and below this average. Higher (brighter) values indicate increased detection probabilities for these conditions compared to lower (darker) values otherwise. Stations that performed detections are shown with black or blue triangles and labels (when also identified in the REB or not, respectively), while stations performing no detections are indicated by white triangles.
Nighttime conditions are preferential compared to daytime conditions, since the atmospheric boundary layer provides stable conditions during nighttime compared to more turbulent conditions during daytime (see [16] and references therein for further details). The trajectory of the Bering Sea fireball was estimated to have an elevation angle of 68.6° and an azimuth angle of 349.4°, derived from [37]. The ideal propagation conditions correspond to the existence of a stratospheric duct with effective sound speed ratio > 1.15, as specified in [38].
Combining the three influence parameters by quantifying the effect of the deviation from ideal conditions in relative dB units (see [16] for details), enables to estimate the expected detectability in a synoptic view. Values above the average (−12.7 dB, indicated by the contour line in Figure 6) indicate favorable detection conditions, values below the line unfavorable ones.
4. Discussion
The 10 selected fireball events analyzed within this study (Section 3.1) enable to derive novel insights about meteor source processes and infrasound detection capabilities; they furthermore allow to test and validate the application of methods and modeling to compare infrasound observations with theoretical calculations and other data sources.
The localization results (Section 3.2) provided in Table 1 show only slight deviations of around or below 1° (approx. 100 km) from the CNEOS location in five of eight cases. Except case 05, these were detected by more than three stations. Both the number of detecting stations and their location relative to the source determine the localization accuracy. An increased number allows identifying outliers in the determined backazimuths better than a single three-station combination of which the backazimuths do not match well (e.g., case 09). Moreover, the triangulation method is less prone to backazimuth uncertainties the more stations are located in various directions of the source (e.g., case 02—Figure 1). Station combinations projected in roughly the same direction (e.g., case 01, in particular IS26, IS37, and IS43—see Figure 2) transfer their uncertainties to the final localization, resulting in deviations of more than 5° (>500 km) here. Obviously, the just three stations associated with event no. 05 detected this very accurately.
Overall, the obtained deviations imply relatively good localizations. Two major factors potentially cause uncertainties in the detected backazimuths. First, due to their location relative to the source trajectory, the stations might detect different stages of the fireballs (e.g., case 10). In general, however, it is assumed that the fragmentation causes the strongest signal. Second, the atmospheric conditions encountered by the acoustic waves—and crosswinds in particular—can introduce shifts in the detected backazimuths [5]. A combination of both the relative locations and propagation effects is likely the cause for the significant deviation of fireball no. 10. The coordinates determined by triangulating IS18, IS53, and IS56 directions are more than 800 km south of the theoretical location and also differ from the result shown in Figure 4. As stated in Section 3.1, the backazimuth of IS56 is shifted by 16° from the theoretical one. Is has not been disregarded due to the lack of other available stations for triangulation. This also applies to case 09 and IS32 (19°).
The remaining question is whether infrasound data of the IMS can be used to locate fireball events accurately if no theoretical location is defined, as the CNEOS location is used here to disregard outliers in PMCC backazimuths. In fact, this depends on the number of detecting stations and thus on the size of the fireball and the propagation conditions. In addition, further PMCC parameters—for instance, the family size as an indicator for the significance of an event—can be considered to rate the quality of the detected backazimuths, combined with an evaluation of the horizontal winds along the propagation path. Single stations could be iteratively identified as outliers if the majority of stations match a specific source region.
It has to be mentioned that there is no detailed information available on NASA’s CNEOS data, neither on the detection method or calibration nor on the accuracy and completeness of the data.
Comparing the energy values listed in Table 1 (this work) with the ones published in the fireball database from the CNEOS the differences in the two databases are quite apparent. For some smaller fireballs the values agree relatively well, like for cases 01 and 03, with about 11% to 13% deviation, respectively. The largest difference is clearly visible for the high-energy Bering Sea event (case 8), with 173 kt TNT published by CNEOS and about 50 kt TNT derived from the infrasound data. However, in percentage of deviation the results for case 07 and 09 differ even more with 1.4 and 1.9 kt TNT found by CNEOS and 0.02 and 0.1 kt TNT found with infrasound, respectively. Additionally, for cases 02, 04, and 10 the infrasound-based values are much smaller. Only for the two fireballs that occurred in Siberia (cases 05 and 06) the yield values derived from the IMS data are larger than the ones in the CNEOS database. The mean deviation of the yield estimation for all cases is about 62%.
The energy estimation based on infrasound data has different sources of uncertainties ranging from the data analysis process itself to environmental factors. The method is related to infrasound propagation and attenuation modeling. The measurement of amplitude is or can be affected by weather conditions, wind directions, and additional effects. It even differs from station to station depending on local turbulence [16]. Furthermore, station noise and the SNR have to be taken into consideration when thinking about the uncertainty of infrasound measurements. The yield estimation using Equations (1) and (2) is a quite simple approximation not taking into account these factors; therefore, it is easy to implement and independent of range-dependent effects and calibrated amplitudes, which are both often difficult to quantify. A more sophisticated approach deriving observed amplitudes and backtracking them with respect to atmospheric attenuation processes could be a better estimation of source amplitudes and thus source yields, but it may also be prone to propagation and attenuation uncertainties and thus even more erroneous.
The estimation of source processes, source altitude, trajectory location, propagation behavior, and detectability (Section 3.3) can be performed using a combination of PMCC analysis results and propagation modeling. It was performed within this study by investigating in detail three examples (cases 10, 03, and 08 of Table 1) and highlighting the abovementioned aspects.
For the Greenland fireball (Section 3.3.1, case 10), a total of four different source processes can be identified in the PMCC recording of the nearby infrasound array IS18. The event and its entry into the atmosphere, resembling a line-source signal emission, is geometrically ideally suited to be recorded at IS18 since the trajectory is nearly perpendicular to the station, like e.g., for the Neuschwanstein bolide [39]. Nevertheless, in contrast to this case and e.g., the Tahiti bolide similarly recorded at a nearby infrasound station [40], not only a clear descent of apparent velocity and sweep of backazimuth is observed (indicating a decrease of incident angle with increasing distance), but a number of additional source processes as well. A point-source airburst due to explosive fragmentation is observed near the end of the line source, as well as a signature following this airburst in time and direction along the trajectory with a decreased altitude. This indicates the descent of the source at the end of its trajectory. Furthermore, air-to-ground coupling is observed where the acoustic energy originating from the fireball shockwaves is converted to seismic waves over Greenland’s land mass, which propagate to IS18 and are recorded with apparent velocities of seismic (surface) waves.
The airburst altitude is estimated by the travel time difference of origin time and signal arrival of the largest amplitude recording. It has to be noted that the travel time is the most robust estimator for the altitude of the airburst as the main amplitude signal [8]. Other estimators, as e.g., the apparent velocity, provide higher uncertainties since small variations of apparent velocity, especially near the background effective sound speed values, lead to large uncertainties in the incident angle of incoming waves and thus distances and altitudes derived from it.
For the estimation of the three-dimensional location of the complete trajectory, it is nevertheless necessary to use the apparent velocity information together with the backazimuths, both derived from PMCC. The uncertainties of the values quantified by selecting and averaging PMCC pixel information are transmitted to the resulting locations. Since the whole observable trajectory occurs below distances of 200 km, we estimate the investigations to be signatures propagated from direct arrivals and not reflected ones (via a stratospheric duct).
The Great Australian Bight fireball (Section 3.3.2, case 3) is a good example for studying the propagation and detectability of a case interesting and relevant for CTBT purposes. Since the bolide has an estimated explosive yield of about 1.5 kt TNT equivalent, it is above the detection goal of the IMS infrasound network, which is supposed to monitor all atmospheric explosions above 1 kt TNT. Since currently (and also during the case 03 event) 85% of the stations are certified and operational, an atmospheric explosion like the one described should be detected by multiple infrasound stations. The modeling of atmospheric backgrounds and infrasound propagation can support the estimation, which stations are in a favorable position and distance to monitor a given event.
In the case of an elevated source, the detection in nearly all directions is in principle possible, as presented in Section 3.3.2. Modeling and observations are in good agreement, allowing to identify the favorable direction for clearest detections due to a stable stratospheric duct (here: to the east towards IS05 and IS36). In this case, the modeling furthermore predicts elevated ducts in all other directions, of which the lower boundaries are quite near to the surface and/or are leaky towards it. This indicates potential detections at stations in all cardinal directions (which were confirmed for six further infrasound arrays). The phenomenon of elevated ducts is especially relevant and present for elevated sources, as of course all the meteoroids presented within this study entering the atmosphere and explosively bursting between 20 and 50 km altitude. Elevated ducts are also relevant for the CTBT IMS, monitoring explosions at potentially every atmospheric altitude from the ground to the thermosphere. Part of the energy of any explosive source can always propagate in classical ground-reaching or elevated ducts, depending on the atmospheric conditions.
The Bering Sea fireball (Section 3.3.3, case 08) was estimated to be the second-largest meteoroid event recorded since the initiation of the IMS infrasound network in 1999 (50 kt estimated from this study, 173 kt estimated from NASA CNEOS). It is therefore large enough to be theoretically detectable at any infrasound array around the globe. It was detected by 19 of the 49 certified IMS infrasound stations (status: December 2018) in distances of up to 15,000 km, as reported in the IDC’s corresponding REB entry, and by a total of 25 stations in this study.
Following the detectability estimations provided in Section 3.3.3, the event is expected to be best observed at nearby stations in the Pacific Ocean and along the eastern coast of Asia as well as the western coast of North America. This is in good agreement with the observations in Japan, Eastern Russia, Canada, USA, and at various island stations in the Pacific. From the modeling, the event is furthermore expected to be favorably detectable in the Caribbean Sea and mid-Atlantic up to the Azores, in the southern Indian Ocean, Western Australia, and in Antarctica. This is in a fairly good agreement with detections at IS51 on Bermuda and IS42 on the Azores, IS04 in Australia and IS55 in Antarctica. Nevertheless, other stations in the Indian Ocean did not detect the event, which is probably related to the individual noise conditions at these island stations. Detection probabilities are below the average in South America, Africa, Europe, Greenland, and western/southern Asia. However, individual stations in these parts of the world registered the event, namely IS18, IS26, IS34, IS37, IS43, IS46, (all within the REB), and IS08, IS39, IS40, IS41 (not in the REB). This is most likely related to the individual quality of the stations together with small signal attenuation even in unfavorable directions.
The predominant direction for stratospheric ducting (here: to the east on the northern hemisphere) seems less important for very strong events, as already observed for infrasound from the Chelyabinsk bolide [15]. Such strong events have a very low dominant frequency, corresponding to low atmospheric attenuation along propagation paths of even many thousands of kilometers [41]. Furthermore, for strong events like the fireballs of this study, it is possible that the ducted propagation takes place in both directions, upstream and downstream the predominant stratospheric wind. It may take the shape of elevated ducting, when propagating against the dominant wind direction (as shown for IS04 in Section 3.3.2). Nevertheless, signals from elevated ducting of e.g., 10 or 20 km height above the ground may be detectable at ground-based infrasound arrays, because the low dominant frequency resembles high wavelengths also in the order of 10 to 20 km. Raytracing is in this case only a high-frequency approximation for a wave front phenomenon filling the complete stratosphere, troposphere, and reaching down to the surface as well. Therefore, most of the detections and non-detections estimated by the combined modeling of source characteristics, propagation behavior, and station conditions (as shown in a synoptic view in Figure 6) explain the observations made at the global IMS infrasound array network well.
When estimating the usefulness of IMS infrasound data for the detection, localization, and characterization of near-Earth objects [42], it has to be taken into account that infrasound observations are available on a 24 h per day and 7 days per week basis, independent of weather conditions, cloud coverage, satellite overpasses, and eyewitnesses. Infrasound is therefore a technique to analyze fireball events that is constantly available and relatively independent from the fireball location on Earth. Although the accuracy of certain other techniques might be more precise to derive, e.g., location and yield, they are not necessarily available anywhere and all the time. Various characteristics of a fireball event, such as location, fragmentation height, explosive yield, three-dimensional trajectory, shock wave emission, and propagation can therefore be derived using infrasound data, solely or complementing other observations, as presented within this study.
5. Conclusions
This work provides infrasound-based detection and array analysis, localization, and yield calculation, height and trajectory estimation as well as propagation and detectability modeling for 10 selected fireball events that occurred between summer 2018 and summer 2019.
The identification of the fireball signatures in recordings of multiple stations of the IMS infrasound network and successive array processing allows to estimate source location and yield within this study, purely from the infrasound observations of stations in distances of thousands of kilometers and up to a location accuracy of 100 km for the majority of the cases and a yield estimation deviating in average about 62% of values published by NASA.
A fireball case study furthermore shows the characterization of four different meteoroid-related source processes all observed at one nearby infrasound array. The estimation of the bolide trajectory is derived from data of the same array. Another case study highlights the propagation and detection of fireball signatures at distances of thousands of kilometers in all four cardinal directions. A final case study quantifies the global infrasound detection capability for an exceptionally large fireball event.
Infrasound data are estimated to provide useful information about fireball events and source characteristics and are therefore a valuable addition for applications in the context of monitoring the impact of near-Earth objects.
Author Contributions
Conceptualization, C.P. and P.G.; methodology, P.H., C.P., E.D. and T.O.; software, P.G., T.O. and E.D.; formal analysis, P.H., C.P., E.D. and T.O.; investigation, C.P. and P.G.; writing—original draft preparation, C.P. and P.H.; writing—review and editing, P.G., P.H., T.O. and E.D.; visualization, P.G., P.H. and C.P. All authors have read and agreed to the published version of the manuscript.
Funding
This research received no external funding.
Acknowledgments
Access to the IMS network’s data such as differential pressure recordings of the infrasound stations is available to National Data Centers of the CTBTO and can be made available to others on request at https://www.ctbto.org/specials/vdec (accessed on 13 December 2019). The operational high-resolution atmospheric model analysis, defined by the Integrated Forecast System of the ECMWF, are available at https://www.ecmwf.int/en/forecasts/datasets (accessed on 13 December 2019). Two of the co-authors (T.O. and E.D.) are part of the NEMO project, which is funded by the European Space Agency and the University of Oldenburg.
Conflicts of Interest
The authors declare no conflict of interest.
References
- Le Pichon, A.; Blanc, E.; Hauchecorne, A. Infrasound Monitoring for Atmospheric Studies; Springer: Heidelberg, Germany, 2010. [Google Scholar]
- Le Pichon, A.; Blanc, E.; Hauchecorne, A. Infrasound for Atmospheric Studies—Challenges in Middle Atmosphere Dynamics and Societal Benefits; Springer: Heidelberg, Germany, 2019. [Google Scholar]
- Ceranna, L.; Le Pichon, A.; Green, D.N.; Mialle, P. The Buncefield explosion: A benchmark for infrasound analysis across Central Europe. Geophys. J. Int. 2009, 177, 491–508. [Google Scholar] [CrossRef]
- Green, D.N.; Vergoz, J.; Gibson, R.; Le Pichon, A.; Ceranna, L. Infrasound radiated by the Gerdec and Chelopechene explosions: Propagation along unexpected paths. Geophys. J. Int. 2011, 185, 890–910. [Google Scholar] [CrossRef]
- Blixt, E.M.; Näsholm, S.P.; Gibbons, S.J.; Evers, L.G.; Charlton-Perez, A.J.; Orsolini, Y.J.; Kværna, T. Estimating tropospheric and stratospheric winds using infrasound from explosions. J. Acoust. Soc. Am. 2019, 146, 973–982. [Google Scholar] [CrossRef]
- Brown, P.G.; Whitaker, R.W.; ReVelle, D.O.; Tagliaferri, E. Multi-station infrasonic observations of two large bolides: Signal interpretation and implications for monitoring of atmospheric explosions. Geophys. Res. Lett. 2002, 29, 14-1–14-4. [Google Scholar] [CrossRef]
- Brown, P.G.; Edwards, W.N.; ReVelle, D.O.; Spurny, P. Acoustic analysis of shock production by very high-altitude meteors-I: Infrasonic observations, dynamics and luminosity. J. Atmos. Sol.-Terr. Phys. 2007, 69, 600–620. [Google Scholar] [CrossRef]
- Silber, E.A.; Brown, P.G. Optical observations of meteors generating infrasound-I: Acoustic signal identification and phenomenology. J. Atmos. Sol.-Terr. Phys. 2014, 119, 116–128. [Google Scholar] [CrossRef]
- Ens, T.A.; Brown, P.G.; Edwards, W.N.; Silber, E.A. Infrasound production by bolides: A global statistical study. J. Atmos. Sol.-Terr. Phys. 2012, 80, 208–229. [Google Scholar] [CrossRef]
- Silber, E.A.; Boslough, M.; Hocking, W.K.; Gritsevich, M.; Whitaker, R.W. Physics of meteor generated shock waves in the Earth’s atmosphere—A review. Adv. Space Res. 2018, 62, 489–532. [Google Scholar] [CrossRef]
- CTBTO/IMS (Comprehensive Nuclear-Test-Ban Treaty Organization). Available online: https://www.ctbto.org/verification-regime/ (accessed on 5 December 2019).
- Arrowsmith, S.J.; ReVelle, D.O.; Edwards, W.; Brown, P. Global detection of infrasonic signals from three large bolides. Earth Moon Planet 2008, 102, 357–363. [Google Scholar] [CrossRef]
- Silber, E.A.; Le Pichon, A.; Brown, P.G. Infrasonic detection of a near-Earth object impact over Indonesia on 8 October 2009. Geophys. Res. Lett. 2011, 38, L12201. [Google Scholar] [CrossRef]
- Pilger, C.; Ceranna, L.; Le Pichon, A.; Brown, P.G. Large meteoroids as global infrasound reference events. In Infrasound for Atmospheric Studies—Challenges in Middle Atmosphere Dynamics and Societal Benefits; Le Pichon, A., Blanc, E., Hauchecorne, A., Eds.; Springer: Heidelberg, Germany, 2019; pp. 451–470. [Google Scholar]
- Le Pichon, A.; Ceranna, L.; Pilger, C.; Mialle, P.; Brown, D.; Herry, P.; Brachet, N. The 2013 Russian fireball largest ever detected by CTBTO infrasound sensors. Geophys. Res. Lett. 2013, 40, 3732–3737. [Google Scholar] [CrossRef]
- Pilger, C.; Ceranna, L.; Ross, J.O.; Le Pichon, A.; Mialle, P.; Garcés, M. CTBT infrasound network performance to detect the 2013 Russian fireball event. Geophys. Res. Lett. 2015, 42, 2523–2531. [Google Scholar] [CrossRef]
- Drolshagen, E.; Ott, T.; Koschny, D.; Drolshagen, G.; Poppe, B. NEMO—Near Real-Time Monitoring System. In Proceedings of the International Meteor Conference, Petnica, Serbia, 21–24 September 2017; pp. 38–41. [Google Scholar]
- Drolshagen, E.; Ott, T.; Koschny, D.; Drolshagen, G.; Mialle, P.; Pilger, C.; Vaubaillon, J.; Poppe, B. NEMO—A Global Near Real-time Fireball Monitoring System. In Proceedings of the 1st NEO and Debris Detection Conference, Darmstadt, Germany, 22–24 January 2019. [Google Scholar]
- Edwards, W.N.; Brown, P.G.; ReVelle, D.O. Estimates of meteoroid kinetic energies from observations of infrasonic airwaves. J. Atmos. Sol.-Terr. Phys. 2006, 68, 1136–1160. [Google Scholar] [CrossRef]
- AMS/IMO (American Meteor Society). Available online: https://www.amsmeteors.org (accessed on 19 November 2019).
- Hankey, M.; Perlerin, V. IMO Fireball Reports. In Proceedings of the International Meteor Conference, Giron, France, 18–21 September 2014; pp. 160–161. [Google Scholar]
- CNEOS/JPL, (Center for Near Earth Object Studies). Available online: https://cneos.jpl.nasa.gov/fireballs/ (accessed on 19 November 2019).
- Jenniskens, P.; Albers, J.; Tillier, C.E.; Edgington, S.F.; Longenbaugh, R.S.; Goodman, S.J.; Rudlosky, S.D.; Hildebrand, A.R.; Hanton, L.; Ciceri, F.; et al. Detection of meteoroid impacts by the Geostationary Lightning Mapper on the GOES-16 satellite. Meteorit. Planet. Sci. 2018, 53, 2445–2469. [Google Scholar] [CrossRef]
- Borovička, J.; Charvát, Z. Meteosat observation of the atmospheric entry of 2008 TC3 over Sudan and the associated dust cloud. Astron. Astrophys. 2009, 507, 1015–1022. [Google Scholar] [CrossRef]
- Ott, T.; Drolshagen, E.; Koschny, D.; Mialle, P.; Pilger, C.; Vaubaillon, J.; Drolshagen, G.; Poppe, B. Combination of infrasound signals and complementary data for the analysis of bright fireballs. Planet. Space Sci. 2019, 179, 104715. [Google Scholar] [CrossRef]
- Cansi, Y. An automatic seismic event processing for detection and location: The P.M.C.C. method. Geophys. Res. Lett. 1995, 22, 1021–1024. [Google Scholar] [CrossRef]
- ReVelle, D.O. Historical detection of atmospheric impacts by large bolides using acoustic-gravity waves. In Annals of the New York Academy of Sciences, Near-Earth Objects—The United Nations International Conference; Remo, J.L., Ed.; New York Academy of Sciences: New York, NY, USA, 1997; Volume 822, pp. 284–330. [Google Scholar]
- Brown, P.G.; Assink, J.D.; Astiz, L.; Blaauw, R.; Boslough, M.B.; Borovička, J.; Brachet, N.; Brown, D.; Campbell-Brown, M.; Ceranna, L.; et al. A 500-kiloton Airburst over Chelyabinsk and an Enhanced Hazard from Small Impactors. Nature 2013, 503, 238–241. [Google Scholar] [CrossRef]
- Hupe, P.; Ceranna, L.; Pilger, C.; Le Pichon, A.; Blanc, E.; Rapp, M. Mountain-Associated Waves and their relation to Orographic Gravity Waves. Meteorol. Z. 2019. [Google Scholar] [CrossRef]
- Margrave, G. Consortium for Research in Elastic Wave Exploration Seismology (CREWES) Software Package. Available online: http://www.crewes.org/Reports/2000/2000-09.pdf (accessed on 10 December 2019).
- Waxler, R.; Assink, J.; Hetzer, C.; Velea, D. NCPAprop—A software package for infrasound propagation modeling. J. Acoust. Soc. Am. 2017, 141, 3627. [Google Scholar] [CrossRef]
- ECMWF. European Centre for Medium-Range Weather Forecasts, Integrated Forecast System Analysis Data. Available online: https://www.ecmwf.int (accessed on 13 December 2010).
- Picone, J.M.; Hedin, A.E.; Drob, D.P.; Aikin, A.C. NRLMSISE-00 Empirical Model of the Atmosphere: Statistical Comparisons and Scientific Issues. J. Geophys. Res. 2002, 107, 15-1–15-16. [Google Scholar] [CrossRef]
- Drob, D.P.; Emmert, J.T.; Meriwether, J.W.; Makela, J.J.; Doornbos, E.; Conde, M.; Hernandez, G.; Noto, J.; Zawdie, K.A.; McDonald, S.E.; et al. An update to the Horizontal Wind Model (HWM): The quiet time thermosphere. Earth Space Sci. 2015, 2, 301–319. [Google Scholar] [CrossRef]
- Edwards, W.N.; Eaton, D.W.; Brown, P.G. Seismic observations of meteors: Coupling theory and observations. Rev. Geophys. 2008, 46, RG4007. [Google Scholar] [CrossRef]
- Stevanović, J.; Teanby, N.A.; Wookey, J.; Selby, N.; Daubar, I.J.; Vaubaillon, J.; Garcia, R. Bolide Airbursts as a Seismic Source for the 2018 Mars InSight Mission. Space Sci. Rev. 2017, 211, 525–545. [Google Scholar] [CrossRef]
- Nastan, A.; Garay, M.; Kalashnikova, O.; Boslough, M.; Chodas, P. Observations of the 18 December 2018 Bering Sea bolide by NASA’s Multi-Angle Imaging SpectroRadiometer (MISR) Instrument. In Proceedings of the Planetary Defense Conference Posters, Washington, WA, USA, 29 April–3 May 2019. [Google Scholar]
- Le Pichon, A.; Ceranna, L.; Vergoz, J. Incorporating numerical modeling into estimates of the detection capability of the IMS infrasound network. J. Geophys. Res. 2012, 117, D05121. [Google Scholar] [CrossRef]
- ReVelle, D.O.; Brown, P.G.; Spurný, P. Entry dynamics and acoustics/infrasonic/seismic analysis for the Neuschwanstein meteorite fall. Meteorit. Planet. Sci. 2004, 39, 1605–1626. [Google Scholar] [CrossRef]
- Le Pichon, A.; Guérin, J.M.; Blanc, E.; Reymond, D. Trail in the atmosphere of the 29 December 2000 meteor as recorded in Tahiti: Characteristics and trajectory reconstitution. J. Geophys. Res. 2002, 107, 17-1–17-10. [Google Scholar] [CrossRef]
- Sutherland, L.C.; Bass, H.E. Atmospheric absorption in the atmosphere up to 160 km. J. Acoust. Soc. Am. 2004, 115, 1012–1032. [Google Scholar] [CrossRef]
- Silber, E.A.; Brown, P.G. Infrasound Monitoring as a Tool to Characterize Impacting Near-Earth Objects (NEOs). In Infrasound for Atmospheric Studies—Challenges in Middle Atmosphere Dynamics and Societal Benefits; Le Pichon, A., Blanc, E., Hauchecorne, A., Eds.; Springer: Heidelberg, Germany, 2019; pp. 939–986. [Google Scholar]
© 2020 by the authors. Licensee MDPI, Basel, Switzerland. This article is an open access article distributed under the terms and conditions of the Creative Commons Attribution (CC BY) license (http://creativecommons.org/licenses/by/4.0/).