Article

Assessment of Urban CO2 Measurement and Source Attribution in Munich Based on TDLAS-WMS and Trajectory Analysis

1
Professorship of Environmental Sensing and Modeling, Technical University of Munich, 80333 Munich, Germany
2
Professorship of Ecoclimatology, Technical University of Munich, 85354 Freising, Germany
3
Leibniz Supercomputing Center (Leibniz-Rechenzentrum, LRZ) of the Bavarian Academy of Sciences and Humanities, 85748 Garching, Germany
4
Institute for Advanced Study, Technical University of Munich, Lichtenbergstr. 2a, 85748 Garching, Germany
*
Authors to whom correspondence should be addressed.
Atmosphere 2020, 11(1), 58; https://doi.org/10.3390/atmos11010058
Submission received: 13 November 2019 / Revised: 22 December 2019 / Accepted: 25 December 2019 / Published: 2 January 2020
(This article belongs to the Section Air Quality)

Abstract

:
Anthropogenic carbon dioxide (CO2) emissions mainly come from cities and their surrounding areas. Thus, continuous measuring of CO2 in urban areas is of great significance to studying human CO2 emissions. We developed a compact, precise, and self-calibrated in-situ CO2/H2O sensor based on TDLAS (tunable diode laser absorption spectroscopy), WMS (wavelength modulation spectroscopy), and VCSEL (vertical-cavity surface-emitting laser). Multi-harmonic detection is utilized to improve the precision of both measurements to 0.02 ppm for CO2 and 1.0 ppm for H2O. Using the developed sensor, we measured CO2 concentrations continuously in the city center of Munich, Germany, from February 2018 to January 2019. Urban CO2 concentrations are strongly affected by several factors, including vegetation photosynthesis and respiration (VPR), planetary boundary layer (PBL) height, and anthropogenic activities. In order to further understand the anthropogenic contribution in terms of CO2 sources, the HySPLIT (Hybrid Single-Particle Lagrangian Integrated Trajectory) model was applied to calculate six-hour backward trajectories. We analyzed the winter CO2 with the trajectory clustering, PSCF (potential source contribution function), and CWT (concentration weighted trajectory) methods, and found that local emissions have a great impact on urban CO2 concentration, with main emission sources in the north and southeast directions of the measurement site. In situations with an uneven trajectory distribution, PSCF proves somewhat superior in predicting the potential emission sources compared to CWT.

1. Introduction

Carbon dioxide (CO2) is the most important anthropogenic greenhouse gas (GHG) in the atmosphere. Cities and their surroundings account for only 2% of the global land area but carry 54% of the population and contribute 70% of the world’s anthropogenic CO2 emissions [1]. Therefore, it is crucial to study the anthropogenic CO2 emissions in the urban areas. In Germany, continuous observations have been performed to measure atmospheric CO2 for decades [2,3,4]. However, these sites are always located in rural areas or high mountains, exhibiting lesser impacts from local pollution, and thus, cannot detect the urban emissions directly. There are many techniques to quantify the atmospheric CO2, such as remote sensing via satellite [5,6,7], ground-based column measurement [8,9,10,11], and in-situ measurement [12,13,14,15,16]. In-situ techniques have the advantages that they can measure the atmospheric components at a high spatial and temporal resolution under various meteorological conditions, and during day and night, as opposed to other techniques.
The most common in-situ gas sensors are based on NDIR (nondispersive infrared) [17,18,19,20] and TDLAS (tunable diode laser absorption spectroscopy) [21,22,23,24,25] technologies. However, most commercial gas sensors require periodic calibrations, which would take a lot of effort and possibly interrupt measurements [26,27,28,29]. TDLAS is advantageous for in-situ trace gas monitoring. With this technique, a tunable laser scans across a specified absorption line with a narrow bandwidth [30,31]. TDLAS is often combined with WMS (wavelength modulation spectroscopy), a technique that utilizes a faster but smaller amplitude sinusoidal signal together with a slower and larger ramp signal to modulate the laser wavelength. Then, it uses a lock-in amplifier (LIA) to decompose the absorption signal into its harmonic components. Instead of the direct absorption spectrum, highly precise harmonic signals are obtained to determine gas concentrations. Due to its efficient noise suppression (for example of 1 / f noise), TDLAS-WMS enhances sensitivity, precision, and SNR in the measurement and has wide applications for trace gas monitoring in harsh environments as well [32,33,34]. A precise and self-calibrated CO2/H2O sensor based on TDLAS-WMS technique has been developed by our group. Multi-harmonic detection is utilized in the sensor to improve the measurement precision [24,25].
Locating potential CO2 emission sources around the measurement site, a further aim of our study requires not only temporal variability analysis but transport modeling as well. A common method with which to analyze long-term measurements relies on simulated backward trajectories; for example, those calculated with the HySPLIT (Hybrid Single-Particle Lagrangian Integrated Trajectory) model [35,36,37]. In a trajectory model, the mechanism for pollutant transportation is simulated as tracing air parcel paths from the measurement site backwards in time. In conjunction with the observed concentration, trajectories plotted on a map can indicate probable emission sources and evaluate how these sources have influence on the concentrations at the measurement site. The most popular statistical methods for evaluating this precisely are trajectory clustering, PSCF (potential source contribution function), and CWT (concentration weighted trajectory) methods. PSCF infers the probability that an area contributes to high pollutant concentration at the receptor site, while CWT uses a computed weighted concentration to identify the strength of emission sources arriving at the site [38,39].
Our group previously developed a self-calibrated TDLAS-WMS gas sensor [24,25]. In this paper, we utilized the developed sensor to measure CO2 concentration in Munich, Germany for an entire year, from February 2018 to January 2019. Afterwards, we used the observational data to address the potential emission sources in Munich combined with air mass backward trajectories using different methods. The structure of this article is as follows: the theory behind the TDLAS-WMS gas sensor, the precision and accuracy of the sensor, the comparative experiment with sensors at weather station, and some supporting data for analysis are discussed in Section 2. The analyses of the whole year’s measurement results can be found in Section 3. A description of our backward trajectory computations and the model-based analyses of winter CO2 are presented in Section 4. Section 5 provides the conclusion of this work. Note that the CO2 recorded for the month of January in this article was measured in 2019, and the rest of the results were performed considering the data from 2018.

2. Measurement System and Auxiliary Data

2.1. Measurement Site

Munich, the capital of Bavaria, is located at the south of Germany, only 100 km from the Alps. The city and its metropolitan region are home to around 6 million residents. Munich is an ideal city for studying local pollutant emissions, since it is relatively isolated from other cities with strong emissions. As shown in Figure 1, the measurement site is situated at the main campus of Technical University of Munich (TUM, 48.15° N, 11.57° E, 5 m above ground level (a.g.l.)). Here, somewhat north from the city center, the Central Train Station (Hbf), the Old Town (Altstadt), and shopping malls are within a radius of about 5 km. Moreover, some factories, such as BMW (Bayerische Motoren Werke, Munich, Germany) and Mercedes-Benz (Benz, Stuttgart, Germany), are north from the measurement site at a distance of approximate 3–5 km. Although the height of the measurement site (5 m a.g.l.) is not ideal and will be more sensitive to nearby emissions than taller sampling sites, there is no strong emission source directly at the measurement site. Thus, the measurement data from the site can be used to study the local emissions in Munich.

2.2. TDLAS-WMS Sensor

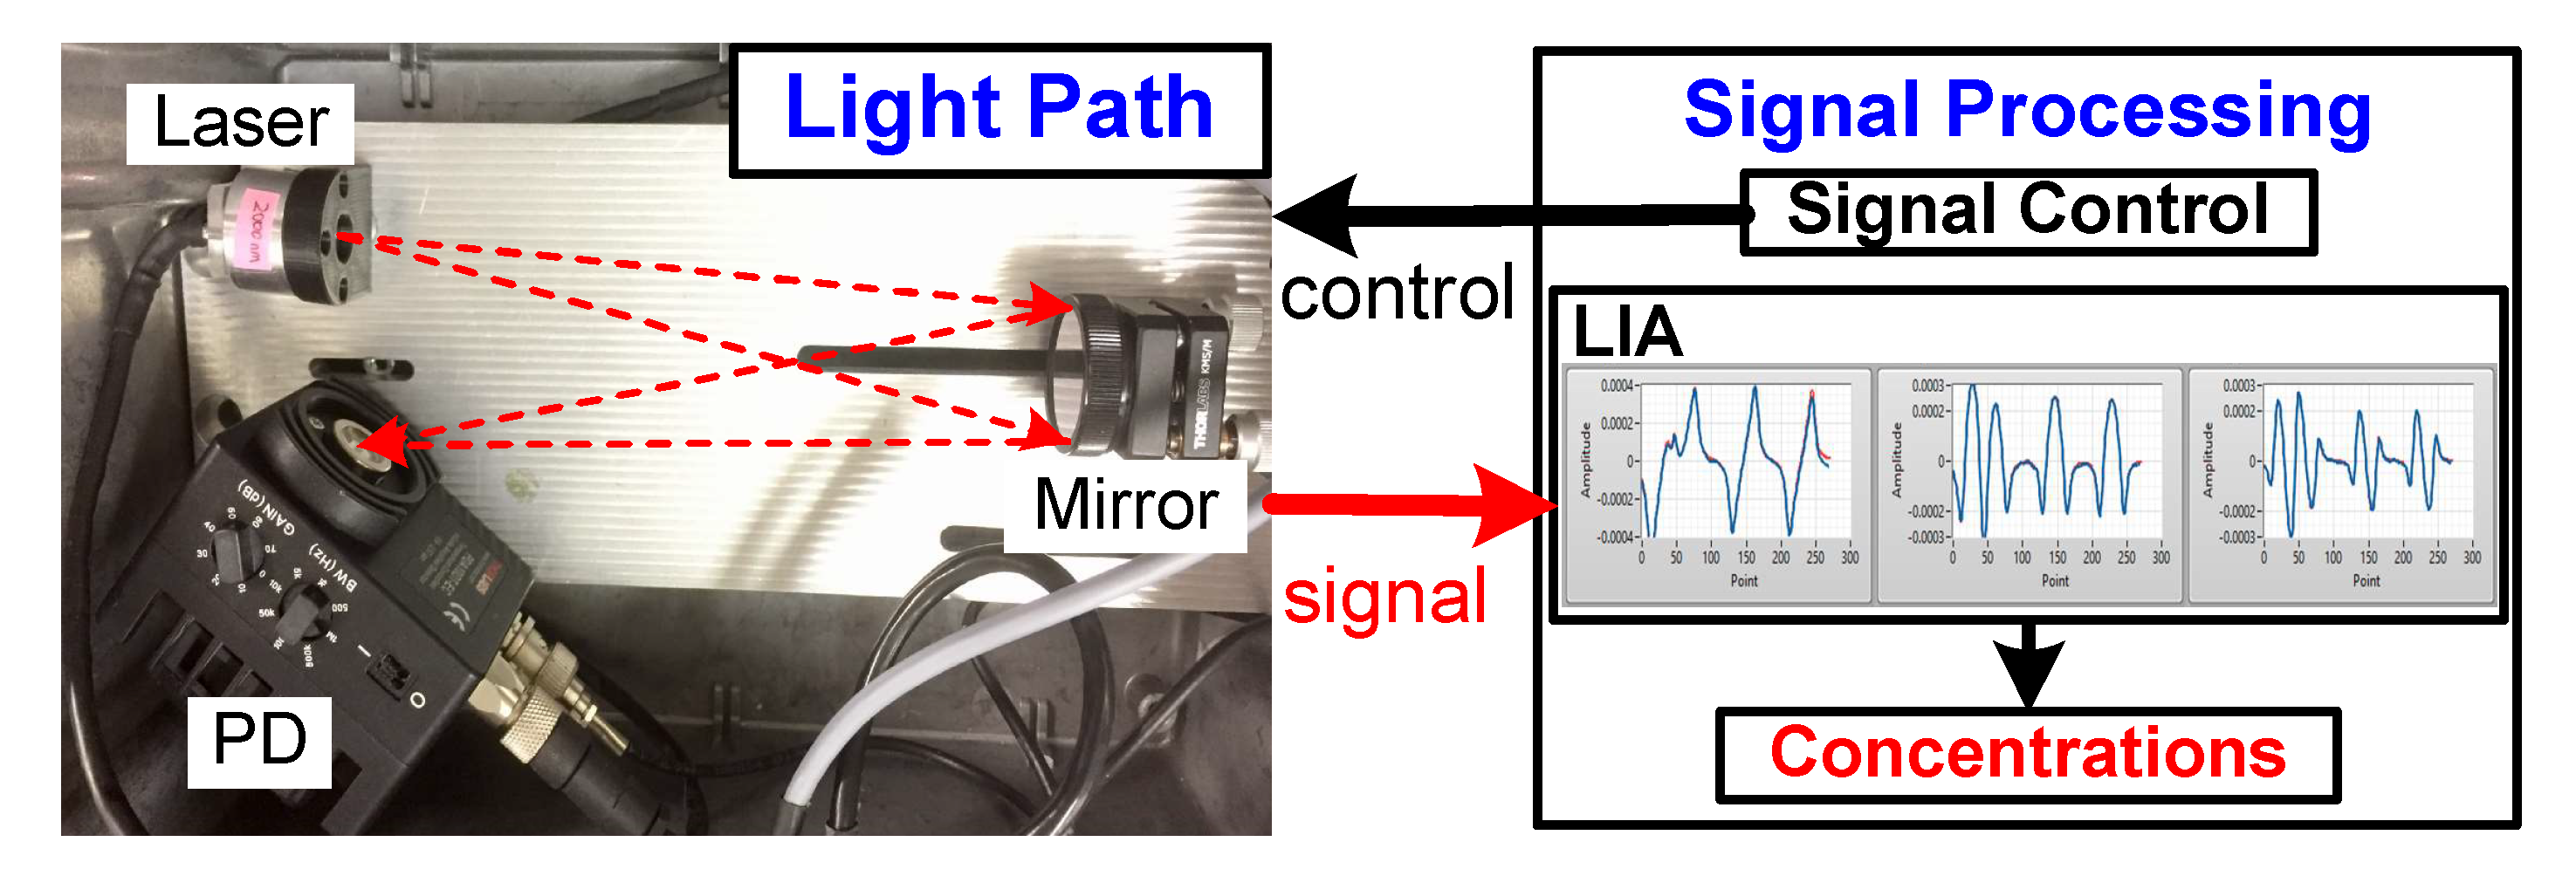
The TDLAS-WMS sensor used in this study has been described in detail in our previous works [24,25]. In the left panel of Figure 2, a VCSEL (vertical-cavity surface-emitting laser) is used as the light source. The laser beam is reflected by a concave mirror (CM254-075-G01, Thorlabs) of 75 mm focus length and sent to an InGaAs amplified detector (PD, PDA10DT-EC, Thorlabs). Only a 30 cm path length is compacted in the system. VCSEL utilized in the system is an InP -based, single-mode, tunable semiconductor laser whose wavelength is near 2004 nm (available at: https://vertilas.com/content/products/; accessed on: 18 December 2019). It is suitable for simultaneous detection of several gas species owing to its characteristics of a wide tuning range [40]. The right panel is the signal processing which not only controls the laser emitting wavelength but also calculates the gas concentration. For our sensor, the laser is set up to measure CO2 and H2O concentrations in one tuning cycle.
The basic principle of TDLAS is described by the Beer–Lambert Law. A signal processing method was developed for self-calibrating the intermediate parameters (e.g., light intensity, wavelength, and phase shifts) and calculating gas concentrations in real time. That is, a digital LIA was made to obtain the zeroth to third harmonic signals. For a trace gas measurement when the absorbance is weak, the zeroth harmonic can serve as the central light intensity to remove the effects of the laser intensity drifts [25]. Through those processes, the multi-harmonic signals are acquired for inferring gas concentration based on least-squares curve fitting.
We use Allan deviation analysis for analyzing frequency stability and precision of the measurement system in the time domain. This method can identify and quantify different noise contributions that exist in the measurement system [41,42]. In Figure S1 of Supplementary Materials, the Allan plots for multi-harmonic detection and traditional second harmonic detection for CO2 and H2O measurements are given. Compared with the second harmonic detection, the results with multi-harmonic detection indicate that applying it in gas monitoring can effectively enhance the precision about 2–3 times. As displayed in Figure S1a for CO2, broadening the scanning wavelength can also effectively improve the measurement precision. At the optimum integrating time ( τ opt = 10 min), the detection limits of CO2 and H2O are 0.02 and 1.0 ppm (1.0 × 10⁻³‰), respectively. It is evident that the wide tuning VCSEL and the multi-harmonic detection help to increase the precision of the developed sensor. Moreover, a commercial NDIR sensor (LiCor 840A CO2/H2O gas analyzer) is employed as a standard instrument to verify the accuracy of our sensor. The comparison experiments were carried out in the field measurements and the results have demonstrated that our sensor has high measurement accuracy and good consistency with the LiCor sensor.
During the one-year measurement campaign, the absolute CO2 and H2O concentrations were measured simultaneously. To validate the credibility of our measurement, the H2O concentrations observed in June 2018 were compared with the data from a weather station of LMU (Ludwig Maximilian University of Munich) which is less than 1 km away from our site. The station uses Fischer TF (temperature/humidity) sensors which are installed at heights of 2 m and 30 m a.g.l. to measure temperature and humidity every minute. The results are presented in the Supplementary Materials (Figure S2). From Figure S2, we can learn that the H2O concentration measured at the measurement site (5 m a.g.l.) has fluctuation tendency similar to those of the TF sensors and is closer to TF sensor at 2 m a.g.l. The results indicate that the air measured by our sensor represents the atmospheric H2O concentrations and it can be concluded that our sensor shows similarly good performance and is valid for the CO2 measurements as well.

2.3. Auxiliary Data

To better understand the CO2 variations and emissions in Munich, we utilized observations of ambient temperature and solar-induced fluorescence (SIF), modeled planetary boundary layer (PBL) height, and acquired the CO2 emission inventory from fuel consumption around Munich. The ambient temperature was measured at the LMU weather station and its monthly averaged curves are shown in Figure S3 in Supplementary Materials.
The PBL is the atmospheric layer directly contacting the earth surface, whose height responds to variations in the Earth’s surface temperature and the solar radiation. The air within the PBL is well-mixed and the top of this layer can prevent the surface air from mixing with the air in the lower free atmosphere. Hence, the thickness of the PBL affects the ground-based gas concentrations. When the PBL height rises, the gas concentration decreases; when PBL drops, the concentration increases [43,44]. The PBL height dynamic is a major factor to determine the measured diurnal gas variations and probably conceals the anthropogenic emissions [45]. The PBL height depicted in Figure S4 was obtained from the meteorological data in the ECMWF (European Centre for Medium-Range Weather Forecasts) ERA5 dataset (see Section 4.1).The diurnal PBL cycles in the warm months have huge variations, especially in summer, the heights can reach 1500 m in the day and drop to about 150 m at night. In winter, the PBL height is much more stable, staying below 600 m most of the time.
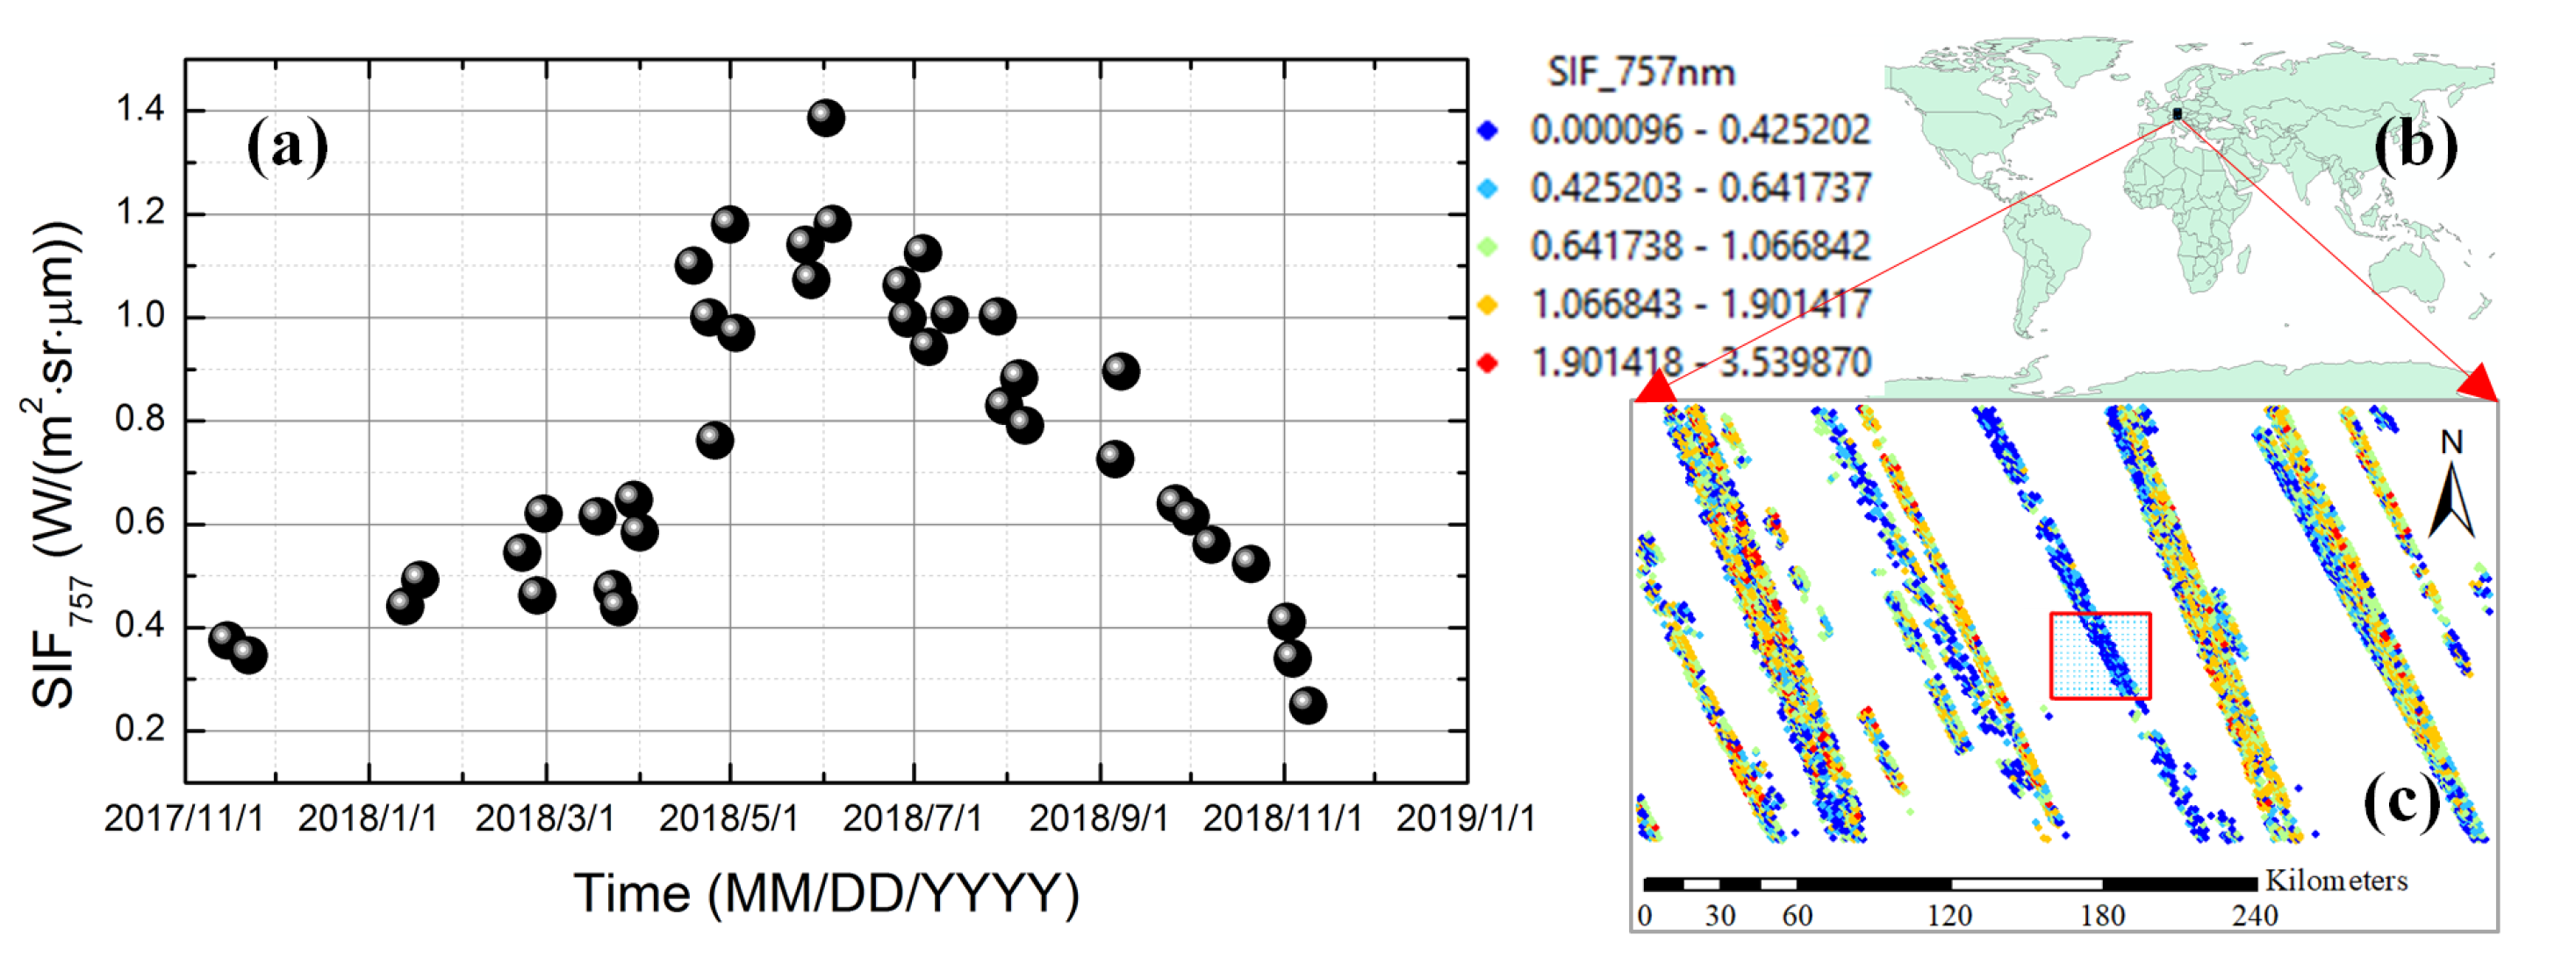
The SIF measures an electromagnetic signal emitted by the chlorophyll molecules during photosynthesis activity and indicates plants’ photosynthetic light use efficiency. Here, the SIF data observed from the OCO-2 satellite was used to present the regional photosynthetic activity [46,47]. The higher the SIF values are, the stronger the photosynthesis is. As shown in Figure 3a, the SIF data was retrieved from the O2 A-band spectrum at 757 nm with a spatial resolution of 1.3 × 2.25 km2 and a spatial domain of 10–13° E and 47.5–49° N. The OCO-2 tracks can also be seen in Figure 3b,c. In the growing season (spring to summer), the SIF increases sharply from 0.5 to 1.2 W/(m2·sr·μm). The SIF level remains high in summer, and then gradually decreases in the fall season to approximately 0.4 W/(m2·sr·μm), signifying that the photosynthesis becomes feeble.
The TNO-MACC_III (Monitoring Atmospheric Composition and Climate) CO2 emission inventory map with a spatial resolution of 1 × 1 km2 is provided in the Supplementary Materials (TNO GHGco v1.1, Figure S5). The emission inventory is documented the latest in 2015 [48]. The map accounts for CO2 emission from fossil fuel and bio fuel near Munich with a spatial domain of 10°–13° E and 47.5°–49° N. The enlarged view of the emission map at the city center is shown in the second map, where the measurement site and the main places mentioned above are marked inside. From the enlarged map, we can learn that the primary emission sources are located in the city center, and the north factory area also contributes large emissions.

3. Results and Discussion

3.1. Diurnal Cycles by Month

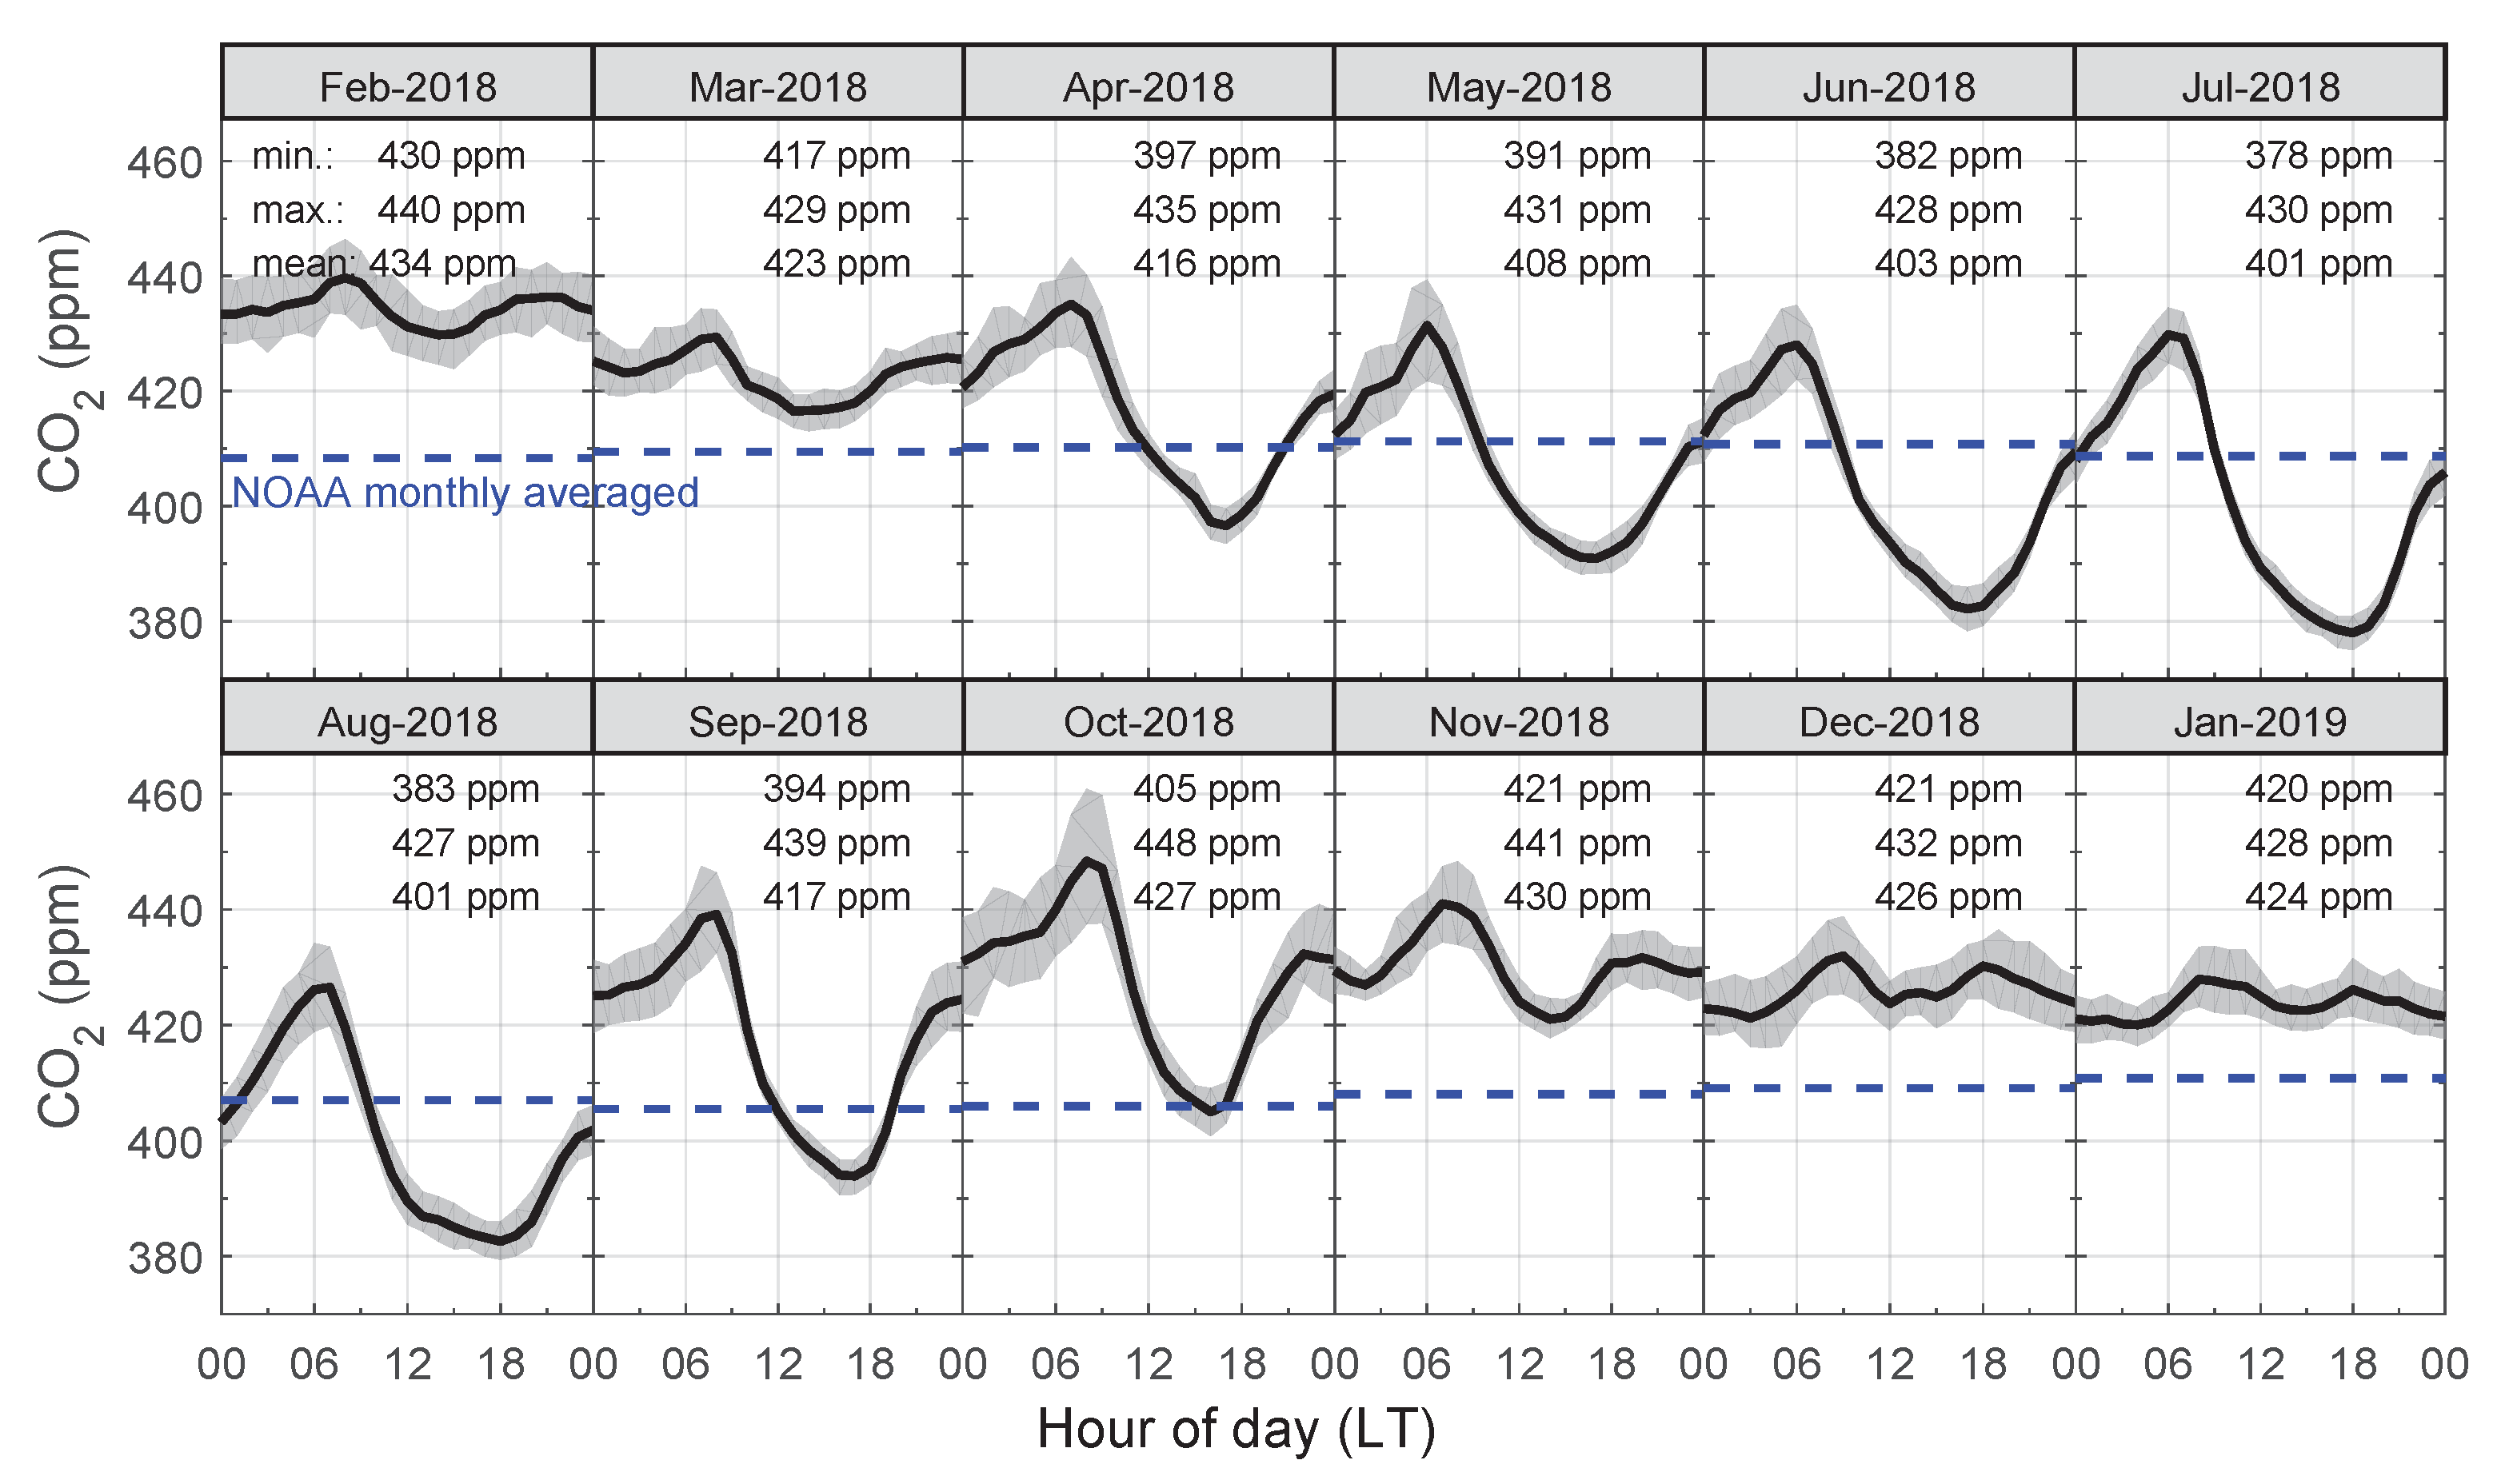
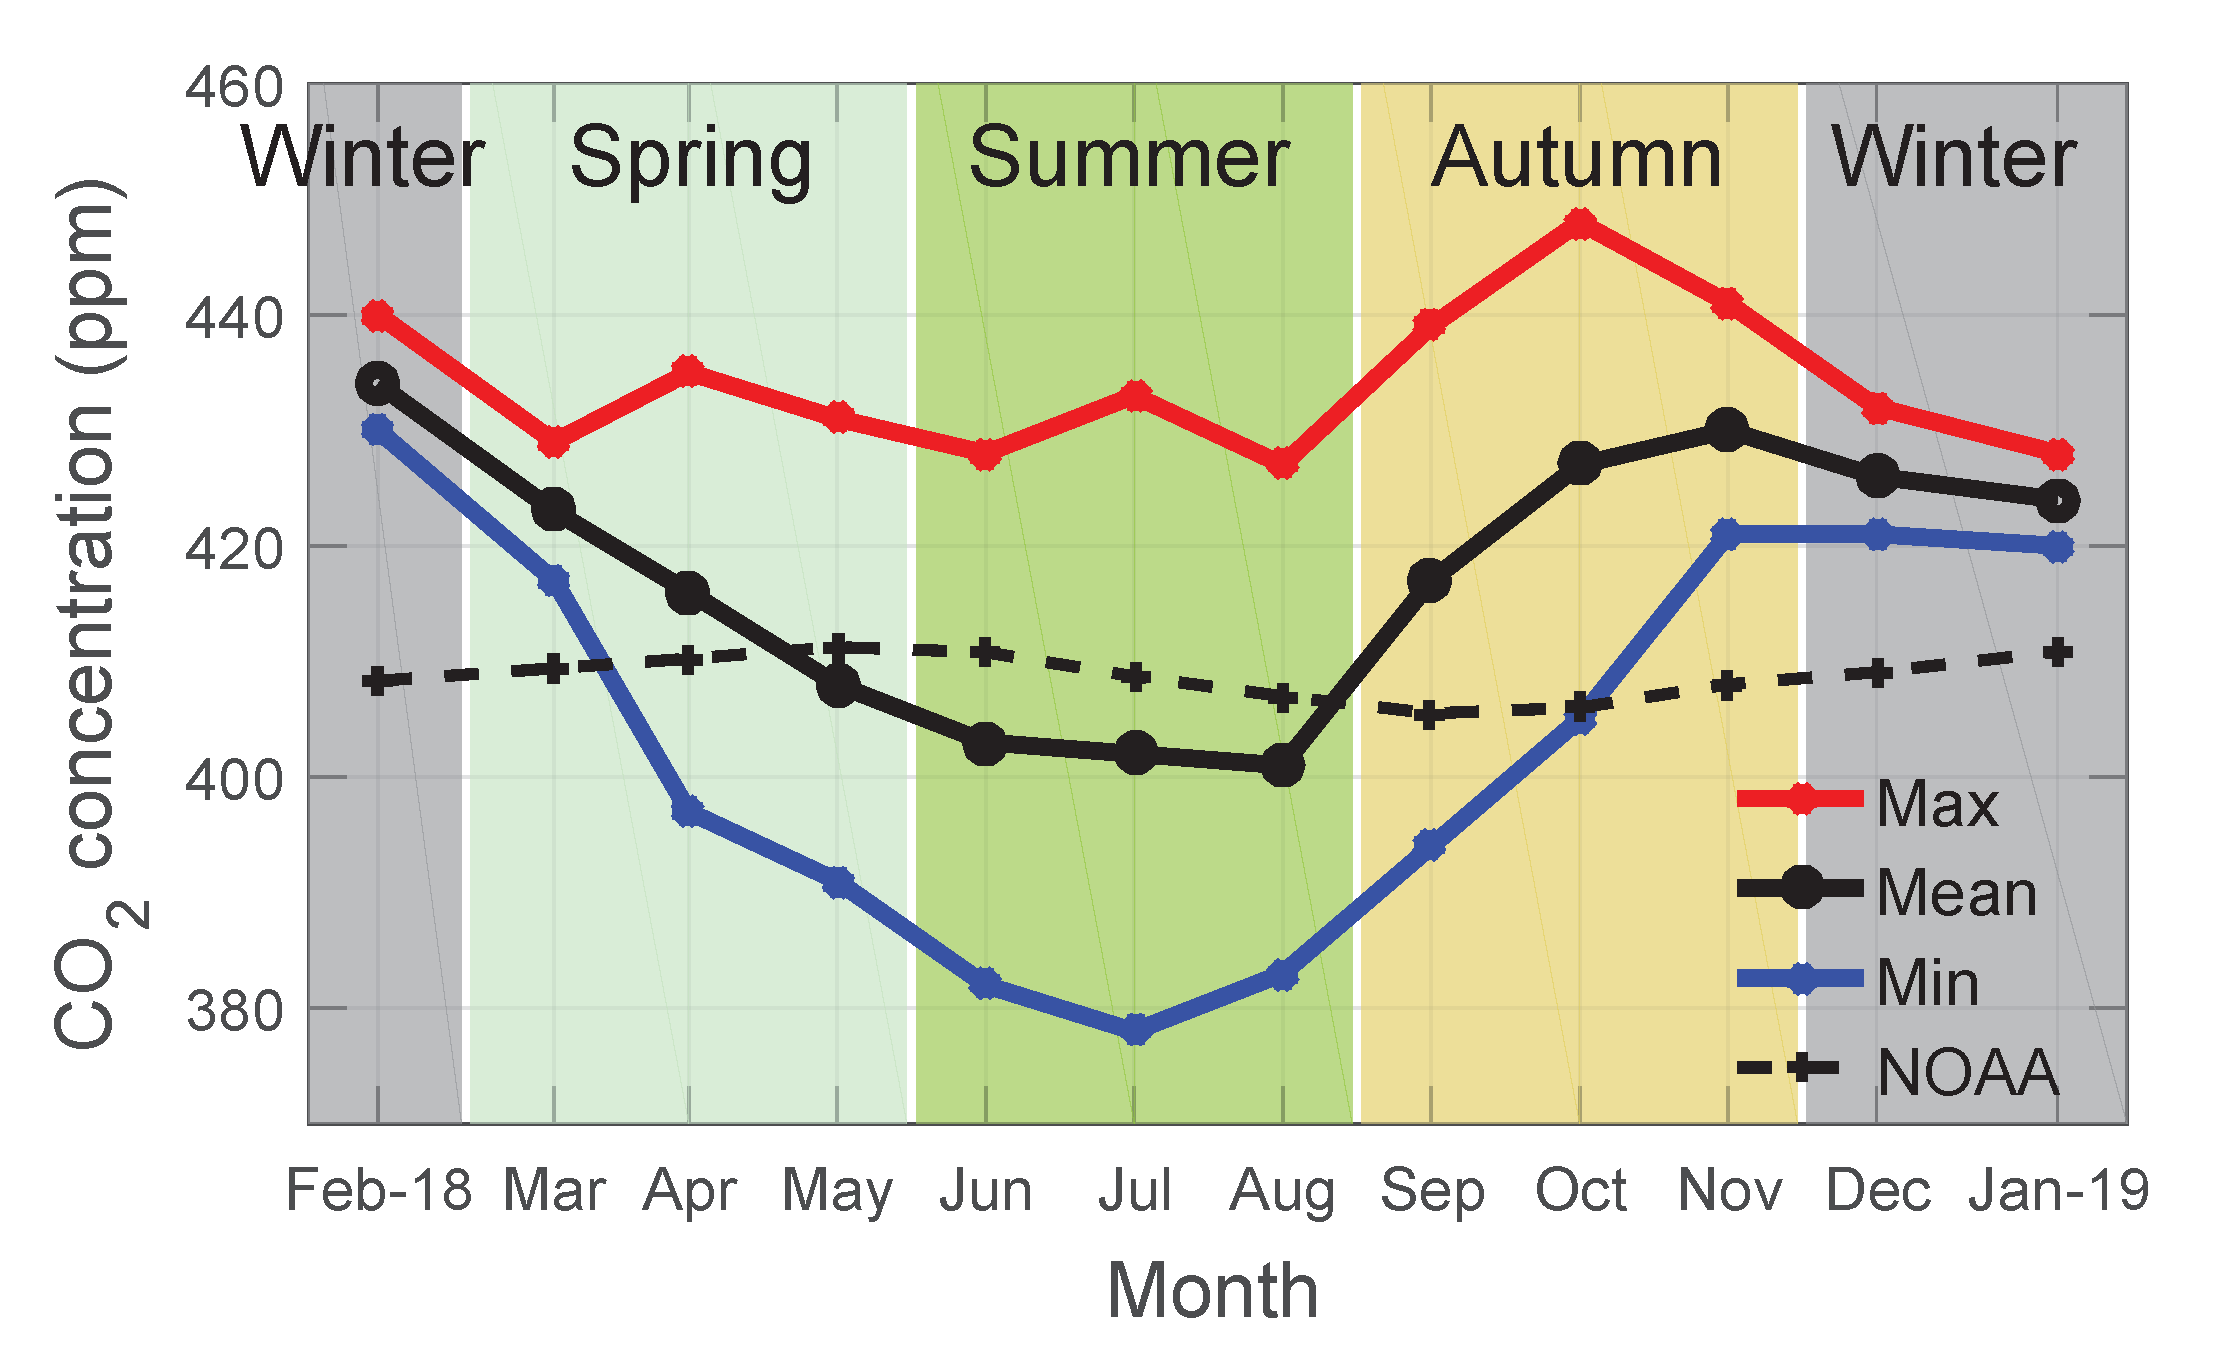
Our continuous observation of atmospheric CO2 concentration was carried out in Munich city center from February 2018 to January 2019. Figure 4 shows the monthly-averaged observed CO2 concentration with a shaded area corresponding to ± 2 standard deviations ( σ ). The mean, minimum, and maximum values of each month are summarized in Figure 5. Moreover, the monthly mean CO2 measured from Mauna Loa (NOAA) are added in the plots as the background concentration [49]. The diurnal CO2 cycle is: the CO2 concentration decreases in the daytime and reaches a minimum in the afternoon; afterwards, it increases at night and reaches a maximum in the next morning, becoming more and more noticeable from February to July. Then, it gradually disappears. The following analyses were conducted by combining with the supporting data of the ambient temperature (Figure S3), PBL height (Figure S4) and SIF data (Figure 3). Here, we define the warm months as when the ambient temperature is above 10 °C (see Figure S3, from April to October), and the cold months as when the temperature is below 10 °C.
The observed CO2 concentrations have distinct diurnal variations and reduce below the background levels in the afternoon in the warm months. The diurnal cycles are caused by a combination of several factors. In the daytime around Munich, the vegetation photosynthesis consumes lots of CO2 and decreases the CO2 concentration. As a more “physical” factor, the sun heats the ground, resulting in increments of temperature and PBL height (see Figures S3 and S4), and a decrement of CO2 mixing ratio. At night, the photosynthesis stops while the plan and soil respiration increases the CO2 mixing ratio in the atmosphere. Opposite to the daytime, the shallow PBL further augments the tendency for an increasing CO2 concentration. Our observations in these months, especially in summer, were similar to other measurements in European cities, such as Basel, Switzerland [18,50], London, UK [26], and Valladolid, Spain [51]; their diurnal cycles also had large amplitudes (more than 30 ppm) with low concentrations (<400 ppm) in the afternoon. As a minor episode, the August curve has the longest stable but not the lowest concentration in the afternoon of summer. Taking temperature (Figure S3) and SIF data (Figure 3) into consideration, temperature in August afternoon is the highest (27.6 °C; 23.4 °C for June and 26.6 °C for July), while its SIF mean is the lowest (0.8 W/(m2·sr·μm); 1.2 W/(m2·sr·μm) for June and 1.0 W/(m2·sr·μm) for July) among the summer months. The heatwave and the pronounced drought in summer 2018, especially in August, might have decreased the photosynthesis and made the CO2 stable above 380 ppm in the afternoon (available at: https://www.worldweatherattribution.org/attribution-of-the-2018-heat-in-northern-europe/; accessed on: 18 December 2019). The October curve shares the same diurnal range but the highest concentration in the warm months. It is because of the vegetation decay in the fall season: the photosynthesis is almost stopped (see Figure 3; SIF is 0.6 W/(m2·sr·μm) in October) and the dry leaves and dry grass decompose and deliver more CO2. Thus, it can be concluded that the ground-based diurnal CO2 variations in warm months are mainly influenced by the vegetation photosynthesis and respiration (VPR) and PBL height variations.
In the cold months, especially in winter, the concentrations stayed above background levels with no distinct diurnal cycles. The low atmospheric temperature not only prevents the VPR activities from the biosphere but also leads to a shallow PBL and high CO2 concentration in urban areas due to the accumulation of CO2. Moreover, the CO2 emission from the residence is also enhanced in the heating days. Two distinct peak mixing ratios that occur in the morning and afternoon are likely to be caused by the rush-hour traffic in Munich city center. The diurnal cycles with two peaks in wintertime of Munich are similar to some other urban sites, such as Basel [18], London [26], and Chicago, US [21]. However, the diurnal ranges in London and Chicago (∼20 ppm) were larger than those in Basel and Munich (∼10 ppm), likely due to the enhanced nighttime PBL dynamics in London and Chicago [45]. Given that the PBL (see Figure S4) is constant at a low height in the cold months, the anthropogenic activities become highlighted in the CO2 observed. Therefore, CO2 measurements in the cold months, especially in winter, act as an ideal basis for studying the anthropogenic activities in urban areas.

3.2. Diurnal Cycle on Workdays versus Weekends

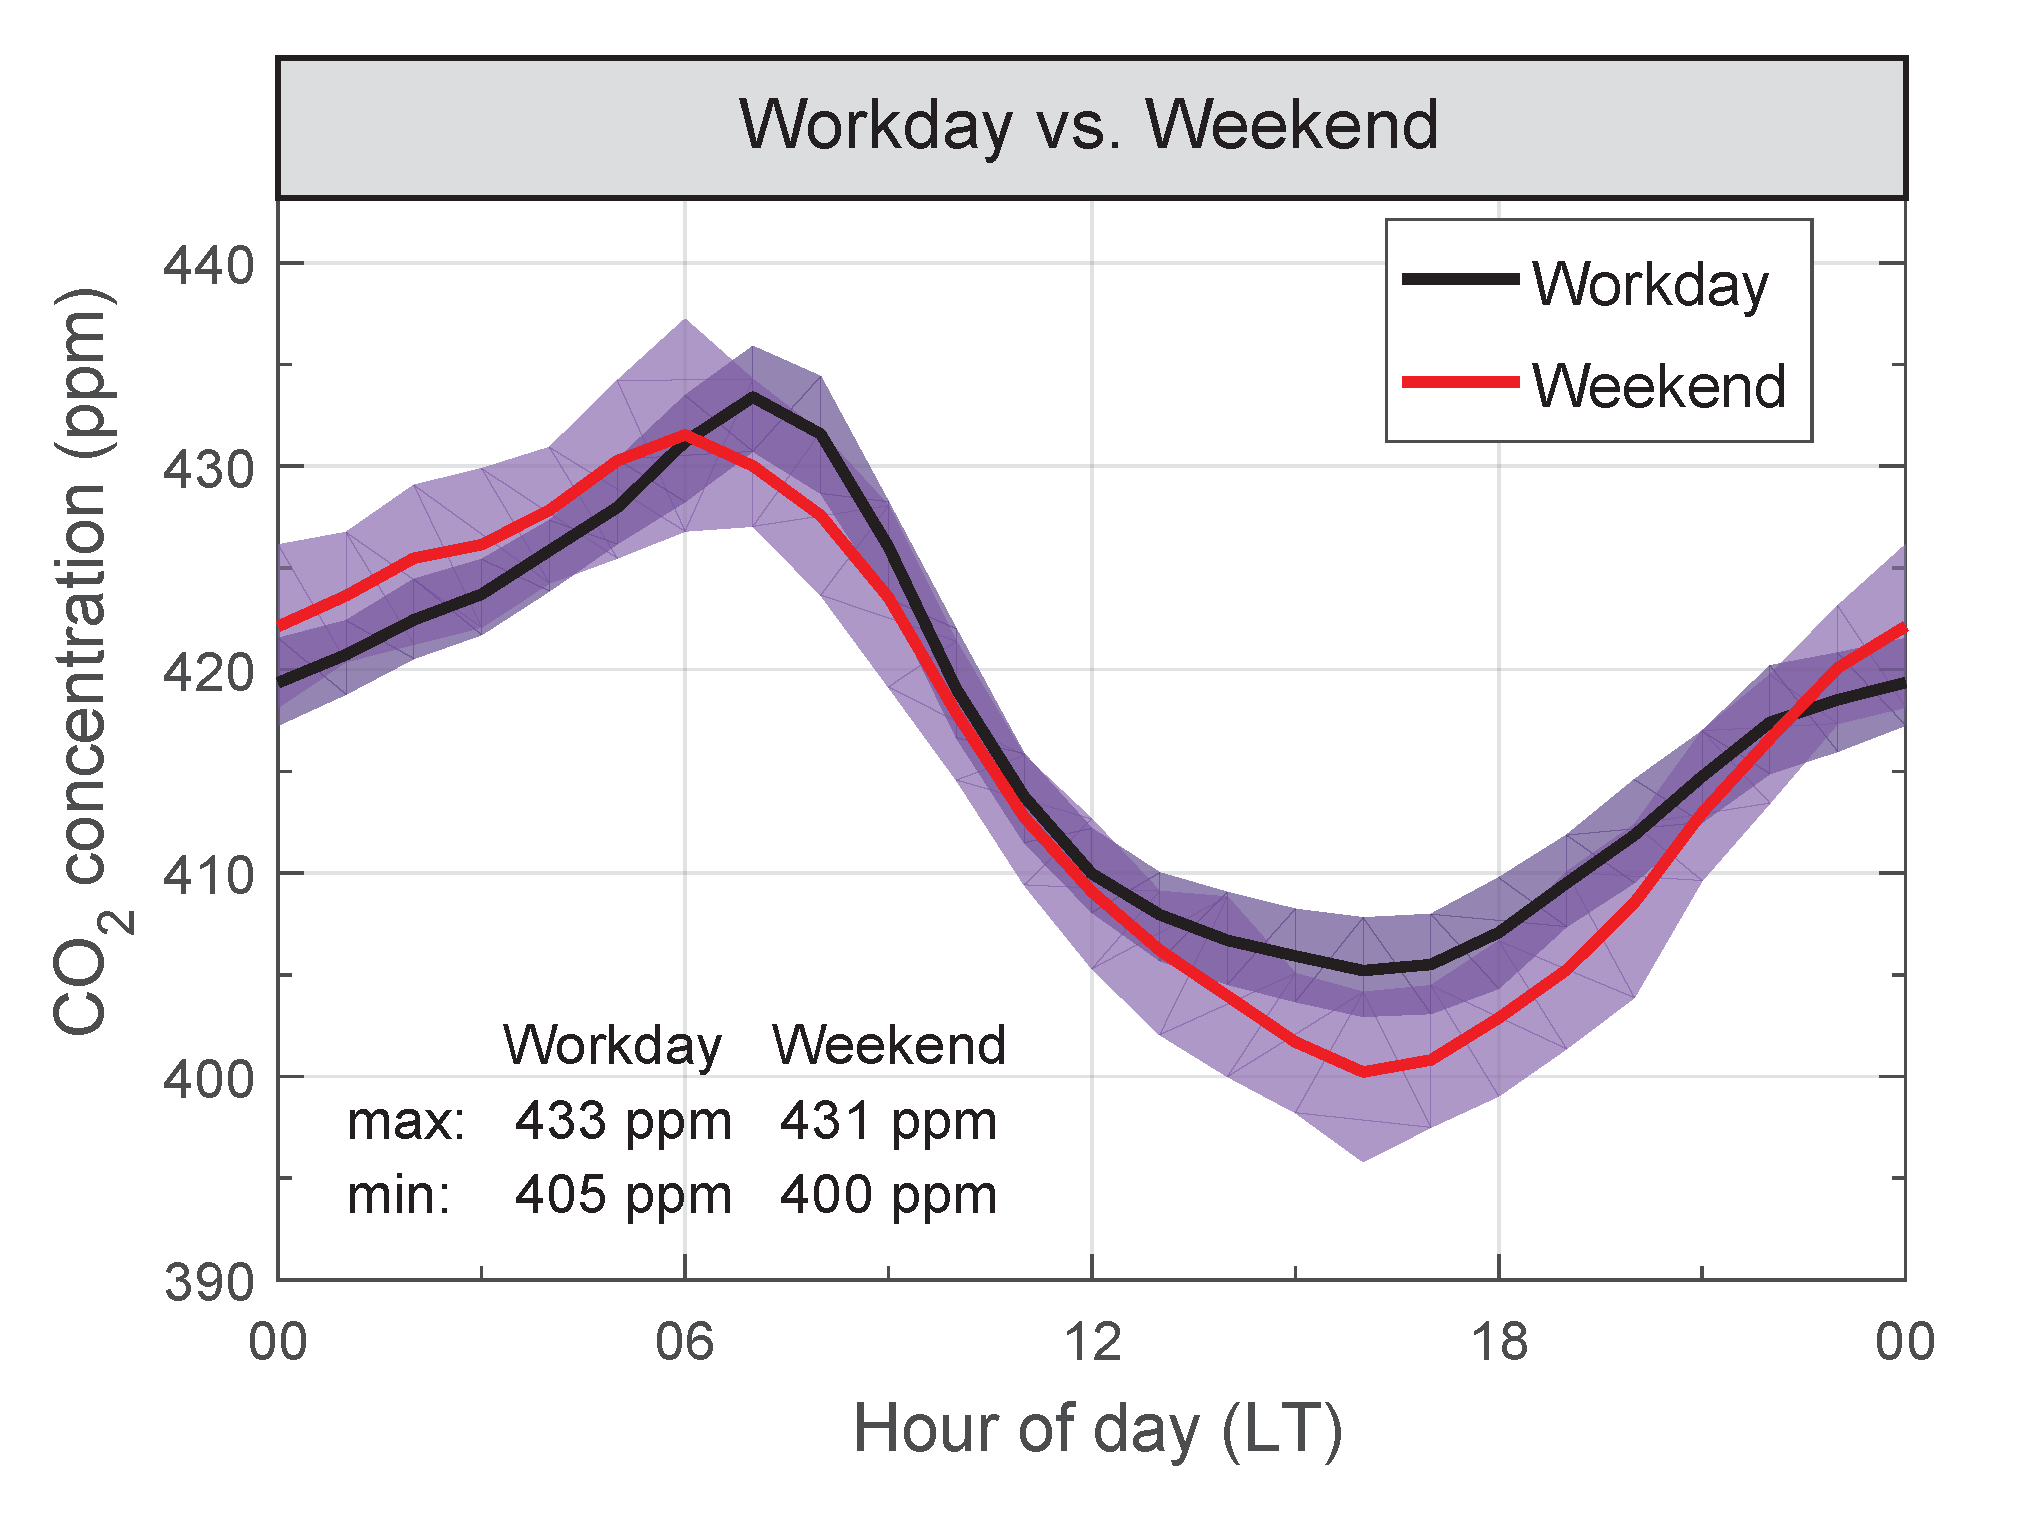
The workday and weekend diurnal variations of the observed CO2 concentration over all seasons are shown in Figure 6. Diurnal variations are obvious on both workdays and weekends, suggesting that the PBL and VPR factors are dominant in the weekly average. However, the workday cycle is slightly different from the weekend curve. At first, the peak value occurs about one hour later in the workday morning (07:00 LT(local time)) than on the weekend (06:00 LT). The difference is probably caused by the heavy rush-hour traffic on the workday which usually peaks well after 07:00 in Munich [52]. On workdays, people commute in the city by private cars or public transport. The heavier traffic flows increase the CO2 concentration during this time period in urban areas. On the contrary, during the weekend, people usually stay at home or participate in some recreational activities and go home late at night. The activities and traffic at weekend nights in urban areas elevate CO2 concentration at our measurement site. Therefore, the weekend curve has lower daytime CO2 concentration but higher nighttime CO2 concentration than the workday curve. These results are quite similar to some previous studies in European and US cities; for example, Lietzke et al. in Basel [18], Sparks et al. in London [26], Moore et al. in Chicago [21], and Rice et al. in Portland, US [27]. They found that CO2 concentrations on workdays were slightly higher with later peak values during the day compared to weekends and that the results correlated with traffic volume. From the workday-to-weekend differences, we can confirm that daily anthropogenic activities augment the CO2 concentration in the city center [4].
The analyses above focused on the temporal variability of the measured CO2 concentrations. From the month-by-month analysis, we can conclude that the ground-based CO2 concentration in Munich is strongly affected by the atmospheric and biogenic factors (PBL height and VPR). Meanwhile, the anthropogenic activities are almost submerged by the PBL and VPR effects in the warm months [53]. The human activities can be clearly observed, especially in the wintertime. Our analysis by workday/weekend brings out a small difference between the workday and weekend, which is likely to be caused by the traffic volume in the city. However, the main drivers of diurnal variations remain as the PBL and VPR behaviors. Thus, further studies are needed for the quantification of the effects of different factors on the ground-based CO2 concentration variations.

4. Model Analysis of Winter Data

Since the CO2 sources and sinks from ecosystems become feeble in winter, the winter-time concentration in urban areas is more strongly affected by anthropogenic activities (Section 3.1). In this section, we target the winter as study period for analyzing the anthropogenic activities in Munich using the HySPLIT model.

4.1. Trajectory Calculation and Analysis Methods

Backward-trajectory models are an essential tool to trace back air parcels and supply the information on their origin. HySPLIT, which we will employ here, is commonly used to establish locations of relevant emission sources with respect to a specific receptor site [36,54]. Combined with the observed gas concentration at the time when air parcels arrive at the measurement site, the air backward trajectories reflect the air movement and gas distribution on the computed paths. Using a clustering method giving mean trajectories, similar paths are grouped together, and the major air mass transport pathways which elevate the pollution concentration at the receptor may be determined. In our study, six mean-clusters were calculated from all backward trajectories by using the angle-based matrix method.
Other ways to understand the origins of observed concentrations are PSCF (potential source contribution function) and CWT (concentration weighted trajectory) methods. The PSCF gives probable spatial distributions of emission sources using backward trajectories. The PSCF is a conditional probability function, calculated as follows:
PSCF i j = m i j / n i j ,
where n i j is the total number of trajectories that pass through the cell ( i , j ), and m i j is the number of trajectories resulting in a gas concentration at receptor that is greater than a specific threshold (75th percentile of CO2 concentration in this study). In our calculation, a weighting factor has been considered in the PSCF value for grid cells which lack sufficient data:
W ( n i j ) = 0.75 n < N 2 n 0.5 n / 2 < N n 0.15 N n / 2 ,
where W ( n i j ) is the weight function, N is the number of the end point per grid cell, and n is the average of N. The PSCF method cannot distinguish whether the gas concentration for a grid cell is only slightly or much higher than the threshold. The use of a higher threshold concentration can, in our experience, limit the consequences of this shortcoming and help to distinguish moderate and major sources. This method has a good angular resolution but poor radial resolution since the trajectories converge to the receptor. Therefore, the trajectory length should not be too long. For the Munich case, we use the six-hour backward trajectories for computing the PSCF values [39,55].
The CWT method, also called concentration-field (CF), computes concentration fields to identify the pollutant source areas. In the CWT calculation, the mean concentration ( C i j ¯ ) of a grid cell ( i , j ) is determined by using the following averaging formula:
ln ( C i j ¯ ) = 1 k = 1 N τ i j k k = 1 N ln ( c k ) τ i j k ,
where k is the index of the trajectory, N is the total number of trajectories, c k is the gas concentration measured upon the arrival of trajectory k at the receptor, and τ i j k is the residence time of trajectory k in grid cell ( i , j ). The computed mean concentrations are then assigned to all grid cells and the pollutant gas would be assumed to come from the “hot spots.” In other words, a high C i j ¯ indicates that the air going across the cell ( i , j ) would lead to high concentration at the measurement site [56,57,58].
For the trajectory calculation, the input meteorological data is the ERA5 dataset from ECMWF (data available via: https://cds.climate.copernicus.eu; accessed on: 18 December 2019). ERA5 reanalysis provides hourly estimates of climate variables with a high horizontal resolution of 31 km on 137 vertical levels from the surface up to 80 km. Six-hour backward trajectories ending at the measurement site (receptor) (48.15° N, 11.57° E) 100 m a.g.l. are calculated every hour in hourly resolution for arrival time during the winter months. We calculated trajectories at different arrival heights (50, 150, 200, 300, 400, and 500 m a.g.l.) and found that the transport pathways under 300 m a.g.l. are quite similar. The calculated trajectories were processed by the Openair package in RStudio, in which the observed CO2 concentrations can be incorporated into analysis [59].

4.2. Analysis of Winter Data

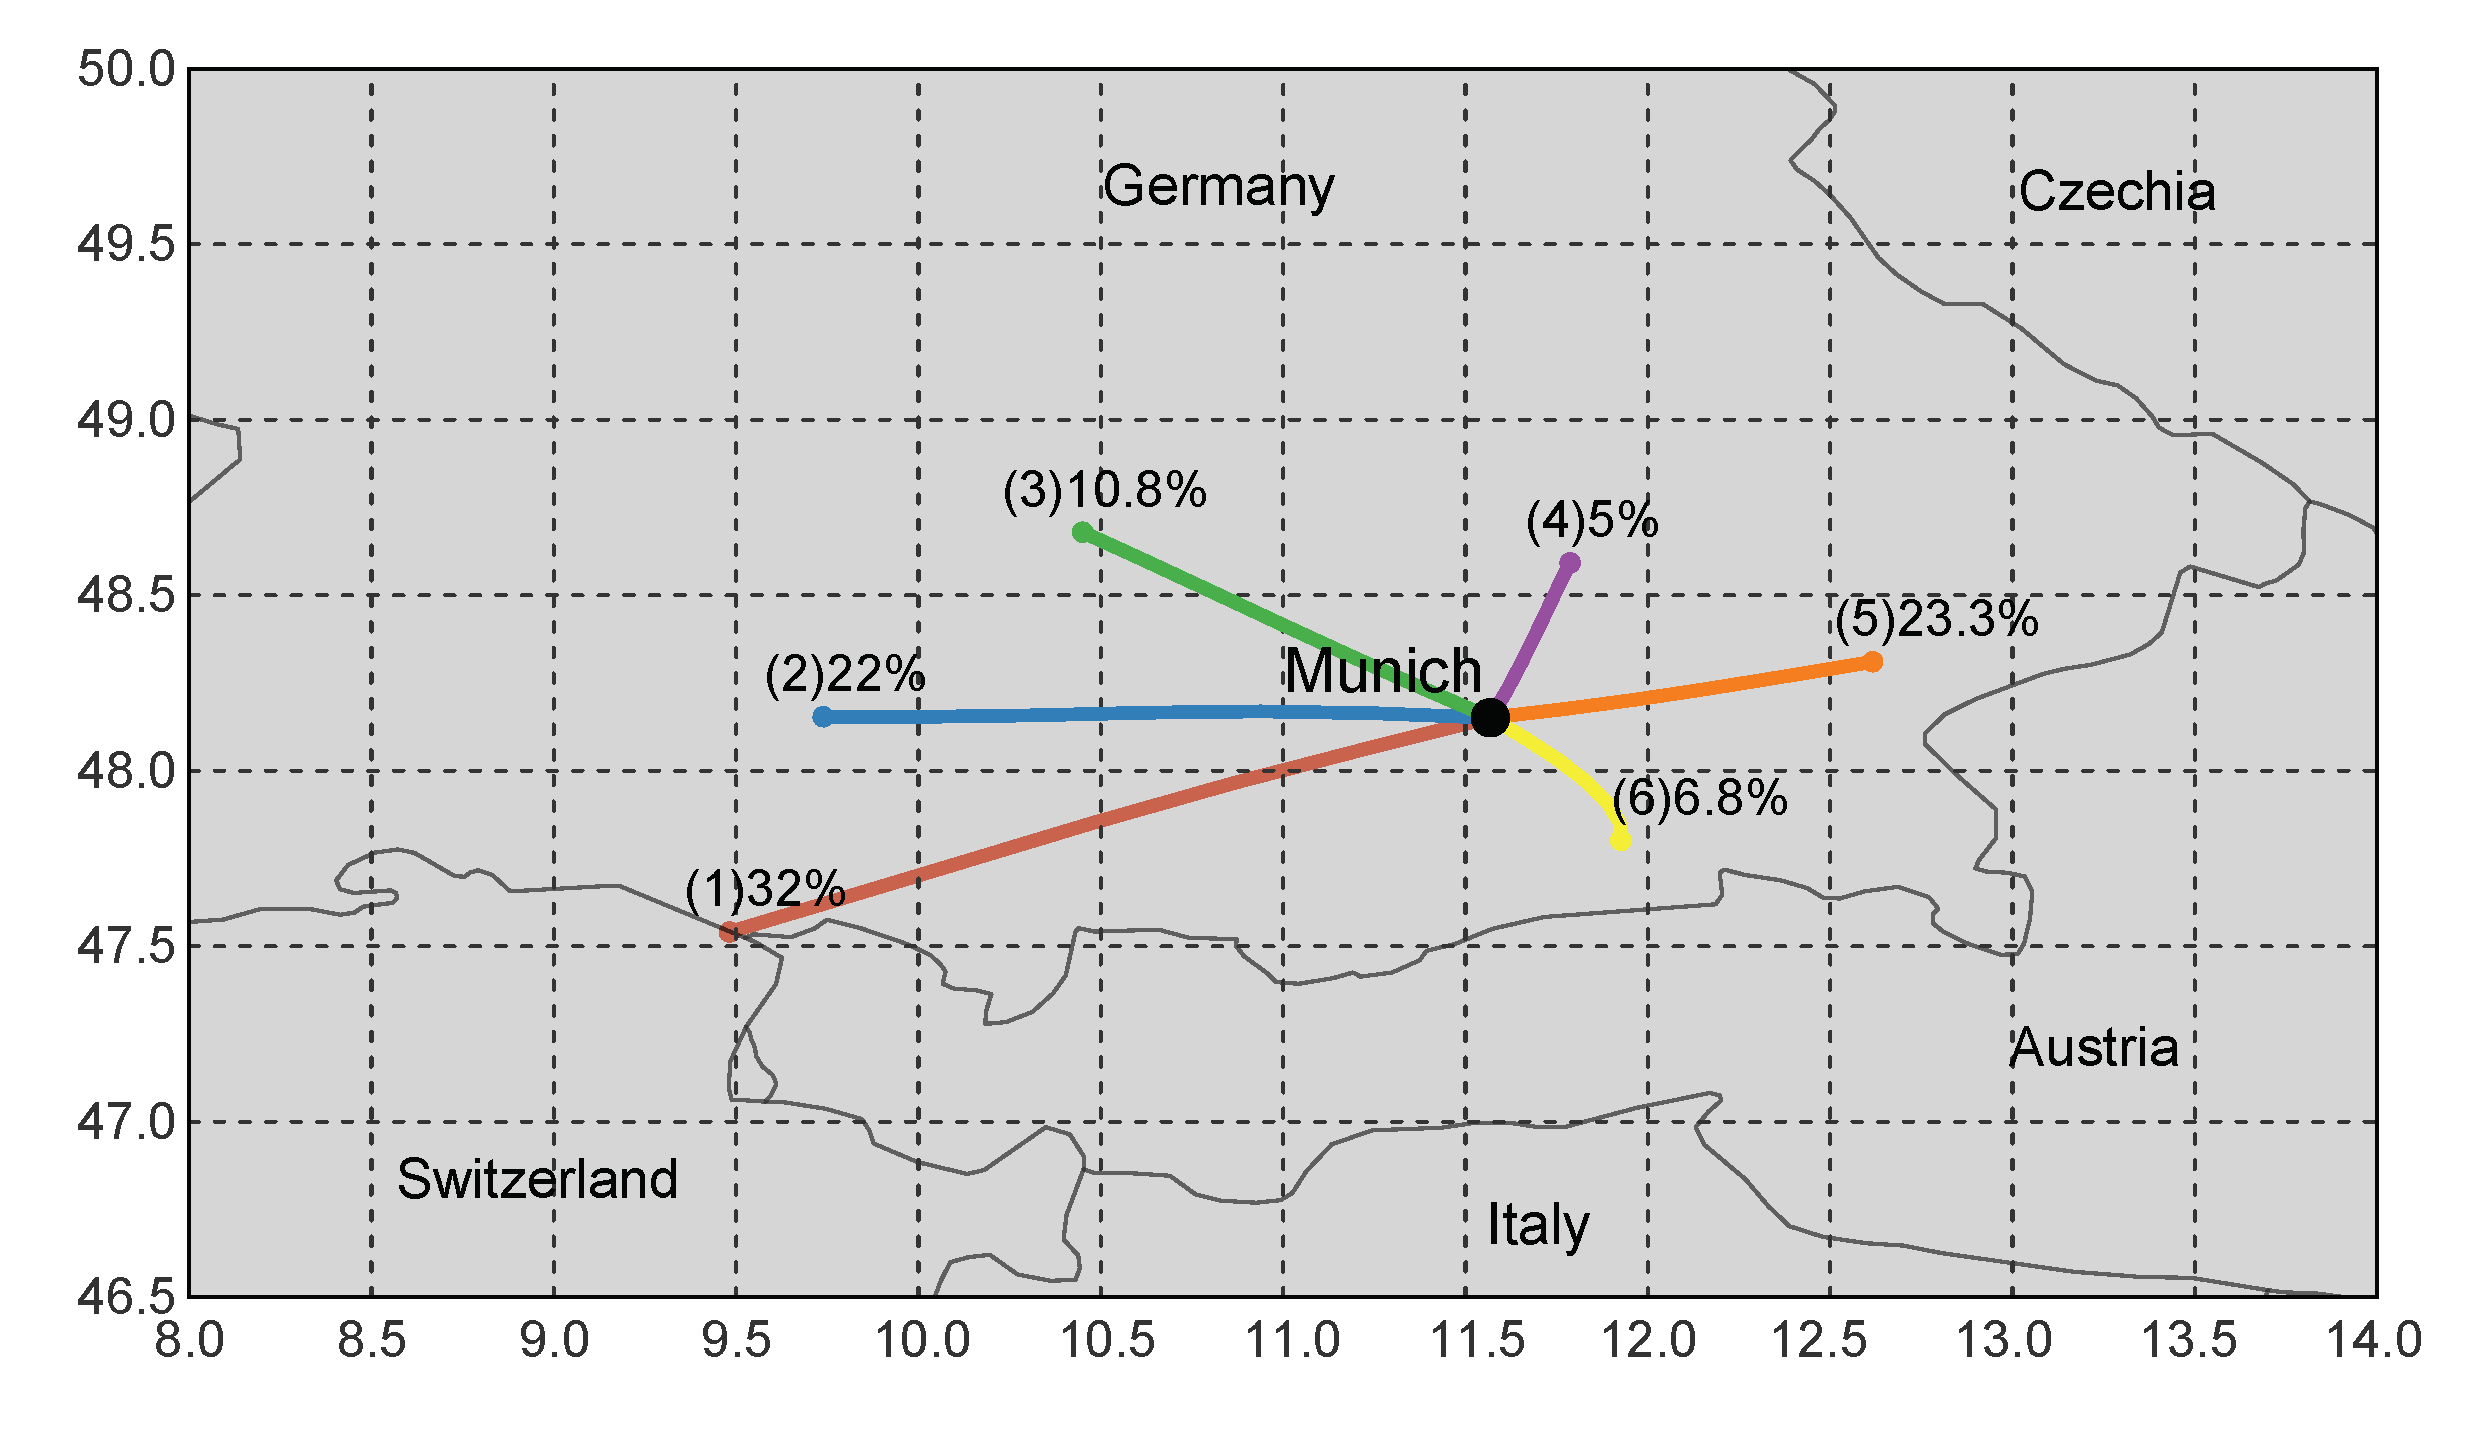
The six transport path clusters based on the six-hour backward trajectories in the wintertime are displayed in Figure 7. It can be seen that the air parcels arriving at the measurement site are mainly from the east (Cluster 6 with 23.3%) and the west (Cluster 1 with 32% and Cluster 2 with 22%), accounting for more than 77% in total. There are few occurrences of air masses from the north (Cluster 3–10.8%, and Cluster 4–5%) and southeast (Cluster 6–6.8%) during these three months. The length of the trajectory cluster correlates with the traveling speed of the air mass. That is, the longer the trajectory cluster is, the faster the air parcels are transported. Here, the trajectories from the west direction (Cluster 1 and Cluster 2) travel at the highest speeds, while the trajectories in Cluster 4 and Cluster 6 move most slowly among all the clusters, and the trajectories in other directions (Cluster 3 and Cluster 5) travel at intermediate speeds.
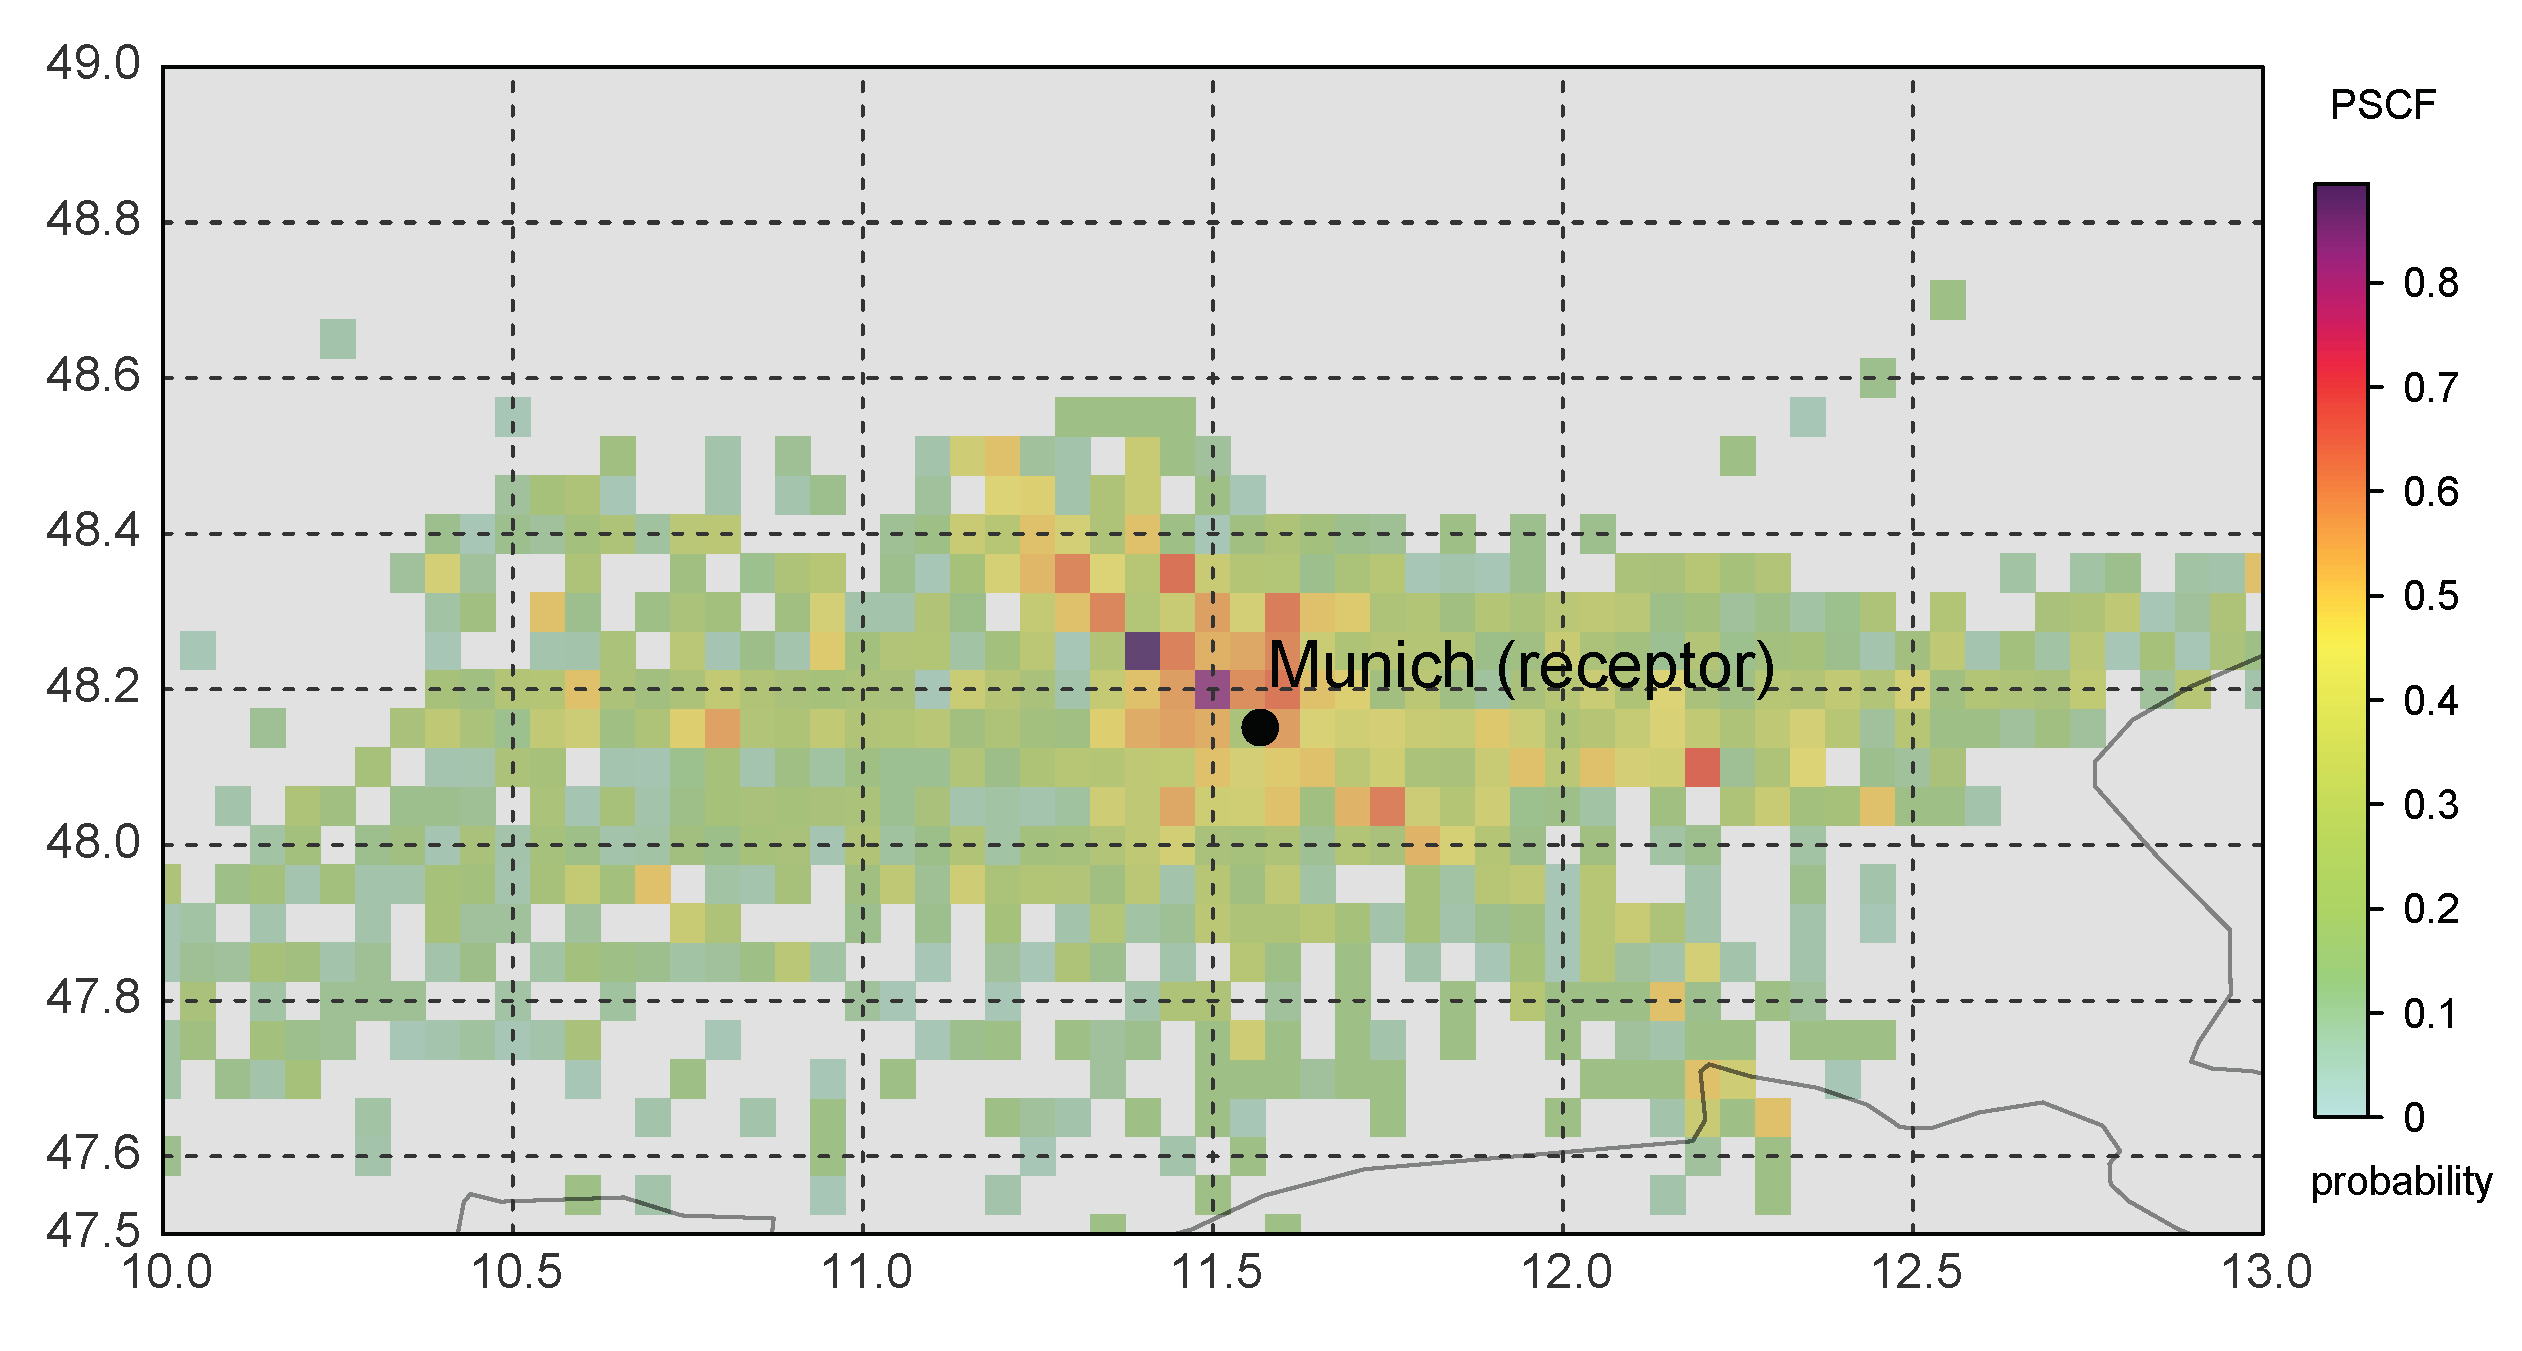
To determine the potential emission sources in Munich, PSCF and CWT plots for CO2 concentrations in winter were calculated from six-hour backward trajectories. The trajectories were sampled on 0.05° × 0.05° grid cells, and the resulting PSCF and CWT plots are shown in Figure 8 and Figure 9, respectively. The cells are colored according to the calculated PSCF probabilities and weighted concentrations, with the dark-red parts illustrating a high probability of source locations and strong emission sources affecting the measurement site. Figure 8 displays the PSCF result using the 75th percentile of the total concentration as the criterion. The map indicates that relevant CO2 sources are highly probable around the measurement site, especially from the north (northwest and northeast) and southeast, which is consistent with the CO2 emission map in Figure S5. The north direction has the highest probability of pollutant emission sources and corresponds to the trajectory Cluster 3 and 4 in Figure 7. The air parcels in Cluster 3 and 4 may be polluted by the local emissions (northwest) and industrial factories (north), and they do not move at high speeds. Therefore, the pollutants from these directions tends to be accumulated inside the city, leading to high concentrations at the receptor. Similar to Cluster 3 and 4, the wind from the southeast (Cluster 6) also travels slowly across the dense polluted area (Altstadt), such that high concentrations can arrive from this direction. All in all, air parcels from these directions will elevate CO2 concentrations at the measurement site. On contrary, the west direction has the lowest probability of air pollution. Taking the trajectory clusters into consideration, the clusters in this orientation (Cluster 1 and 2) have long transport paths (air travels at high speeds). The fresh air from rural areas cleans the polluted air in the city center. Moreover, the Cluster 1 goes across the Alps, indicating fresh air being transported from high altitude regions.
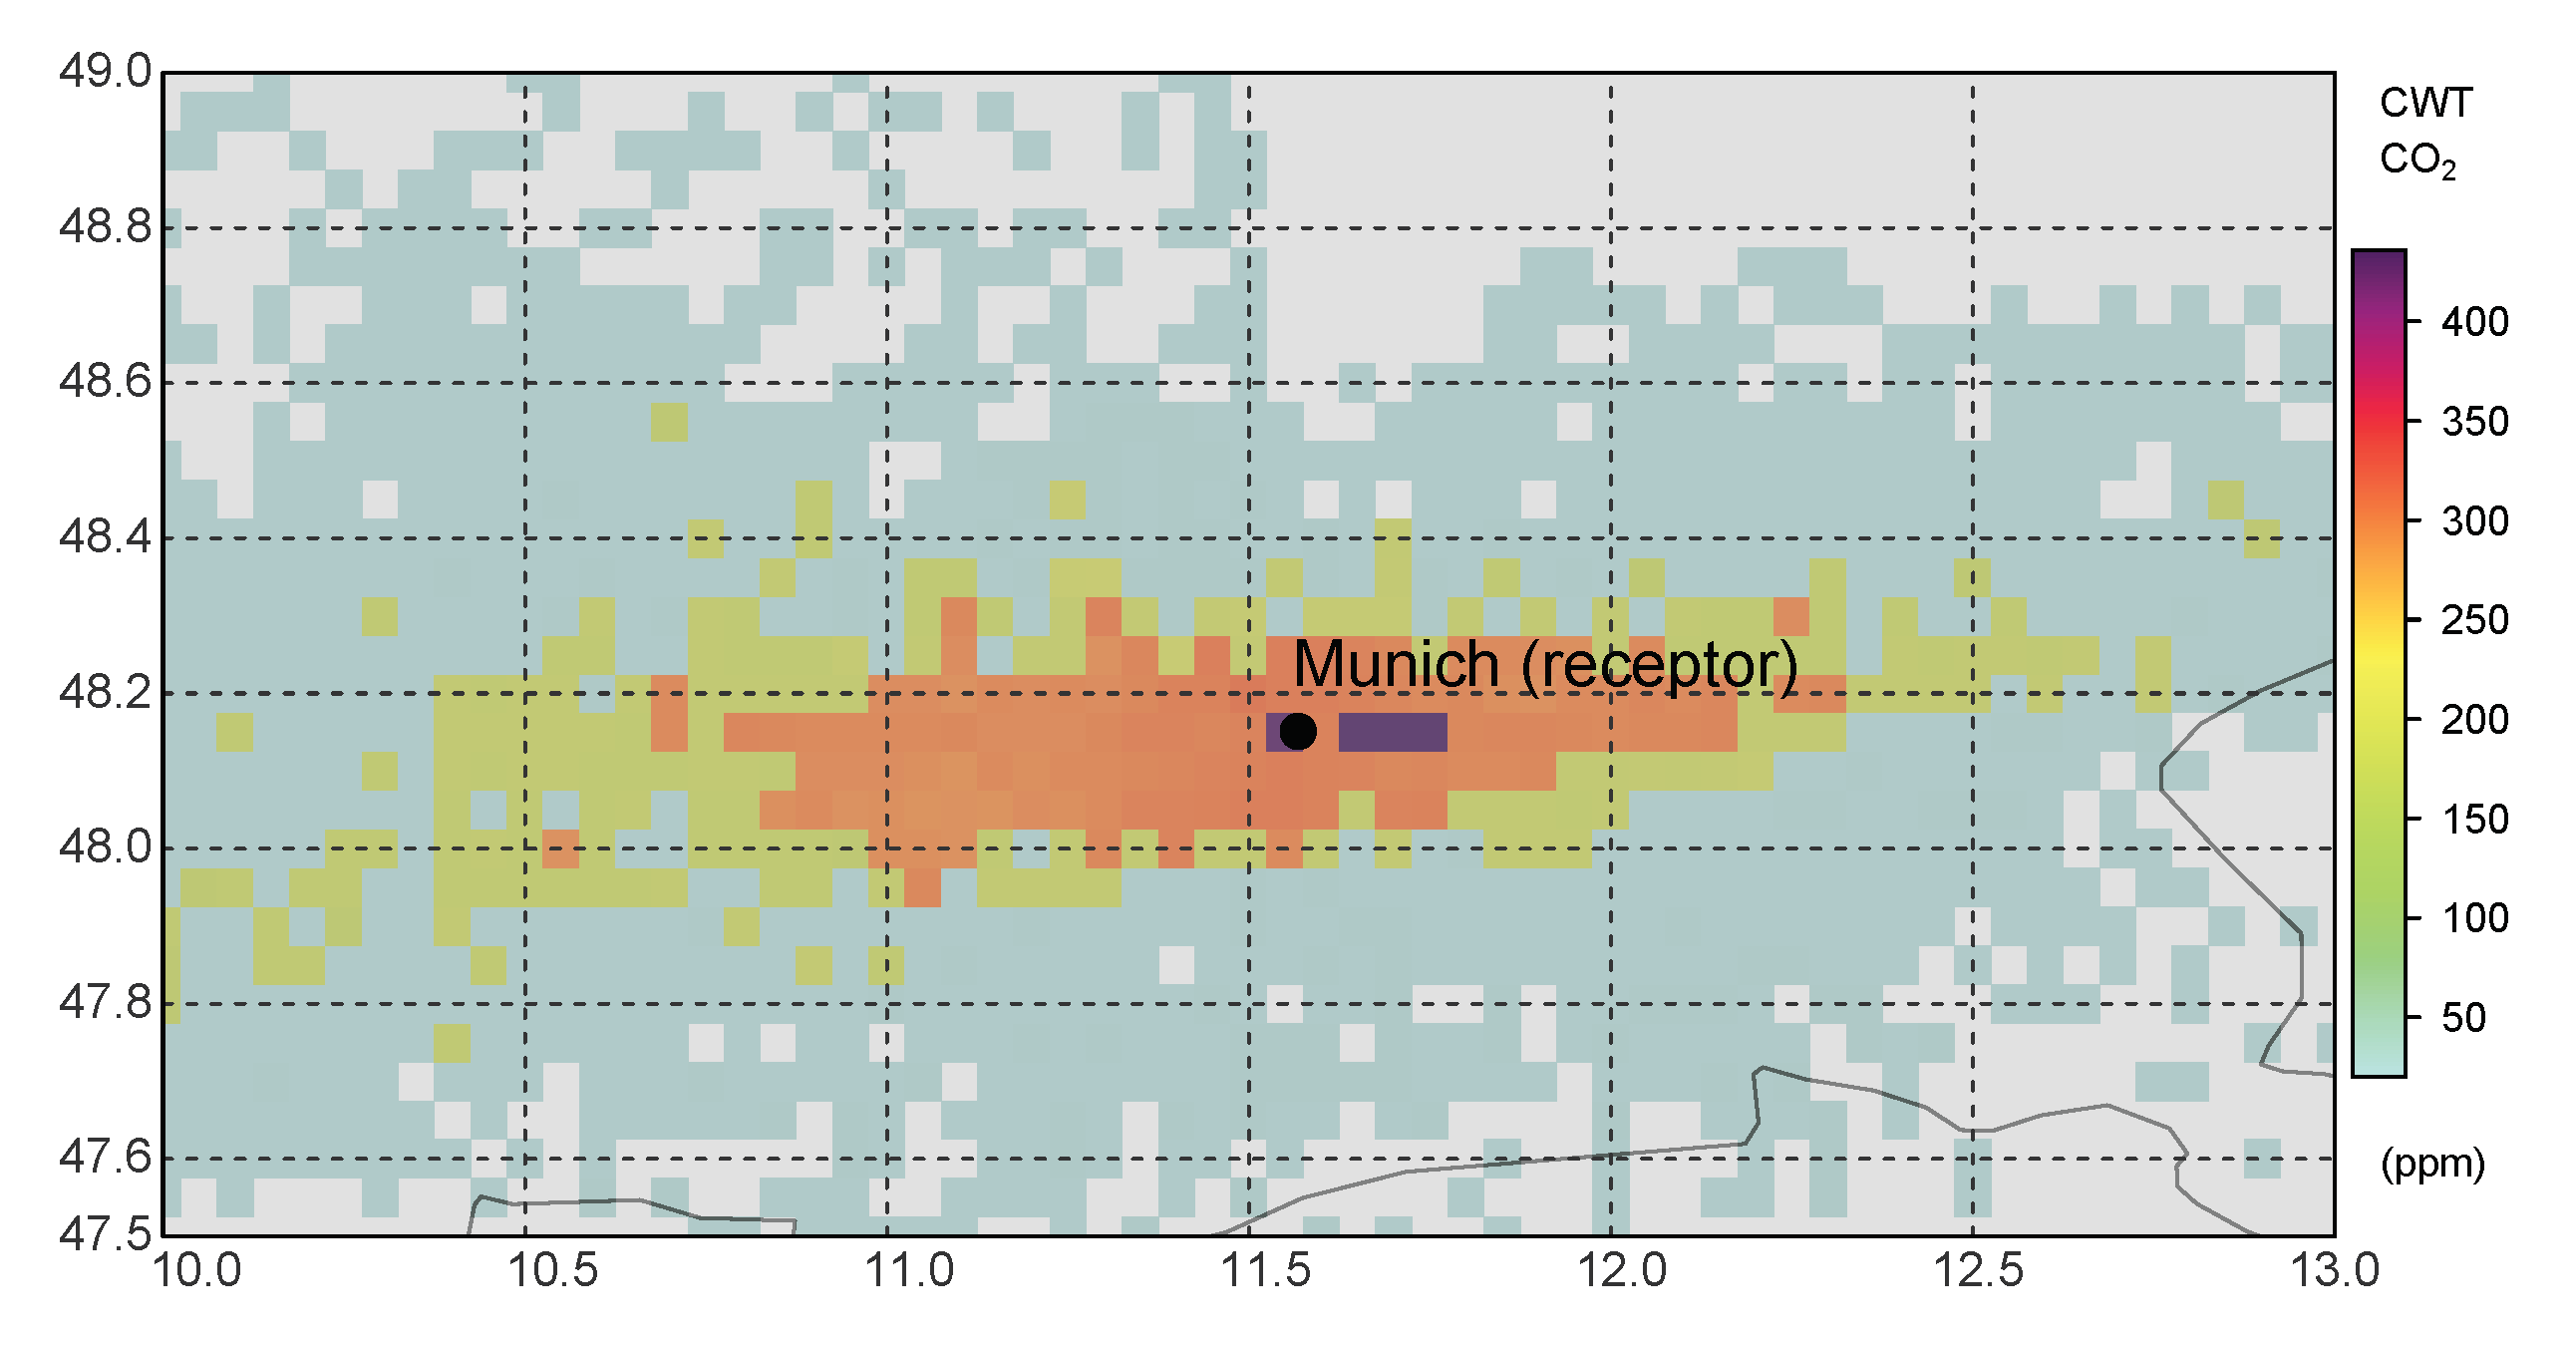
The CWT plot for our wintertime measurements is shown in Figure 9 with the same longitude and latitude ranges as the PSCF in Figure 8. From the CWT map, we can learn that high trajectory weighted concentrations are mostly found near the measurement site, indicating that the local emissions are dominant in Munich (Figure S5 in Supplementary Materials). However, the CWT mapping results are not really fully consistent with the PSCF plot. As shown in Figure 9, high weighted concentration areas are mainly distributed on the east and west of the measurement site. The corresponding trajectory clusters in these directions are Cluster 1, Cluster 2, and Cluster 5, respectively, which are not the same as for the PSCF plot. The reason for the phenomenon may be understood by taking into account the basics of the PSCF and CWT methods (Equations (1) and (3)). As expressed in the formulas, a PSCF contribution in a grid cell is accounted for when the gas concentration is greater than a specific threshold concentration (e.g., 75th percentile of all CO2 concentrations). The high probability (>0.6) in the northwest in Figure 8 reflects that the air parcels from this direction are always corresponding to high concentrations which exceed the criterion, while the Cluster 3 in this direction contains only 10.8% of the trajectories, as shown in Figure 7. The CWT method (Equations (3)) is an algorithm reflecting all of the concentrations observed; not only the high concentrations but the low ones as well. All the air parcel trajectories going through a grid cell will contribute to the total CWT concentration in the cell. When the trajectories in one direction constitute a huge proportion by number and not by concentration, the computed weighted concentration in this direction can still become large in the integration process. Therefore, due to the air parcels often coming from the west (Cluster 1 and Cluster 2 with 54%) and east (Cluster 5 with 23.3%), the weighted concentrations of these two directions become huge. Liu et al. calculated PSCF and CWT maps with unevenly distributed trajectories and obtained consistent results in PSCF and CWT maps [39]. That is because the pollutant emission sources were located in the directions with highly frequent trajectories in their study. For example in their study, a large and heavy industrial area was at the west of the measurement site with trajectories accounting for more than 40%.
Combining the trajectory clustering, PSCF and CWT methods, we observed that CO2 emission sources in Munich mainly lie around the city center, especially in the north and southeast directions. The industrial factories in the north region are very likely the emission sources relevant to the measurement site. Low wind speed, e.g., from the southeast, may result in high CO2 concentration measured at our site. Compared with CWT, the PSCF method is more useful for predicting strong emission sources, since it uses a high observed concentration as a calculation criterion. The CWT method can forecast that local emissions are the primary pollutant sources. However, merely the high frequency of trajectories from the east and west will lead to "exaggerated" concentrations in these directions. Thus, the CWT method should only carefully be used for predicting emission sources when the trajectories are unevenly distributed. If the emission sources are inconsistent with the highly frequent trajectories, the CWT will yield an incorrect prediction result.

5. Conclusions

In this work, we deployed a self-calibrated TDLAS-WMS gas sensor for continuous CO2 concentration measurements at Munich’s city center from February 2018 to January 2019. The precision and accuracy of the sensor were verified with Allan Variance analysis and compared with a commercial LiCor sensor. Using measurement results over one year, the diurnal variations of CO2 concentration averaged by month and workday/weekend in the Munich city center were evaluated and analyzed. The cycles are influenced by various factors. Among all these, VPR and PBL height have the largest impacts, while the anthropogenic activities are less dominant in the diurnal cycles, especially in the warm months (from April to October). The cold months’ data, in contrast, are not so sensitive to these biogenic and atmospheric factors. Due to only one measurement site being studied in the paper, it was difficult to quantitatively analyze the different factors on the diurnal CO2 variations and determine the anthropogenic activities in the warm months.
To study potential anthropogenic CO2 emission sources in Munich, winter CO2 concentration measurements were contrived with a transport modeling analysis. Air parcel backward trajectories were calculated based on the HySPLIT model. The trajectory clustering, PSCF, and CWT methods were employed to identify probable emission sources. The PSCF mapping indicates that the main emission sources are located at the city center, especially on the north and southeast directions of the measurement site. The mapping result is consistent with the CO2 emission inventory in Munich. The CWT shows that high CO2 concentrations can be traced back to local emissions. However, the exact CWT results may have been somewhat skewed by a huge proportion of trajectories from the east and west. Therefore, the PSCF method is more suitable for predicting emission sources. Combined with modeled details of air mass transportation, primary locations of pollutant emission sources can be determined. To better understand the emission and distribution of CO2 and other pollutant gases in cities, we will build a sensor network to observe multiple gas species at different sites. Compared to other commercial gas sensors (e.g., LiCor and Picarro), our sensor has the properties of compactness, self-calibration, and cost-efficiency, and it is easy to operate. With such analysis of the CO2 time series analysis, our sensor was proven to be suitable for long-term pollutant sensing, especially in urban areas.

Supplementary Materials

The following are available online at https://www.mdpi.com/2073-4433/11/1/58/s1: Figure S1: Allan Deviation of CO2 and H2O concentration measurements. Figure S2: Our absolute H2O measurements (unit: ‰, parts per thousand) compared with weather station measurements (Fischer TF sensor). (a) Our measurement data in June versus those of the TF sensors at 2 m and 30 m a.g.l. The temperature is averaged for every day. (b) Linear regression between TF sensor measurements at different levels and TDLAS results. It shows that the TDLAS measurements have better consistency with the TF sensor at 2 m. Figure S3: Ambient temperature averaged over every month. The gray shaded areas denote ± 2 σ of the mean. Figure S4: PBL height in different months. The PBL data were obtained from the HySPLIT model and averaged over every month with hourly data. The gray shaded areas denote ± 2 σ of the means. Figure S5: The yearly fossil fuel and bio fuel CO2 emission map near Munich from a subset of TNO GHGco version 1.1 with resolutions of 1 × 1 km2 (2015, TNO-MACC_III) [48]. The second figure is the enlarged view of Munich city center, where the measurement site and main places are marked in the map.

Author Contributions

L.L. and J.C. designed the TDLAS-WMS sensor; L.L., and X.B. performed the experiments; L.L., H.G., Y.Y., X.Z., A.M., and J.C. analyzed the experimental results and models; L.L., H.G., S.H., X.Z., and Y.B. worked on the backward trajectory simulations; L.L. and X.Z. plotted the CO2 emission map; S.B. supported the SIF data and SIF map; all authors contributed to the interpretation of results and editing the manuscript. All authors have read and agreed to the published version of the manuscript.

Funding

This research received no external funding.

Acknowledgments

The authors gratefully acknowledge VERTILAS GmbH for kindly providing the VCSEL laser in the TDLAS-WMS sensor. We would like to thank Markus Garhammer from Ludwig Maximilian University of Munich (LMU) for supporting the weather data. We want to acknowledge Hugo A.C. Denier van der Gon from TNO for kindly providing the high resolution CO2 inventory in Munich. We thank NOAA ESRL for supporting the Mauna Loa CO2 annual mean data. We wish to thank Florian Dietrich, Ankit Shekhar, and Hanyu Sun in our group for helping on the weather, SIF, and CO2 inventory data, respectively. This work was supported in part by the Institute for Advanced Study (IAS), Technical University of Munich, funded by the German Excellence Initiative and the European Union Seventh Framework Program under grant 291763; and in part by the Chinese Scholarships Council (CSC) under grant 201608080018.

Conflicts of Interest

The authors declare no conflict of interest.

References

  1. Allen, M.; Barros, V.; Broome, J.; Cramer, W.; Christ, R.; Church, J.; Clarke, L.; Dahe, Q.; Dasgupta, P.; Dubash, N.; et al. IPCC Fifth Assessment Synthesis Report-Climate Change 2014 Synthesis Report; Intergovernmental Panel on Climate Change: Geneva, Switzerland, 2014. [Google Scholar]
  2. Levin, I.; Graul, R.; Trivett, N.B. Long-term observations of atmospheric CO2 and carbon isotopes at continental sites in Germany. Tellus B 1995, 47, 23–34. [Google Scholar] [CrossRef] [Green Version]
  3. Hazan, L.; Tarniewicz, J.; Ramonet, M.; Laurent, O.; Abbaris, A. Automatic processing of atmospheric CO2 and CH4 mole fractions at the ICOS Atmosphere Thematic Centre. Atmos. Meas. Tech. 2016, 9, 4719–4736. [Google Scholar] [CrossRef] [Green Version]
  4. Yuan, Y.; Ries, L.; Petermeier, H.; Trickl, T.; Leuchner, M.; Couret, C.; Sohmer, R.; Meinhardt, F.; Menzel, A. On the diurnal, weekly, and seasonal cycles and annual trends in atmospheric CO2 at Mount Zugspitze, Germany, during 1981–2016. Atmos. Chem. Phys. 2019, 19, 999–1012. [Google Scholar] [CrossRef] [Green Version]
  5. Hamazaki, T.; Kaneko, Y.; Kuze, A.; Kondo, K. Fourier transform spectrometer for greenhouse gases observing satellite (GOSAT). In Enabling Sensor and Platform Technologies for Spaceborne Remote Sensing; International Society for Optics and Photonics: Bellingham, WA, USA, 2005; Volume 5659, pp. 73–81. [Google Scholar]
  6. Berger, M.; Moreno, J.; Johannessen, J.A.; Levelt, P.F.; Hanssen, R.F. ESA’s sentinel missions in support of Earth system science. Remote Sens. Environ. 2012, 120, 84–90. [Google Scholar] [CrossRef]
  7. Crisp, D.; Pollock, H.R.; Rosenberg, R.; Chapsky, L.; Lee, R.A.; Oyafuso, F.A.; Frankenberg, C.; O’Dell, C.W.; Bruegge, C.J.; Doran, G.B.; et al. The on-orbit performance of the Orbiting Carbon Observatory-2 (OCO-2) instrument and its radiometrically calibrated products. Atmos. Meas. Tech. 2017, 10, 59–81. [Google Scholar] [CrossRef] [Green Version]
  8. Wunch, D.; Toon, G.C.; Blavier, J.F.L.; Washenfelder, R.A.; Notholt, J.; Connor, B.J.; Griffith, D.W.; Sherlock, V.; Wennberg, P.O. The total carbon column observing network. Philos. Trans. R. Soc. A Math. Phys. Eng. Sci. 2011, 369, 2087–2112. [Google Scholar] [CrossRef] [PubMed] [Green Version]
  9. Hase, F.; Frey, M.; Blumenstock, T.; Groß, J.; Kiel, M.; Kohlhepp, R.; Mengistu Tsidu, G.; Schäfer, K.; Sha, M.; Orphal, J. Application of portable FTIR spectrometers for detecting greenhouse gas emissions of the major city Berlin. Atmos. Meas. Tech. 2015, 8, 3059–3068. [Google Scholar] [CrossRef] [Green Version]
  10. Chen, J.; Viatte, C.; Hedelius, J.; Jones, T.; Franklin, J.; Parker, H.; Gottlieb, E.; Wennberg, P.; Dubey, M.; Wofsy, S. Differential column measurements using compact solar-tracking spectrometers. Atmos. Chem. Phys. 2016, 16, 8479–8498. [Google Scholar] [CrossRef] [Green Version]
  11. Frey, M.; Sha, M.K.; Hase, F.; Kiel, M.; Blumenstock, T.; Harig, R.; Surawicz, G.; Deutscher, N.M.; Shiomi, K.; Franklin, J.E.; et al. Building the COllaborative Carbon Column Observing Network (COCCON): long-term stability and ensemble performance of the EM27/SUN Fourier transform spectrometer. Atmos. Meas. Tech. 2019, 12, 1513–1530. [Google Scholar] [CrossRef] [Green Version]
  12. Büns, C.; Kuttler, W. Path-integrated measurements of carbon dioxide in the urban canopy layer. Atmos. Environ. 2012, 46, 237–247. [Google Scholar] [CrossRef]
  13. Jin, F.; Fang, Y.; Chen, T.; Li, D.; Kim, J.; Park, M.K.; Park, S.; Kim, K.R. In situ measurement of atmospheric carbon dioxide at Yanbian, China: Estimating its northeast Asian emission regions. Sci. China Earth Sci. 2012, 55, 1742–1754. [Google Scholar] [CrossRef]
  14. Röckmann, T.; Eyer, S.; Veen, C.V.d.; Popa, M.E.; Tuzson, B.; Monteil, G.; Houweling, S.; Harris, E.; Brunner, D.; Fischer, H.; et al. In situ observations of the isotopic composition of methane at the Cabauw tall tower site. Atmos. Chem. Phys. 2016, 16, 10469–10487. [Google Scholar] [CrossRef] [Green Version]
  15. Brosy, C.; Krampf, K.; Zeeman, M.; Wolf, B.; Junkermann, W.; Schäfer, K.; Emeis, S.; Kunstmann, H. Simultaneous multicopter-based air sampling and sensing of meteorological variables. Atmos. Meas. Tech. 2017, 10, 2773–2784. [Google Scholar] [CrossRef] [Green Version]
  16. Schäfer, K.; Zeeman, M.; Brosy, C.; Münkel, C.; Fersch, B.; Mauder, M.; Emeis, S. Methane distributions and transports in the nocturnal boundary layer at a rural station. In Remote Sensing of Clouds and the Atmosphere XXI; International Society for Optics and Photonics: Bellingham, WA, USA, 2016; Volume 10001, p. 1000103. [Google Scholar]
  17. Yasuda, T.; Yonemura, S.; Tani, A. Comparison of the characteristics of small commercial NDIR CO2 sensor models and development of a portable CO2 measurement device. Sensors 2012, 12, 3641–3655. [Google Scholar] [CrossRef] [Green Version]
  18. Lietzke, B.; Vogt, R. Variability of CO2 concentrations and fluxes in and above an urban street canyon. Atmos. Environ. 2013, 74, 60–72. [Google Scholar] [CrossRef]
  19. Ueyama, M.; Ando, T. Diurnal, weekly, seasonal, and spatial variabilities in carbon dioxide flux in different urban landscapes in Sakai, Japan. Atmos. Chem. Phys. 2016, 16, 14727–14740. [Google Scholar] [CrossRef] [Green Version]
  20. Gao, Y.; Lee, X.; Liu, S.; Hu, N.; Wei, X.; Hu, C.; Liu, C.; Zhang, Z.; Yang, Y. Spatiotemporal variability of the near-surface CO2 concentration across an industrial-urban-rural transect, Nanjing, China. Sci. Total Environ. 2018, 631, 1192–1200. [Google Scholar] [CrossRef]
  21. Moore, J.; Jacobson, A. Seasonally varying contributions to urban CO2 in the Chicago, Illinois, USA region: Insights from a high-resolution CO2 concentration and δ13C record. Elem. Sci. Anth. 2015, 3, 000052. [Google Scholar] [CrossRef] [Green Version]
  22. Kooijmans, L.M.; Uitslag, N.A.; Zahniser, M.S.; Nelson, D.D.; Montzka, S.A.; Chen, H. Continuous and high-precision atmospheric concentration measurements of COS, CO2, CO and H2O using a quantum cascade laser spectrometer (QCLS). Atmos. Meas. Tech. 2016, 9, 5293–5314. [Google Scholar] [CrossRef] [Green Version]
  23. Graf, M.; Emmenegger, L.; Tuzson, B. Compact, circular, and optically stable multipass cell for mobile laser absorption spectroscopy. Opt. Lett. 2018, 43, 2434–2437. [Google Scholar] [CrossRef]
  24. Lan, L.; Chen, J.; Wu, Y.; Bai, Y.; Bi, X.; Li, Y. Self-Calibrated Multiharmonic CO2 Sensor Using VCSEL for Urban In Situ Measurement. IEEE Trans. Instrum. Meas. 2018, 68, 1140–1147. [Google Scholar] [CrossRef]
  25. Lan, L.; Chen, J.; Zhao, X.; Ghasemifard, H. VCSEL-Based Atmospheric Trace Gas Sensor Using First Harmonic Detection. IEEE Sens. J. 2019, 19, 4923–4931. [Google Scholar] [CrossRef]
  26. Sparks, N.; Toumi, R. Remote sampling of a CO2 point source in an urban setting. Atmos. Environ. 2010, 44, 5287–5294. [Google Scholar] [CrossRef]
  27. Rice, A.; Bostrom, G. Measurements of carbon dioxide in an Oregon metropolitan region. Atmos. Environ. 2011, 45, 1138–1144. [Google Scholar] [CrossRef]
  28. Bréon, F.; Broquet, G.; Puygrenier, V.; Chevallier, F.; Xueref-Remy, I.; Ramonet, M.; Dieudonné, E.; Lopez, M.; Schmidt, M.; Perrussel, O.; et al. An attempt at estimating Paris area CO2 emissions from atmospheric concentration measurements. Atmos. Chem. Phys. 2015, 15, 1707–1724. [Google Scholar] [CrossRef] [Green Version]
  29. Hu, C.; Liu, S.; Wang, Y.; Zhang, M.; Xiao, W.; Wang, W.; Xu, J. Anthropogenic CO2 emissions from a megacity in the Yangtze River Delta of China. Environ. Sci. Pollut. Res. 2018, 25, 23157–23169. [Google Scholar] [CrossRef]
  30. Chen, J.; Hangauer, A.; Strzoda, R.; Amann, M.C. VCSEL-based calibration-free carbon monoxide sensor at 2.3 μm with in-line reference cell. Appl. Phys. B 2011, 102, 381–389. [Google Scholar] [CrossRef] [Green Version]
  31. Liu, C.; Tuzson, B.; Scheidegger, P.; Looser, H.; Bereiter, B.; Graf, M.; Hundt, M.; Aseev, O.; Maas, D.; Emmenegger, L. Laser driving and data processing concept for mobile trace gas sensing: Design and implementation. Rev. Sci. Instrum. 2018, 89, 065107. [Google Scholar] [CrossRef] [Green Version]
  32. Chen, J.; Hangauer, A.; Strzoda, R.; Amann, M.C. Laser spectroscopic oxygen sensor using diffuse reflector based optical cell and advanced signal processing. Appl. Phys. B 2010, 100, 417–425. [Google Scholar] [CrossRef] [Green Version]
  33. Hangauer, A.; Chen, J.; Strzoda, R.; Amann, M.C. Multi-harmonic detection in wavelength modulation spectroscopy systems. Appl. Phys. B 2013, 110, 177–185. [Google Scholar] [CrossRef]
  34. Lan, L.; Ding, Y.; Peng, Z.; Du, Y.; Liu, Y. Calibration-free wavelength modulation for gas sensing in tunable diode laser absorption spectroscopy. Appl. Phys. B 2014, 117, 1211–1219. [Google Scholar] [CrossRef]
  35. Draxler, R.R.; Hess, G. An overview of the HYSPLIT_4 modelling system for trajectories. Aust. Meteorolog. Mag. 1998, 47, 295–308. [Google Scholar]
  36. Ghasemifard, H.; Yuan, Y.; Luepke, M.; Schunk, C.; Chen, J.; Ries, L.; Leuchner, M.; Menzel, A. Atmospheric CO2 and δ13C Measurements from 2012 to 2014 at the Environmental Research Station Schneefernerhaus, Germany: Technical Corrections, Temporal Variations and Trajectory Clustering. Aerosol Air Qual. Res. 2019, 19, 657–670. [Google Scholar] [CrossRef] [Green Version]
  37. Ghasemifard, H.; Vogel, F.R.; Yuan, Y.; Luepke, M.; Chen, J.; Ries, L.; Leuchner, M.; Schunk, C.; Noreen Vardag, S.; Menzel, A. Pollution Events at the High-AltitudeMountain Site Zugspitze-Schneefernerhaus (2670 m a.s.l.), Germany. Atmosphere 2019, 10, 330. [Google Scholar] [CrossRef] [Green Version]
  38. Wang, Y.; Zhang, X.; Draxler, R.R. TrajStat: GIS-based software that uses various trajectory statistical analysis methods to identify potential sources from long-term air pollution measurement data. Environ. Model. Softw. 2009, 24, 938–939. [Google Scholar] [CrossRef]
  39. Liu, N.; Yu, Y.; He, J.; Zhao, S. Integrated modeling of urban–scale pollutant transport: application in a semi–arid urban valley, Northwestern China. Atmos. Pollut. Res. 2013, 4, 306–314. [Google Scholar] [CrossRef] [Green Version]
  40. Hangauer, A.; Chen, J.; Strzoda, R.; Amann, M.C. The frequency modulation response of vertical-cavity surface-emitting lasers: experiment and theory. IEEE J. Sel. Top. Quantum Electron. 2011, 17, 1584–1593. [Google Scholar] [CrossRef]
  41. Allan, D. Statistics of atomic frequency standards. Proc. IEEE 1966, 54, 221–230. [Google Scholar] [CrossRef] [Green Version]
  42. Werle, P.; Mücke, R.; Slemr, F. The limits of signal averaging in atmospheric trace-gas monitoring by tunable diode-laser absorption spectroscopy (TDLAS). Appl. Phys. B 1993, 57, 131–139. [Google Scholar] [CrossRef]
  43. Stull, R. An Introduction to Boundary Layer Meteorology; Springer Science & Business Media: Dordrecht, The Netherlands, 2012; Volume 13. [Google Scholar]
  44. Seinfeld, J.H.; Pandis, S.N. Atmospheric Chemistry and Physics: From Air Pollution to Climate Change; John Wiley & Sons: Hoboken, NJ, USA, 2016. [Google Scholar]
  45. Newman, S.; Jeong, S.; Fischer, M.; Xu, X.; Haman, C.; Lefer, B.; Alvarez, S.; Rappenglueck, B.; Kort, E.; Andrews, A.; et al. Diurnal tracking of anthropogenic CO2 emissions in the Los Angeles basin megacity during spring 2010. Atmos. Chem. Phys. 2013, 13, 4359–4372. [Google Scholar] [CrossRef] [Green Version]
  46. Frankenberg, C.; Butz, A.; Toon, G. Disentangling chlorophyll fluorescence from atmospheric scattering effects in O2 A-band spectra of reflected sun-light. Geophys. Res. Lett. 2011, 38, L03801. [Google Scholar] [CrossRef]
  47. Frankenberg, C.; O’Dell, C.; Berry, J.; Guanter, L.; Joiner, J.; Köhler, P.; Pollock, R.; Taylor, T.E. Prospects for chlorophyll fluorescence remote sensing from the Orbiting Carbon Observatory-2. Remote Sens. Environ. 2014, 147, 1–12. [Google Scholar] [CrossRef] [Green Version]
  48. Super, I.; Dellaert, S.N.; Visschedijk, A.J.; van der Gon, H.A.D. Uncertainty analysis of a European high-resolution emission inventory of CO2 and CO to support inverse modelling and network design. Atmos. Chem. Phys. Discuss. 2019. [Google Scholar] [CrossRef]
  49. Thoning, K.W.; Tans, P.P.; Komhyr, W.D. Atmospheric carbon dioxide at Mauna Loa Observatory: 2. Analysis of the NOAA GMCC data, 1974–1985. J. Geophys. Res. Atmos. 1989, 94, 8549–8565. [Google Scholar] [CrossRef]
  50. Vogt, R.; Christen, A.; Rotach, M.; Roth, M.; Satyanarayana, A. Temporal dynamics of CO2 fluxes and profiles over a Central European city. Theor. Appl. Climatol. 2006, 84, 117–126. [Google Scholar] [CrossRef]
  51. García, M.Á.; Sánchez, M.L.; Pérez, I.A. Differences between carbon dioxide levels over suburban and rural sites in Northern Spain. Environ. Sci. Pollut. Res. 2012, 19, 432–439. [Google Scholar] [CrossRef]
  52. Munich.Landeshauptstadt. Traffic. Available online: https://www.muenchen.de/rathaus/Stadtverwaltung/Referat-fuer-Stadtplanung-und-Bauordnung/Verkehrsplanung/Verkehrsmodell-VisMuc.html (accessed on 29 December 2019).
  53. Zhao, X.; Marshall, J.; Hachinger, S.; Gerbig, C.; Frey, M.; Hase, F.; Chen, J. Analysis of total column CO2 and CH4 measurements in Berlin with WRF-GHG. Atmos. Chem. Phys. 2019, 19, 11279–11302. [Google Scholar] [CrossRef] [Green Version]
  54. Stein, A.; Draxler, R.R.; Rolph, G.D.; Stunder, B.J.; Cohen, M.; Ngan, F. NOAA’s HYSPLIT atmospheric transport and dispersion modeling system. Bull. Am. Meteorolog. Soc. 2015, 96, 2059–2077. [Google Scholar] [CrossRef]
  55. Ashbaugh, L.L.; Malm, W.C.; Sadeh, W.Z. A residence time probability analysis of sulfur concentrations at Grand Canyon National Park. Atmos. Environ. (1967) 1985, 19, 1263–1270. [Google Scholar] [CrossRef]
  56. Hsu, Y.K.; Holsen, T.M.; Hopke, P.K. Comparison of hybrid receptor models to locate PCB sources in Chicago. Atmos. Environ. 2003, 37, 545–562. [Google Scholar] [CrossRef]
  57. Kabashnikov, V.P.; Chaikovsky, A.P.; Kucsera, T.L.; Metelskaya, N.S. Estimated accuracy of three common trajectory statistical methods. Atmos. Environ. 2011, 45, 5425–5430. [Google Scholar] [CrossRef]
  58. Lupu, A.; Maenhaut, W. Application and comparison of two statistical trajectory techniques for identification of source regions of atmospheric aerosol species. Atmos. Environ. 2002, 36, 5607–5618. [Google Scholar] [CrossRef]
  59. Carslaw, D.C.; Ropkins, K. openair—An R package for air quality data analysis. Environ. Model. Softw. 2012, 27, 52–61. [Google Scholar] [CrossRef]
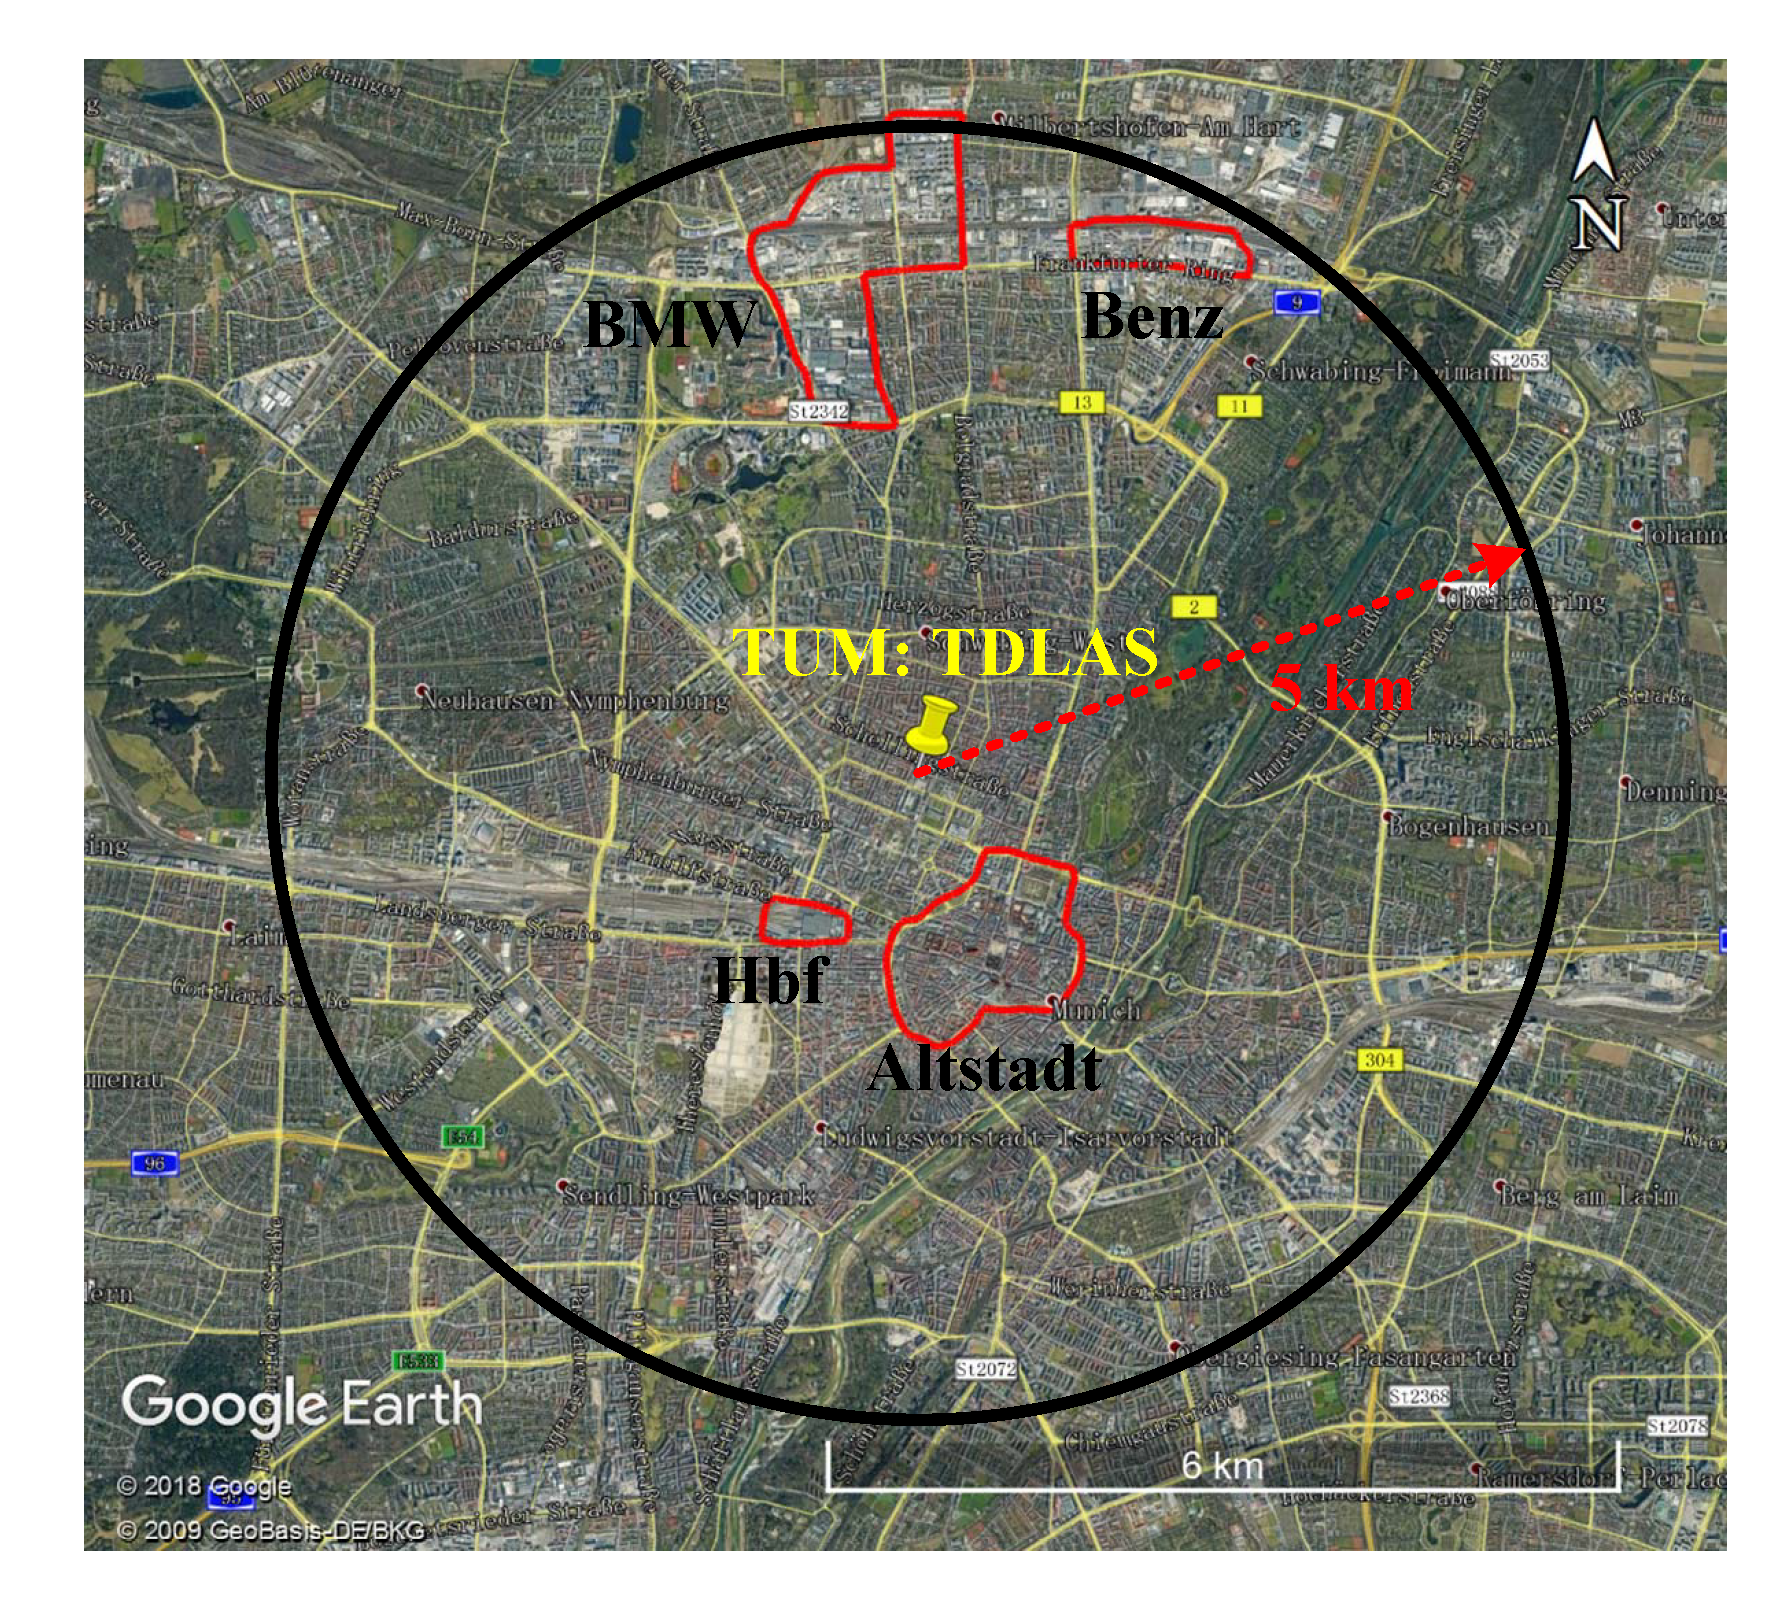
Figure 1. Detailed locations of the TDLAS-WMS measurement site and its surroundings in Munich. The Central Train Station (Hbf), Old Town (Altstadt), and main factories (BMW and Benz) are within a circle with a radius of 5 km around the measurement site. Map provided by Google Earth and GeoBasis DE/BKG. (Germany/Federal Agency for Cartography and Geodesy).
Atmosphere 11 00058 g001
Figure 2. Schematic diagram of TDLAS-WMS sensor. Left: optical light path; right: concentration calculation using multi-harmonic signals. The signals in the lock-in amplifier (LIA) are the first to third harmonics.
Atmosphere 11 00058 g002
Figure 3. (a) Solar-induced fluorescence (SIF) variability in Munich and its surroundings from November 2017 to November 2018. The SIF data is obtained from the OCO-2 satellite (available at: https://co2.jpl.nasa.gov/build/?dataset=OCO2L2Stdv8&product=FULL; accessed on: 18 December 2019). (b,c) the OCO-2 tracks during the study period. (c) is the enlarged view of the black block in (b) which is the spatial domain (10–13° E, 47.5–49° N) for calculating the daily mean SIF. The red rectangular in (c) denotes the domain of Munich.
Atmosphere 11 00058 g003
Figure 4. Diurnal variations of CO2 concentration based on measurements from February 2018 to January 2019 in Munich’s city center averaged for each month. The gray shaded areas denote ± 2 σ of the means. The minimum, maximum. and mean values of the curves are given in each subplot. The blue-dashed lines are the NOAA Mauna Loa CO2 monthly mean concentration [49]. (LT: local time).
Atmosphere 11 00058 g004
Figure 5. Summary of CO2 concentration variations on the monthly plots. The dashed line is the NOAA Mauna Loa CO2 monthly mean concentration.
Atmosphere 11 00058 g005
Figure 6. Diurnal variations of CO2 concentration for workdays versus weekends. The shaded areas are ± 2 σ of the means. The minimum and maximum values are marked in the plot.
Atmosphere 11 00058 g006
Figure 7. Clustering of the wintertime (February and December 2018, and January 2019) trajectories arriving at the measurement site, the black circle is the measurement site.
Atmosphere 11 00058 g007
Figure 8. PSCF (potential source contribution function) plot of CO2 concentration measured during wintertime with 75th percentile of CO2, based on six-hour backward trajectories (CO2 concentration: 437 ppm), the black circle is the measurement site.
Atmosphere 11 00058 g008
Figure 9. CWT (concentration weighted trajectory) plot of CO2 concentration measured during wintertime, based on six-hour backward trajectories, the black circle is the measurement site.
Atmosphere 11 00058 g009