Estimating Sunshine Duration Using Hourly Total Cloud Amount Data from a Geostationary Meteorological Satellite


 ,
, 
 ,
,
Abstract
1. Introduction
2. Materials and Methods
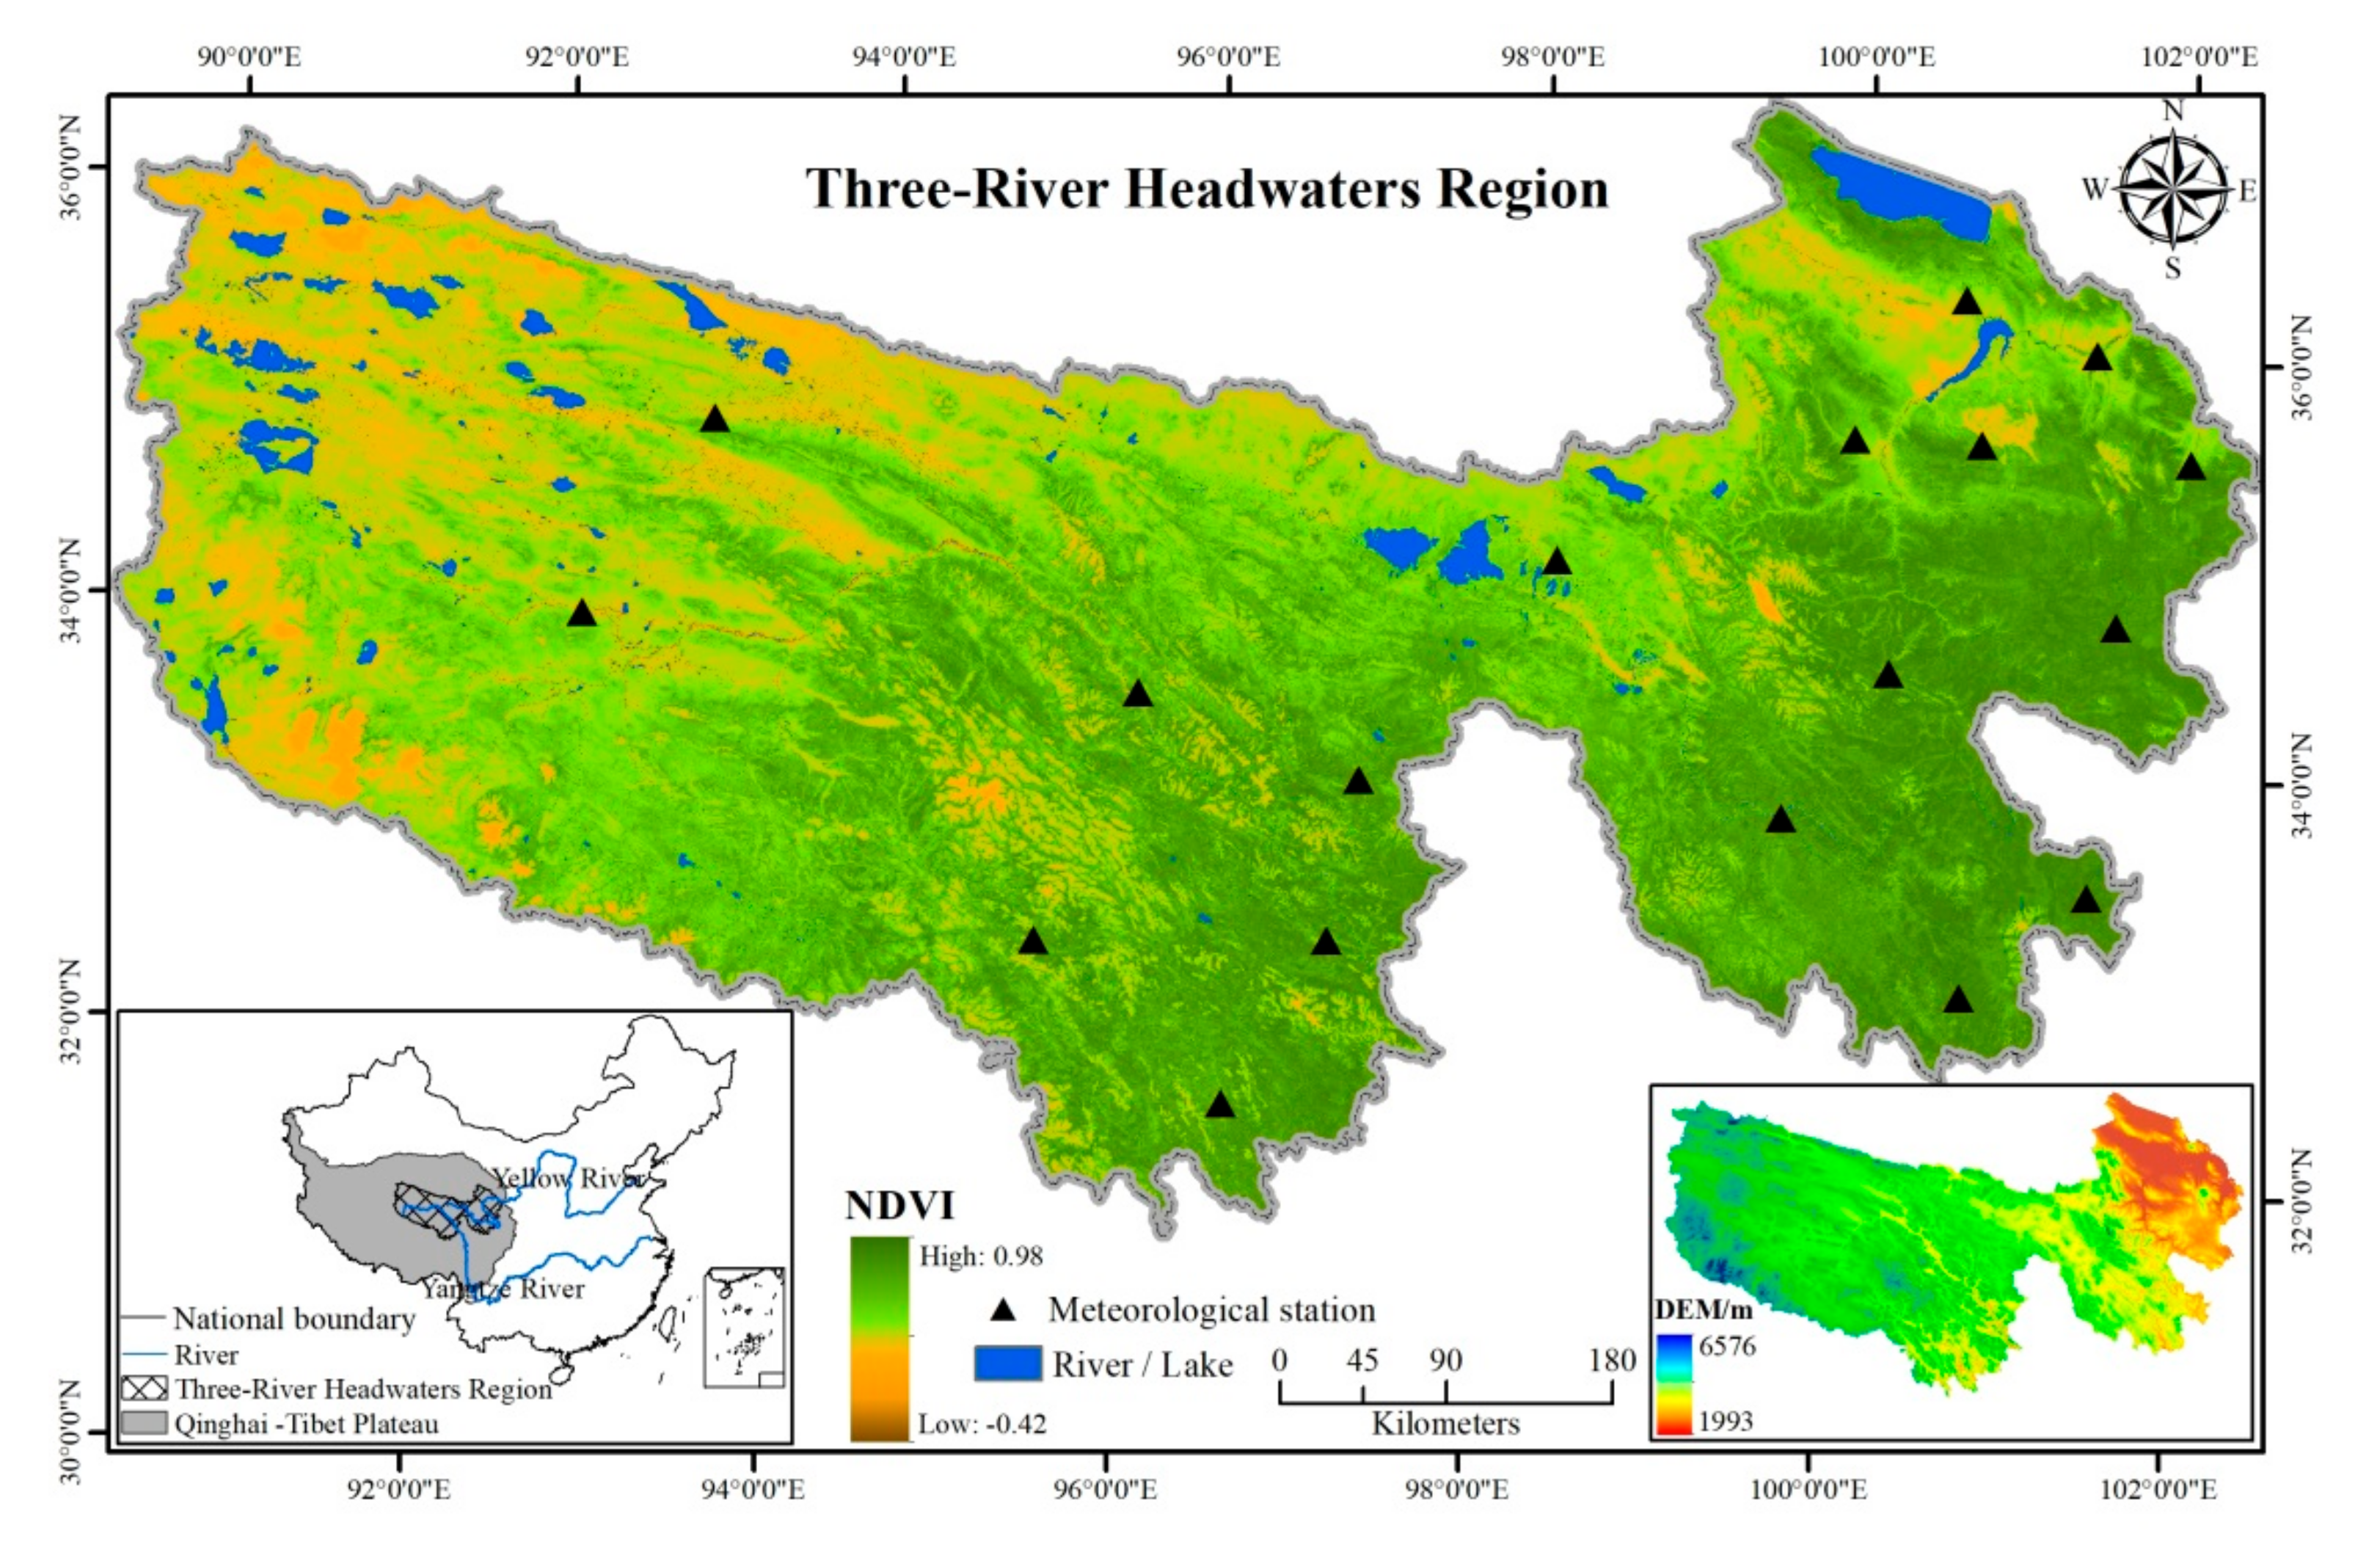
2.1. Study Site and Datasets
2.2. Methodology
2.2.1. Data and Pre-Processing Methods
Sunshine Duration Observation Data
Geostationary Meteorological Satellite Total Cloud Amount Data
2.2.2. Modeling Sunshine Duration
Estimation of Sunshine Duration
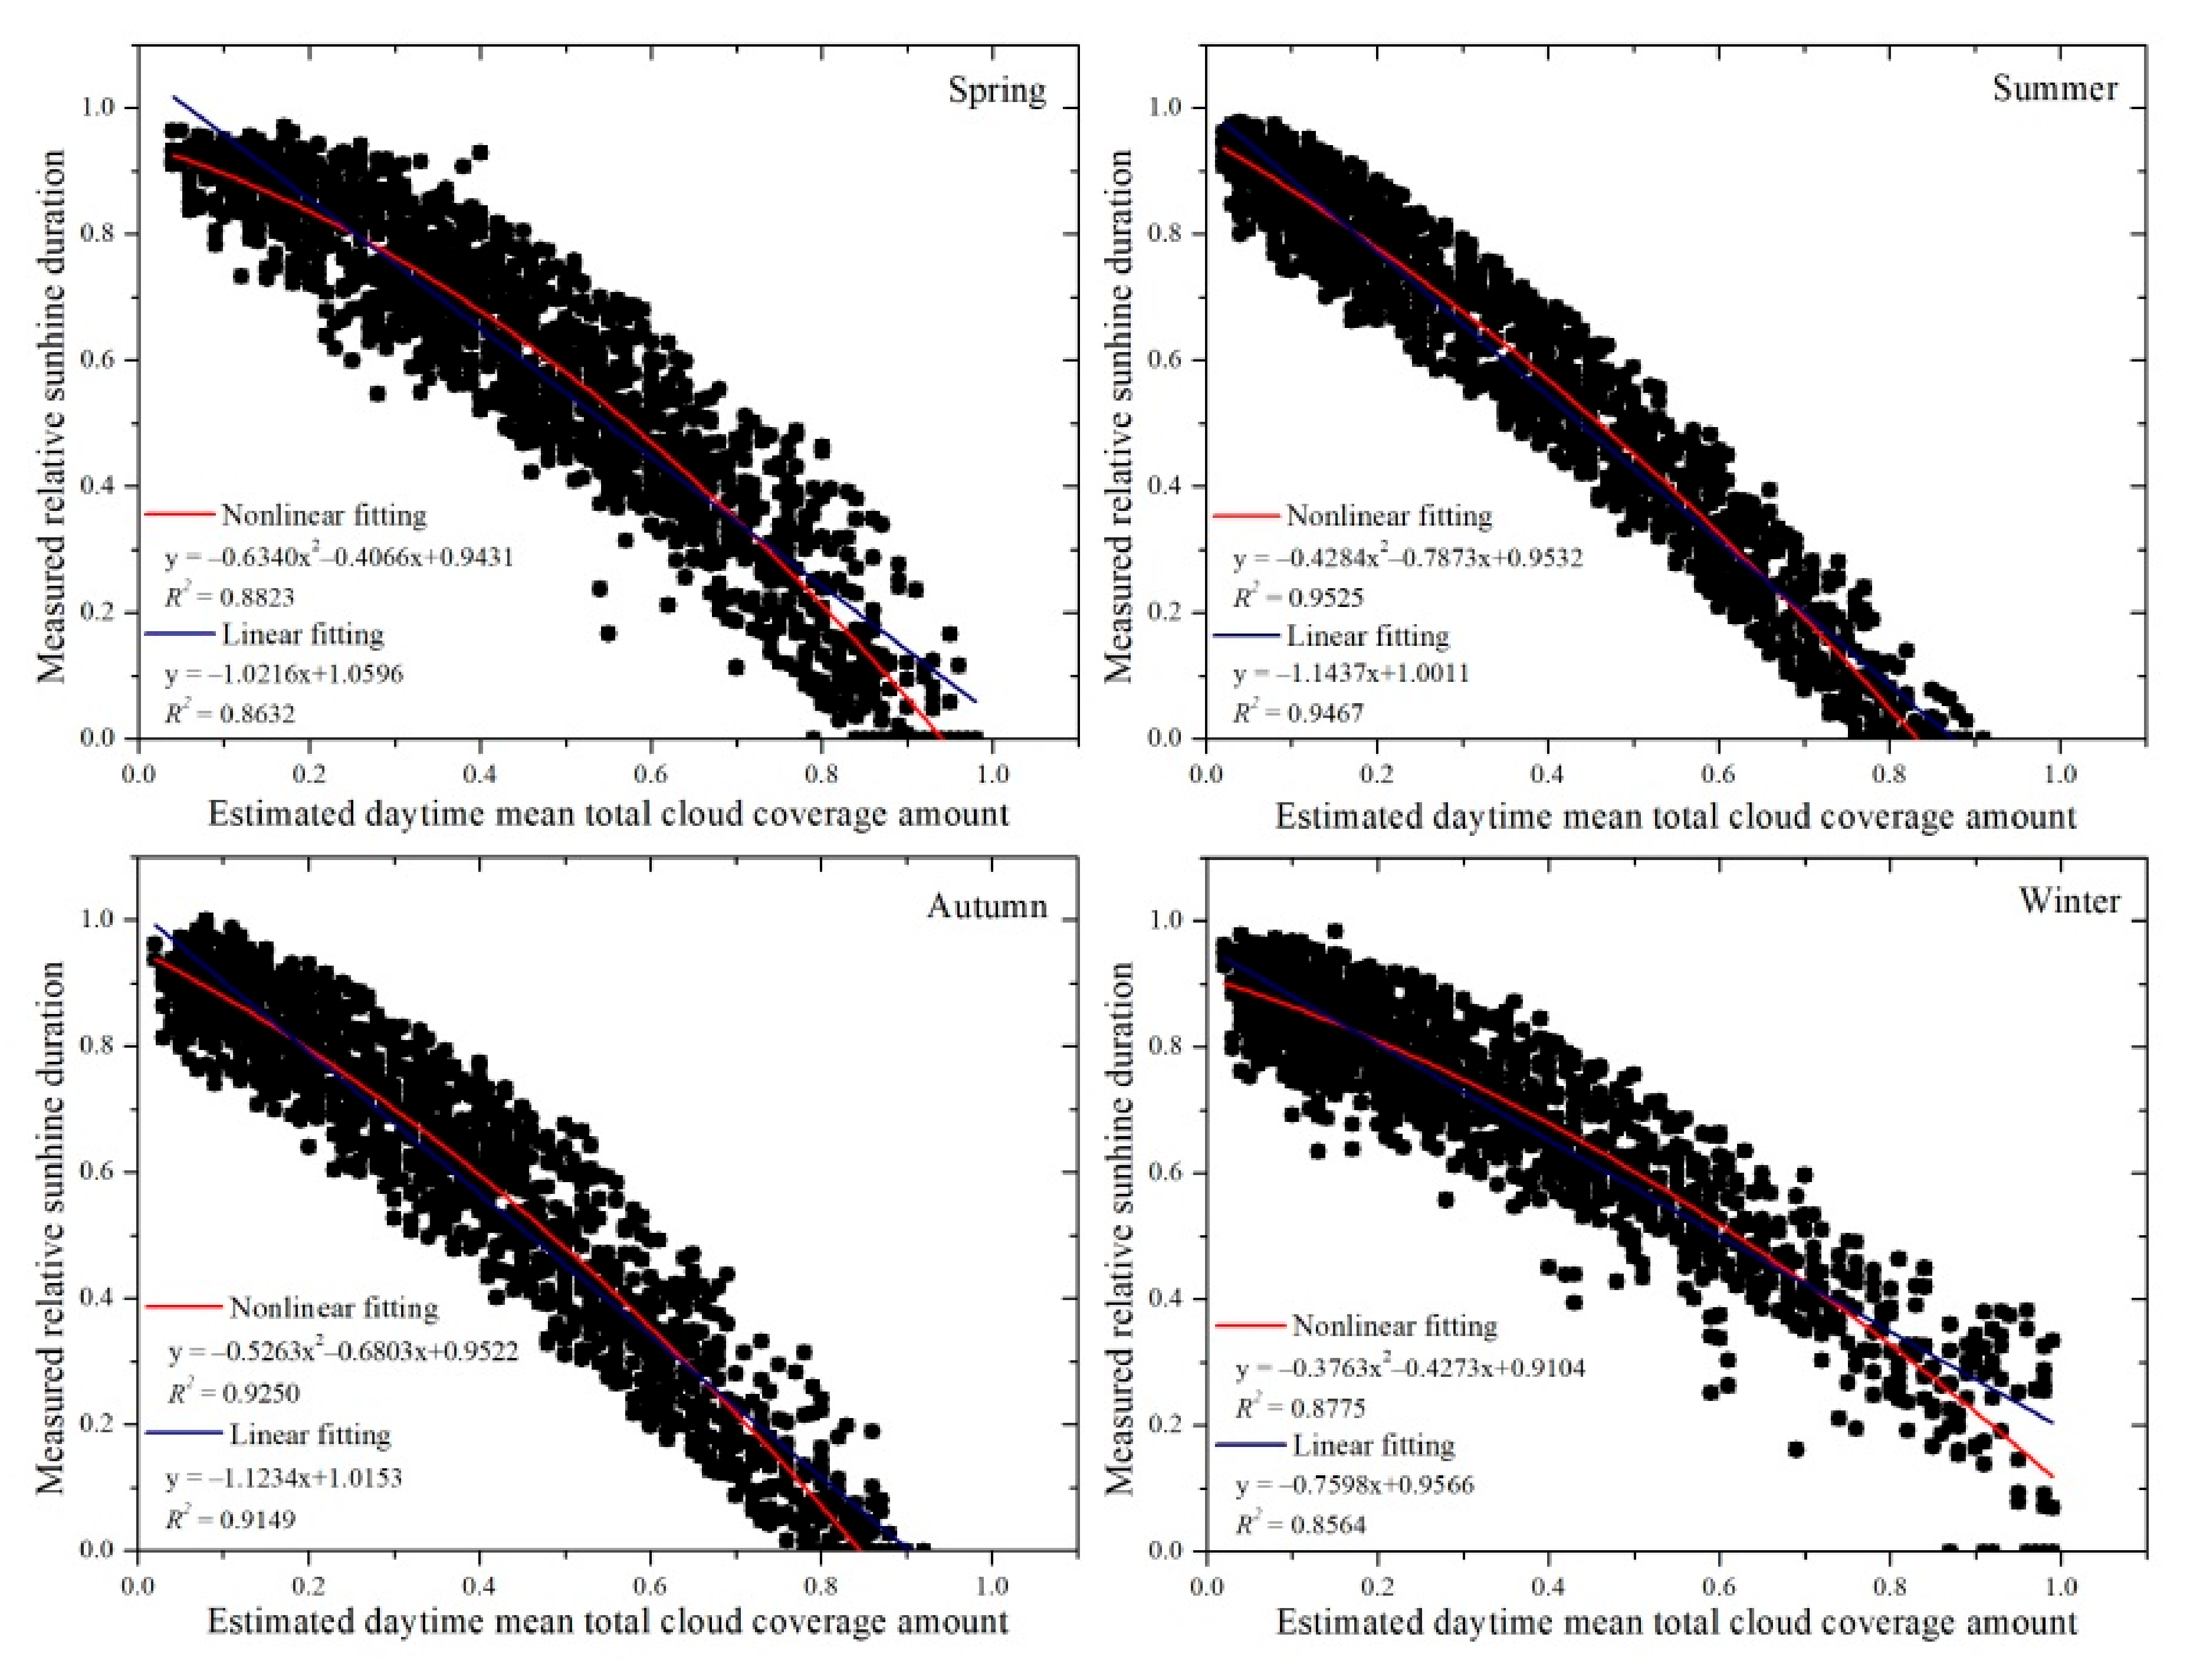
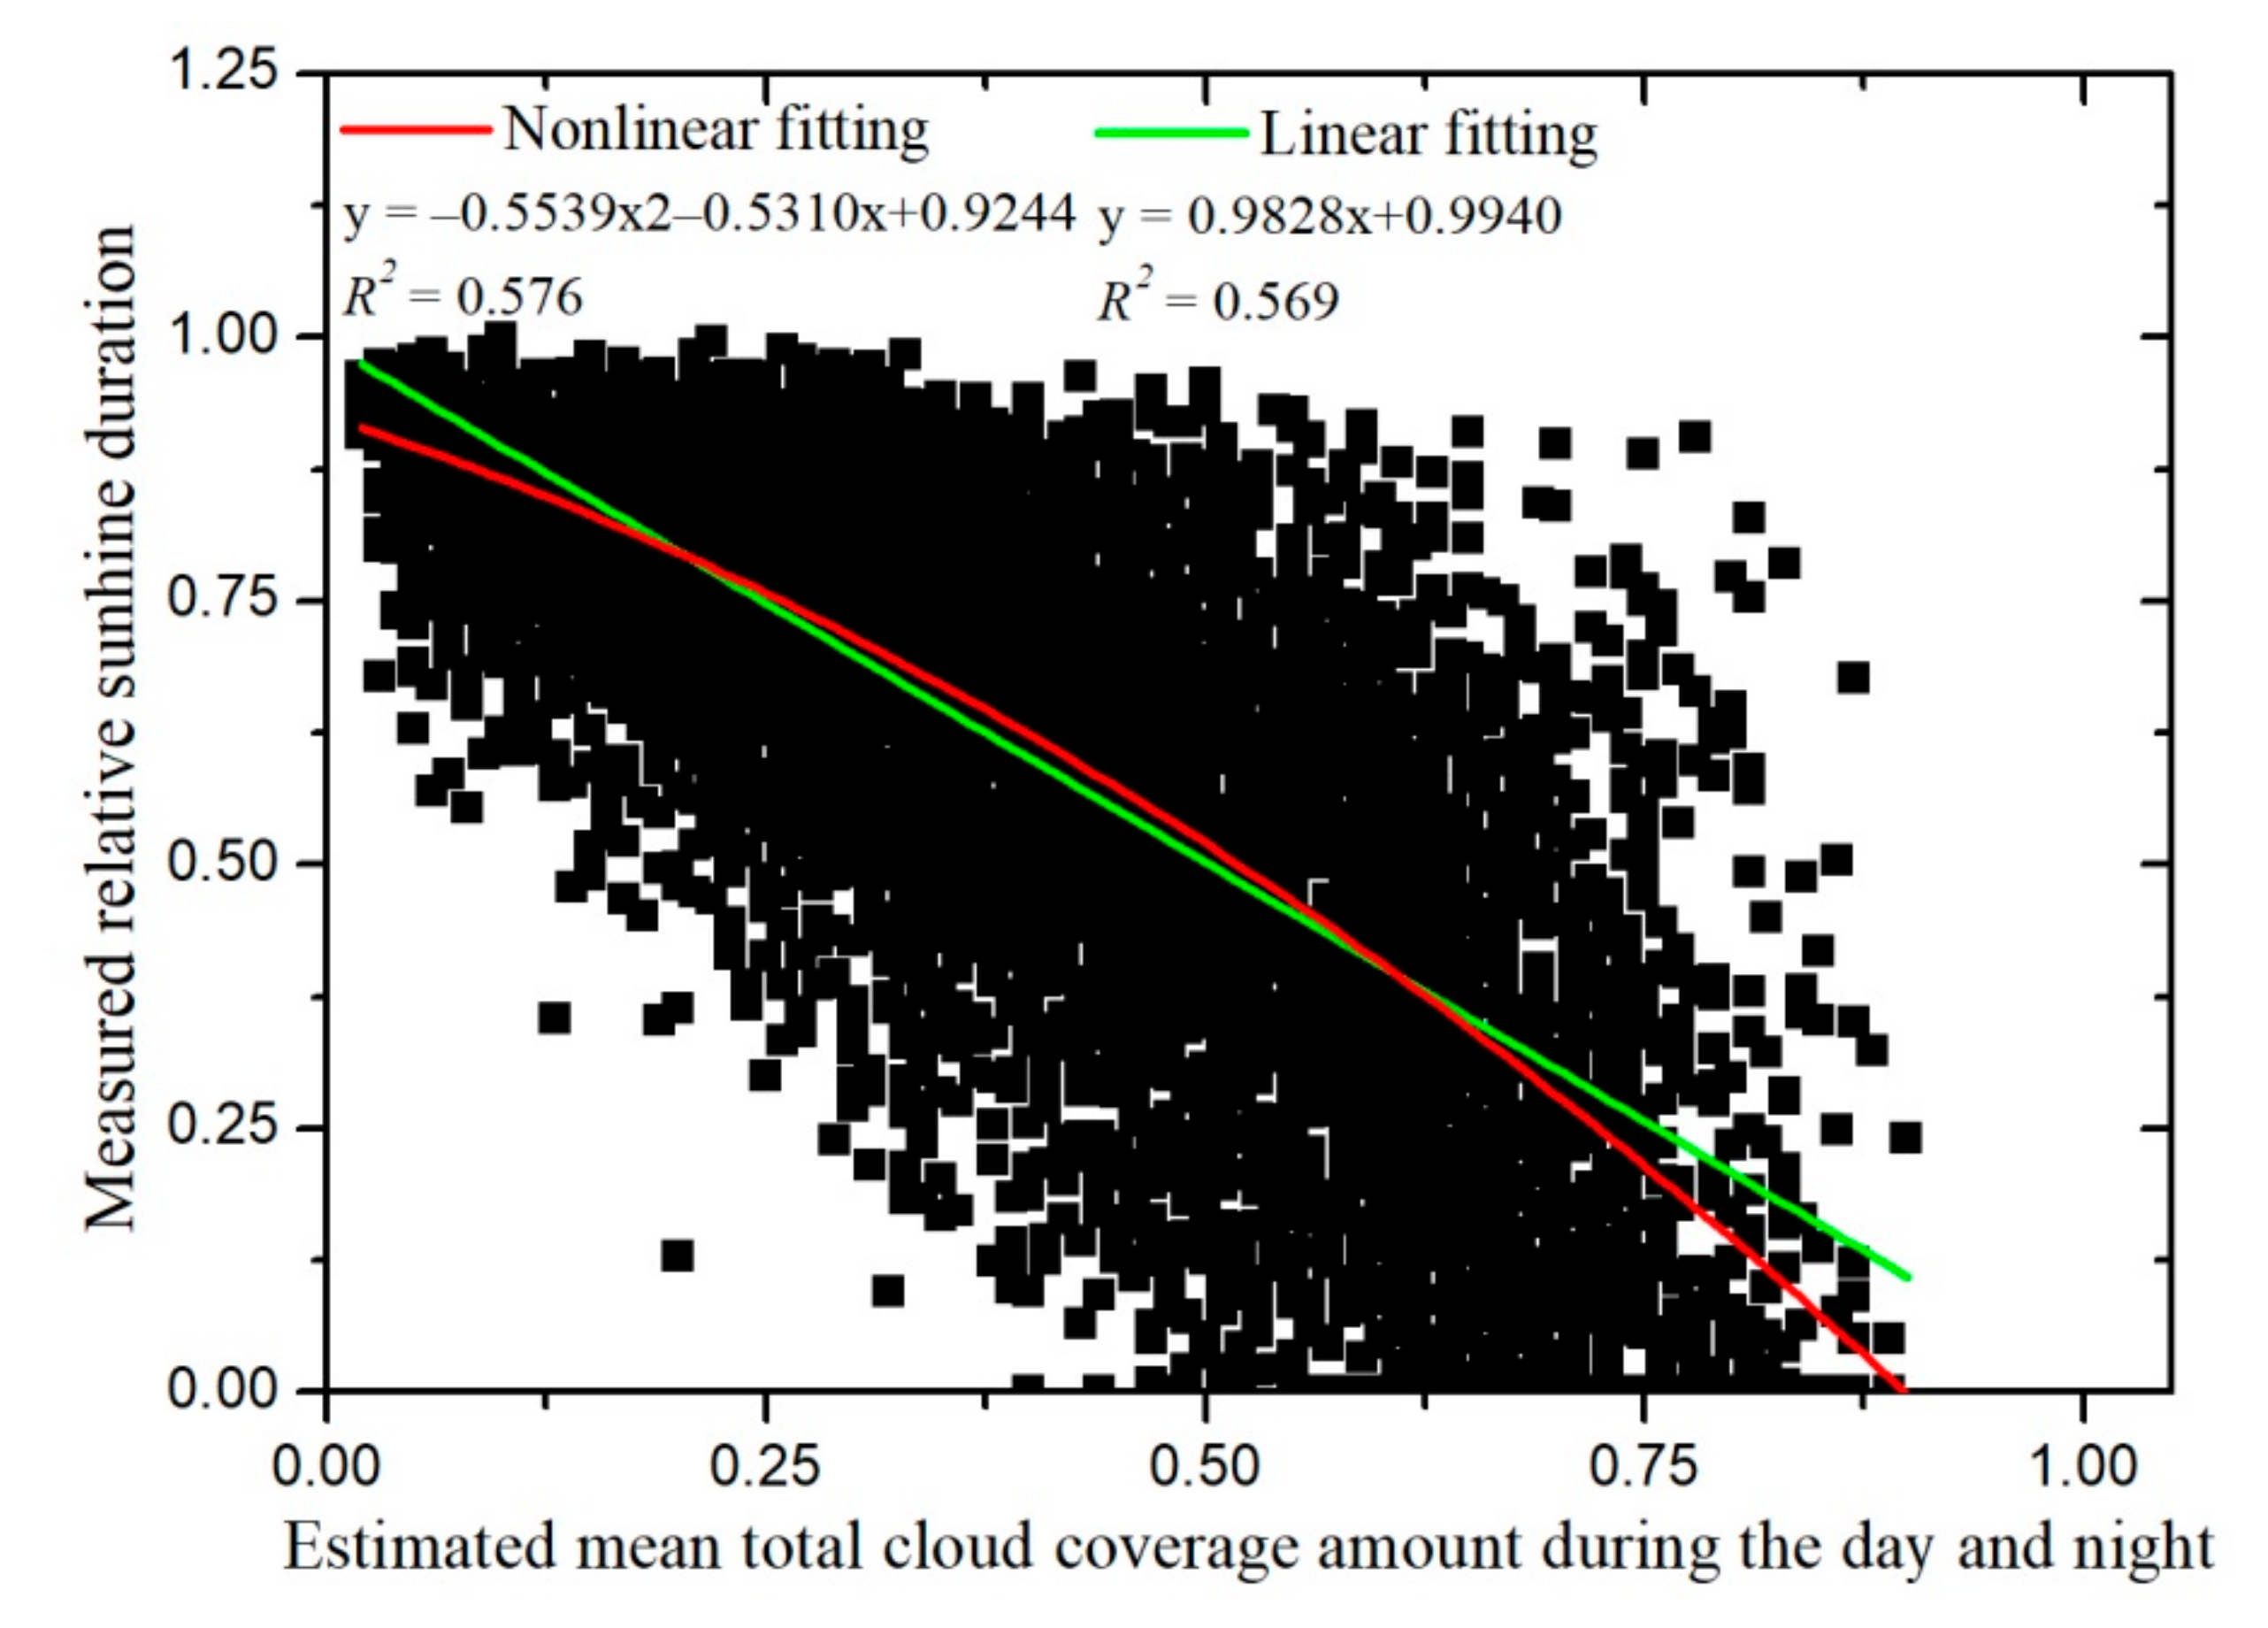
Function for Total Cloud Amount between Sunrise and Sunset (f(fccom))
2.2.3. Model Performance Assessment
3. Results
4. Discussion
5. Conclusions
Author Contributions
Funding
Acknowledgments
Conflicts of Interest
References
- Zhu, X.C.; Qiu, X.F.; Zeng, Y.; Gao, J.Q.; He, Y.J. A remote sensing model to estimate sunshine duration in the Ningxia Hui autonomous region, China. J. Meteorol. Res. 2015, 29, 144–154. [Google Scholar] [CrossRef]
- Angstrom, A. Solar and terrestrial radiation. Q. J. R. Meteorol. Soc. 1924, 50, 121–125. [Google Scholar] [CrossRef]
- Weng, D.M. Studies on Radiation Climate of China; China Meteorological Press: Beijing, China, 1997. [Google Scholar]
- McGrath, J.; Selten, J.P.; Chant, D. Long-term trends in sunshine duration and its association with schizophrenia birth rates and age at first registration-data from Australia and the Netherlands. Schizophr. Res. 2002, 54, 199–212. [Google Scholar] [CrossRef]
- Kothe, S.; Good, E.; Obregón, A.; Ahrens, B.; Nitsche, H. Satellite-based sunshine duration for Europe. Remote Sens. 2013, 5, 2943–2972. [Google Scholar] [CrossRef]
- Robaa, S. Evaluation of sunshine duration from cloud data in Egypt. Energy 2008, 33, 785–795. [Google Scholar] [CrossRef]
- Qian, H. Study on the Measurement Method of Direct Radiation Sunshine Hour. Master’s Thesis, Nanjing University of Information Science and Technology, Nanjing, China, 2013. [Google Scholar]
- Matuszko, D.A. Comparison of sunshine duration records from the Campbell-stokes sunshine recorder and CSD3 sunshine duration sensor. Theor. Appl. Climatol. 2015, 119, 401–406. [Google Scholar] [CrossRef]
- Wu, B.; Liu, S.; Zhu, W.; Yu, M.; Yan, N.; Xing, Q. A Method to Estimate Sunshine Duration Using Cloud Classification Data from a Geostationary Meteorological Satellite (FY-2D) over the Heihe River Basin. Sensors 2016, 16, 1859. [Google Scholar] [CrossRef]
- Zeng, Y. The spatial distribution of sunshine hours under undulating terrain of China. Prog. Nat. Sci. 2003, 13, 545–548. [Google Scholar]
- Canada, J. Solar radiation prediction from sunshine in eastern Spain. Renew. Energy 1992, 3, 219–221. [Google Scholar]
- Halouani, N.; Nguyen, C.T.; Vo-Ngoc, D. Calculation of monthly average global solar radiation on horizontal surfaces using daily hours of bright sunshine. Sol. Energy 1993, 50, 247–258. [Google Scholar] [CrossRef]
- Good, E. Estimating daily sunshine duration over the UK from geostationary satellite data. Weather 2010, 65, 324–328. [Google Scholar] [CrossRef]
- Kandirmaz, H.M.; Kaba, K. Estimation of daily sunshine duration from Terra and aqua MODIS data. Adv. Meteorol. 2014, 613267, 1–9. [Google Scholar] [CrossRef]
- Zuo, D.K. Studies on Radiation in the Epigedsphere; Science Press: Beijing, China, 1991. [Google Scholar]
- Wang, H.Q. Refine project model of sunshine resources in China considering terrain masking. J. Agrometeorol. 2011, 32, 273–278. (In Chinese) [Google Scholar]
- Barbaro, S.; Coppolino, S.; Leone, C.; Sinagra, E. Global solar radiation in Italy. Sol. Energy 1978, 20, 431–435. [Google Scholar] [CrossRef]
- Wang, Y.; Yang, Y.; Zhao, N.; Liu, C.; Wang, Q. The magnitude of the effect of air pollution on sunshine hours in China. J. Geophys. Res. 2012, 117. [Google Scholar] [CrossRef]
- Brabec, M.; Badescu, V.; Dumitrescu, A.; Paulescu, M. A new point of view on the relationship between global solar irradiation and sunshine quantifiers. Sol. Energy 2016, 126, 252–263. [Google Scholar] [CrossRef]
- Jervase, J.A.; Al-Lawati, A.; Dorvlo, A.S.S. Contour maps for sunshine ratio for Oman using radial basis function generated data. Renew. Energy 2003, 28, 487–497. [Google Scholar] [CrossRef]
- Wang, H.Q.; Li, S.M. Estimating of sunshine percentage using the cloud classification data from FY2C. J. Remote Sens. 2013, 1, 1295–1310. [Google Scholar]
- Cano, D.; Monget, J.M.; Albuisson, M.; Guillard, H.; Regas, N.; Wald, L. A method for the determination of the global solar radiation from meteorological satellite data. Sol. Energy 1986, 37, 31–39. [Google Scholar] [CrossRef]
- Olseth, J.A.; Skartveit, A. Solar irradiance, sunshine duration and daylight illuminance derived from METEOSAT data from some European sites. Theor. Appl. Climatol. 2001, 69, 239–252. [Google Scholar] [CrossRef]
- Perez, R.; Ineichen, P.; Moore, K.; Kmiecik, M.; Chain, C.; George, R.; Vigonla, F. A new operational model for satellite derived irradiances: Description and validation. Sol. Energy 2002, 73, 307–317. [Google Scholar] [CrossRef]
- Kandirmaz, H.M. A model for the estimation of daily global sunshine duration from meteorological geostationary satellite data. Int. J. Remote Sens. 2006, 27, 5061–5071. [Google Scholar] [CrossRef]
- Shamim, M.A.; Remesan, R.; Han, D.W.; Ejaz, N.; Elahi, A. An improved technique for global daily sunshine duration estimation using satellite imagery. J. Zhujiang Univ. Sci. A (Appl. Phys. Eng.) 2012, 13, 717–722. [Google Scholar] [CrossRef]
- Liu, X.; Yin, Z.Y.; Shao, X.; Qin, N. Temporal trends and variability of daily maximum and minimum, extreme temperature events, and growing season length over the eastern and central Tibetan Plateau during 1961–2003. J. Geophys. Res. Atmos. 2006, 16, 111. [Google Scholar] [CrossRef]
- Zheng, D. The system of physic-geographical regions of the Qinghai-Xizang (Tibet) Plateau. Sci. China (Ser. D) 1996, 19, 410–417. [Google Scholar]
- Liu, X.; Zhu, X.; Zhu, W.; Pan, Y.; Zhang, C.; Zhang, D. Changes in spring phenology in the Three-Rivers Headwater Region from 1999 to 2013. Remote Sens. 2014, 6, 9130–9144. [Google Scholar] [CrossRef]
- Liu, J.Y.; Xu, X.L.; Shao, Q.Q. Grassland degradation in the “Three-River Headwaters” region, Qinghai Province. J. Geogr. Sci. 2008, 18, 259–273. [Google Scholar] [CrossRef]
- Tong, L.; Xu, X.L.; Fu, Y.; Li, S. Wetland changes and their responses to climate change in the “Theree-River Headwater” region of China since the 1990s. Energies 2014, 7, 2515–2534. [Google Scholar] [CrossRef]
- He, P. Practical Manual for Satellite Service Products and Satellite Data Formats for Chinese Geostationary Meteorological; China Meteorological Press: Beijing, China, 2008. [Google Scholar]
- Liu, J.; Cui, P.; Xiao, M. The bia analysis of FY-2G cloud fraction in summer and winter. J. Appl. Meteorol. Sci. 2017, 28, 177–188. [Google Scholar]
- Duffie, J.A.; Beckman, W.A. Solar Engineering of Thermal Processes, 2nd ed.; John Wiley & Sons: New York, NY, USA, 1991. [Google Scholar]
- Willmott, C.J. Some comments on the evaluation of model performance. Bull. Am. Meteorol. Soc. 1982, 63, 1309–1313. [Google Scholar] [CrossRef]
- Cai, J.; Liu, Y.; Lei, T.; Pereira, L.S. Estimating reference evapotranspiration with the FAO Penman–Monteith equation using daily weather forecast messages. Agric. For. Meteorol. 2007, 145, 22–35. [Google Scholar] [CrossRef]
- Colaizzi, P.D.; Evett, S.R.; Howell, T.A.; Tolk, J.A. Comparison of five models to scale daily evapotranspiration from one-time-of-day measurements. Trans. ASAE 2006, 49, 1409–1417. [Google Scholar] [CrossRef]
- Liu, G.; Hafeez, M.; Liu, Y.; Xu, D.; Vote, C. A novel method to convert daytime evapotranspiration into daily evapotranspiration based on variable canopy resistance. J. Hydrol. 2012, 414, 278–283. [Google Scholar] [CrossRef]


| Station Name | Longitude E (°) | Latitude N (°) | Elevation (m) |
|---|---|---|---|
| Qiabuqia | 100.62 | 36.27 | 2835.00 |
| Guizhou | 101.43 | 36.03 | 2237.10 |
| Wudaoliang | 93.08 | 35.22 | 4612.20 |
| Xinghai | 99.98 | 35.58 | 3323.20 |
| Guinan | 100.75 | 35.58 | 3120.00 |
| Tongren | 102.02 | 35.52 | 2491.40 |
| Tuotuohe | 92.43 | 34.22 | 4533.10 |
| Zaduo | 95.30 | 32.90 | 4066.40 |
| Qumalai | 95.78 | 34.13 | 4175.00 |
| Yushu | 97.02 | 33.02 | 3681.20 |
| Maduo | 98.22 | 34.92 | 4272.30 |
| Qingshuihe | 97.13 | 33.80 | 4415.40 |
| Guoluo | 100.25 | 34.47 | 3719.00 |
| Dari | 99.65 | 33.75 | 3967.50 |
| Henan | 101.60 | 34.73 | 3500.00 |
| Jiuzhi | 101.48 | 33.43 | 3628.50 |
| Nangqian | 96.48 | 32.20 | 3643.70 |
| Banma | 100.75 | 32.93 | 3530.00 |
| Time | R2 | MAE | RMSE | d | RE |
|---|---|---|---|---|---|
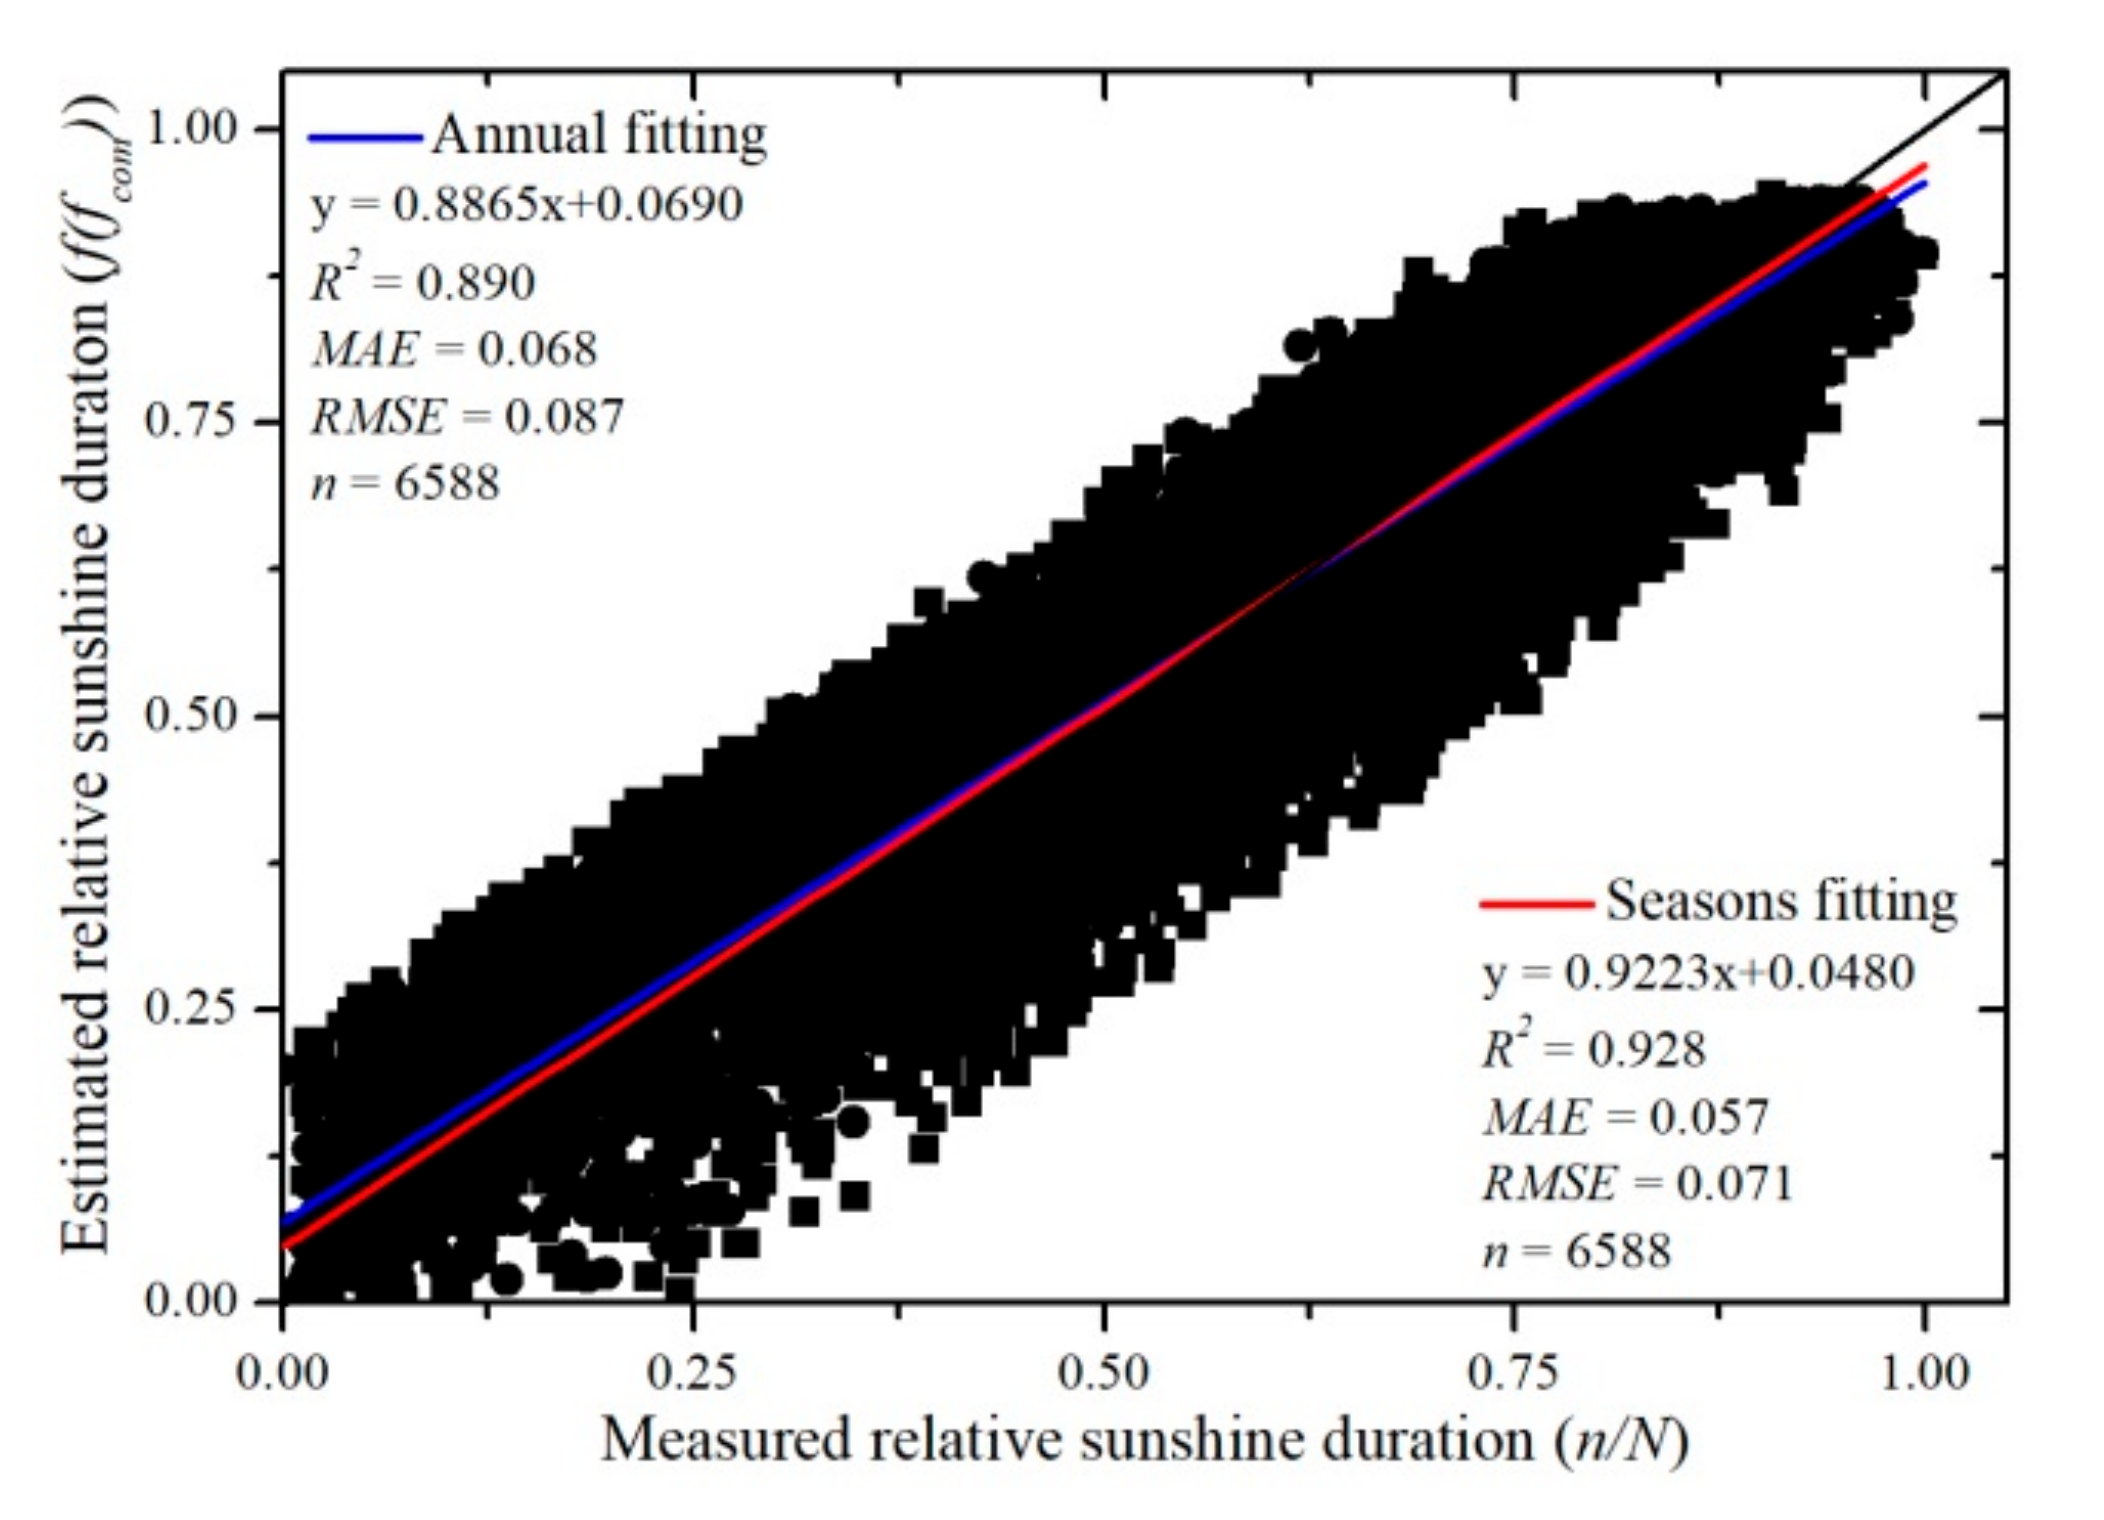
| Annual | 0.890 | 0.068 | 0.087 | 0.970 | 0.142 |
| Four seasons | 0.928 | 0.057 | 0.071 | 0.981 | 0.115 |
| Seasons | Annual | Four Seasons | ||||||||
|---|---|---|---|---|---|---|---|---|---|---|
| R2 | MAE | RMSE | d | RE | R2 | MAE | RMSE | d | RE | |
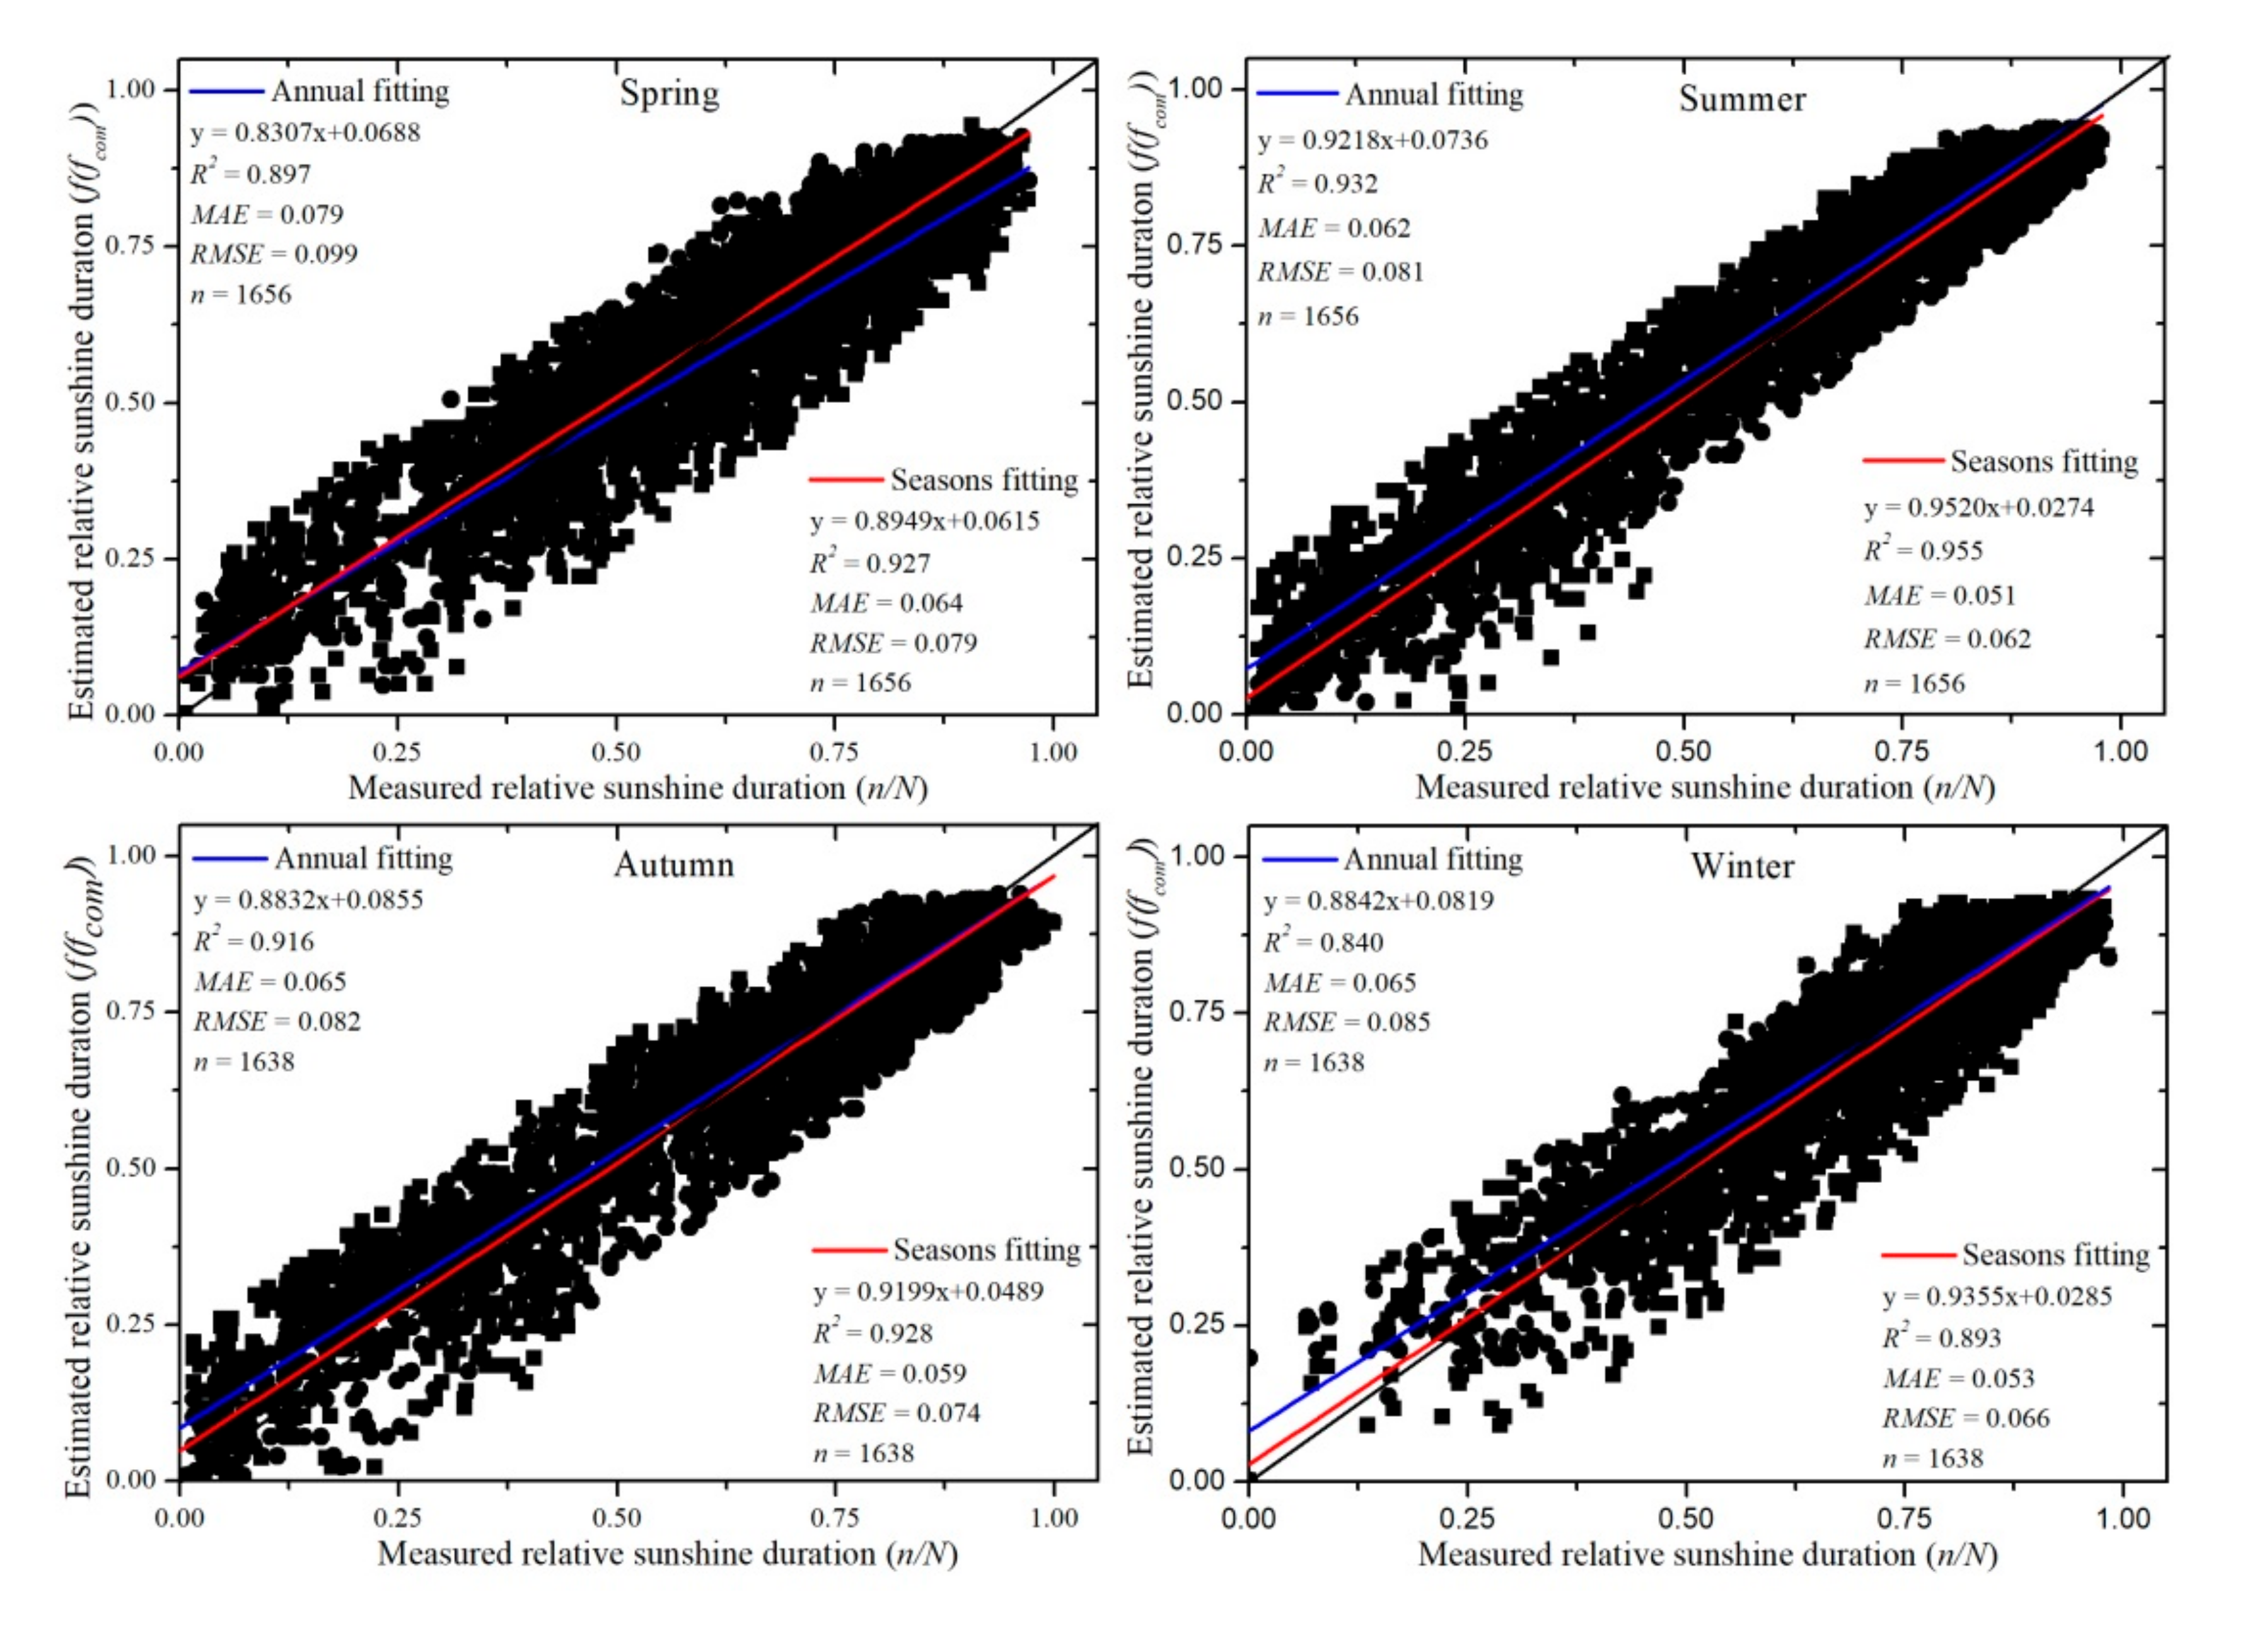
| Spring | 0.897 | 0.079 | 0.099 | 0.955 | 0.168 | 0.927 | 0.064 | 0.079 | 0.972 | 0.135 |
| Summer | 0.932 | 0.062 | 0.081 | 0.979 | 0.144 | 0.955 | 0.051 | 0.062 | 0.988 | 0.110 |
| Autumn | 0.916 | 0.065 | 0.082 | 0.975 | 0.139 | 0.928 | 0.059 | 0.074 | 0.981 | 0.125 |
| Winter | 0.840 | 0.065 | 0.085 | 0.955 | 0.120 | 0.893 | 0.053 | 0.066 | 0.971 | 0.093 |
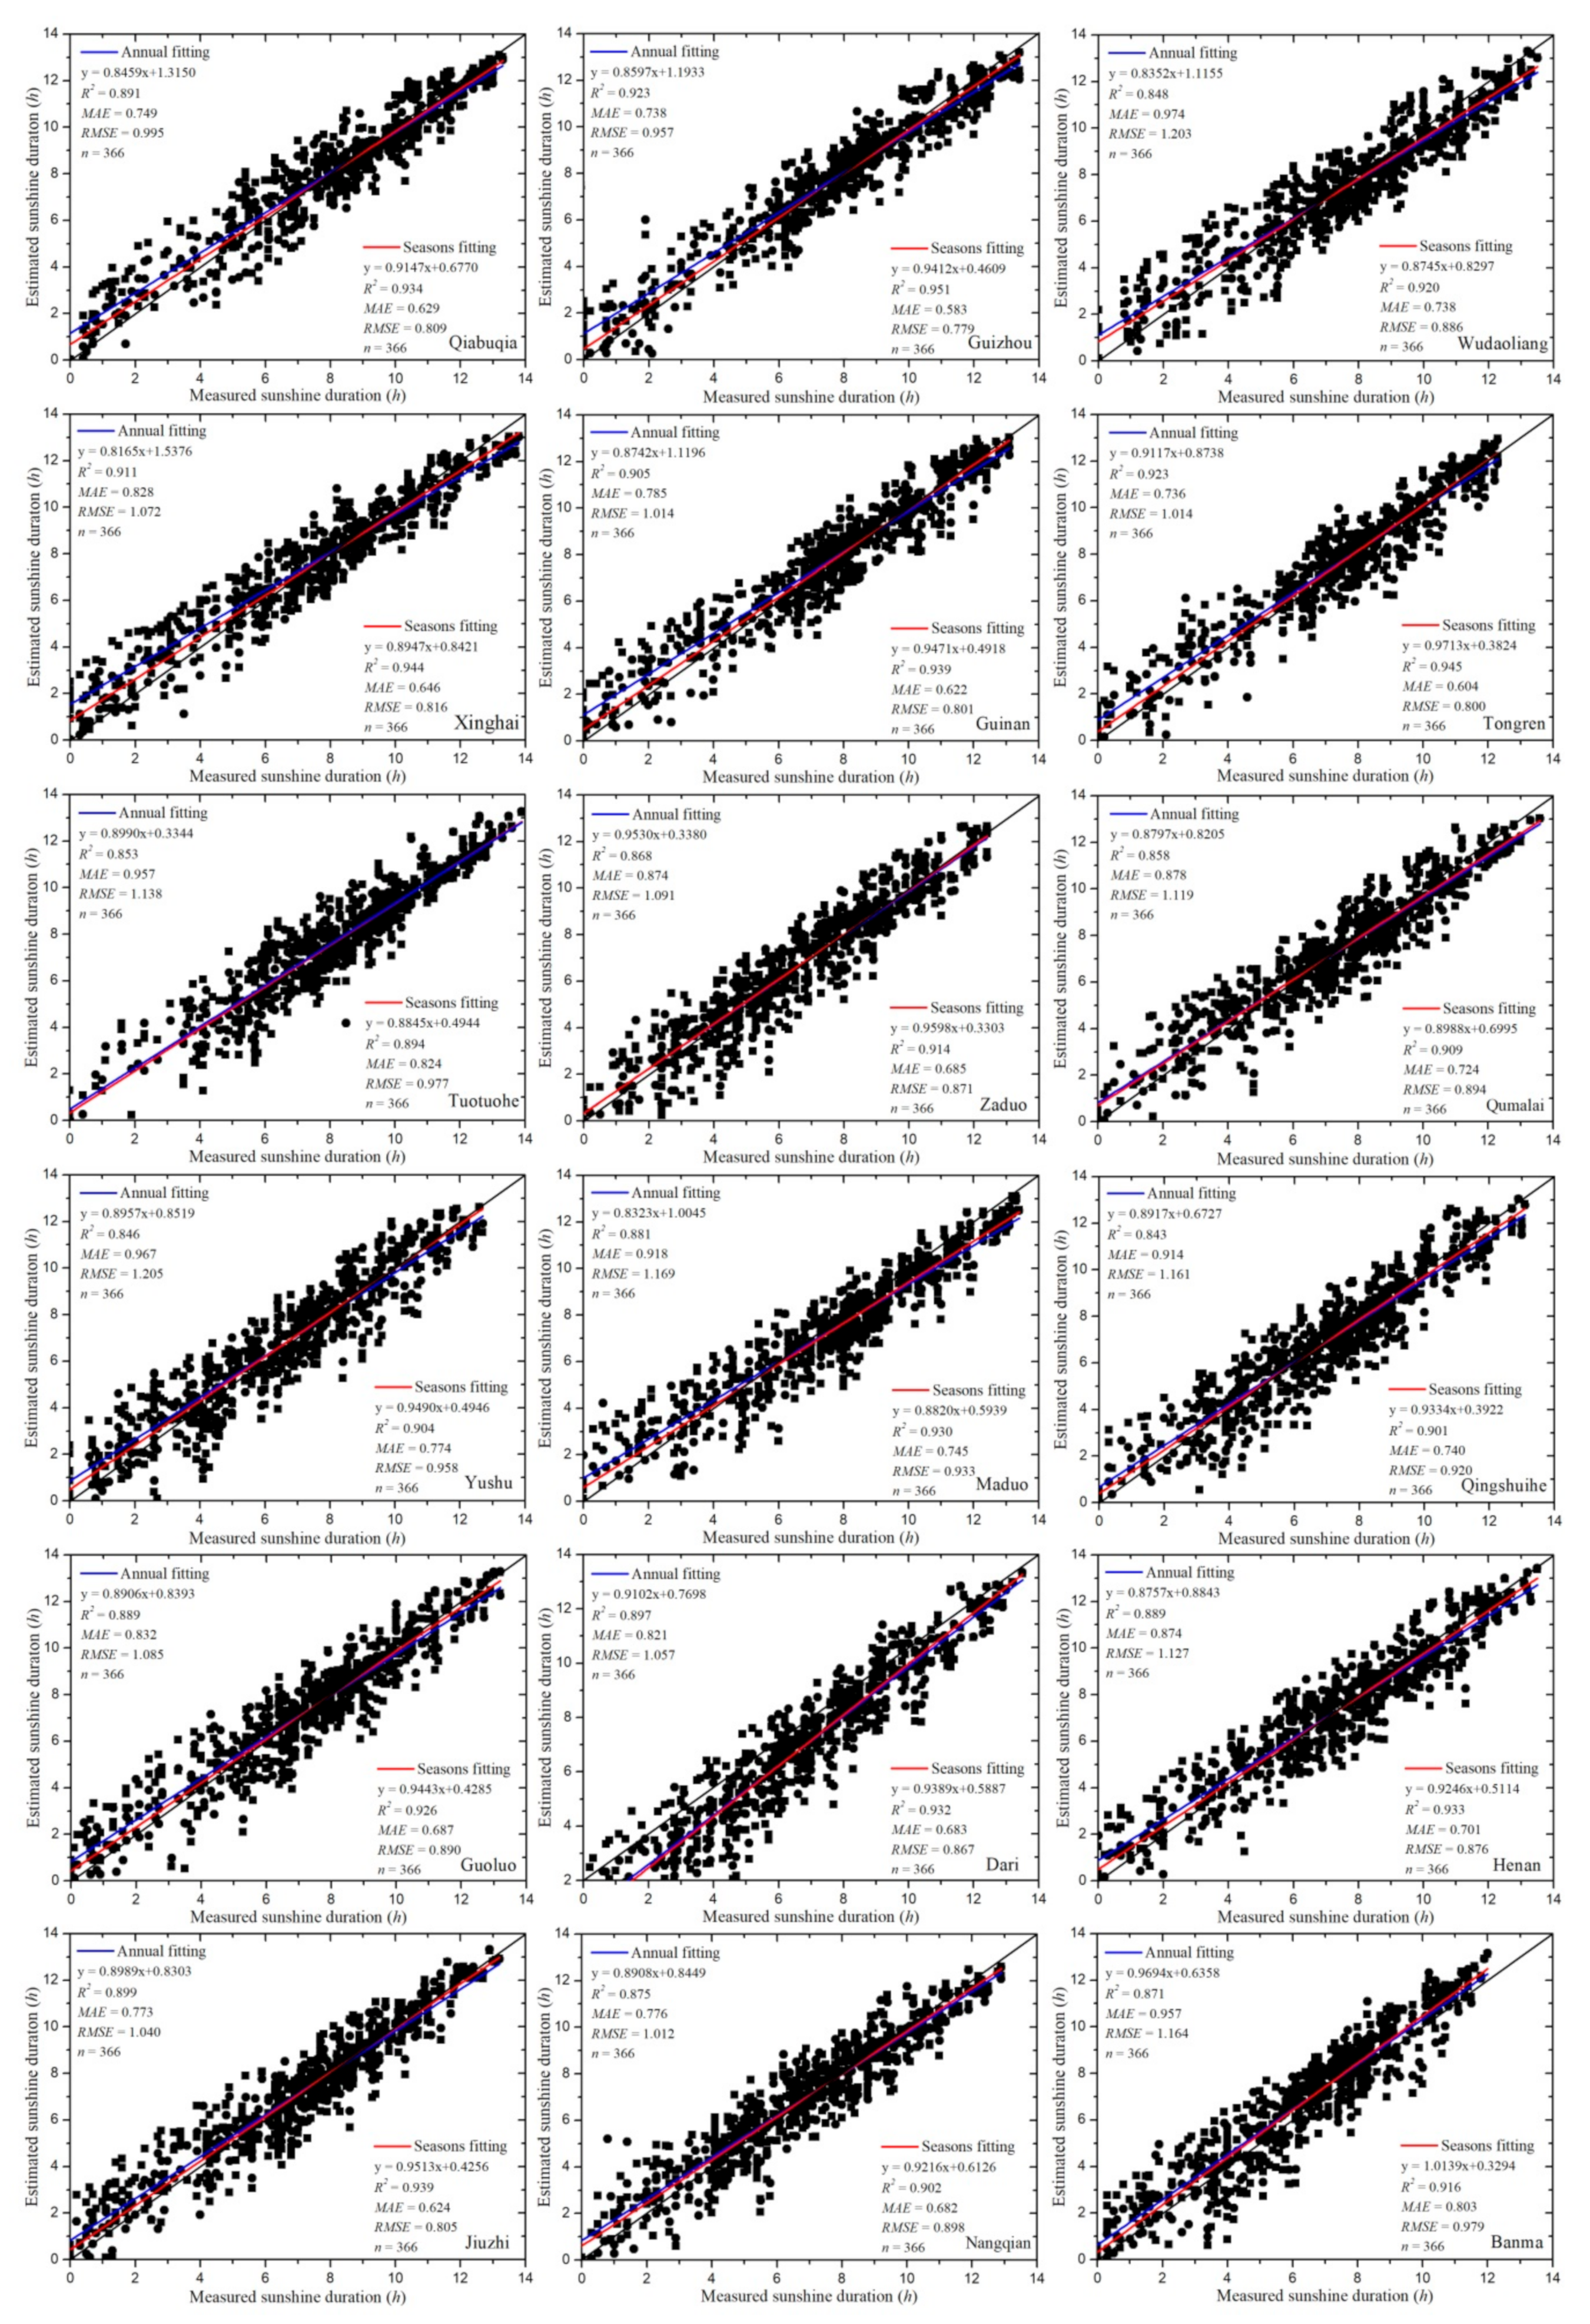
| Station Name | Observed Average (h) | Annual | Four Seasons | ||||||||||
|---|---|---|---|---|---|---|---|---|---|---|---|---|---|
| Estimated Average (h) | R2 | MAE (h/day) | RMSE (h/day) | d | RE | Estimated Average (h) | R2 | MAE (h/day) | RMSE (h/day) | d | RE | ||
| Qiabuqia | 8.189 | 8.243 | 0.891 | 0.749 | 0.995 | 0.968 | 0.121 | 8.045 | 0.934 | 0.629 | 0.809 | 0.982 | 0.100 |
| Guizhou | 7.713 | 7.824 | 0.923 | 0.738 | 0.957 | 0.977 | 0.124 | 7.542 | 0.951 | 0.583 | 0.779 | 0.987 | 0.103 |
| Wudaoliang | 7.690 | 7.538 | 0.848 | 0.974 | 1.203 | 0.956 | 0.156 | 7.555 | 0.920 | 0.738 | 0.886 | 0.977 | 0.115 |
| Xinghai | 7.505 | 7.665 | 0.911 | 0.828 | 1.072 | 0.970 | 0.143 | 7.556 | 0.944 | 0.646 | 0.816 | 0.984 | 0.109 |
| Guinan | 7.509 | 7.683 | 0.905 | 0.785 | 1.014 | 0.973 | 0.135 | 7.603 | 0.939 | 0.622 | 0.801 | 0.984 | 0.107 |
| Tongren | 6.984 | 7.241 | 0.923 | 0.736 | 1.014 | 0.978 | 0.136 | 7.166 | 0.945 | 0.604 | 0.800 | 0.985 | 0.115 |
| Tuotuohe | 8.261 | 7.761 | 0.853 | 0.957 | 1.138 | 0.951 | 0.138 | 7.802 | 0.894 | 0.824 | 0.977 | 0.963 | 0.118 |
| Zaduo | 6.811 | 6.829 | 0.868 | 0.874 | 1.091 | 0.995 | 0.160 | 6.867 | 0.914 | 0.685 | 0.871 | 0.977 | 0.128 |
| Qumalai | 7.331 | 7.270 | 0.858 | 0.878 | 1.119 | 0.961 | 0.153 | 7.289 | 0.909 | 0.724 | 0.894 | 0.975 | 0.122 |
| Yushu | 6.565 | 6.732 | 0.846 | 0.967 | 1.205 | 0.957 | 0.183 | 6.725 | 0.904 | 0.774 | 0.958 | 0.974 | 0.146 |
| Maduo | 7.696 | 7.410 | 0.881 | 0.918 | 1.169 | 0.963 | 0.152 | 7.382 | 0.930 | 0.745 | 0.933 | 0.977 | 0.121 |
| Qingshuihe | 7.023 | 6.935 | 0.843 | 0.914 | 1.161 | 0.957 | 0.165 | 6.948 | 0.901 | 0.740 | 0.920 | 0.974 | 0.131 |
| Guoluo | 7.083 | 7.147 | 0.889 | 0.832 | 1.085 | 0.970 | 0.153 | 7.117 | 0.926 | 0.687 | 0.890 | 0.981 | 0.126 |
| Dari | 6.714 | 6.881 | 0.897 | 0.821 | 1.057 | 0.972 | 0.157 | 6.892 | 0.932 | 0.683 | 0.867 | 0.981 | 0.129 |
| Henan | 7.073 | 7.078 | 0.889 | 0.874 | 1.127 | 0.969 | 0.159 | 7.051 | 0.933 | 0.701 | 0.876 | 0.982 | 0.124 |
| Jiuzhi | 6.931 | 7.061 | 0.899 | 0.773 | 1.040 | 0.972 | 0.150 | 7.020 | 0.939 | 0.624 | 0.805 | 0.984 | 0.116 |
| Nangqian | 7.037 | 7.114 | 0.875 | 0.776 | 1.012 | 0.966 | 0.144 | 7.098 | 0.902 | 0.682 | 0.898 | 0.974 | 0.128 |
| Banma | 6.394 | 6.834 | 0.871 | 0.957 | 1.164 | 0.960 | 0.182 | 6.812 | 0.916 | 0.803 | 0.979 | 0.972 | 0.153 |
© 2019 by the authors. Licensee MDPI, Basel, Switzerland. This article is an open access article distributed under the terms and conditions of the Creative Commons Attribution (CC BY) license (http://creativecommons.org/licenses/by/4.0/).
Share and Cite
Zhu, W.; Wu, B.; Yan, N.; Ma, Z.; Wang, L.; Liu, W.; Xing, Q.; Xu, J. Estimating Sunshine Duration Using Hourly Total Cloud Amount Data from a Geostationary Meteorological Satellite. Atmosphere 2020, 11, 26. https://doi.org/10.3390/atmos11010026
Zhu W, Wu B, Yan N, Ma Z, Wang L, Liu W, Xing Q, Xu J. Estimating Sunshine Duration Using Hourly Total Cloud Amount Data from a Geostationary Meteorological Satellite. Atmosphere. 2020; 11(1):26. https://doi.org/10.3390/atmos11010026
Chicago/Turabian StyleZhu, Weiwei, Bingfang Wu, Nana Yan, Zonghan Ma, Linjiang Wang, Wenjun Liu, Qiang Xing, and Jiaming Xu. 2020. "Estimating Sunshine Duration Using Hourly Total Cloud Amount Data from a Geostationary Meteorological Satellite" Atmosphere 11, no. 1: 26. https://doi.org/10.3390/atmos11010026
APA StyleZhu, W., Wu, B., Yan, N., Ma, Z., Wang, L., Liu, W., Xing, Q., & Xu, J. (2020). Estimating Sunshine Duration Using Hourly Total Cloud Amount Data from a Geostationary Meteorological Satellite. Atmosphere, 11(1), 26. https://doi.org/10.3390/atmos11010026