Optical Properties of Aerosols and Chemical Composition Apportionment under Different Pollution Levels in Wuhan during January 2018


 , and
, and 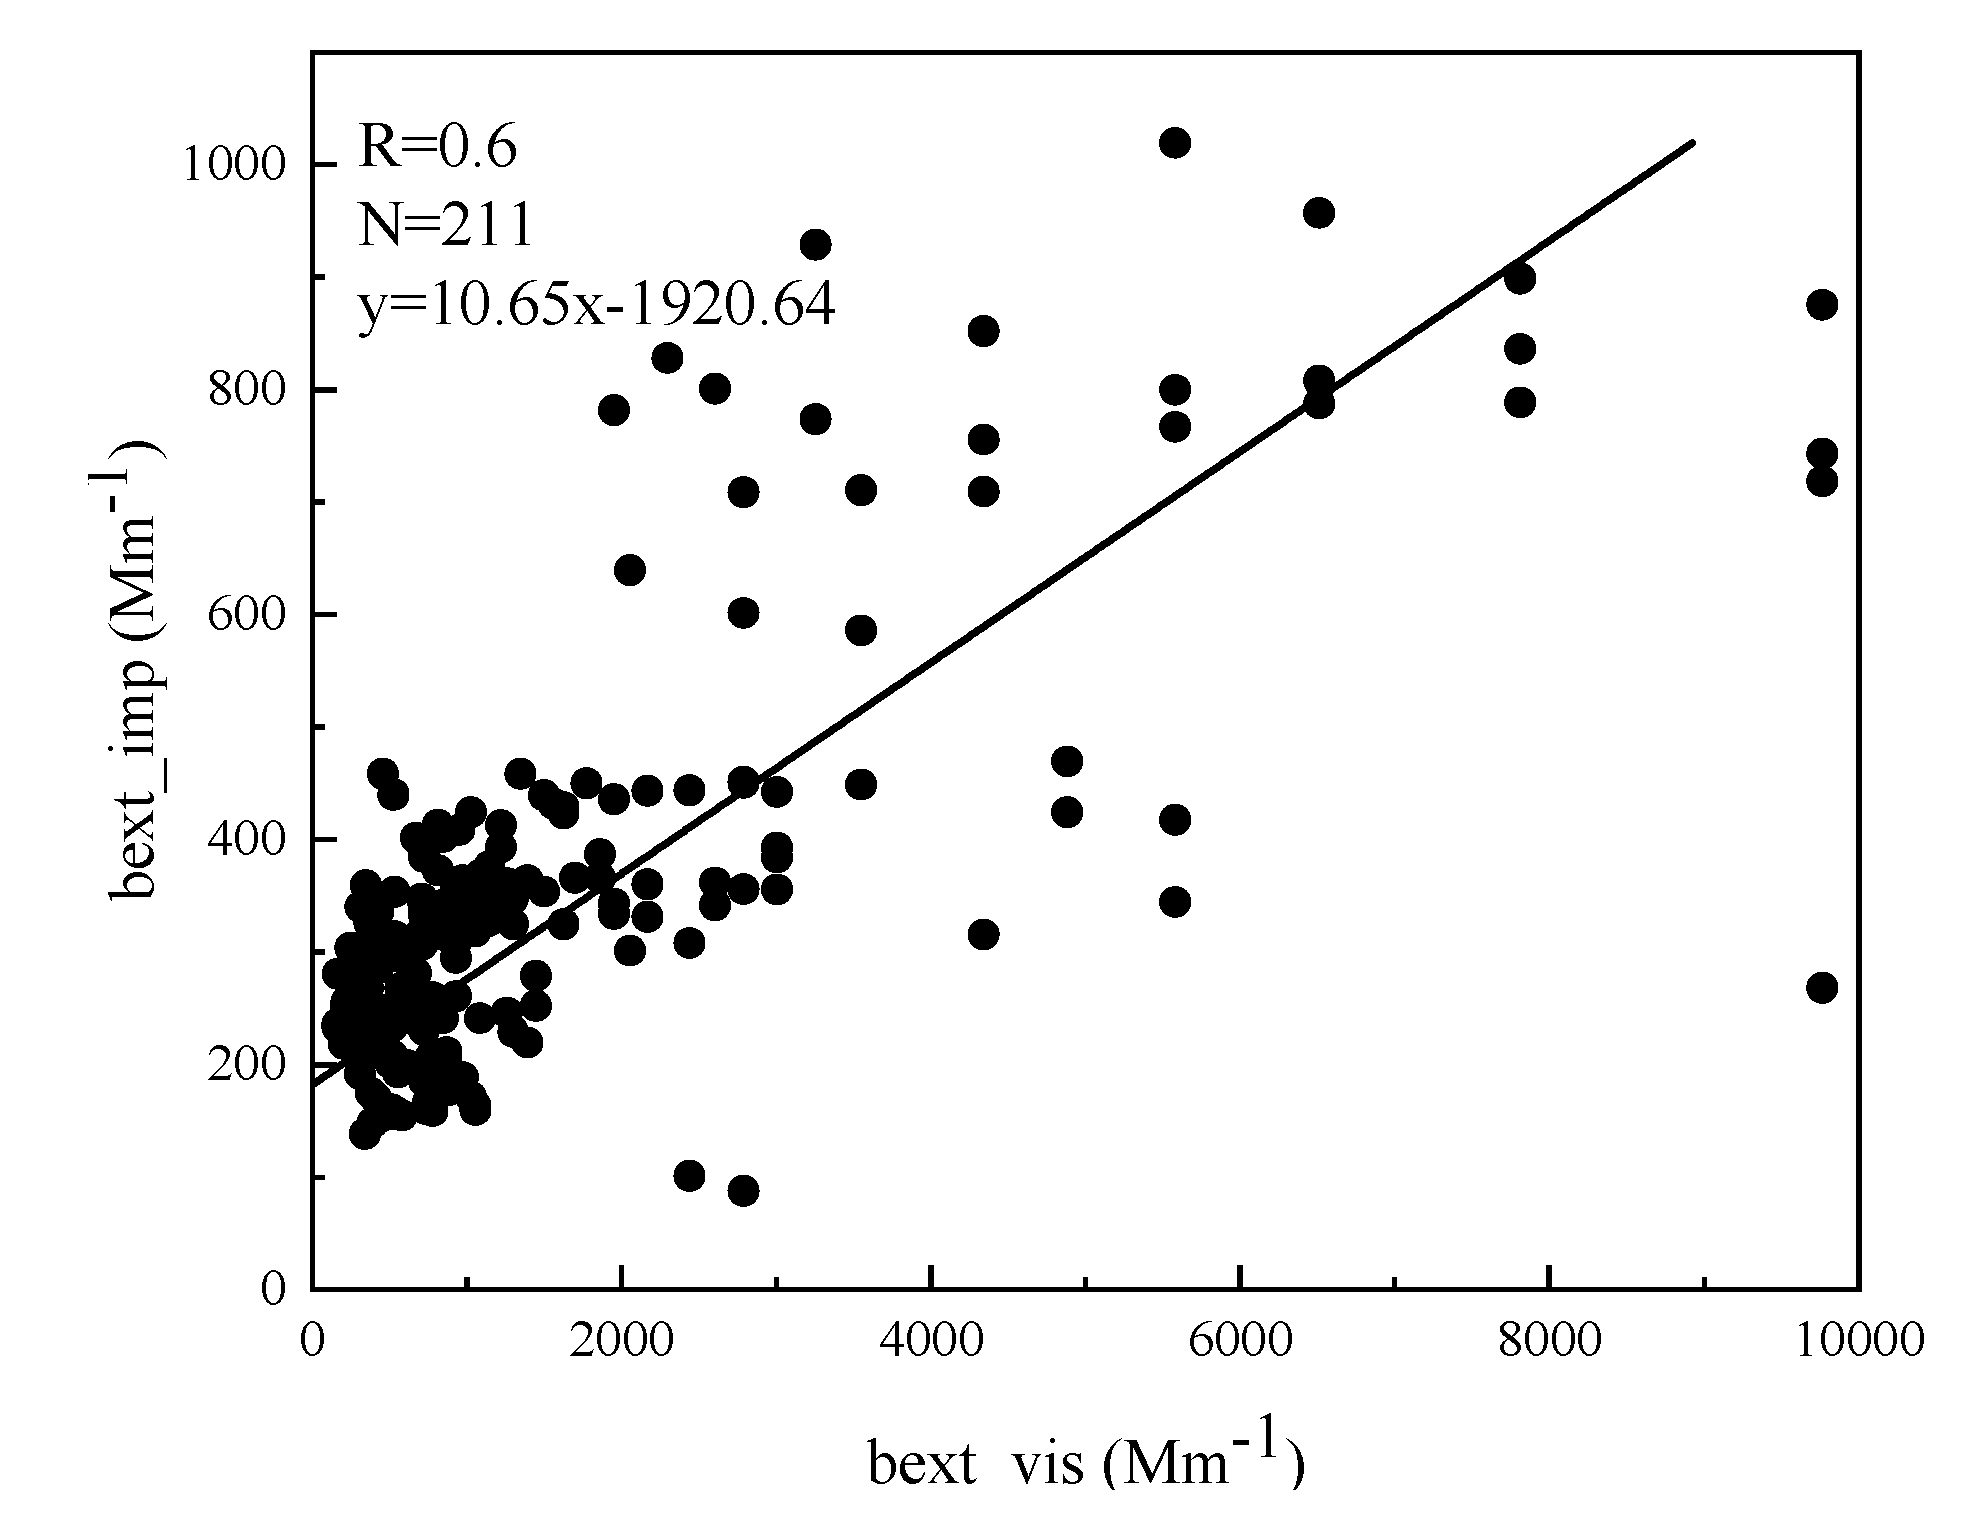
Abstract
1. Introduction
2. Materials and Methods
2.1. Data Origins
2.2. Instruments
2.3. Data Analysis
3. Results and Discussion
3.1. Summary of a Haze Episode
3.2. Optical Properties under Different Pollution Levels
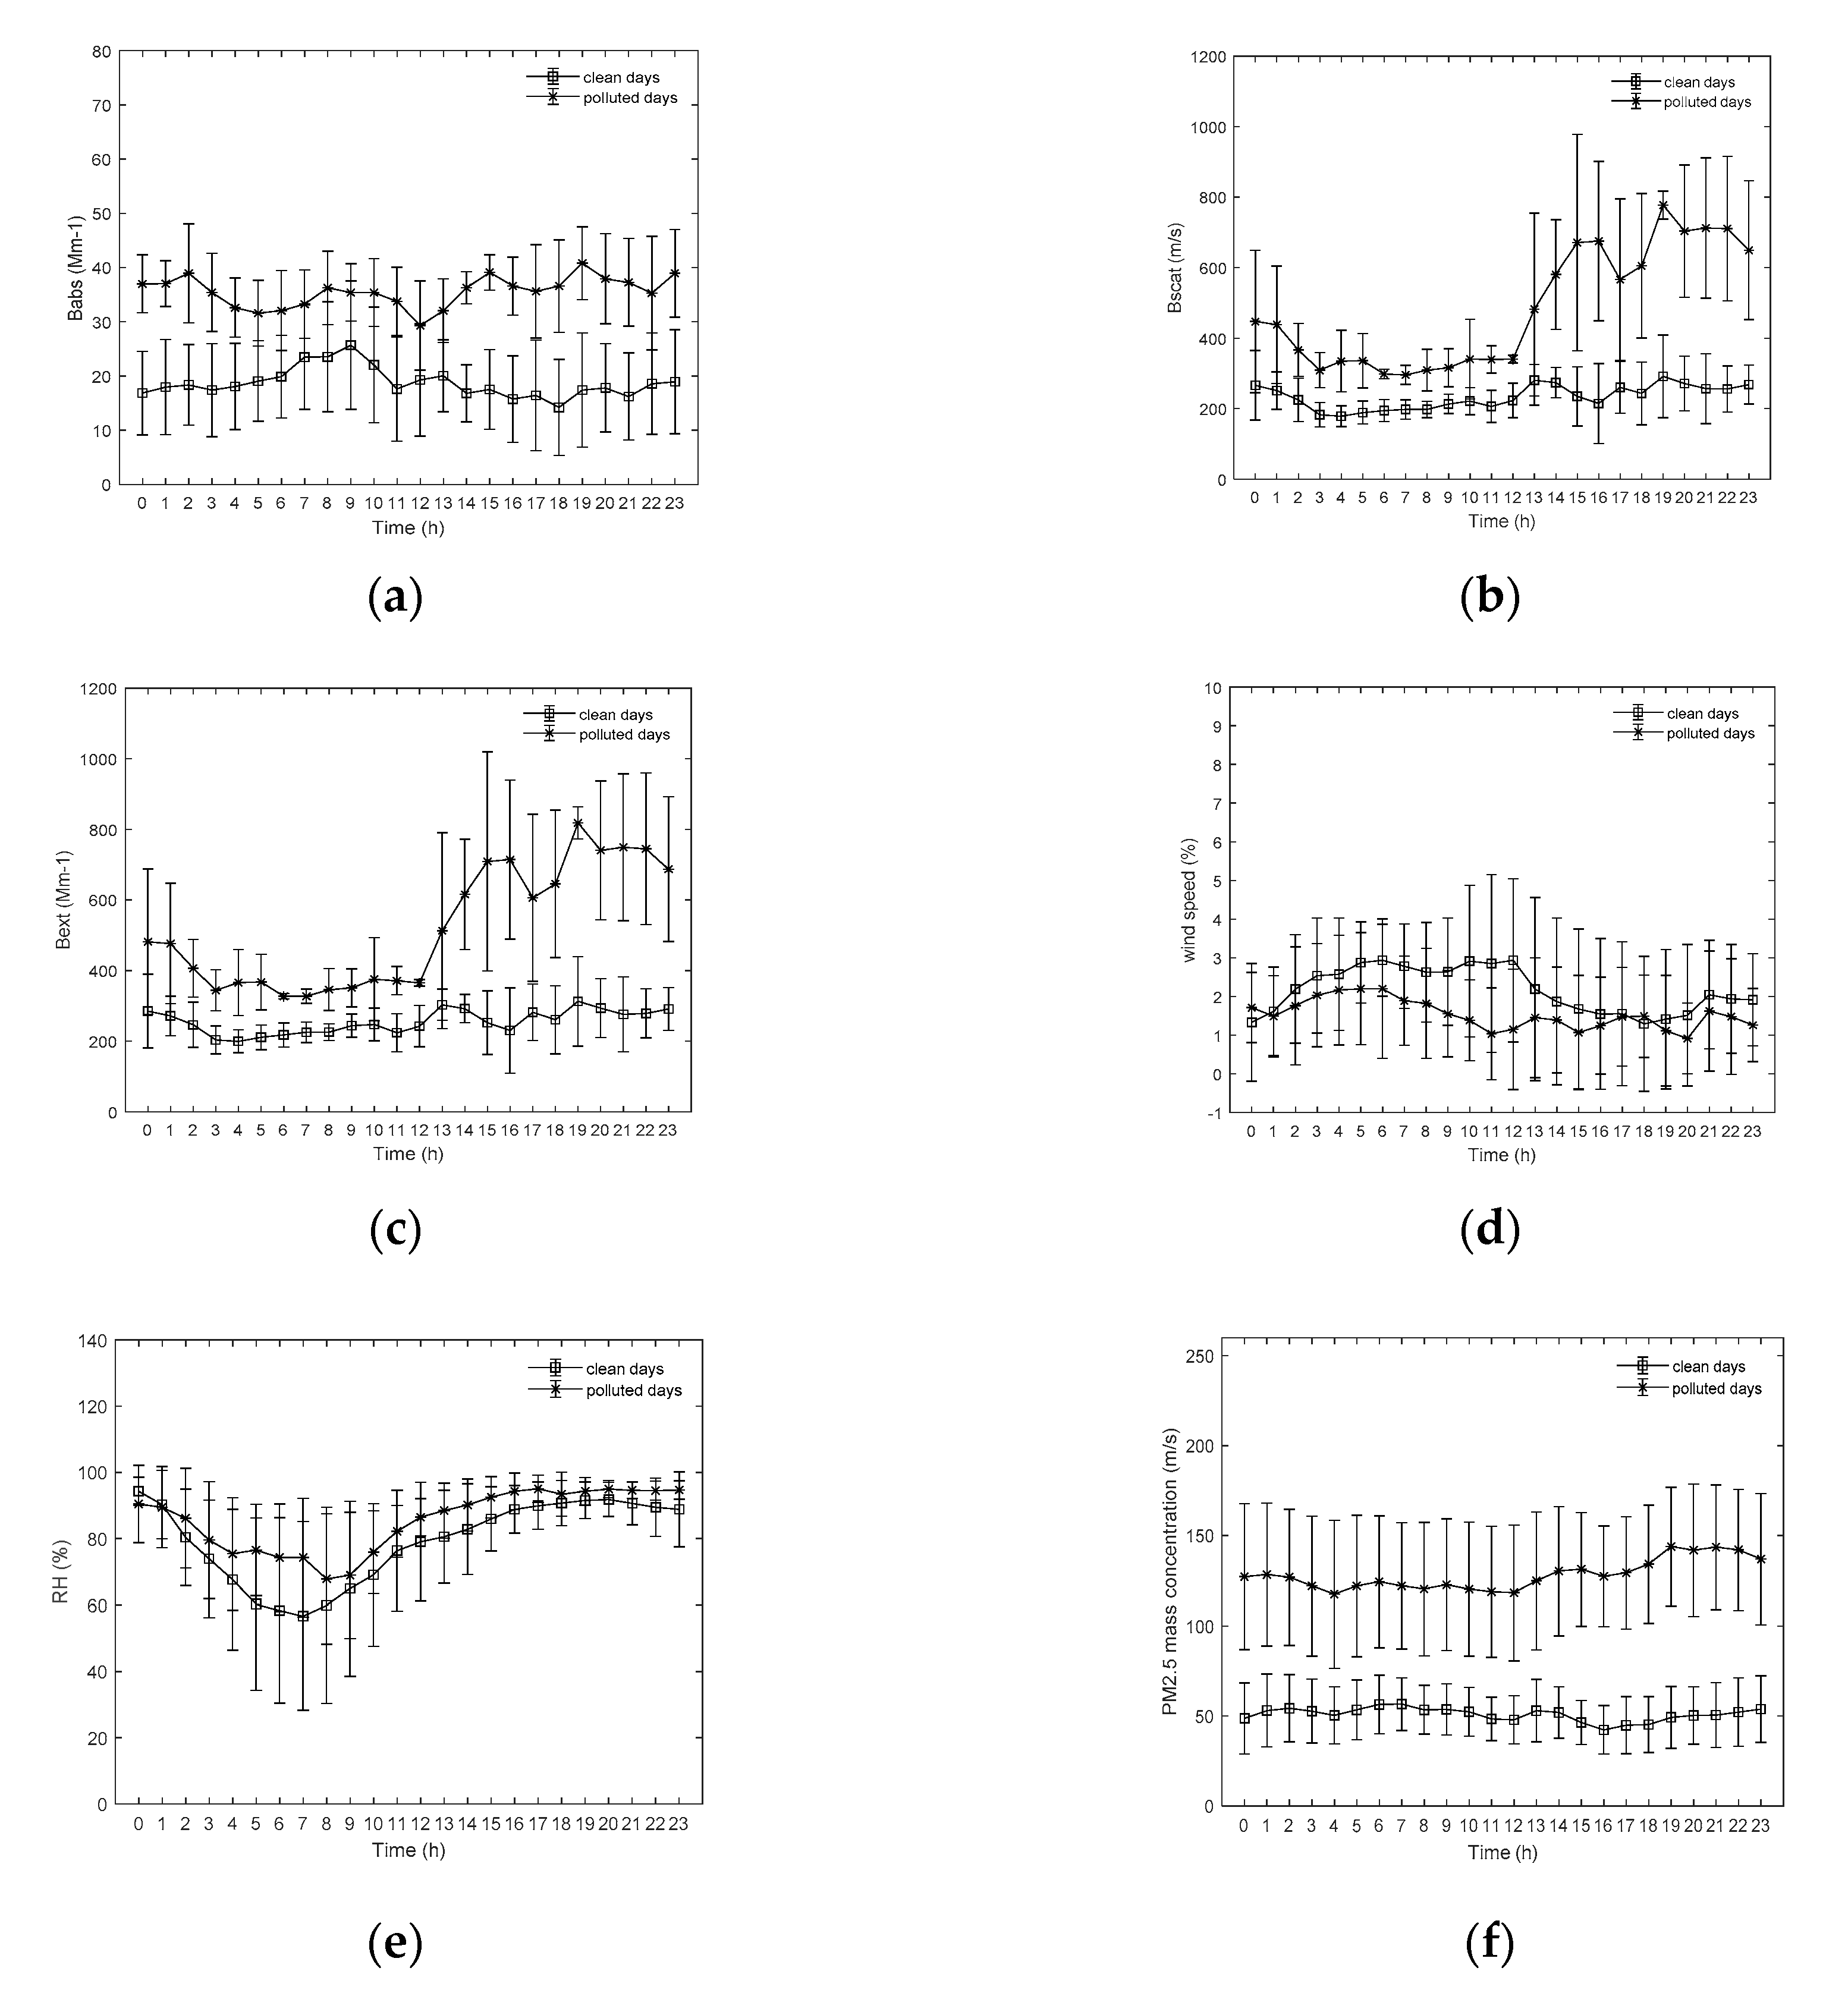
3.2.1. Diurnal Variations of Optical Parameters on Clean and Polluted Days
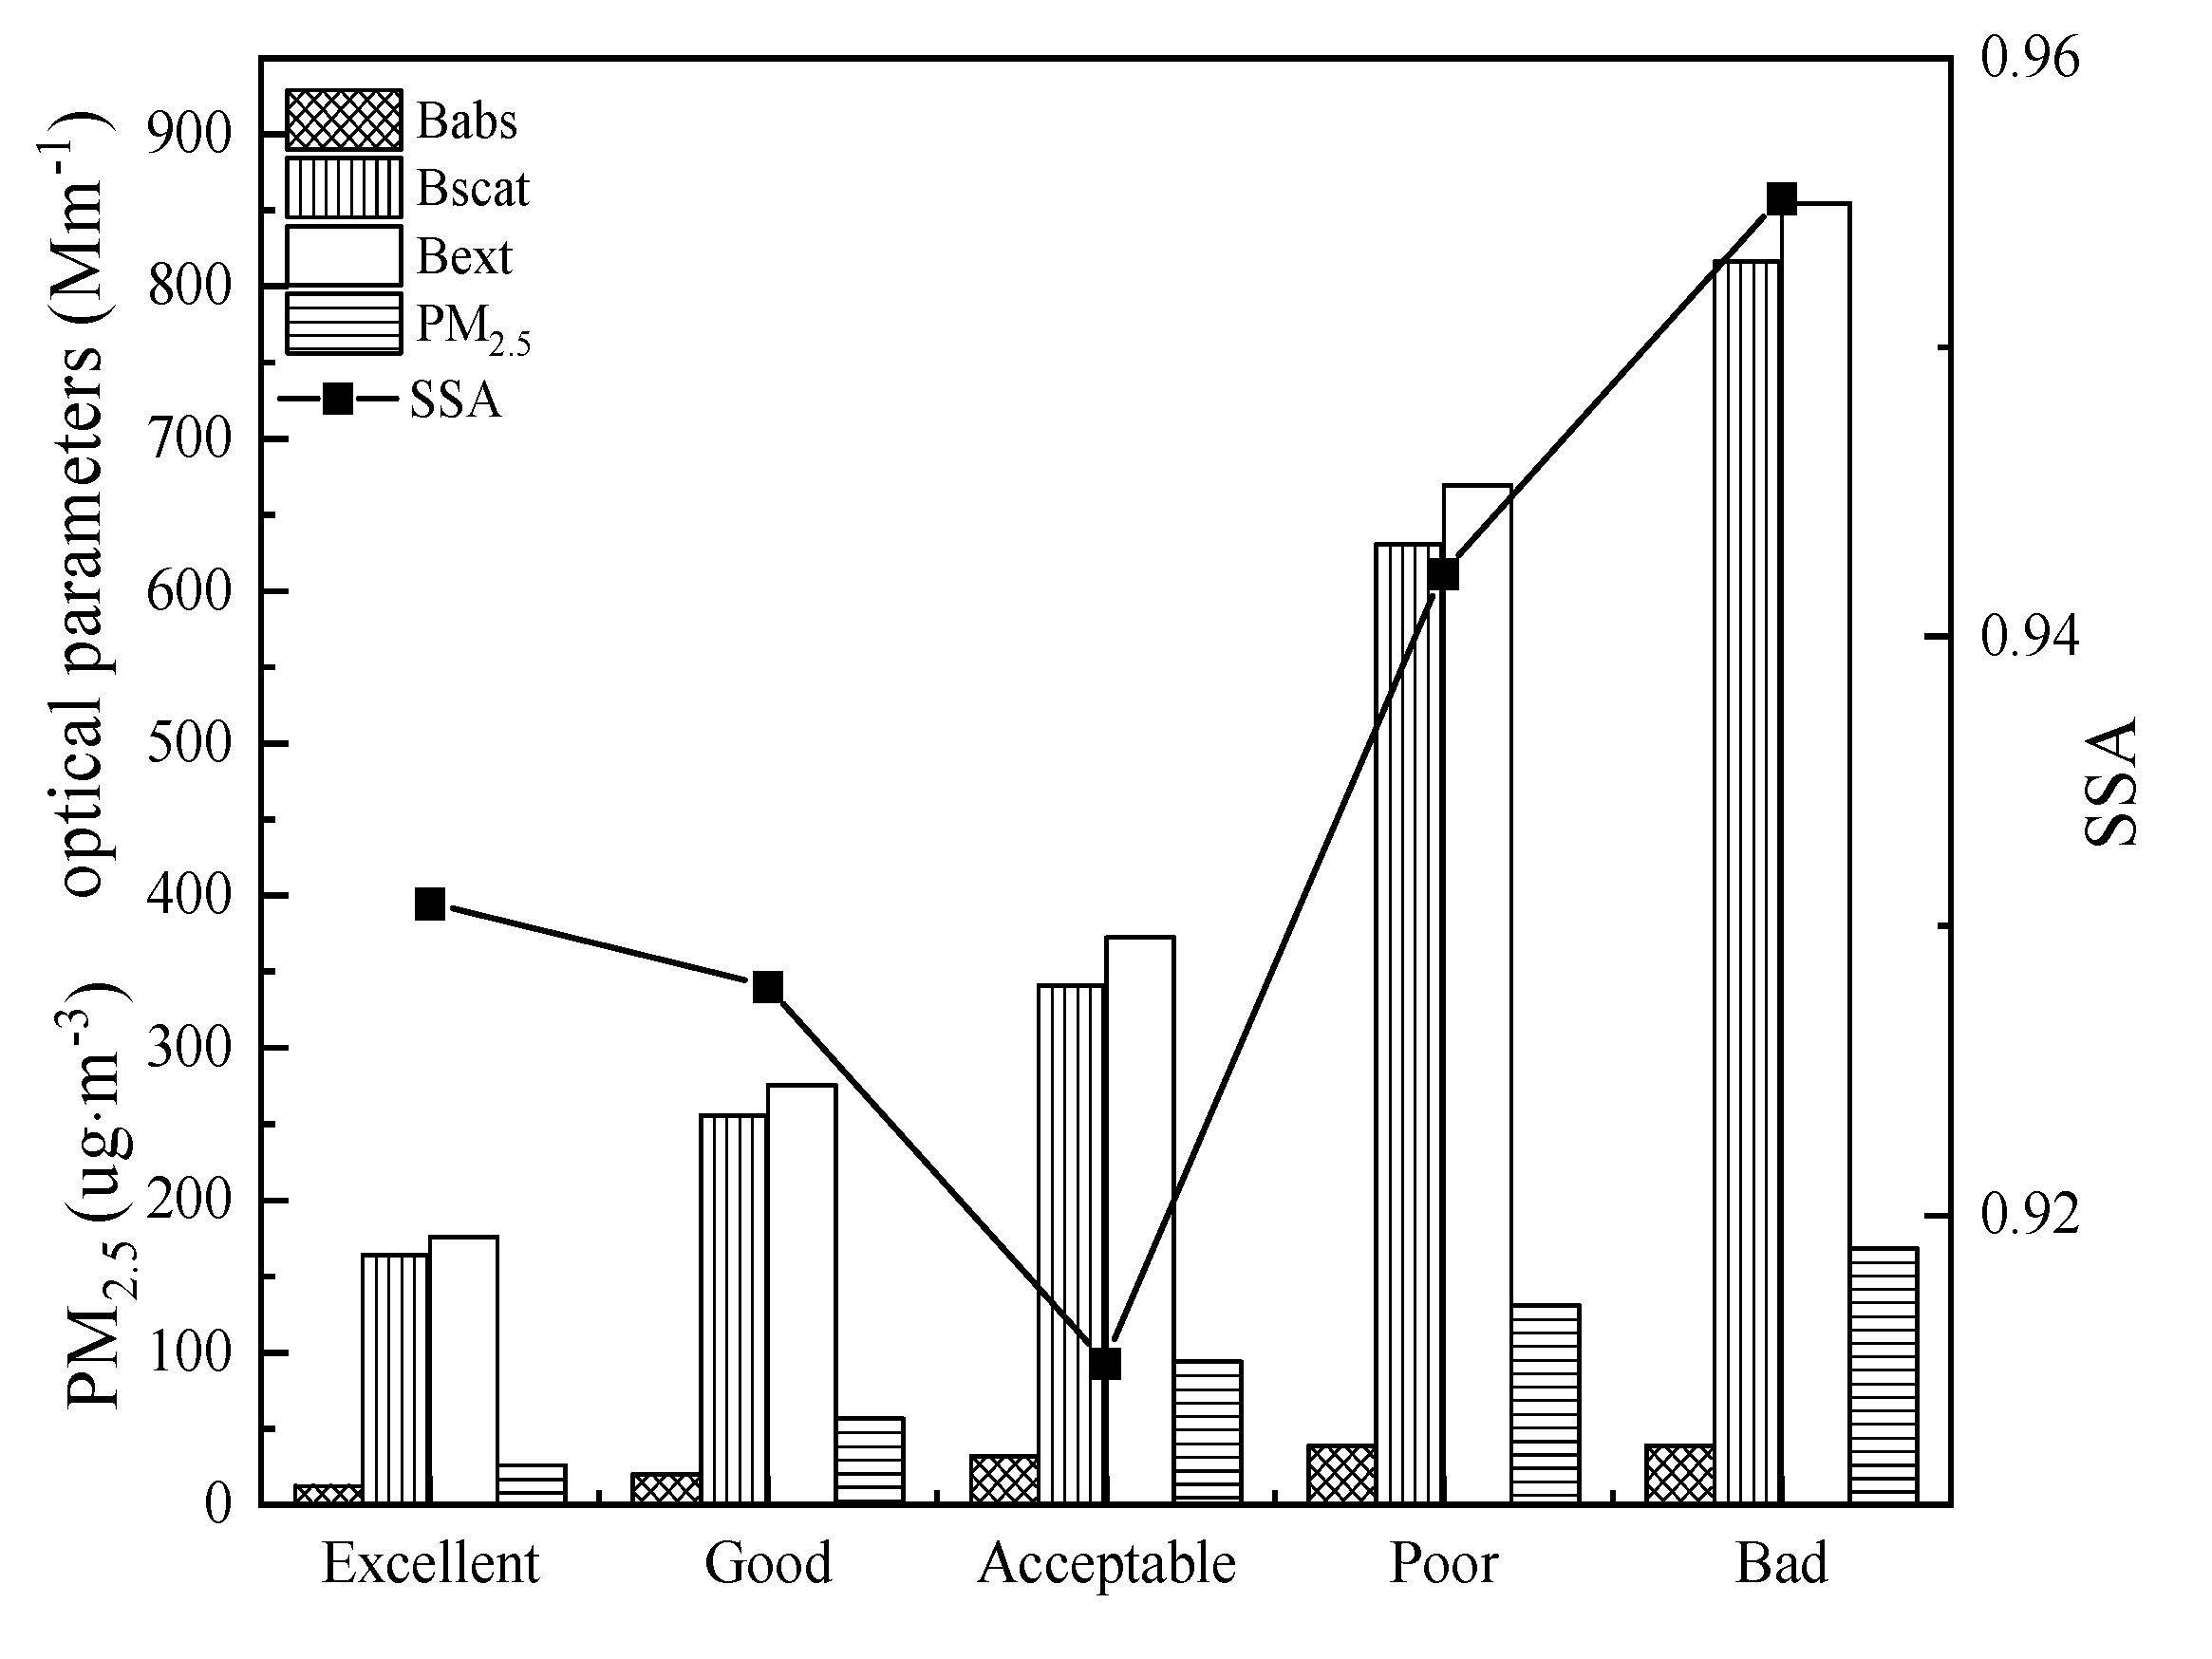
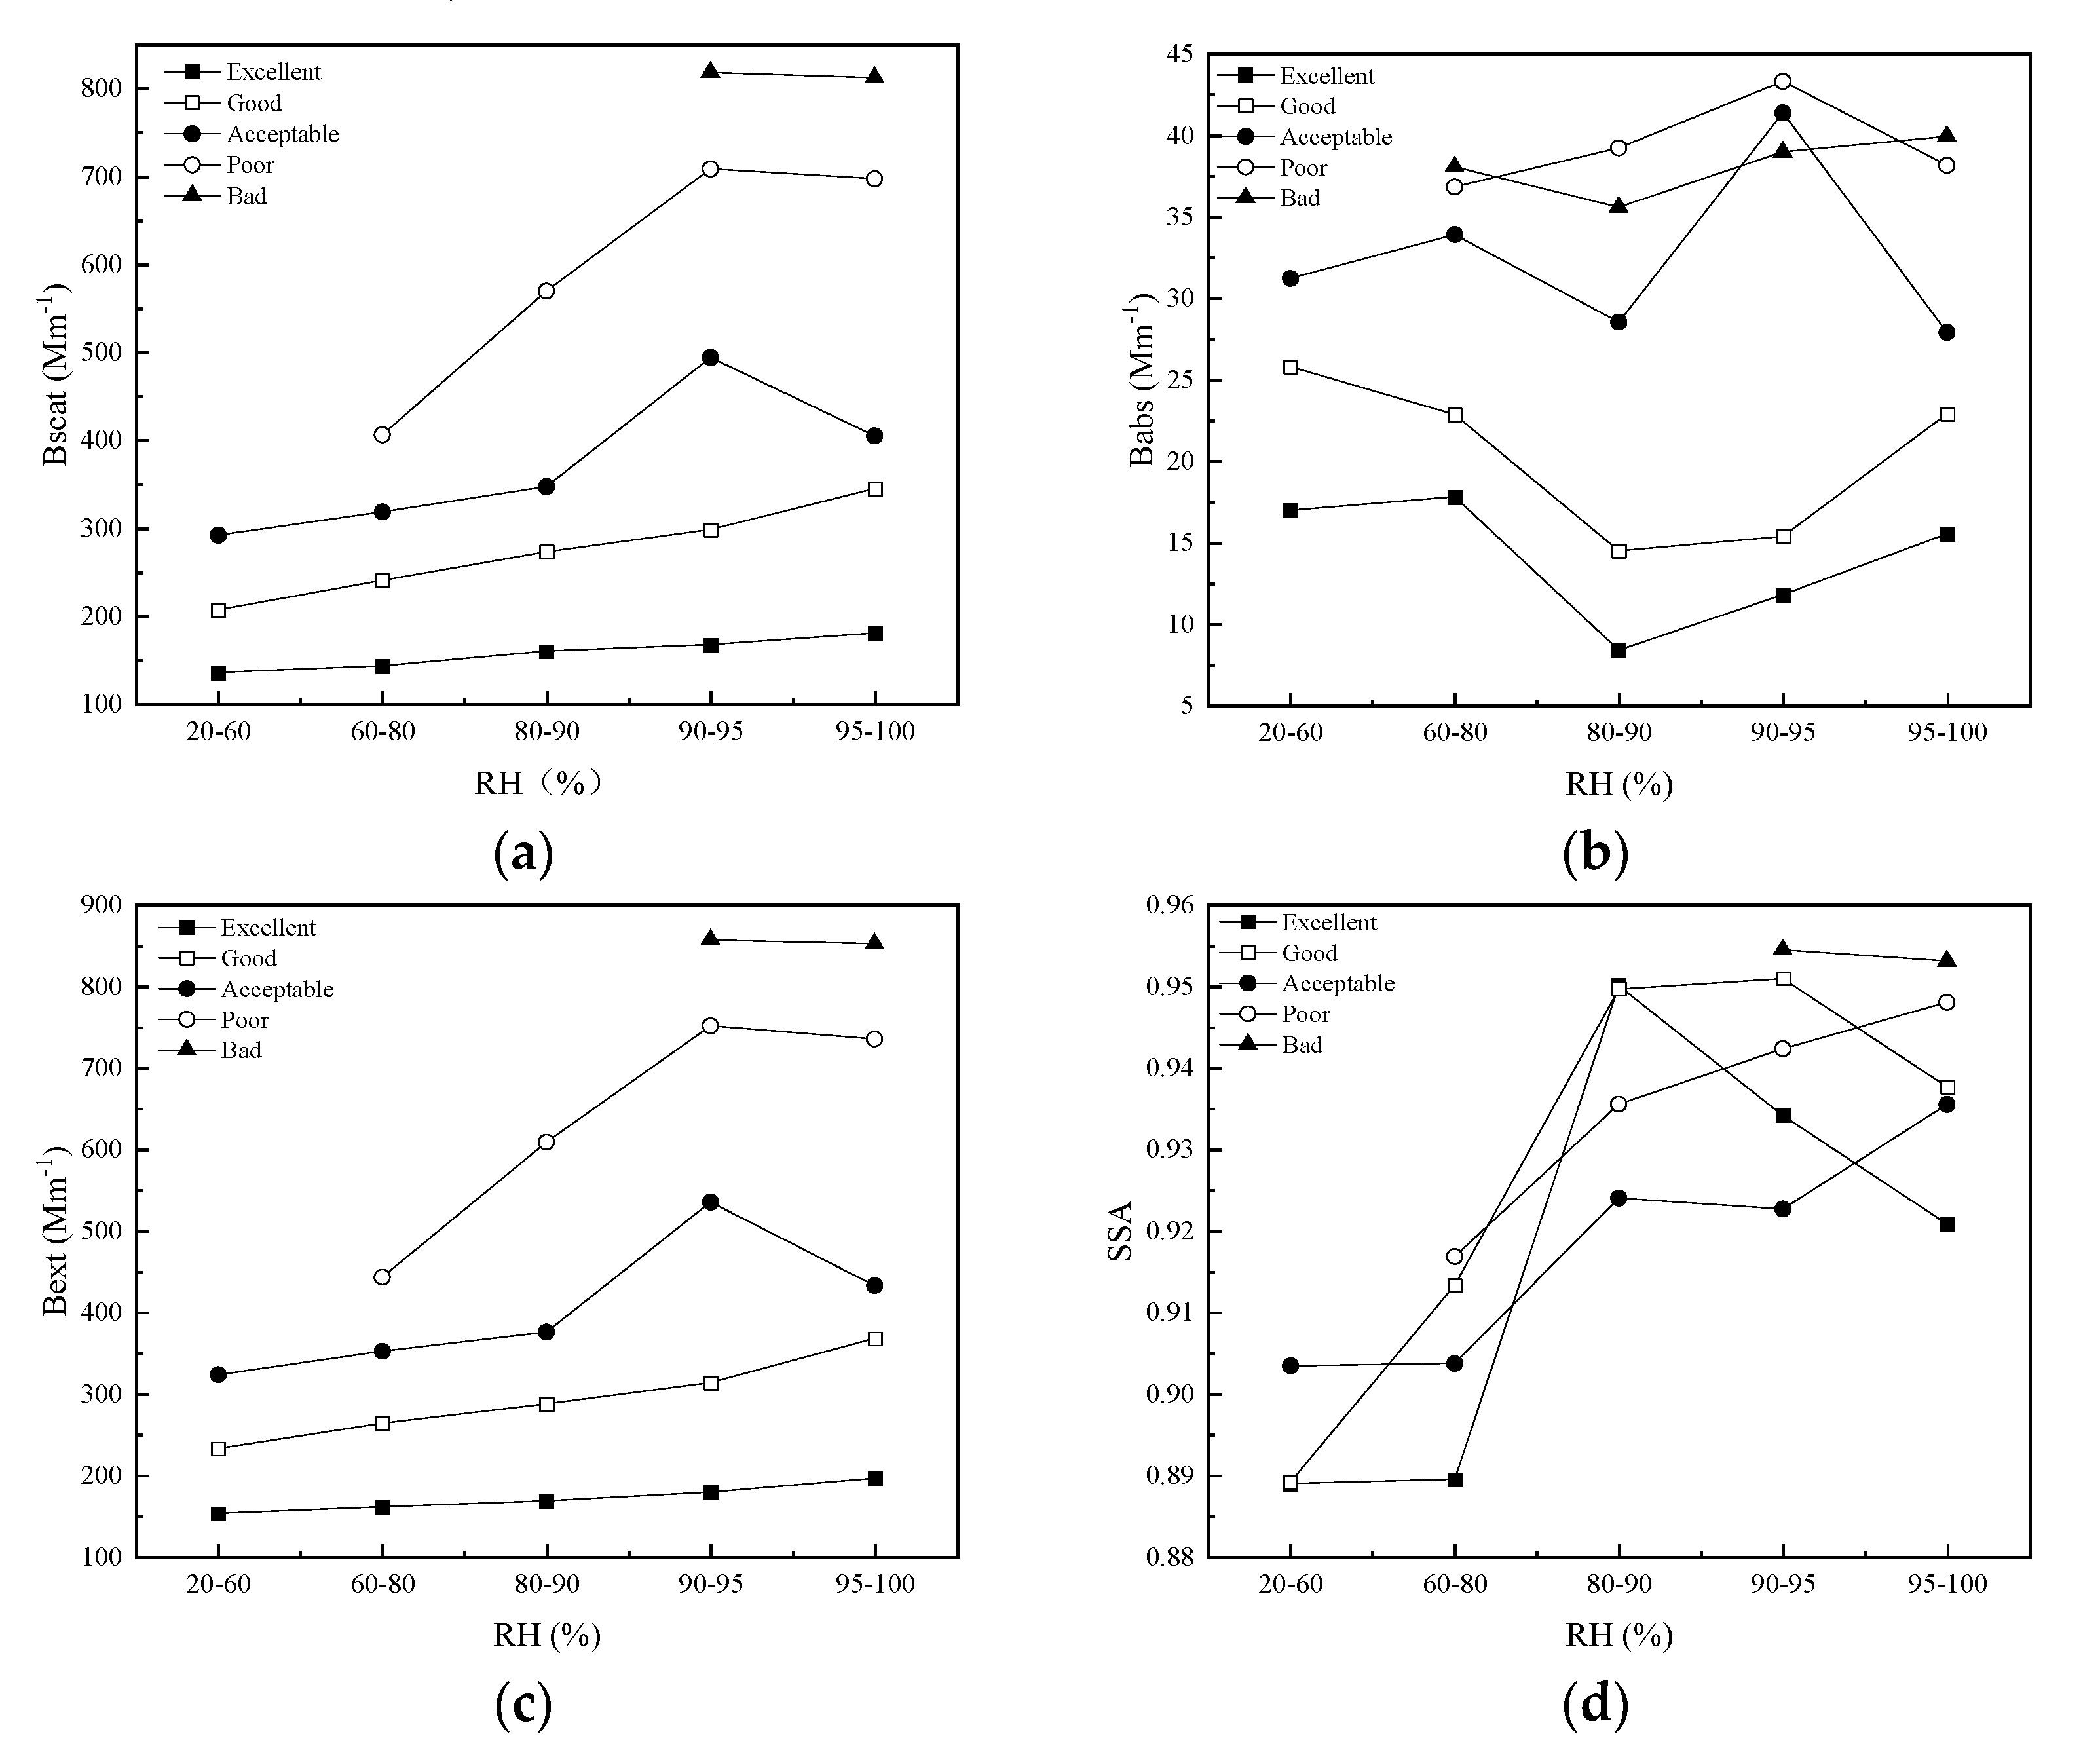
3.2.2. Analysis of Optical Parameters under Different Pollution Levels
3.2.3. Contribution of PM2.5 Chemical Components to Light Extinction under Different Pollution Levels
4. Conclusions
Author Contributions
Funding
Conflicts of Interest
References
- Fu, W.; Chen, Z.; Zhu, Z.; Liu, Q.; Qi, J.; Dang, E.; Wang, M.; Dong, J. Long-Term Atmospheric Visibility Trends and Characteristics of 31 Provincial Capital Cities in China during 1957–2016. Atmosphere 2018, 9, 318. [Google Scholar] [CrossRef]
- Ji, D.; Wang, Y.; Wang, L.; Chen, L.; Hu, B.; Tang, G.; Xin, J.; Song, T.; Wen, Y.; Sun, Y.; et al. Analysis of heavy pollution episodes in selected cities of northern China. Atmos. Environ. 2012, 50, 338–348. [Google Scholar] [CrossRef]
- Xin, J.; Wang, Y.; Tang, G.; Wang, L.; Sun, Y.; Wang, Y.; Hu, B.; Song, T.; Ji, D.; Wang, W.; et al. Variability and reduction of atmospheric pollutants in Beijing and its surrounding area during the Beijing 2008 Olympic Games. Chin. Sci. Bull. 2010, 55, 1937–1944. [Google Scholar] [CrossRef]
- Wang, L.; Zhang, N.; Liu, Z.; Sun, Y.; Ji, D.; Wang, Y. The influence of climate factors, meteorological conditions, and boundary-layer structure on severe haze pollution in the Beijing-Tianjin-Hebei region during January 2013. Adv. Meteorol. 2014, 2014, 685971. [Google Scholar] [CrossRef]
- Xing, Y.F.; Xu, Y.H.; Shi, M.H.; Lian, Y.X. The impact of PM2.5 on the human respiratory system. J. Thorac. Dis. 2016, 8, E69. [Google Scholar]
- Zhang, R.; Jing, J.; Tao, J.; Hsu, S.C.; Wang, G.; Cao, J.; Lee, C.S.L.; Zhu, L.; Chen, Z.; Zhao, Y.; et al. Chemical characterization and source apportionment of PM2.5 in Beijing: Seasonal perspective. Atmos. Chem. Phys. 2013, 13, 7053–7074. [Google Scholar] [CrossRef]
- Li, M.; Zhang, L. Haze in China: Current and future challenges. Environ. Pollut. 2014, 189, 85–86. [Google Scholar] [CrossRef]
- Malm, C.C.; Day, D.E. Estimates of aerosol species scattering characteristics as a function of relative humidity. Atmos. Environ. 2000, 35, 2845–2860. [Google Scholar] [CrossRef]
- Gysel, M.; Crosier, J.; Topping, D.O.; Whitehead, J.D.; Bower, K.N.; Cubison, M.J.; Williams, P.I.; Flynn, M.J.; McFiggans, G.B.; Coe, H. Closure study between chemical composition and hygroscopic growth of aerosol particles during TORCH2. Atmos. Chem. Phys. 2007, 7, 6131–6144. [Google Scholar] [CrossRef]
- Zhang, Y.; Huang, W.; Cai, T.; Fang, D.; Wang, Y.; Song, J.; Hu, M.; Zhang, Y. Concentrations and chemical compositions of fine particles (PM2.5) during haze and non-haze days in Beijing. Atmos. Res. 2016, 174, 62–69. [Google Scholar] [CrossRef]
- Waggoner, A.P.; Weiss, R.E.; Ahlquist, N.C.; Covert, D.S.; Will, S.; Charlson, R.J. Optical characteristics of atmospheric aerosols. Atmos. Environ. 1981, 15, 1891–1909. [Google Scholar] [CrossRef]
- Pitchford, M.; Malm, W.; Schichtel, B.; Kumar, N.; Lowenthal, D.; Hand, J. Revised Algorithm for Estimating Light Extinction from IMPROVE Particle Speciation Data. J. Air Waste Manag. 2012, 57, 1326–1336. [Google Scholar] [CrossRef] [PubMed]
- Park, S.M.; Song, I.H.; Park, J.S.; Oh, J.; Moon, K.J.; Shin, H.J.; Ahn, J.Y.; Lee, M.D.; Kim, J.; Lee, J. Variation of PM2.5 Chemical Compositions and their Contributions to Light Extinction in Seoul. Aerosol Air Qual. Res. 2018, 18, 2220–2229. [Google Scholar] [CrossRef]
- Wang, H.; Shi, G.; Tian, M.; Zhang, L.; Chen, Y.; Yang, F.; Cao, X. Aerosol optical properties and chemical composition apportionment in Sichuan Basin, China. Sci. Total Environ. 2017, 577, 245–257. [Google Scholar] [CrossRef]
- Deng, J.; Zhang, Y.; Hong, Y.; Xu, L.; Chen, Y.; Du, W.; Chen, J. Optical properties of PM2.5 and the impacts of chemical compositions in the coastal city Xiamen in China. Sci. Total Environ. 2016, 557, 665–675. [Google Scholar] [CrossRef]
- Tian, P.; Wang, G.; Zhang, R.; Wu, Y.; Yan, P. Impacts of aerosol chemical compositions on optical properties in urban Beijing, China. Particuology 2015, 18, 155–164. [Google Scholar] [CrossRef]
- Tao, J.; Zhang, L.; Ho, K.; Zhang, R.; Lin, Z.; Zhang, Z.; Lin, M.; Cao, J.; Liu, S.; Wang, G. Impact of PM2.5 chemical compositions on aerosol light scattering in Guangzhou—The largest megacity in South China. Atmos. Res. 2014, 135, 48–58. [Google Scholar] [CrossRef]
- Bergin, M.H.; Cass, G.R.; Xu, J.; Fang, C.; Zeng, L.M.; Yu, T.; Salmon, L.G.; Kiang, C.S.; Tang, X.Y.; Zhang, Y.H.; et al. Aerosol radiative, physical, and chemical properties in Beijing during June 1999. J. Geophys. Res. Atmos. 2001, 106, 17969–17980. [Google Scholar] [CrossRef]
- Wang, H.; Tian, M.; Li, X.; Chang, Q.; Cao, J.; Yang, F.; Ma, Y.; He, K. Chemical Composition and Light Extinction Contribution of PM2.5 in Urban Beijing for a 1-Year Period. Aerosol Air Qual. Res. 2015, 15, 2200–2211. [Google Scholar] [CrossRef]
- Chen, X.; Lai, S.; Gao, Y.; Zhang, Y.; Zhao, Y.; Chen, D.; Zheng, J.; Zhong, L.; Lee, S.C.; Chen, B. Reconstructed Light Extinction Coefficients of Fine Particulate Matter in Rural Guangzhou, Southern China. Aerosol Air Qual. Res. 2016, 16, 1981–1990. [Google Scholar] [CrossRef]
- Cheng, Y.F.; Wiedensohler, A.; Eichler, H.; Su, H.; Gnauk, T.; Brüggemann, E.; Heintzenberg, J.; Slanina, J.; Tuch, T.; Hu, M.; et al. Aerosol optical properties and related chemical apportionment at Xinken in Pearl River Delta of China. Atmos. Environ. 2008, 42, 6351–6372. [Google Scholar] [CrossRef]
- Cui, F.; Chen, M.; Ma, Y.; Zheng, J.; Zhou, Y.; Li, S.; Qi, L.; Wang, L. An intensive study on aerosol optical properties and affecting factors in Nanjing, China. J. Environ. Sci. 2016, 40, 35–43. [Google Scholar] [CrossRef] [PubMed]
- Qiu, Y.; Shu, Z. The effect of relative humidity on the tropospheric aerosol extinction coefficient with typical underlying surfaces based on CALIPSO data. Int. J. Remote Sens. 2017, 39, 276–288. [Google Scholar] [CrossRef]
- Skupin, A.; Ansmann, A.; Engelmann, R.; Seifert, P.; Müller, T. Four-year long-path monitoring of ambient aerosol extinction at a central European urban site: Dependence on relative humidity. Atmos. Chem. Phys. 2016, 16, 1863–1876. [Google Scholar] [CrossRef]
- Tao, J.; Zhang, L.; Zhang, Z.; Huang, R.; Wu, Y.; Zhang, R.; Cao, J.; Zhang, Y. Control of PM2.5 in Guangzhou during the 16th Asian Games period: Implication for hazy weather prevention. Sci. Total Environ. 2015, 508, 57–66. [Google Scholar] [CrossRef]
- Wu, J.; Bei, N.; Hu, B.; Liu, S.; Zhou, M.; Wang, Q.; Li, X.; Liu, Q.; Liu, L.; Feng, T.; et al. Is water vapor a key player of the wintertime haze in North China Plain? Atmos. Chem. Phys. 2019, 19, 8721–8739. [Google Scholar] [CrossRef]
- Kang, H.; Zhu, B.; Su, J.; Wang, H.; Zhang, Q.; Wang, F. Analysis of a long-lasting haze episode in Nanjing, China. Atmos. Res. 2013, 120, 78–87. [Google Scholar] [CrossRef]
- Yu, X.; Kumar, K.R.; Lu, R.; Ma, J. Changes in column aerosol optical properties during extreme haze-fog episodes in January 2013 over urban Beijing. Environ. Pollut. 2016, 210, 217–226. [Google Scholar] [CrossRef]
- Jing, J.; Wu, Y.; Tao, J.; Che, H.; Xia, X.; Zhang, X.; Yan, P.; Zhao, D.; Zhang, L. Observation and analysis of near-surface atmospheric aerosol optical properties in urban Beijing. Particuology 2015, 18, 144–154. [Google Scholar] [CrossRef]
- Tao, J.; Zhang, L.; Cao, J.; Hsu, S.C.; Xia, X.; Zhang, Z.; Lin, Z.; Cheng, T.; Zhang, R. Characterization and source apportionment of aerosol light extinction in Chengdu, southwest China. Atmos. Environ. 2014, 95, 552–562. [Google Scholar] [CrossRef]
- Kong, L.; Hu, M.; Tan, Q.; Feng, M.; Qu, Y.; An, J.; Zhang, Y.; Liu, X.; Cheng, N. Aerosol optical properties under different pollution levels in the Pearl River Delta (PRD) region of China. J. Environ. Sci. 2020, 87, 49–59. [Google Scholar] [CrossRef] [PubMed]
- Che, H.; Xia, X.; Zhu, J.; Li, Z.; Dubovik, O.; Holben, B.; Goloub, P.; Chen, H.; Estelles, V.; Cuevas-Agulló, E.; et al. Column aerosol optical properties and aerosol radiative forcing during a serious haze-fog month over North China Plain in 2013 based on ground-based sunphotometer measurements. Atmos. Chem. Phys. 2014, 14, 2125–2138. [Google Scholar] [CrossRef]
- Yue, Y.Y.; Wang, X.L. Analysis of the Characteristics of Haze and its Pollutants in Wuhan. Adv. Mater. Res. 2014, 1073, 513–516. [Google Scholar] [CrossRef]
- Zhang, F.; Wang, Z.W.; Cheng, H.R.; Lv, X.P.; Gong, W.; Wang, X.M.; Zhang, G. Seasonal variations and chemical characteristics of PM2.5 in Wuhan, central China. Sci. Total Environ. 2015, 518, 97–105. [Google Scholar] [CrossRef]
- Lu, M.; Tang, X.; Wang, Z.; Gbaguidi, A.; Liang, S.; Hu, K.; Wu, L.; Wu, H.; Huang, Z.; Shen, L. Source tagging modeling study of heavy haze episodes under complex regional transport processes over Wuhan megacity, Central China. Environ. Pollut. 2017, 231 Pt 1, 612–621. [Google Scholar] [CrossRef]
- Jongejan, P.A.C.; Bai, Y.; Veltkamp, A.C.; Wyers, G.P.; Slanina, J. An automated field instrument for the determination of acidic gases in air. Int. J. Environ. Anal. Chem. 1997, 66, 241–251. [Google Scholar] [CrossRef]
- Khezri, B.; Mo, H.; Yan, Z.; Chong, S.L.; Heng, A.K.; Webster, R.D. Simultaneous online monitoring of inorganic compounds in aerosols and gases in an industrialized area. Atmos. Environ. 2013, 80, 352–360. [Google Scholar] [CrossRef]
- Chow, J.C.; Watson, J.G. Guideline on Speciated Particulate Monitoring; US EPA: Washington, DC, USA, 1998; Volume 3–7, pp. 4–37. [Google Scholar]
- Rumsey, I.C.; Cowen, K.A.; Walker, J.T.; Kelly, T.J.; Hanft, E.A.; Mishoe, K.; Rogers, C.; Proost, R.; Beachley, G.M.; Lear, G.; et al. An assessment of the performance of the Monitor for AeRosols and GAses in ambient air (MARGA): A semi-continuous method for soluble compounds. Atmos. Chem. Phys. 2014, 14, 5639–5658. [Google Scholar] [CrossRef]
- Bae, M.S.; Schauer, J.J.; DeMinter, J.T.; Turner, J.R.; Smith, D.; Cary, R.A. Validation of a semi-continuous instrument for elemental carbon and organic carbon using a thermal-optical method. Atmos. Environ. 2004, 38, 2885–2893. [Google Scholar] [CrossRef]
- Bauer, J.J.; Yu, X.Y.; Cary, R.; Laulainen, N.; Berkowitz, C. Characterization of the sunset semi-continuous carbon aerosol analyzer. J. Air Waste Manag. Assoc. 2012, 59, 826–833. [Google Scholar] [CrossRef]
- Schmid, O.; Chand, D.; Andreae, M.O. Aerosol optical properties in urban Guangzhou. In Proceedings of the PRD Workshop, Beijing, China, 13–14 January 2005. [Google Scholar]
- Koschmieder, H. Theorie der horizontalen Sichtweite. Beitrage zur Physik der freien Atmosphare 1924, 1924, 33–53. [Google Scholar]


© 2019 by the authors. Licensee MDPI, Basel, Switzerland. This article is an open access article distributed under the terms and conditions of the Creative Commons Attribution (CC BY) license (http://creativecommons.org/licenses/by/4.0/).
Share and Cite
Bai, D.; Wang, H.; Tan, Y.; Yin, Y.; Wu, Z.; Guo, S.; Shen, L.; Zhu, B.; Wang, J.; Kong, X. Optical Properties of Aerosols and Chemical Composition Apportionment under Different Pollution Levels in Wuhan during January 2018. Atmosphere 2020, 11, 17. https://doi.org/10.3390/atmos11010017
Bai D, Wang H, Tan Y, Yin Y, Wu Z, Guo S, Shen L, Zhu B, Wang J, Kong X. Optical Properties of Aerosols and Chemical Composition Apportionment under Different Pollution Levels in Wuhan during January 2018. Atmosphere. 2020; 11(1):17. https://doi.org/10.3390/atmos11010017
Chicago/Turabian StyleBai, Dongping, Honglei Wang, Yue Tan, Yan Yin, Zhijun Wu, Song Guo, Lijuan Shen, Bin Zhu, Jinhu Wang, and Xiangchen Kong. 2020. "Optical Properties of Aerosols and Chemical Composition Apportionment under Different Pollution Levels in Wuhan during January 2018" Atmosphere 11, no. 1: 17. https://doi.org/10.3390/atmos11010017
APA StyleBai, D., Wang, H., Tan, Y., Yin, Y., Wu, Z., Guo, S., Shen, L., Zhu, B., Wang, J., & Kong, X. (2020). Optical Properties of Aerosols and Chemical Composition Apportionment under Different Pollution Levels in Wuhan during January 2018. Atmosphere, 11(1), 17. https://doi.org/10.3390/atmos11010017