Estimation of Forest Fire Emissions in Southwest China from 2013 to 2017


Abstract
1. Introduction
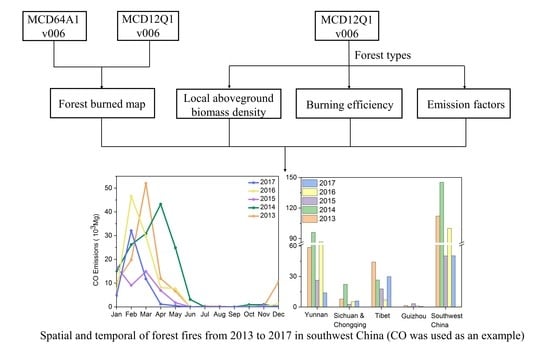
2. Methods
2.1. Emission Calculation
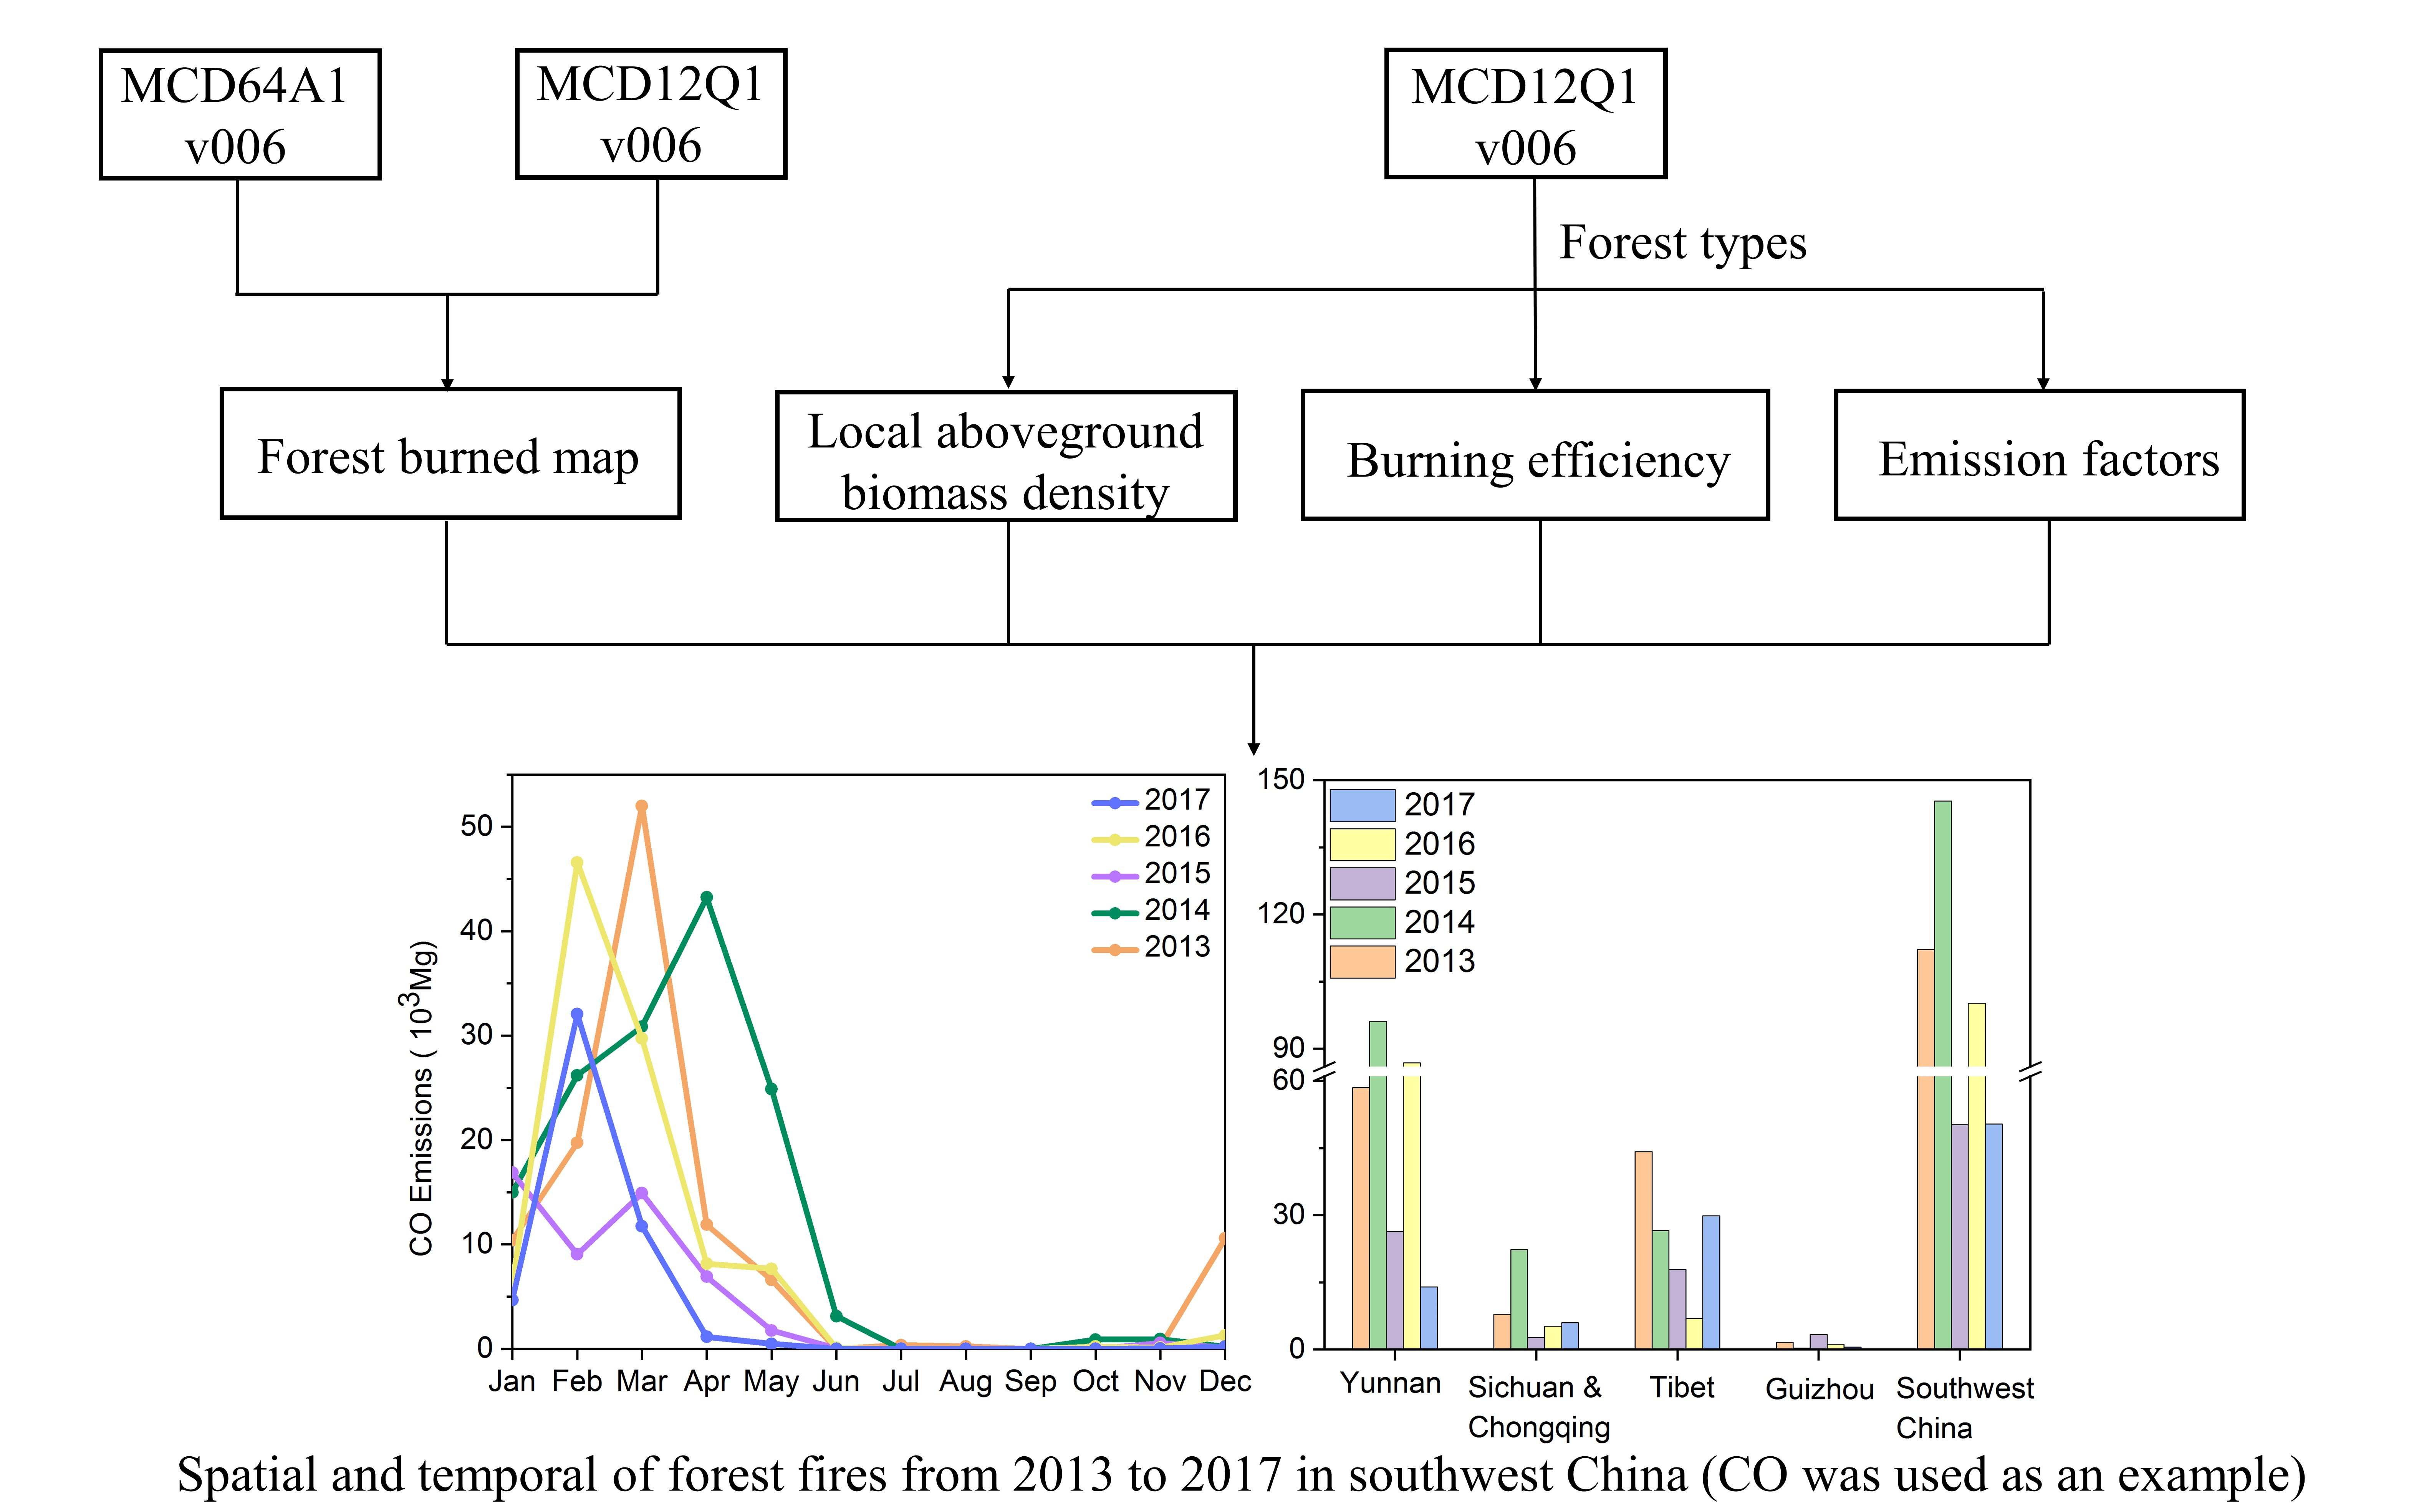
2.2. Forest Cover
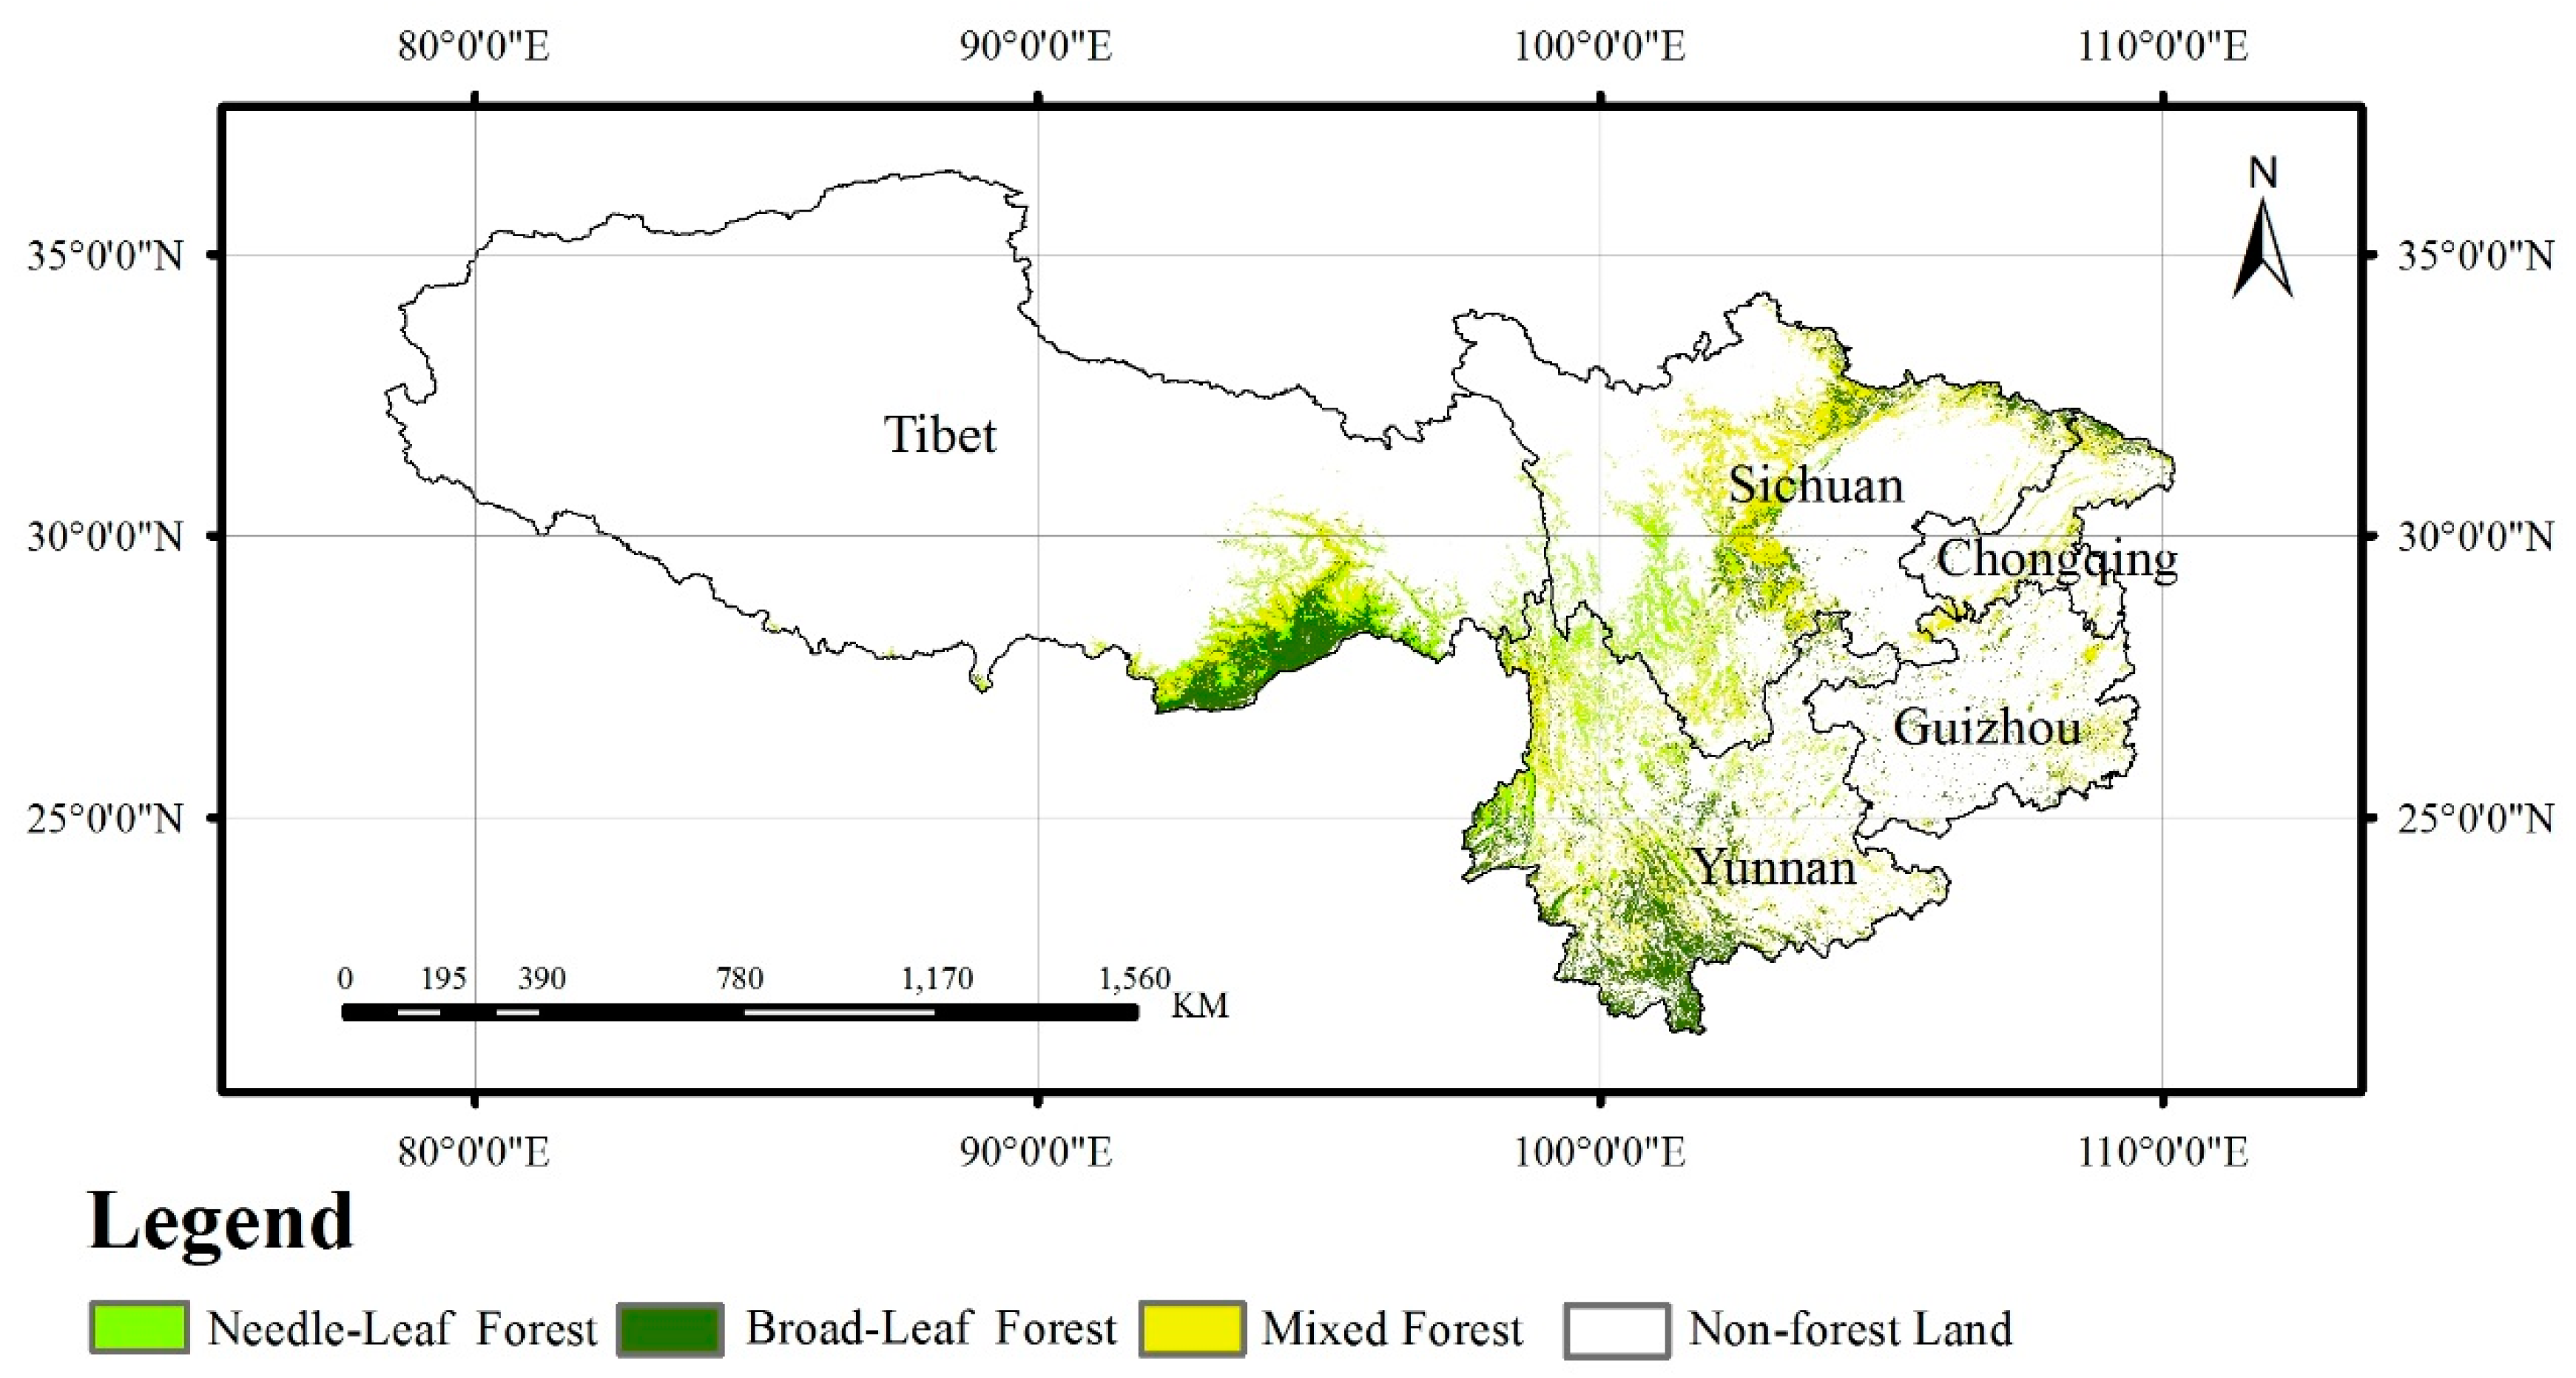
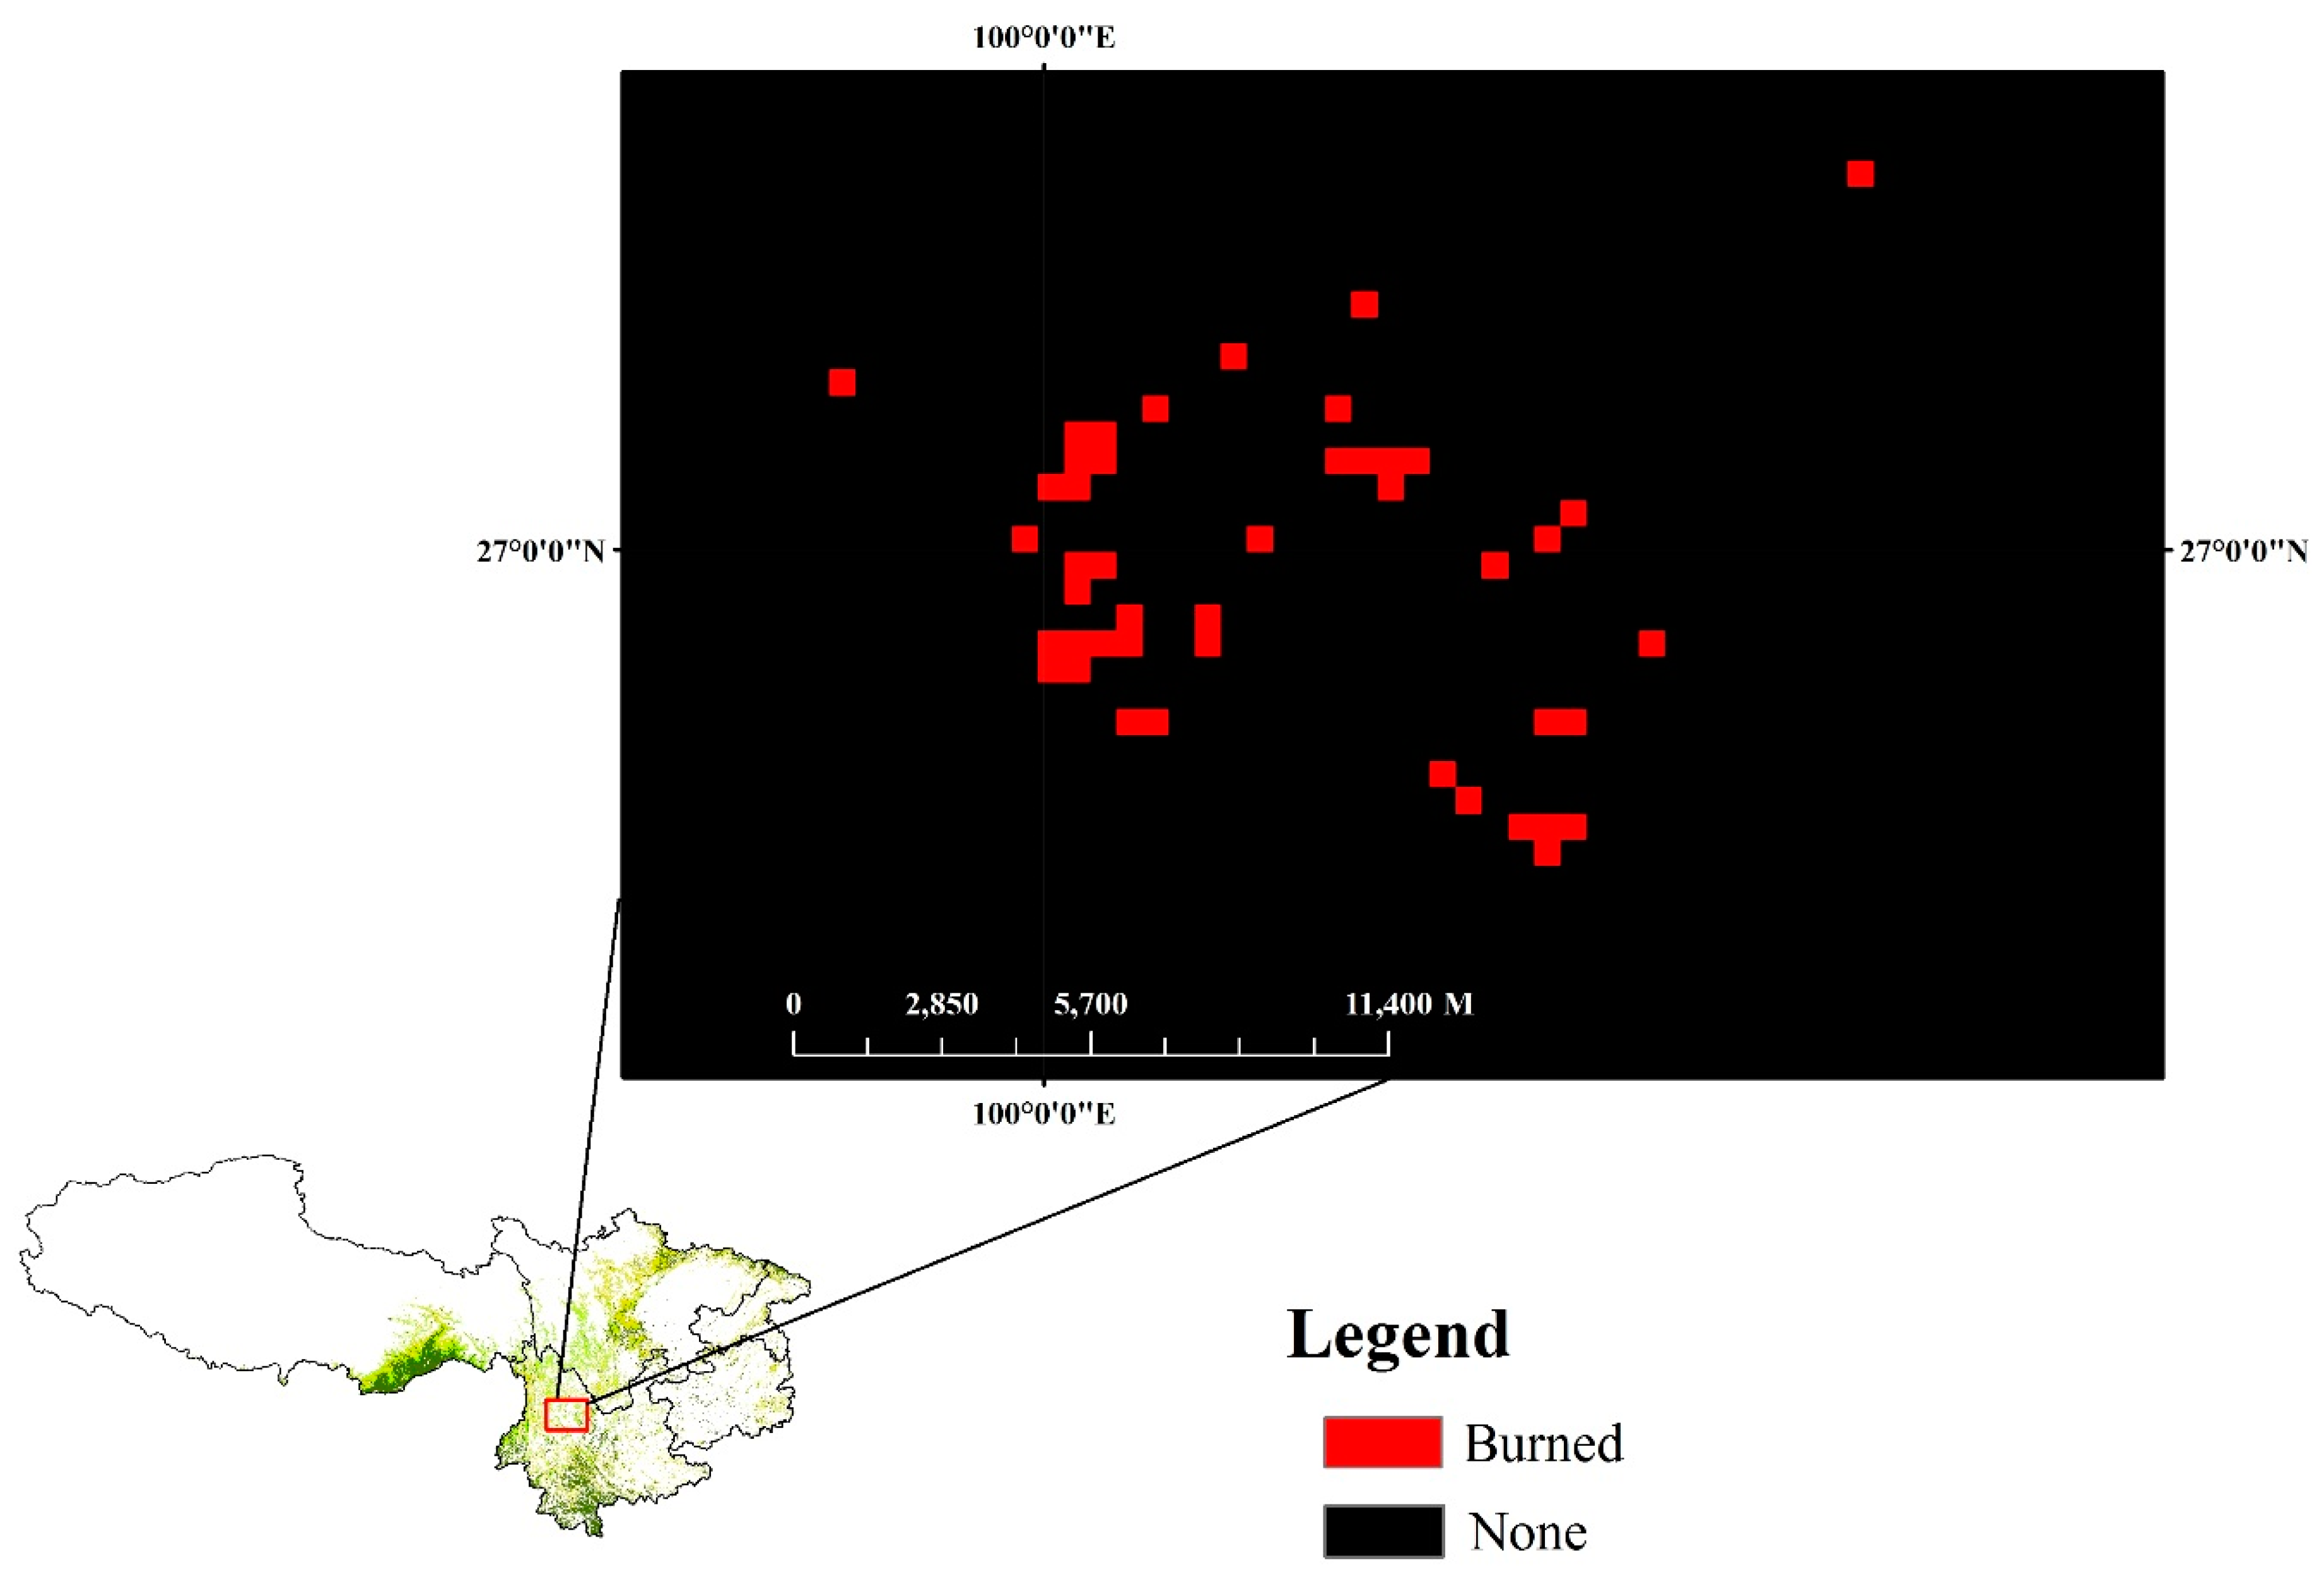
2.3. Burned Area
2.4. Biomass Density and Burning Efficiency
2.5. Emission Factors
3. Results and Discussion
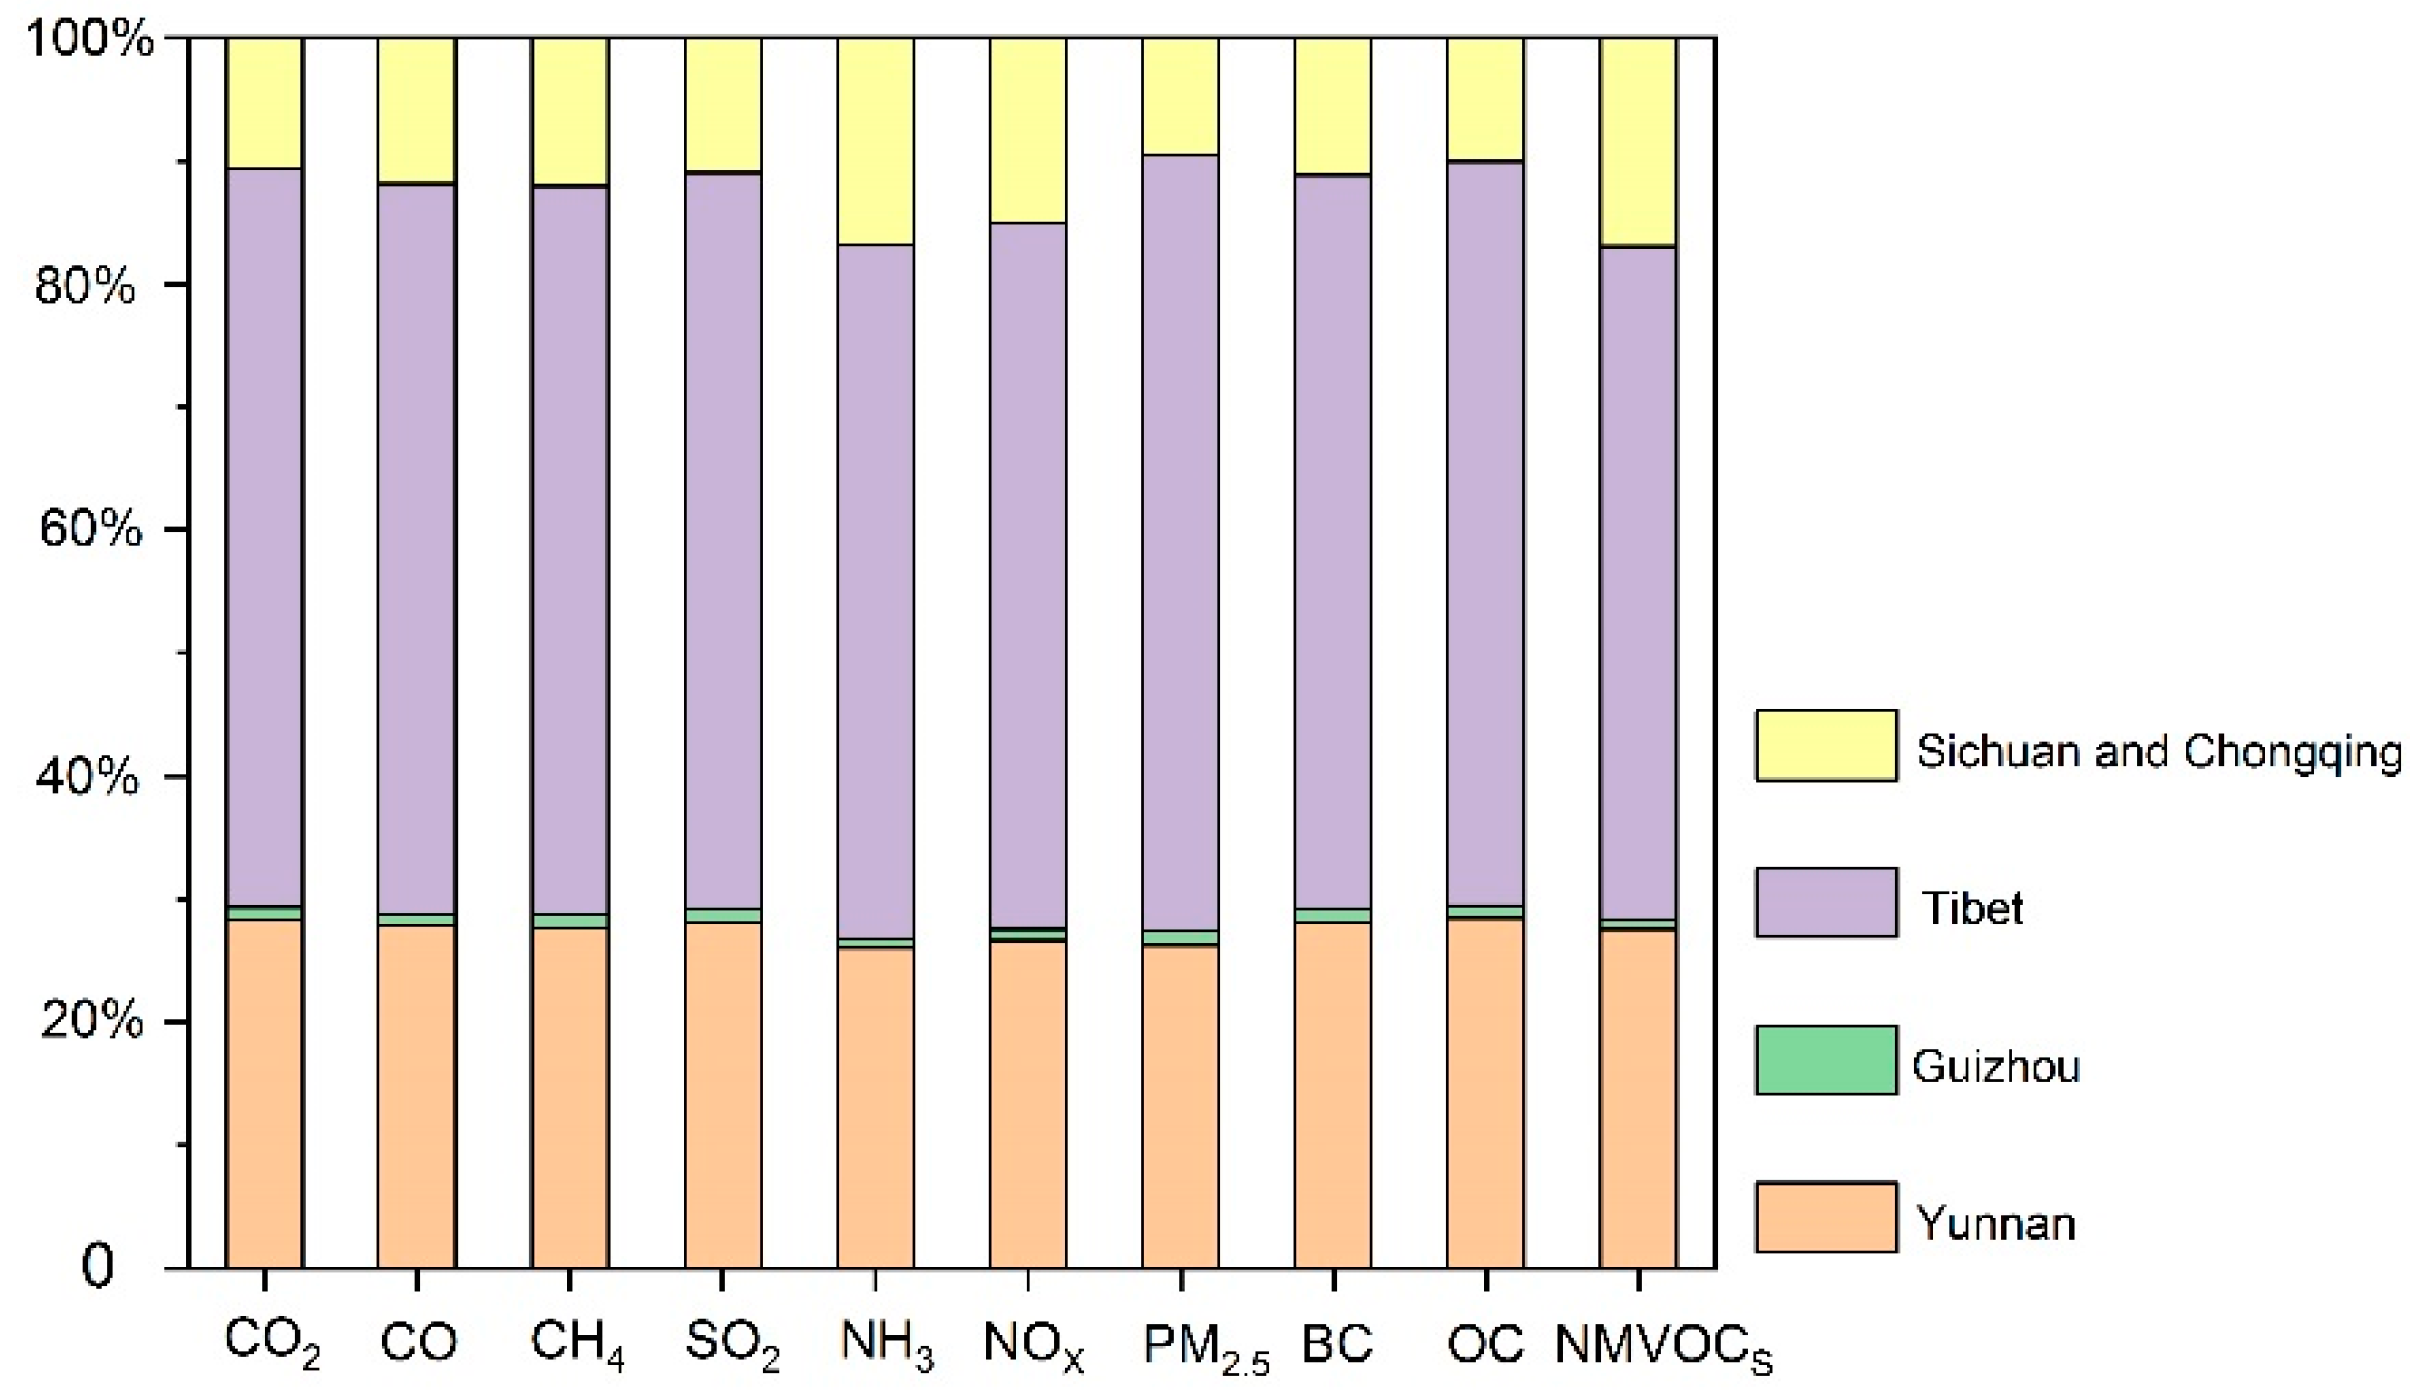
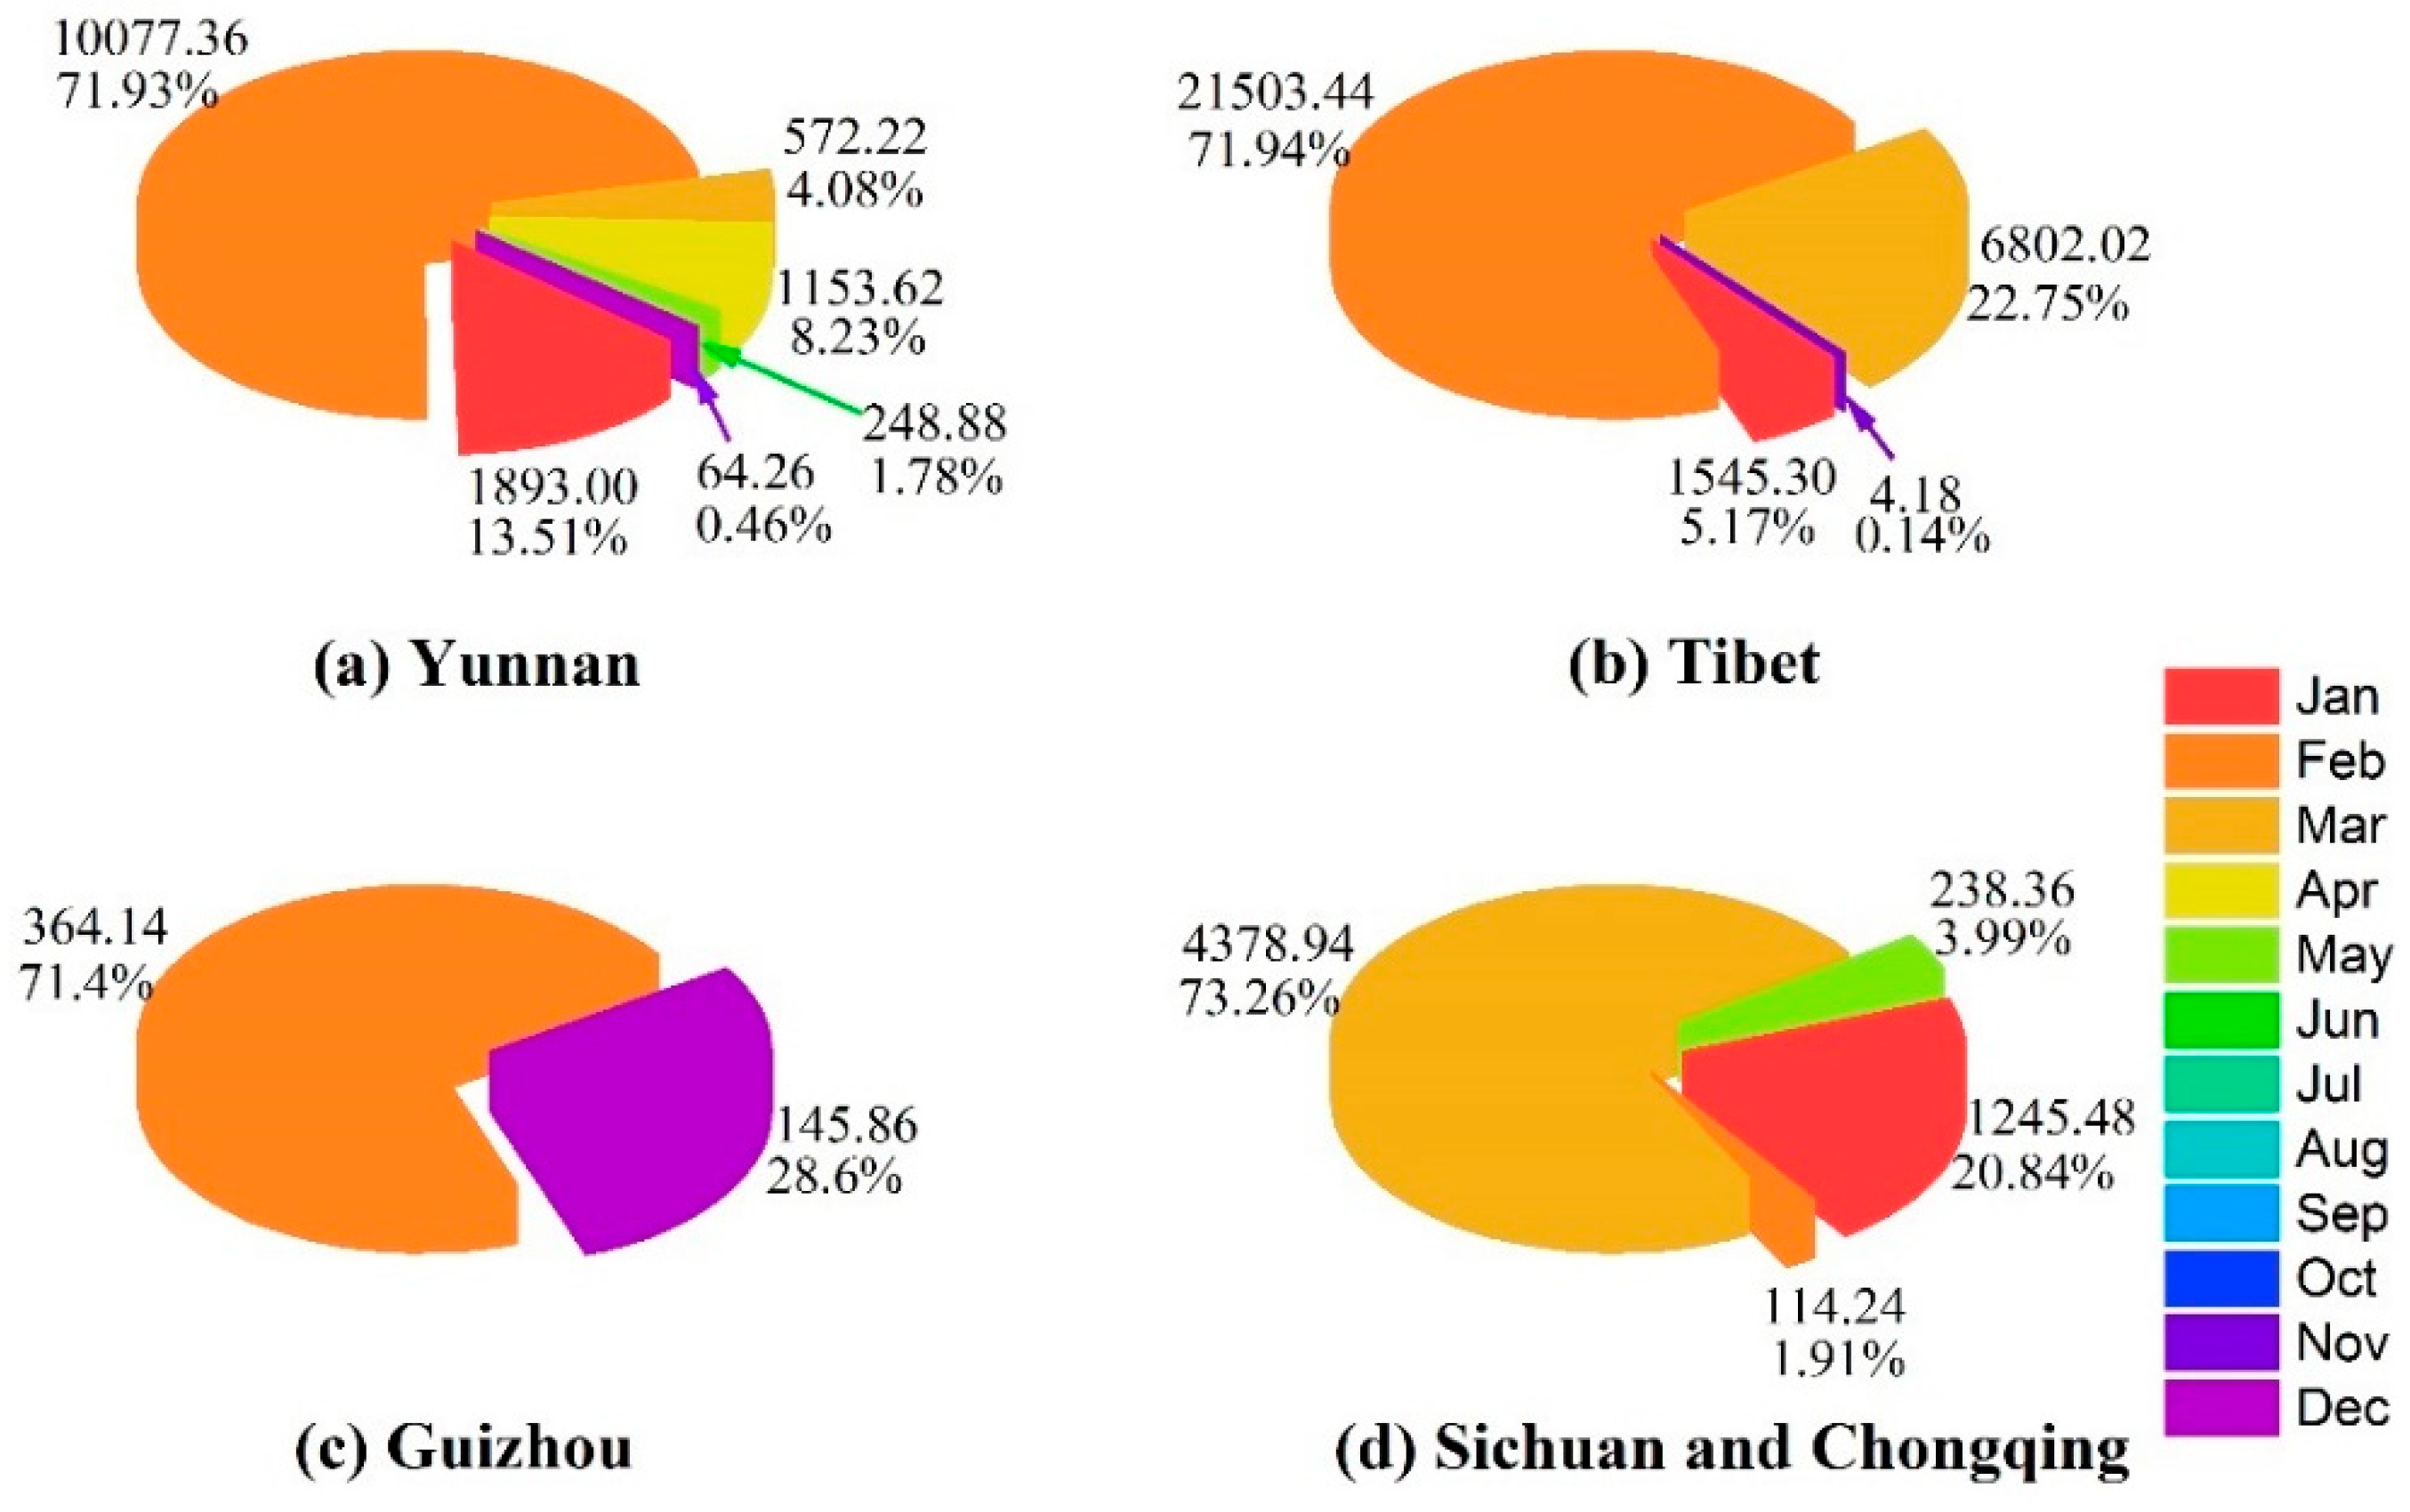
3.1. Emission Inventory of Forest Fires in 2017
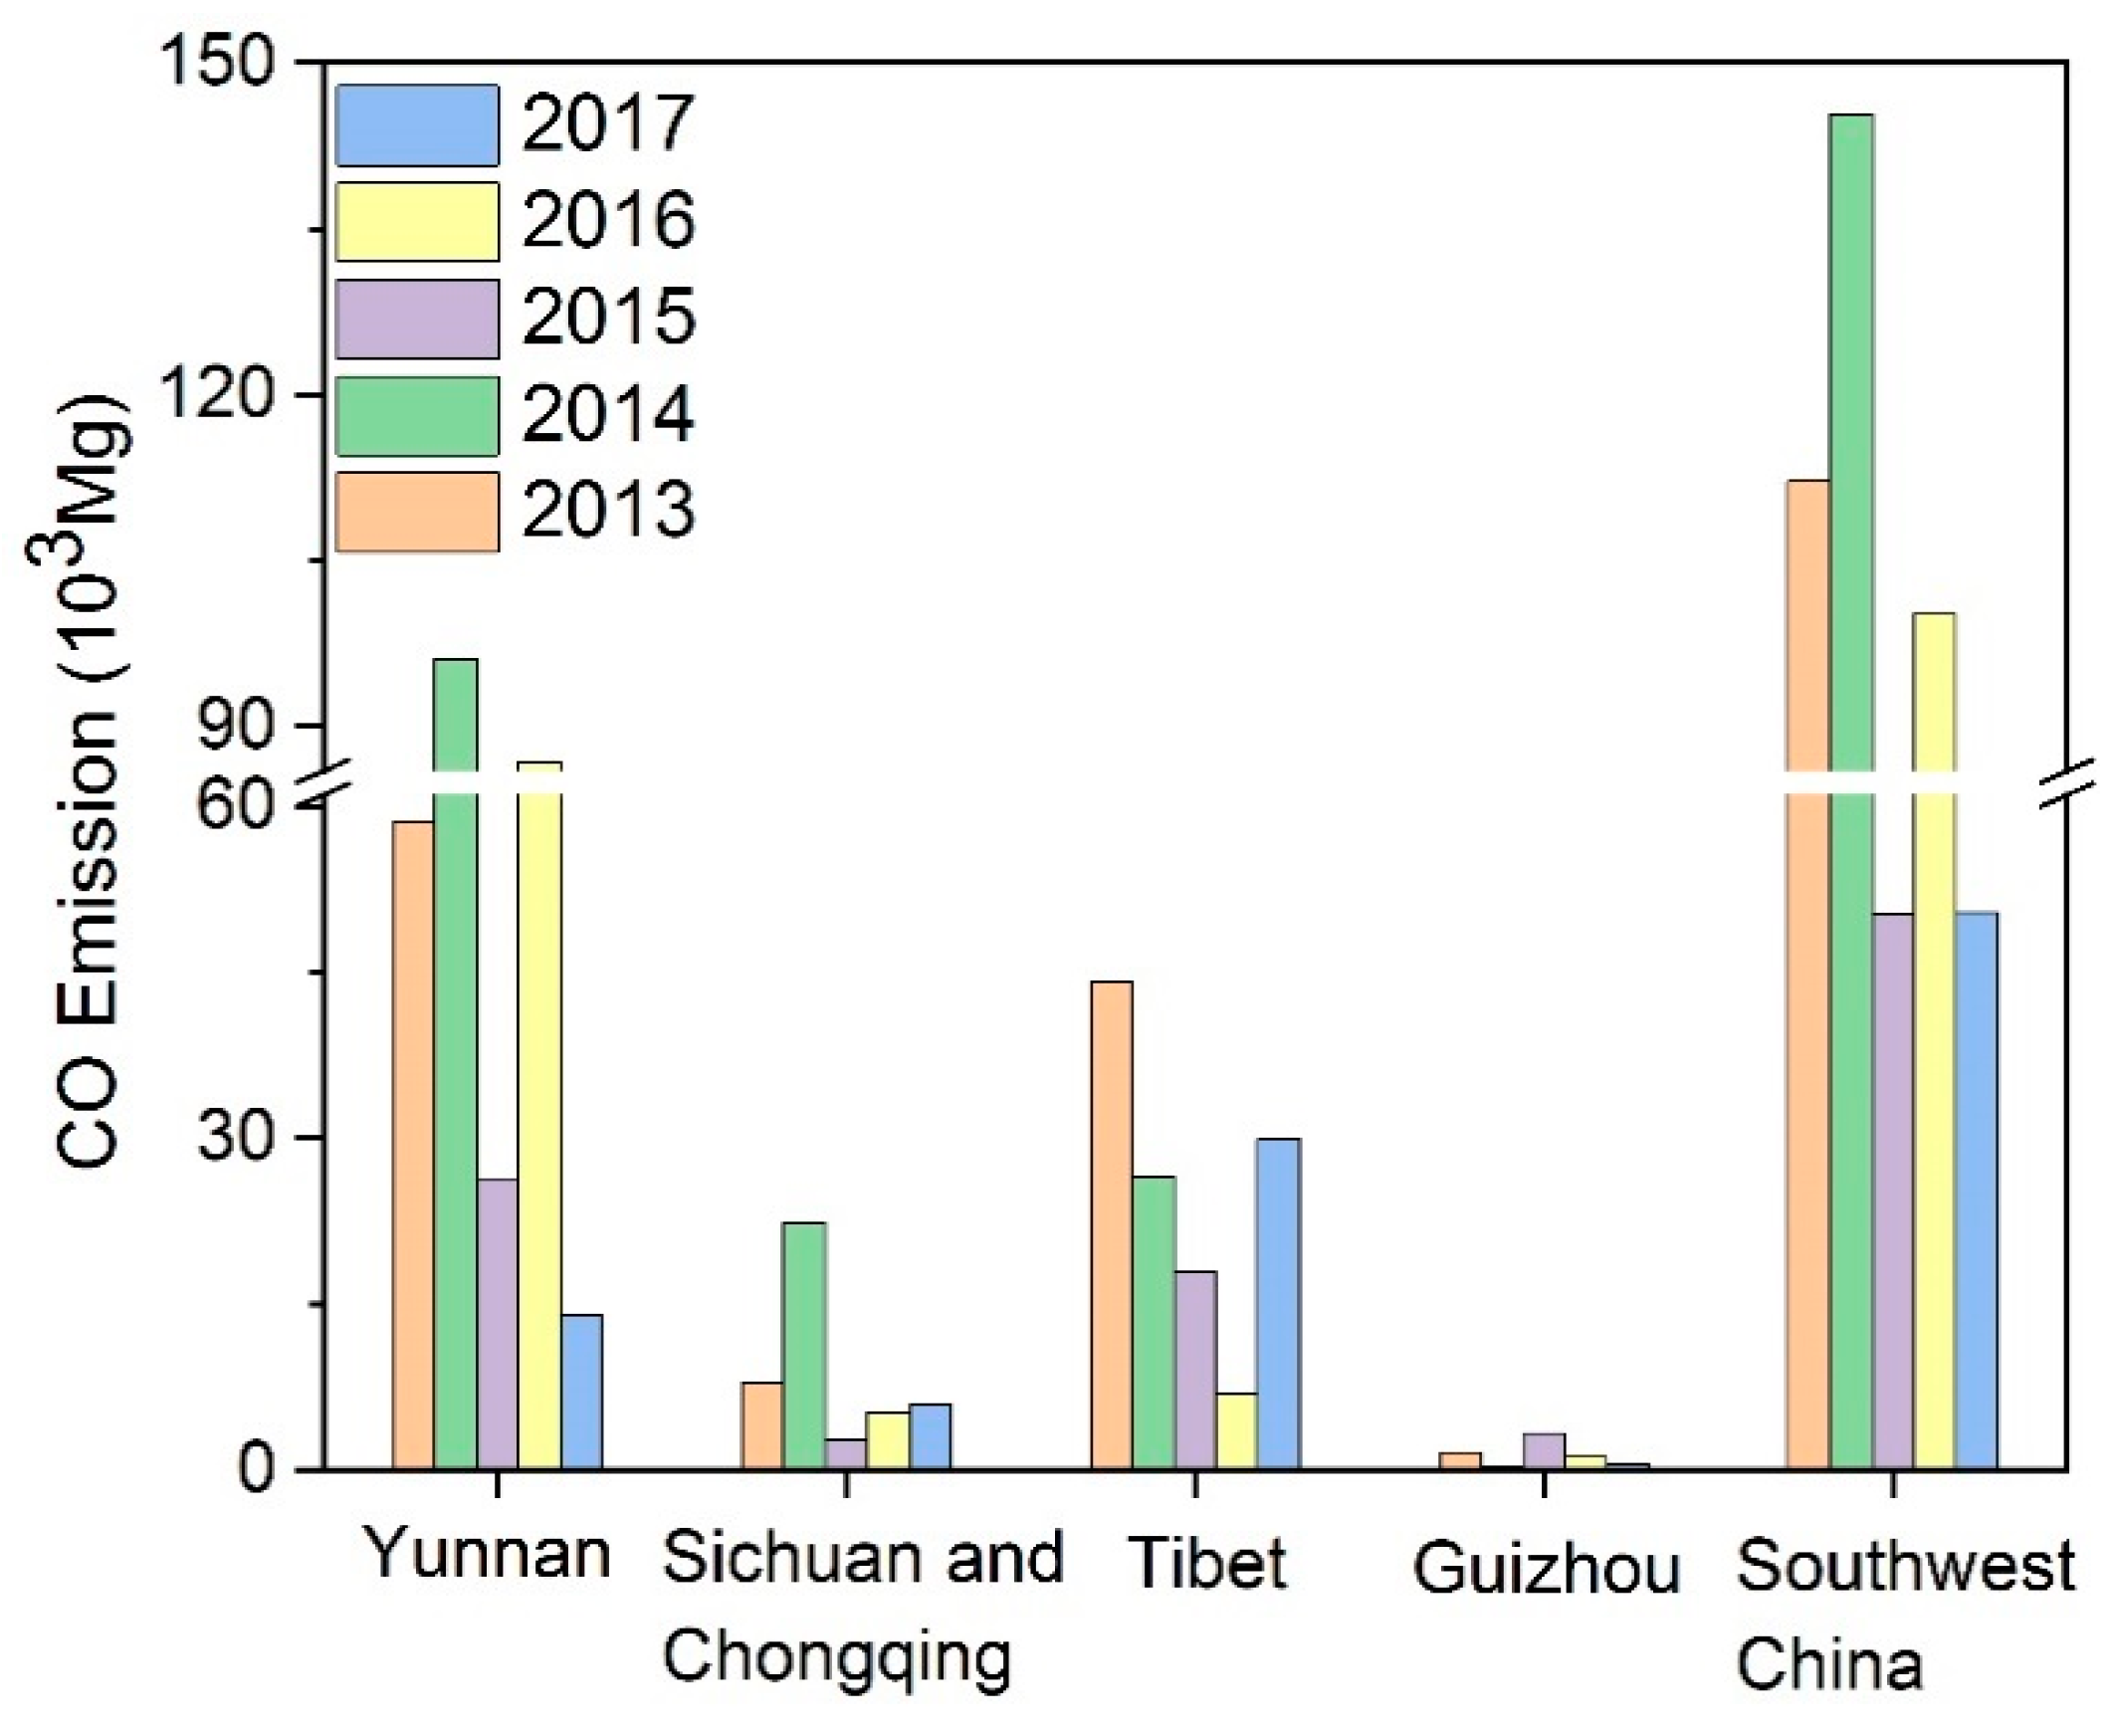
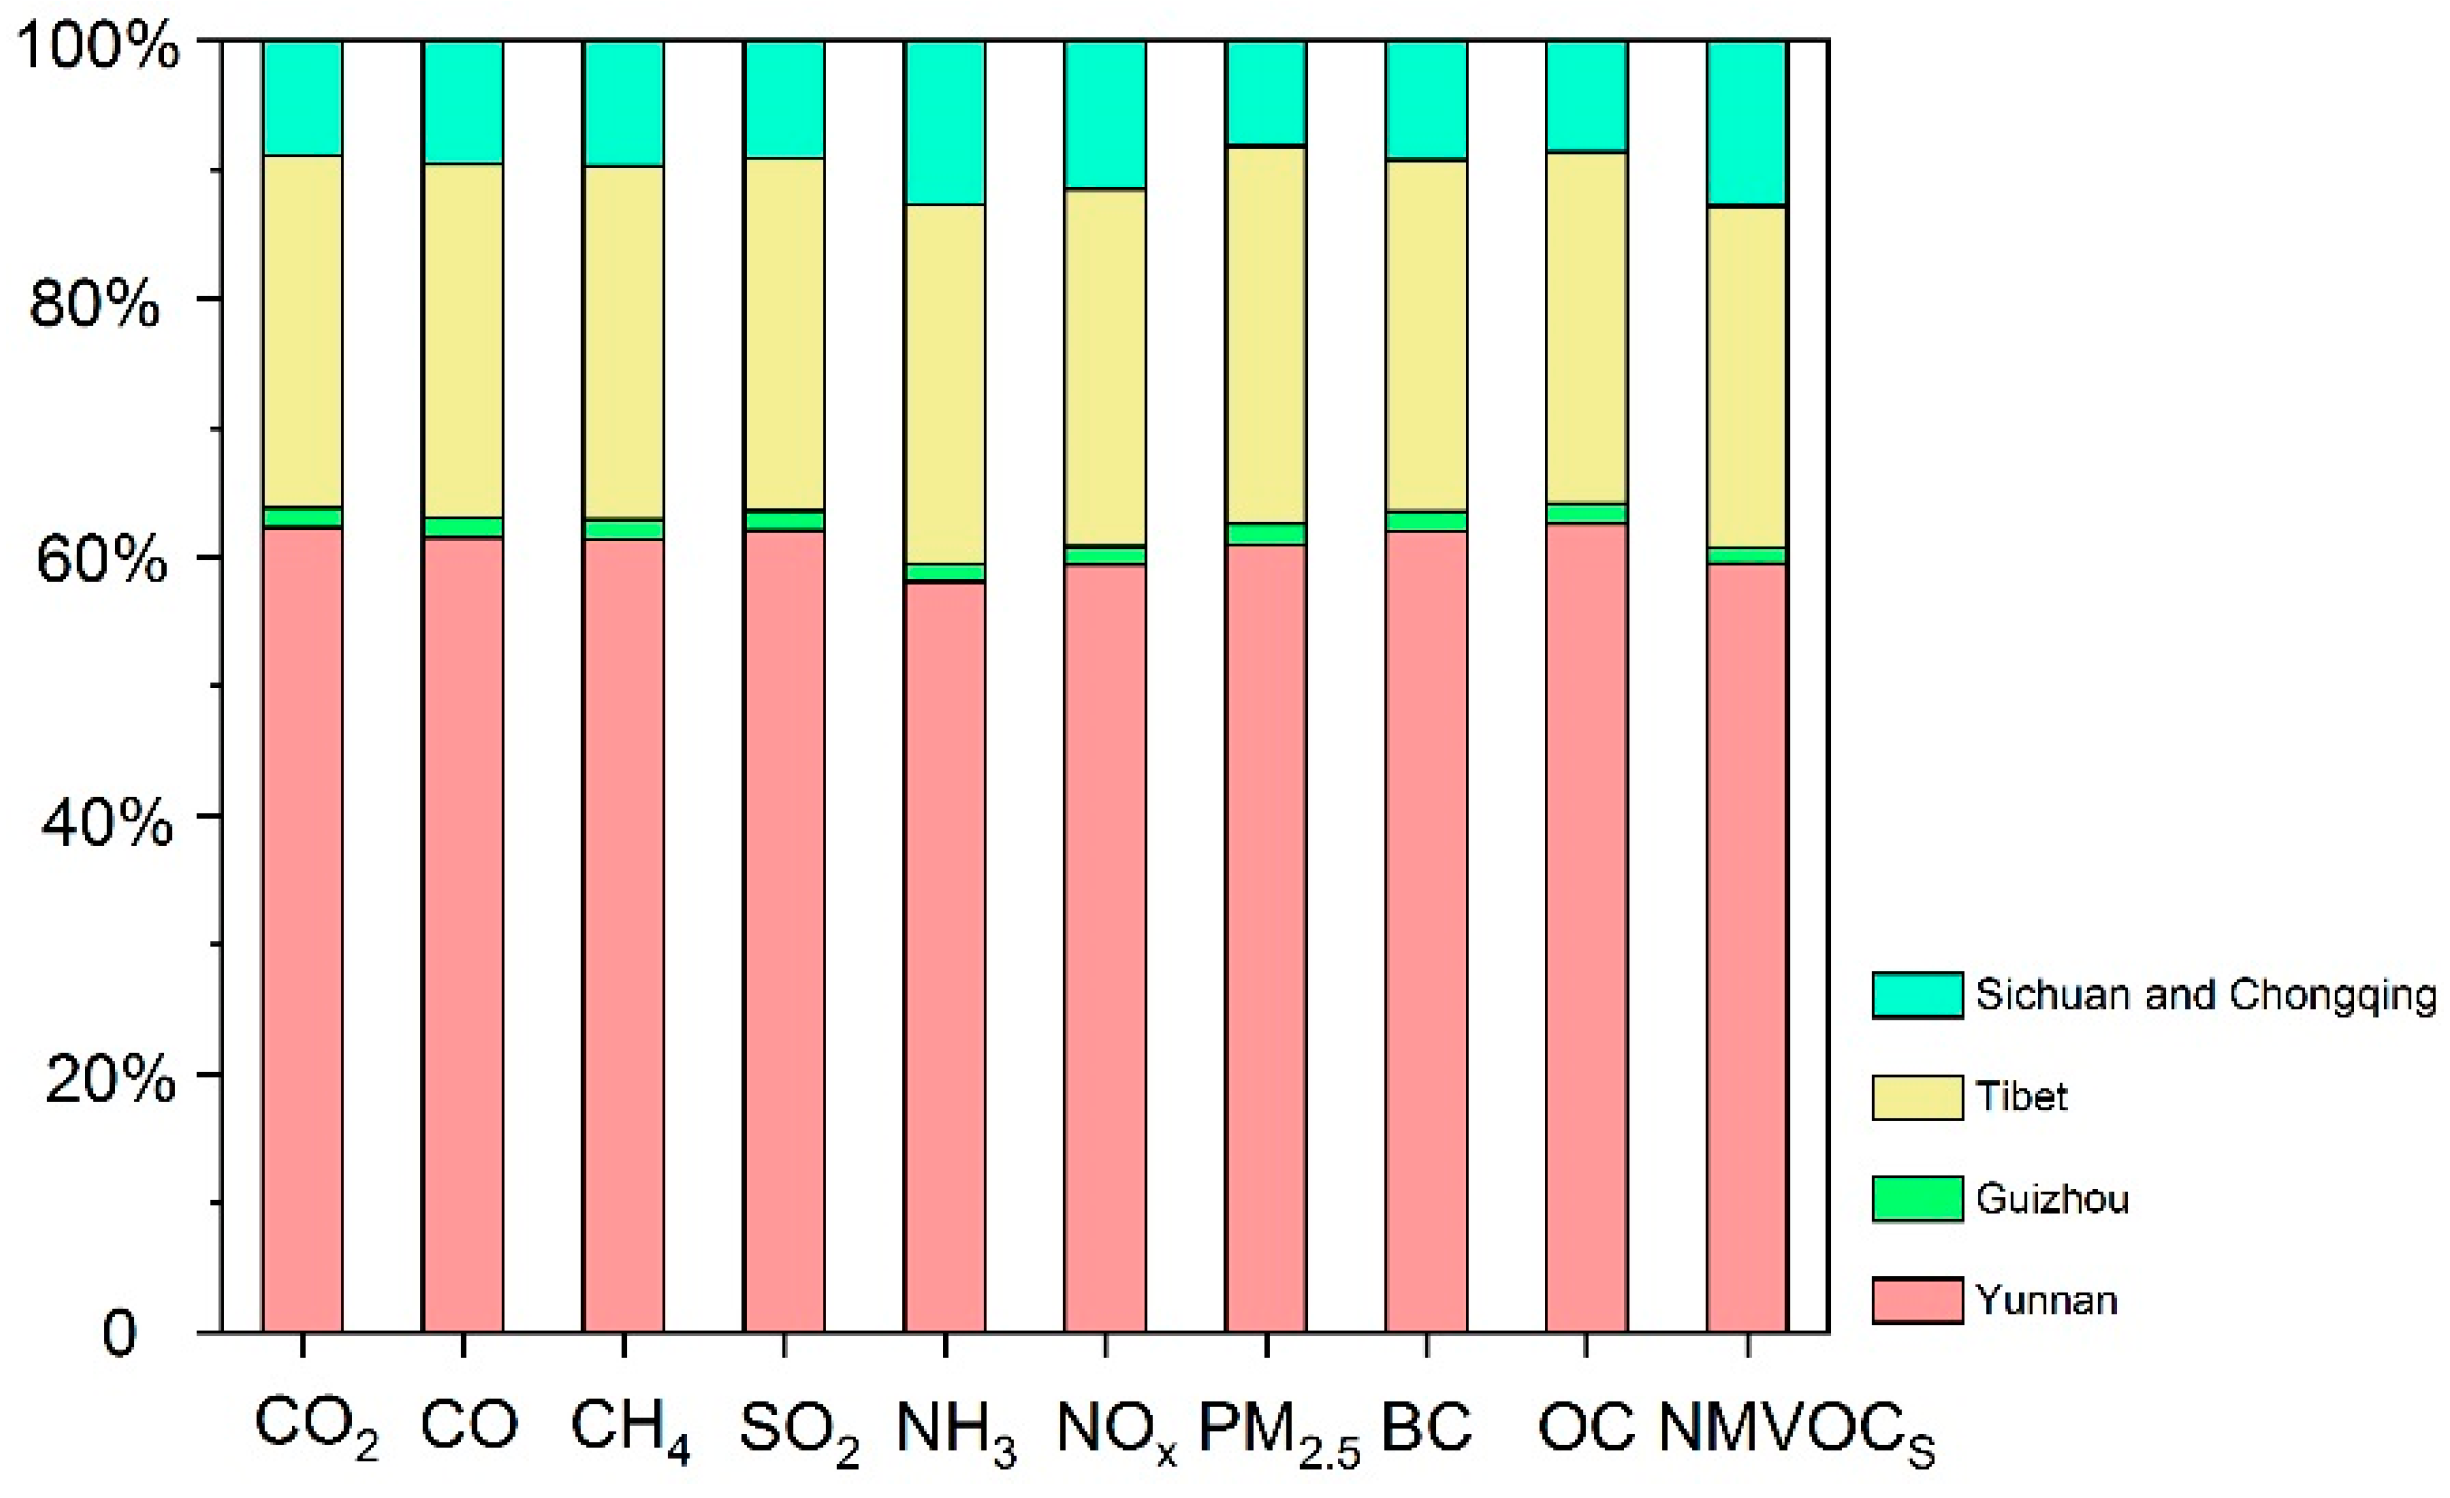
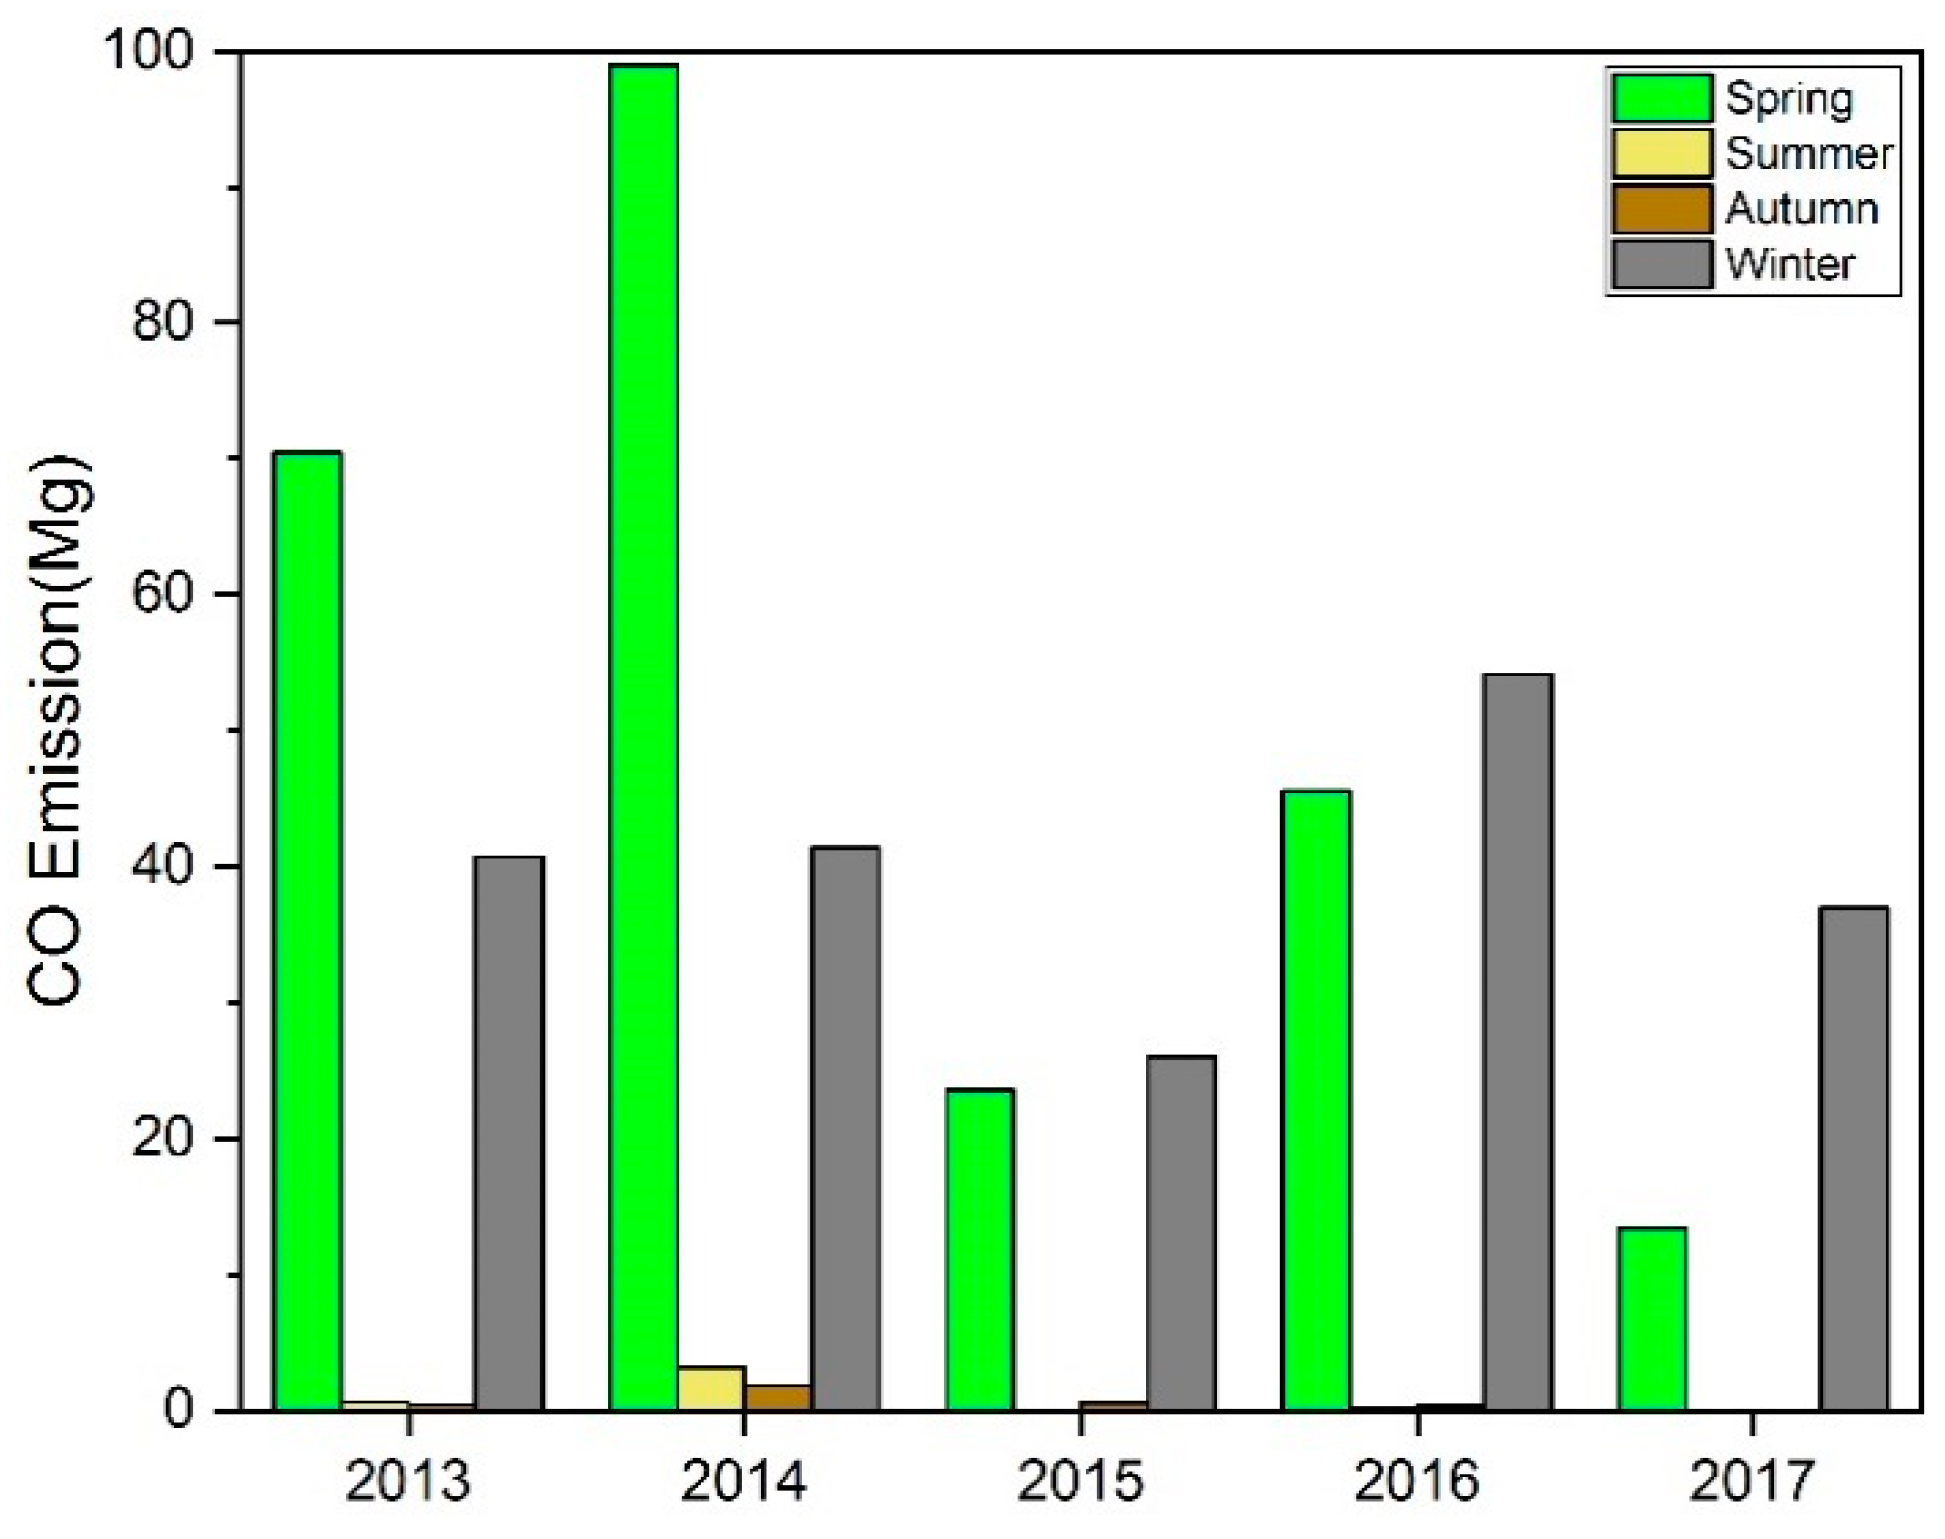
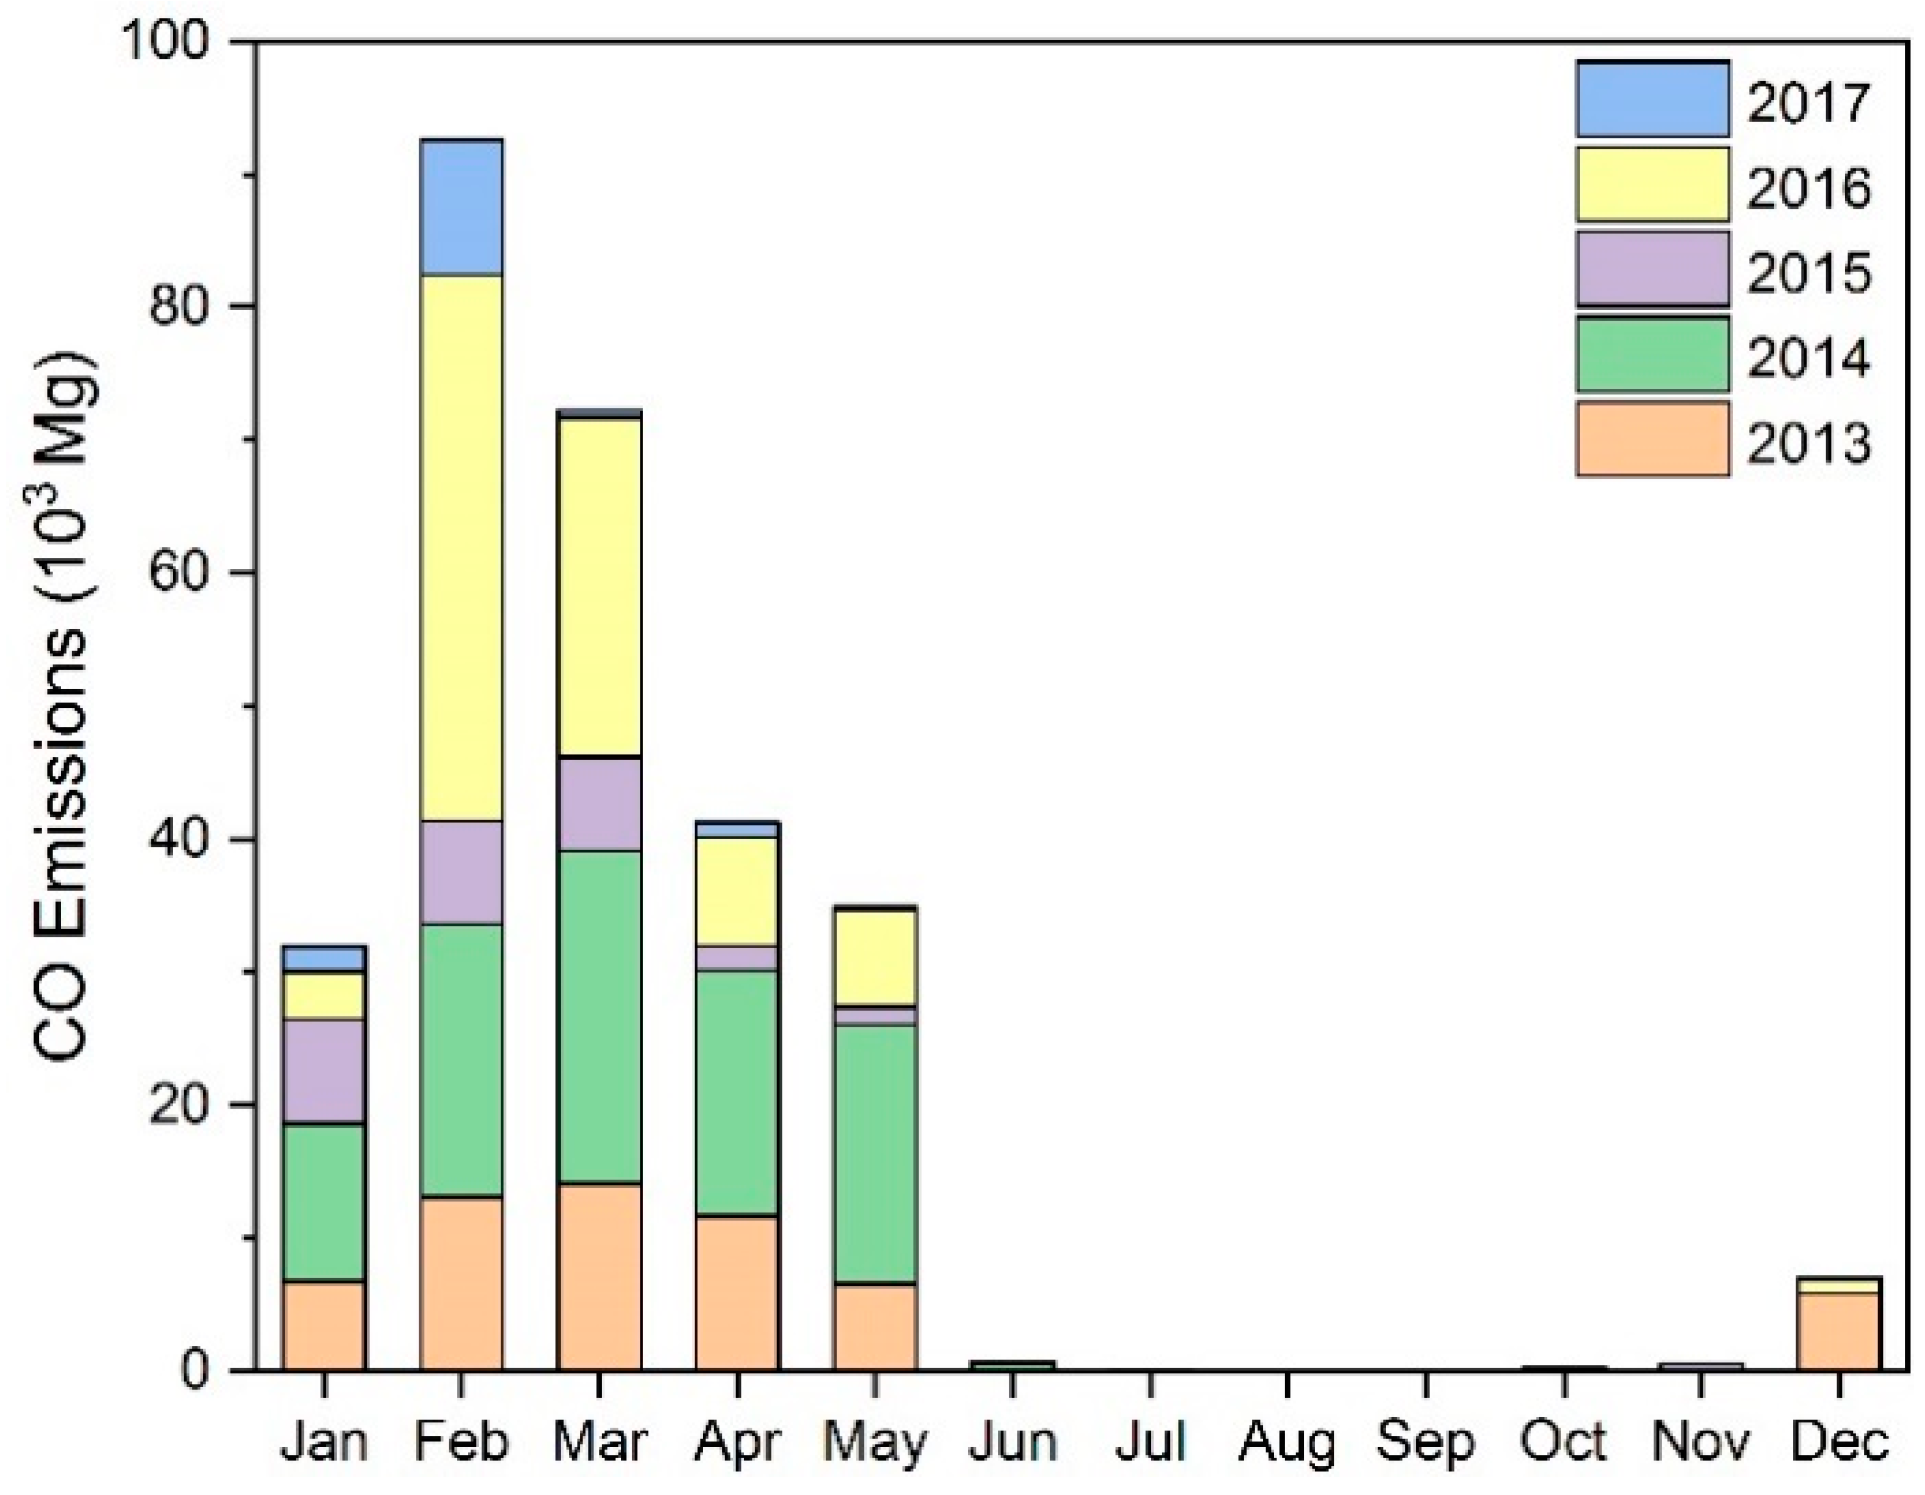
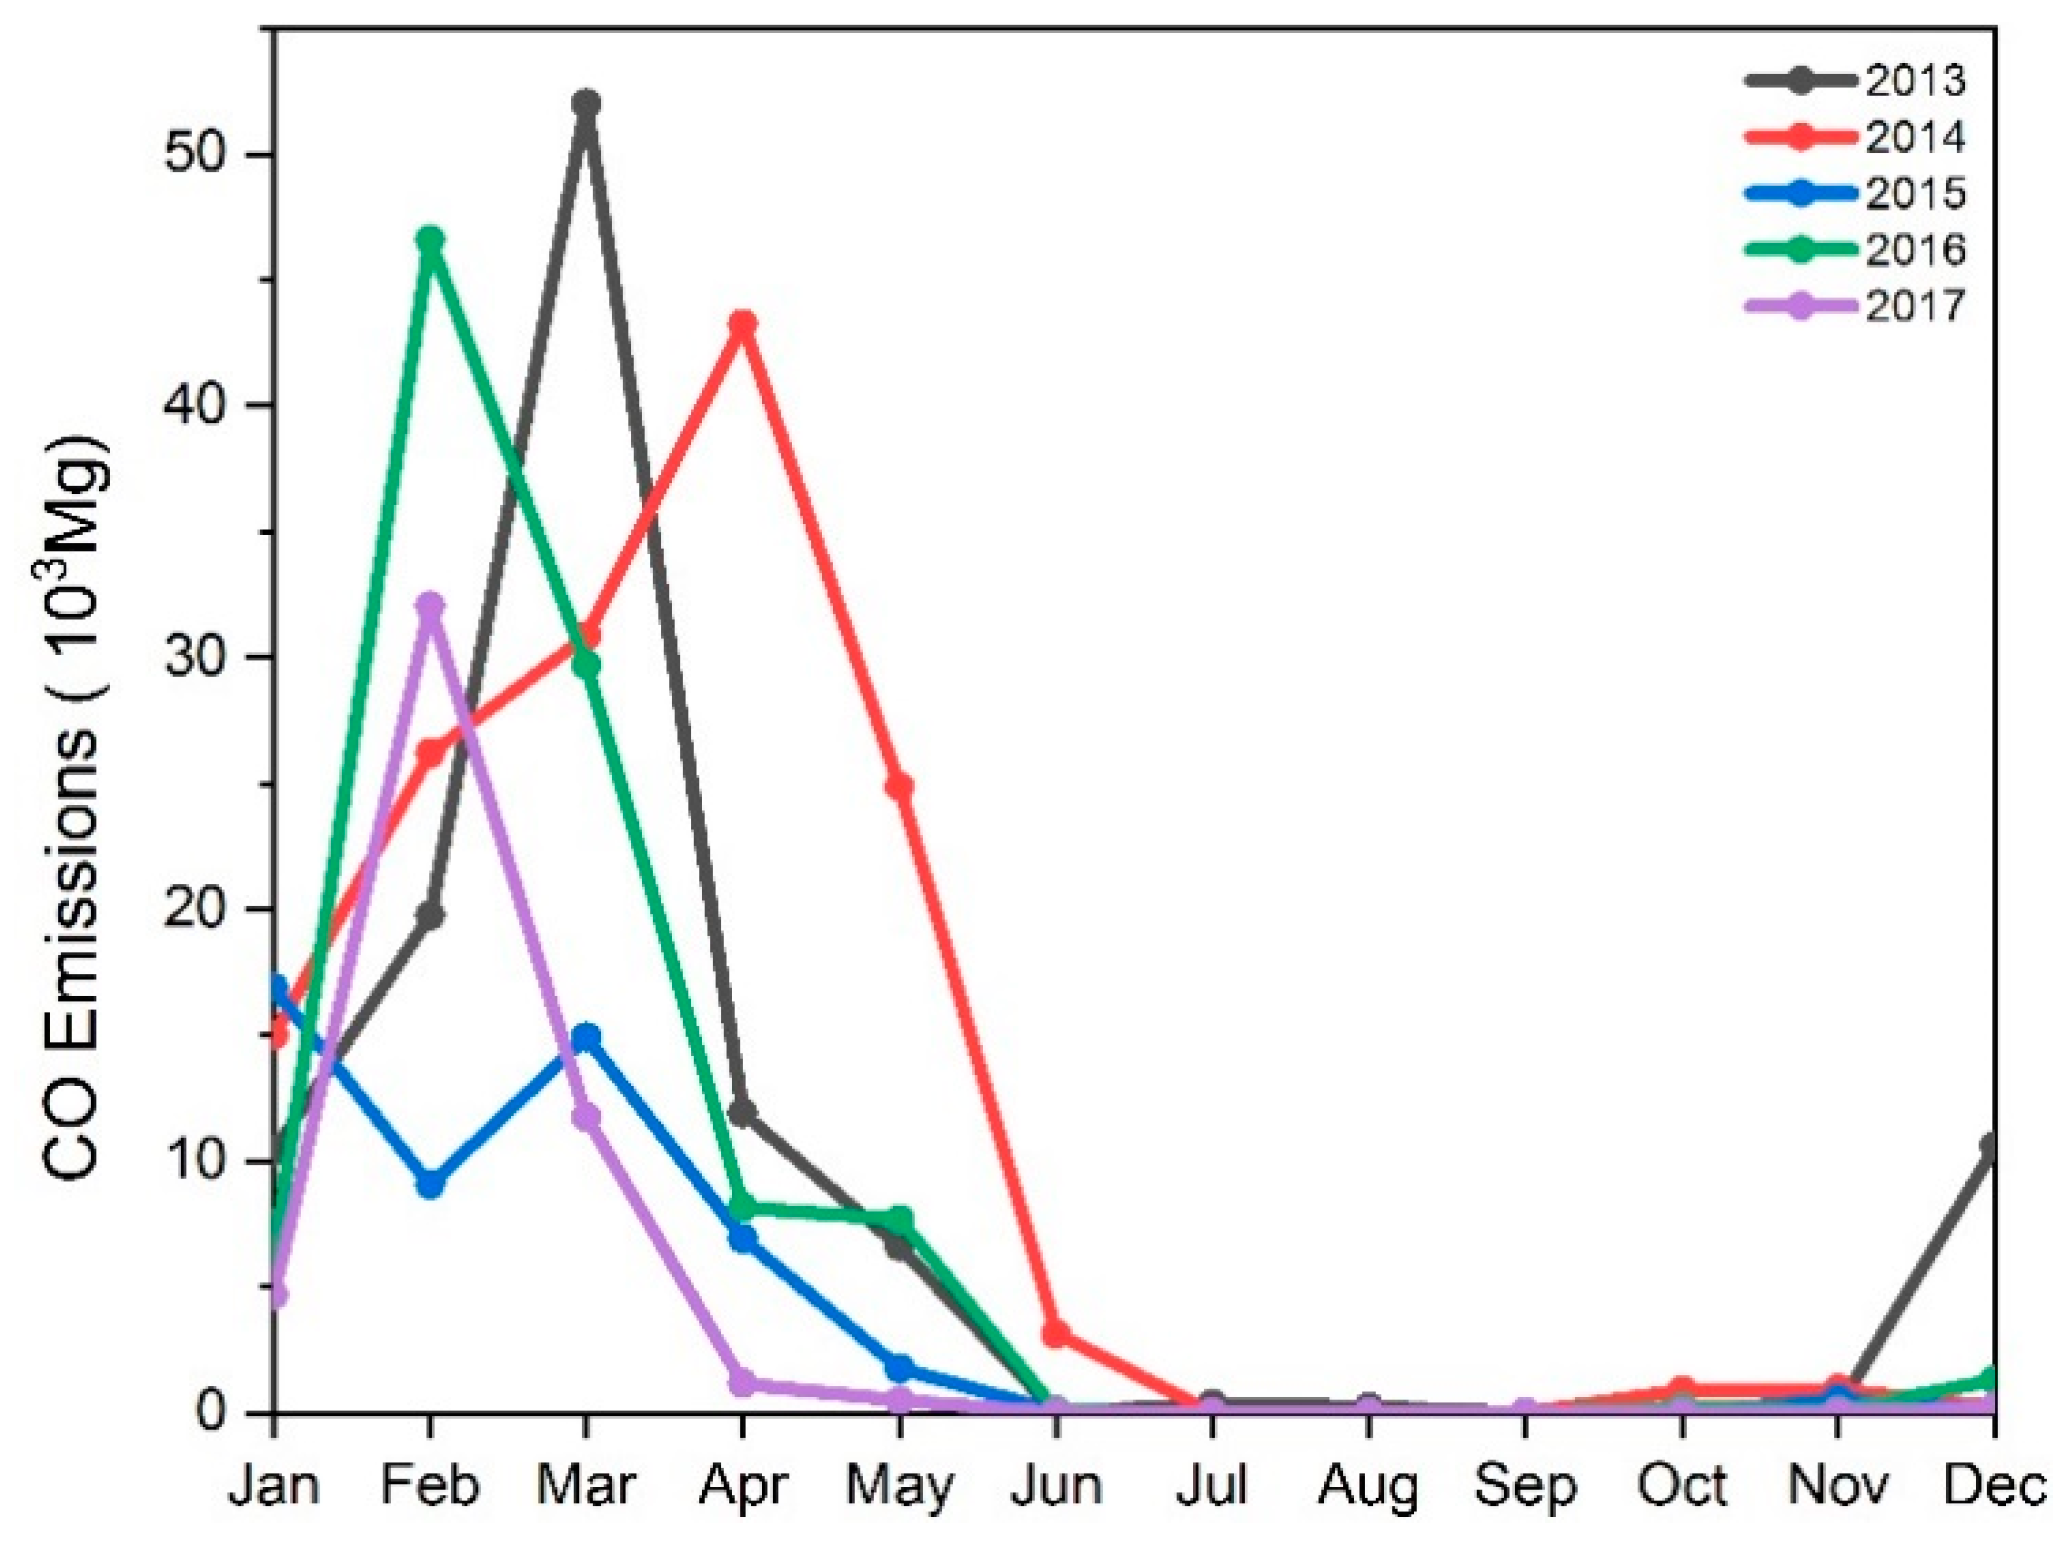
3.2. Historical Emission Inventories of Forest Burning
3.3. Comparison with Other Emission Inventories
3.4. Limitations and Uncertainties
4. Conclusions
Supplementary Materials
Author Contributions
Funding
Conflicts of Interest
References
- Wu, J.; Kong, S.; Wu, F.; Cheng, Y.; Zheng, S.; Yan, Q.; Zheng, H.; Yang, G.; Zheng, M.; Liu, D.; et al. Estimating the open biomass burning emissions in central and eastern China from 2003 to 2015 based on satellite observation. Atmos. Chem. Phys. 2018, 18, 11623–11646. [Google Scholar] [CrossRef]
- Song, Y.; Liu, B.; Miao, W.; Chang, D.; Zhang, Y. Spatiotemporal variation in nonagricultural open fire emissions in China from 2000 to 2007. Glob. Biogeochem. Cycles 2009, 23. [Google Scholar] [CrossRef]
- Andreae, M.O. Biomass burnin—Its history, use, and distribution and its impact onenvironmental quality and global climate. In Global Biomass Burning—Atmospheric, Climatic, and Biospheric Implications; MIT Press: Cambridge, UK, 1991; pp. 3–21. [Google Scholar]
- Li, J.; Song, Y.; Huang, X.; Li, M. Comparison of forest burned areas in mainland China derived from MCD45A1 and data recorded in yearbooks from 2001 to 2011. Int. J. Wildland Fire 2015, 24, 103–113. [Google Scholar] [CrossRef]
- Lazaridis, M.; Latos, M.; Aleksandropoulou, V.; Hov, Ø.; Papayannis, A.; Tørseth, K. Contribution of forest fire emissions to atmospheric pollution in Greece. Air Qual. Atmos. Health 2008, 1, 143–158. [Google Scholar] [CrossRef]
- Crutzen, P.J.; Heidt, L.E.; Krasnec, J.P.; Pollock, W.H.; Seiler, W. Biomass burning as a source of atmospheric gases CO, H2, N2O, NO, CH3Cl and COS. Nature 1979, 282, 253–256. [Google Scholar] [CrossRef]
- Seiler, W.; Crutzen, P.J. Estimates of Gross and Net Fluxes of Carbon between the Biosphere and the Atmosphere from Biomass Burning. Clim. Chang. 1980, 2, 207–247. [Google Scholar] [CrossRef]
- Streets, D.G.; Yarber, K.F.; Woo, J.H.; Carmichael, G.R. Biomass burning in Asia: Annual and seasonal estimates and atmospheric emissions. Glob. Biogeochem. Cycles 2003, 17. [Google Scholar] [CrossRef]
- Yan, X.; Ohara, T.; Akimoto, H. Bottom-up estimate of biomass burning in mainland China. Atmos. Environ. 2006, 40, 5262–5273. [Google Scholar] [CrossRef]
- Randerson, J.T.; Chen, Y.; van der Werf, G.R.; Rogers, B.M.; Morton, D.C. Global burned area and biomass burning emissions from small fires. J. Geophys. Res. Biogeosci. 2012, 117. [Google Scholar] [CrossRef]
- Giglio, L.; Randerson, J.T.; van der Werf, G.R. Analysis of daily, monthly, and annual burned area using the fourth-generation global fire emissions database (GFED4). J. Geophys. Res. Biogeosci. 2013, 118, 317–328. [Google Scholar] [CrossRef]
- Wiedinmyer, C.; Akagi, S.K.; Yokelson, R.J.; Emmons, L.K.; Al-Saadi, J.A.; Orlando, J.J.; Soja, A.J. The Fire INventory from NCAR (FINN): A high resolution global model to estimate the emissions from open burning. Geosci. Model Dev. 2011, 4, 625–641. [Google Scholar] [CrossRef]
- Qiu, X.; Duan, L.; Chai, F.; Wang, S.; Yu, Q.; Wang, S. Deriving High-Resolution Emission Inventory of Open Biomass Burning in China based on Satellite Observations. Environ. Sci. Technol. 2016, 50, 11779–11786. [Google Scholar] [CrossRef] [PubMed]
- van der Werf, G.R.; Randerson, J.T.; Giglio, L.; van Leeuwen, T.T.; Chen, Y.; Rogers, B.M.; Mu, M.; van Marle, M.J.E.; Morton, D.C.; Collatz, G.J.; et al. Global fire emissions estimates during 1997–2016. Earth Syst. Sci. Data 2017, 9, 697–720. [Google Scholar] [CrossRef]
- Zhou, Y.; Xing, X.; Lang, J.; Chen, D.; Cheng, S.; Wei, L.; Wei, X.; Liu, C. A comprehensive biomass burning emission inventory with high spatial and temporal resolution in China. Atmos. Chem. Phys. 2017, 17, 2839–2864. [Google Scholar] [CrossRef]
- Tian, X.; Zhao, F.; Shu, L.; Wang, M. Distribution characteristics and the influence factors of forest fires in China. For. Ecol. Manag. 2013, 310, 460–467. [Google Scholar] [CrossRef]
- Ying, L.X.; Han, J.; Du, Y.S.; Shen, Z.H. Forest fire characteristics in China: Spatial patterns and determinants with thresholds. For. Ecol. Manag. 2018, 424, 345–354. [Google Scholar] [CrossRef]
- Huang, X.; Li, M.; Li, J.; Song, Y. A high-resolution emission inventory of crop burning in fields in China based on MODIS Thermal Anomalies/Fire products. Atmos. Environ. 2012, 50, 9–15. [Google Scholar] [CrossRef]
- Qin, Y.; Xie, S.D. Historical estimation of carbonaceous aerosol emissions from biomass open burning in China for the period 1990–2005. Environ. Pollut. 2011, 159, 3316–3323. [Google Scholar] [CrossRef]
- Fang, J.-Y.; Wang, G.G.; Liu, G.-H.; Xu, S.-L. Forest Biomass of China: An Estimate Based on the Biomass-Volume Relationship. Ecol. Appl. 1998, 8, 1084–1091. [Google Scholar] [CrossRef]
- Fang, J.Y.; Liu, G.H.; Xu, S.L. Biomass and net production of forest vegetation in China. Acta Ecol. Sin. 1996, 16, 497–508. [Google Scholar]
- Lü, A.; Tian, H.; Liu, M.; Liu, J.; Melillo, J.M. Spatial and temporal patterns of carbon emissions from forest fires in China from 1950 to 2000. J. Geophys. Res. 2006, 111. [Google Scholar] [CrossRef]
- Zhang, Y.; Qin, D.; Yuan, W.; Jia, B. Historical trends of forest fires and carbon emissions in China from 1988 to 2012. J. Geophys. Res. Biogeosci. 2016, 121, 2506–2517. [Google Scholar] [CrossRef]
- Wang, X.; Feng, Z.; Zhuang, Y. CO2, CO and CH4 emissions from forest fires in China. Sci. Silvae Sin. 2001, 37, 90–95. (In Chinese) [Google Scholar]
- Giglio, L.; Loboda, T.; Roy, D.P.; Quayle, B.; Justice, C.O. An active-fire based burned area mapping algorithm for the MODIS sensor. Remote Sens. Environ. 2009, 113, 408–420. [Google Scholar] [CrossRef]
- Shi, Y.; Matsunaga, T.; Yamaguchi, Y. High-Resolution Mapping of Biomass Burning Emissions in Three Tropical Regions. Environ. Sci. Technol. 2015, 49, 10806–10814. [Google Scholar] [CrossRef]
- Yi, K.; Bao, Y. Estimates of Wildfire Emissions in Boreal Forests of China. Forests 2016, 7, 158. [Google Scholar] [CrossRef]
- Michel, C.; Liousse, C.; Gregoire, J.M.; Tansey, K.; Carmichael, G.R.; Woo, J.H. Biomass burning emission inventory from burnt area data given by the SPOT-VEGETATION system in the frame of TRACE-P and ACE-Asia campaigns. J. Geophys. Res. Atmos. 2005, 110. [Google Scholar] [CrossRef]
- Lu, A.F. Study on the relationship among forest fire, temperature and precipitation and its spatial-temporal variability in China. Agric. Sci. Technol. Hunan 2011, 12, 1396–1400. [Google Scholar]
- Li, J.; Li, Y.; Bo, Y.; Xie, S. High-resolution historical emission inventories of crop residue burning in fields in China for the period 1990–2013. Atmos. Environ. 2016, 138, 152–161. [Google Scholar] [CrossRef]
- Yin, L.; Du, P.; Zhang, M.; Liu, M.; Xu, T.; Song, Y. Estimation of emissions from biomass burning in China (2003–2017) based on MODIS fire radiative energy data. Biogeosciences 2019, 16, 1629–1640. [Google Scholar] [CrossRef]
- Magdon, P.; Fischer, C.; Fuchs, H.; Kleinn, C. Translating criteria of international forest definitions into remote sensing image analysis. Remote Sens. Environ. 2014, 149, 252–262. [Google Scholar] [CrossRef]
- Tomppo, E.; Gschwantner, T.; Lawrence, M.; McRoberts, R.E.; Gabler, K.; Schadauer, K.; Vidal, C.; Lanz, A.; Ståhl, G.; Cienciala, E. National Forest Inventories; Pathways for Common Reporting; European Science Foundation: Strasbourg, France, 2010; pp. 541–553. [Google Scholar]
- Hao, W.M.; Petkov, A.; Nordgren, B.L.; Corley, R.E.; Silverstein, R.P.; Urbanski, S.P.; Evangeliou, N.; Balkanski, Y.; Kinder, B.L. Daily black carbon emissions from fires in northern Eurasia for 2002–2015. Geosci. Model Dev. 2016, 9, 4461–4474. [Google Scholar] [CrossRef]


| Description | Yunnan | Guizhou | Tibet | Sichuan | Chongqing |
|---|---|---|---|---|---|
| Unit: Mg/ha | |||||
| Needle-leaved forest | 57.6 | 22.1 | 139.9 | 80.9 | 80.9 |
| Broad-leaved forest | 145.1 | 114.1 | 64.9 | 99 | 99 |
| Mixed forest | 101.35 | 68.1 | 102.4 | 89.95 | 89.95 |
| Description | CO2 | CO | CH4 | SO2 | NH3 | NOX | PM | BC | OC | NMVOCS |
|---|---|---|---|---|---|---|---|---|---|---|
| Needle-leaved forest | 1514 | 118 | 6 | 1 | 3.5 | 2.4 | 9.7 | 0.80 | 7.8 | 28 |
| Broad-leaved forest | 1630 | 102 | 5 | 1 | 1.5 | 1.3 | 13 | 0.77 | 9.2 | 11 |
| Mixed forest | 1630 | 102 | 5 | 1 | 1.5 | 1.3 | 9.7 | 0.78 | 9.2 | 14 |
| CO2 | CO | CH4 | SO2 | NH3 | NOX | PM2.5 | BC | OC | NMVOCS | |
|---|---|---|---|---|---|---|---|---|---|---|
| January | 64.78 × 10³ | 4.68 × 10³ | 235.44 | 41.67 | 116.69 | 83.97 | 424.36 | 32.98 | 345.44 | 944.31 |
| February | 496.74 × 10³ | 32.06 × 10³ | 1580.57 | 307.73 | 545.44 | 446.16 | 3470.08 | 239.40 | 2772.43 | 4454.10 |
| March | 176.60 × 10³ | 11.75 × 10³ | 582.65 | 110.49 | 226.14 | 176.86 | 1269.17 | 86.19 | 974.23 | 1790.23 |
| April | 18.44 × 10³ | 1.15 × 10³ | 56.55 | 11.31 | 16.97 | 14.70 | 115.68 | 8.80 | 104.05 | 152.91 |
| May | 7.04 × 10³ | 0.49 × 10³ | 24.32 | 4.46 | 10.73 | 8.02 | 49.24 | 3.50 | 38.20 | 85.29 |
| June | 0 | 0 | 0 | 0 | 0 | 0 | 0 | 0 | 0 | 0 |
| July | 0 | 0 | 0 | 0 | 0 | 0 | 0 | 0 | 0 | 0 |
| August | 0 | 0 | 0 | 0 | 0 | 0 | 0 | 0 | 0 | 0 |
| September | 0 | 0 | 0 | 0 | 0 | 0 | 0 | 0 | 0 | 0 |
| October | 0 | 0 | 0 | 0 | 0 | 0 | 0 | 0 | 0 | 0 |
| November | 0.67 × 10³ | 0.04 × 10³ | 2.05 | 0.41 | 0.62 | 0.53 | 5.33 | 0.32 | 3.77 | 4.51 |
| December | 3.36 × 10³ | 0.21 × 10³ | 10.30 | 2.06 | 3.09 | 2.68 | 24.70 | 1.59 | 18.95 | 24.55 |
| Total | 767.61 × 10³ | 50.39 × 10³ | 2491.88 | 478.13 | 919.66 | 732.92 | 5358.52 | 372.78 | 4257.07 | 7455.90 |
| Tibet | Yunnan | Guizhou | Sichuan | Chongqing |
|---|---|---|---|---|
| 8.3 × 10⁶ | 14.0 × 10⁶ | 2.4 × 10⁶ | 11.2 × 10⁶ | 1.6 × 10⁶ |
| Literature Cited | Period | CO2 | CO | CH4 |
|---|---|---|---|---|
| Wang et al. (2001) [24] | 1959–1992 | 2053.62 × 103 | 259.39 × 10³ | 25,399 |
| This study | 2013–2017 | 1423.19 × 103 | 91.66 × 10³ | 4517.08 |
| Qiu et al. (2016) [13] | 2013 | 3831 × 103 | 299 × 103 | 15,200 |
| This study | 2013 | 1729 × 103 | 112 × 103 | 5537 |
© 2019 by the authors. Licensee MDPI, Basel, Switzerland. This article is an open access article distributed under the terms and conditions of the Creative Commons Attribution (CC BY) license (http://creativecommons.org/licenses/by/4.0/).
Share and Cite
Wang, W.; Zhang, Q.; Luo, J.; Zhao, R.; Zhang, Y. Estimation of Forest Fire Emissions in Southwest China from 2013 to 2017. Atmosphere 2020, 11, 15. https://doi.org/10.3390/atmos11010015
Wang W, Zhang Q, Luo J, Zhao R, Zhang Y. Estimation of Forest Fire Emissions in Southwest China from 2013 to 2017. Atmosphere. 2020; 11(1):15. https://doi.org/10.3390/atmos11010015
Chicago/Turabian StyleWang, Wenjia, Qixing Zhang, Jie Luo, Ranran Zhao, and Yongming Zhang. 2020. "Estimation of Forest Fire Emissions in Southwest China from 2013 to 2017" Atmosphere 11, no. 1: 15. https://doi.org/10.3390/atmos11010015
APA StyleWang, W., Zhang, Q., Luo, J., Zhao, R., & Zhang, Y. (2020). Estimation of Forest Fire Emissions in Southwest China from 2013 to 2017. Atmosphere, 11(1), 15. https://doi.org/10.3390/atmos11010015