1. Introduction
Urban areas are characterized by dense populations and artificial structures, which give them a unique climate. Urban buildings with various heights also change the roughness of the surface, causing wind changes in the atmospheric boundary layer. The unique climate can be manifested through several phenomena, such as urban heat islands, in which artificial structures absorb shortwave radiation during the daytime and release longwave radiation at night. Therefore, the climate in cities differs from that of surrounding suburban regions.
Urban weather is associated with a wide range of space-time atmospheric phenomena [
1]. The changes in the shortwave radiation caused by albedo alter the surface energy balance, which in turn reduces surface temperature. The decrease in summer temperature stabilizes the atmosphere, reducing cloudiness and increasing tropospheric ozone concentration. Furthermore, albedo varies depending on the type of material or weathering. Artificial structures may be composed of various materials, such as concrete, brick, wood, and asphalt. A major factor influencing albedo is the color of the material; the closer to white, the higher the albedo value. Albedo depends on the layout of the building and the altitude of the sun.
On an average, urban albedo values range from 0.10 to 0.20, with albedo deviations of −0.02–0.09 compared to suburban areas. Albedo in major cities ranged from 0.10 to 0.45 in 1993. In summer afternoons, the temperature decreases by 2–4 °C when albedo is about 0.13 in urban areas [
2]. Experiments with simple one-dimensional modeling coupling the town energy balance (TEB) urban surface scheme and Oregon State University Coupled Atmosphere-Plant-Soil (OSU-CAPS) heat, moisture, and momentum exchange models for an urban ratio of 0.33 was conducted and found temperature changes of –1.1, −1.5, and −3.6 °C at roof albedo values of 0.19, 0.26, and 0.59, respectively [
3].
The changes in albedo aim to reduce the effect of urban heat islands from an urban engineering perspective. Reducing the urban heat islands can lead to reduced summer heat stress and air pollutant concentrations due to reduced temperatures [
4,
5,
6,
7,
8]. Previous study reported a change in albedo on the roofs, walls, and pavement in the Sacramento using Weather Research and Forecasting-Chemistry (WRF-Chem) model, resulting in decrease in air temperatures, PM2.5 and ozone concentration [
4]. Recent studies have reported that air pollutants enhance the effects of urban heat islands [
9]. The Seoul Metropolitan Area in Korea has been undergoing urbanization for a long time, but no albedo sensitivity tests have been conducted.
Climate and weather models attempt to implement the urban environment in various ways, such as considering the city as a tile, a tile consisting of a roof and canyon, or multiple layers in more complex three-dimensional analyses. Local Data Assimilation and Prediction System (LDAPS), the Korean Meteorological Administration’s national climate model, uses the Joint UK Land Environment Simulator (JULES) as a surface model [
10]. The urban module is considered as one of the basic surface exchange processes in JULES. The basic urban scheme, which consists of a city composed of tiles with one albedo and emission rate per tile, is further considered the Best scheme. A more complex Met-Office-Reading Urban Surface Exchange-Scheme (MORUSES) separates a single tile into roofs and canyons, forming walls, roads, and roofs, for which parameters such albedo and emissivity can be changed. These two factors are used to calculate shortwave radiation, longwave radiation, sensible heat, latent heat, and ground heat [
11]. MORUSES reproduces temperatures in Seoul more realistically than the Best scheme [
12].
This study conducted sensitivity experiments on albedo in the Seoul Metropolitan Area using LDAPS-MORUSES with the urban scheme for LDAPS. Simulated characteristics of urban weather in the Seoul Metropolitan Area were identified, and 1.5-m temperature was evaluated. We then analyzed the results of the sensitivity test by increasing or decreasing the albedo by 50% to analyze the effect on surface temperature and surface energy balance.
Section 2 introduces models, experiments, observations, and methods.
Section 3 describes the simulation performance evaluation of LDAPS-MORUSES and the sensitivity test results, and
Section 4 presents the conclusions.
2. Sensitivity Experiment Using LDAPS-MORUSES
We used MORUSES, a two-dimensional urban scheme, for the LDAPS. LDAPS grids are horizontal Arakawa C-grid [
13] and vertical Charney-Phillips grid staggering [
14]. The model has a horizontal resolution of 1.5 km, and a vertical resolution of 70 layers covering from surface to 39 km. For the initial and boundary fields of the model, data from the Global Data Assimilation and Prediction System (GDAPS), a global weather forecast model, were used. The forecast was started at 00 UTC, and 36 h of forecast data were produced with 1 h intervals. The model uses spectral band radiation [
15] as the radiative physics process, the JULES land-surface scheme [
10] as the ground physics process, non-local scheme with revised diagnosis of K profile depth [
16] as the boundary layer physics, mixed-phase scheme with graupel [
17] as the microphysical process, and gravity wave drag due to orography [
18] as the gravity wave drag process.
JULES applies a mosaic method to represent the surface, which classifies the surface into five vegetation indicators: broadleaf tree, needleleaf tree, C3, C4, and shrubs, and four non-vegetable indicators: urban, inland water, bare, and inland ice [
10]. JULES calculates plant physiology and surface energy fluxes to provide atmospheric models with information on carbon dioxide, roughness length, sensible heat and latent heat. The urban scheme here is related to surface energy flux. As the default urban scheme of JULES is the Best scheme, the parameters applied by [
12] to modify MORUSES were used.
In the urban albedo sensitivity test, albedo parameters of the walls and roads were changed by ±50% (
Table 1). The default albedo values applied in this model are 0.375 and 0.08 for the wall and road, respectively. If these values are changed by ±50%, it can be explained that it is changed by weathering or color changes in the same material and not by the quality change of material. The analysis of increased and decreased experiments can identify both linear and nonlinear effects. In this study, nonlinear results are not clear, so only linear results are presented. Walls and roads were divided and named W and R, respectively, and the increase and decrease of albedo were called P and N, respectively. AWP and AWN refers to albedo experiments with +50% and −50% change of wall parameters, respectively. ARP and ARN are the same experiments but wall parameter. CTL is a control experiment run with default values. The simulation period was from 15–21 July 2018, during which a heat wave occurred in the Korean Peninsula. During the period, there were few clouds and rainfall which affected the surface energy budget.
For comparison with experimental data, AWS data of 1.5-m temperature at 56 sites across the Seoul Metropolitan Area were used. The locations of AWS stations, which provided data at 1-h interval, are shown in
Figure 1. The simulated data were analyzed by extracting the data of the grid points closest to the AWS location. The Seoul Metropolitan Area, including Seoul, Incheon, and Gyeonggi-do, is located in South Korea. With the rapid social and economic growth over the past 60 years, this area accounted for 49.8% of South Korea’s population as of November 2018 [
19]. The center of Seoul Metropolitan Area is a mixture of commercial and residential areas. The area surrounding the center consists of industrial and residential areas, which are connected by roads to the center. This area is a representative metropolitan area, and its population is expected to continue growing.
For the urban fraction of the Seoul Metropolitan Area in the model, data from 1992 to 1993 of the National Oceanic and Atmospheric Administration/Advanced Very High-Resolution Radiometer (NOAA/AVHRR) were used. Details of the data used are described in [
12]. The urban fraction in the center area is circular, and it extends long to the southwest area (
Figure 1). We defined urban and suburban areas as areas with urban fraction values greater and less than 0.3, respectively.
The net radiation (
Q*, W m
−2) was calculated as the sum of the downward shortwave radiation and downward longwave radiation and the direction of the net radiation is downward. Sensible heat (
SH, W m
−2) is the heat flux entering and exiting because of the differences between skin temperature to the atmosphere and the surface temperature, and the latent heat (
LH, W m
−2) is the heat flux entering and exiting due to water phase change. Ground heat (
G, W m
−2) refers to the heat flux entering and exiting the surface. The following formula was used to calculate heat storage term (Δ
Qs) at each tile.
where
Cp is the surface heat capacity and
T is the skin temperature.
Model predictions were made for 36 h with 1-h interval from 00 UTC (09:00 KST) from 15–21 July 2018. The forecast was from 01 UTC to 36 UTC, corresponding to the local time from 10:00 KST to 19:00 KST the next day. Daytime was defined as 01 UTC to 10 UTC, and nighttime was 10 UTC to 20 UTC.
3. Result
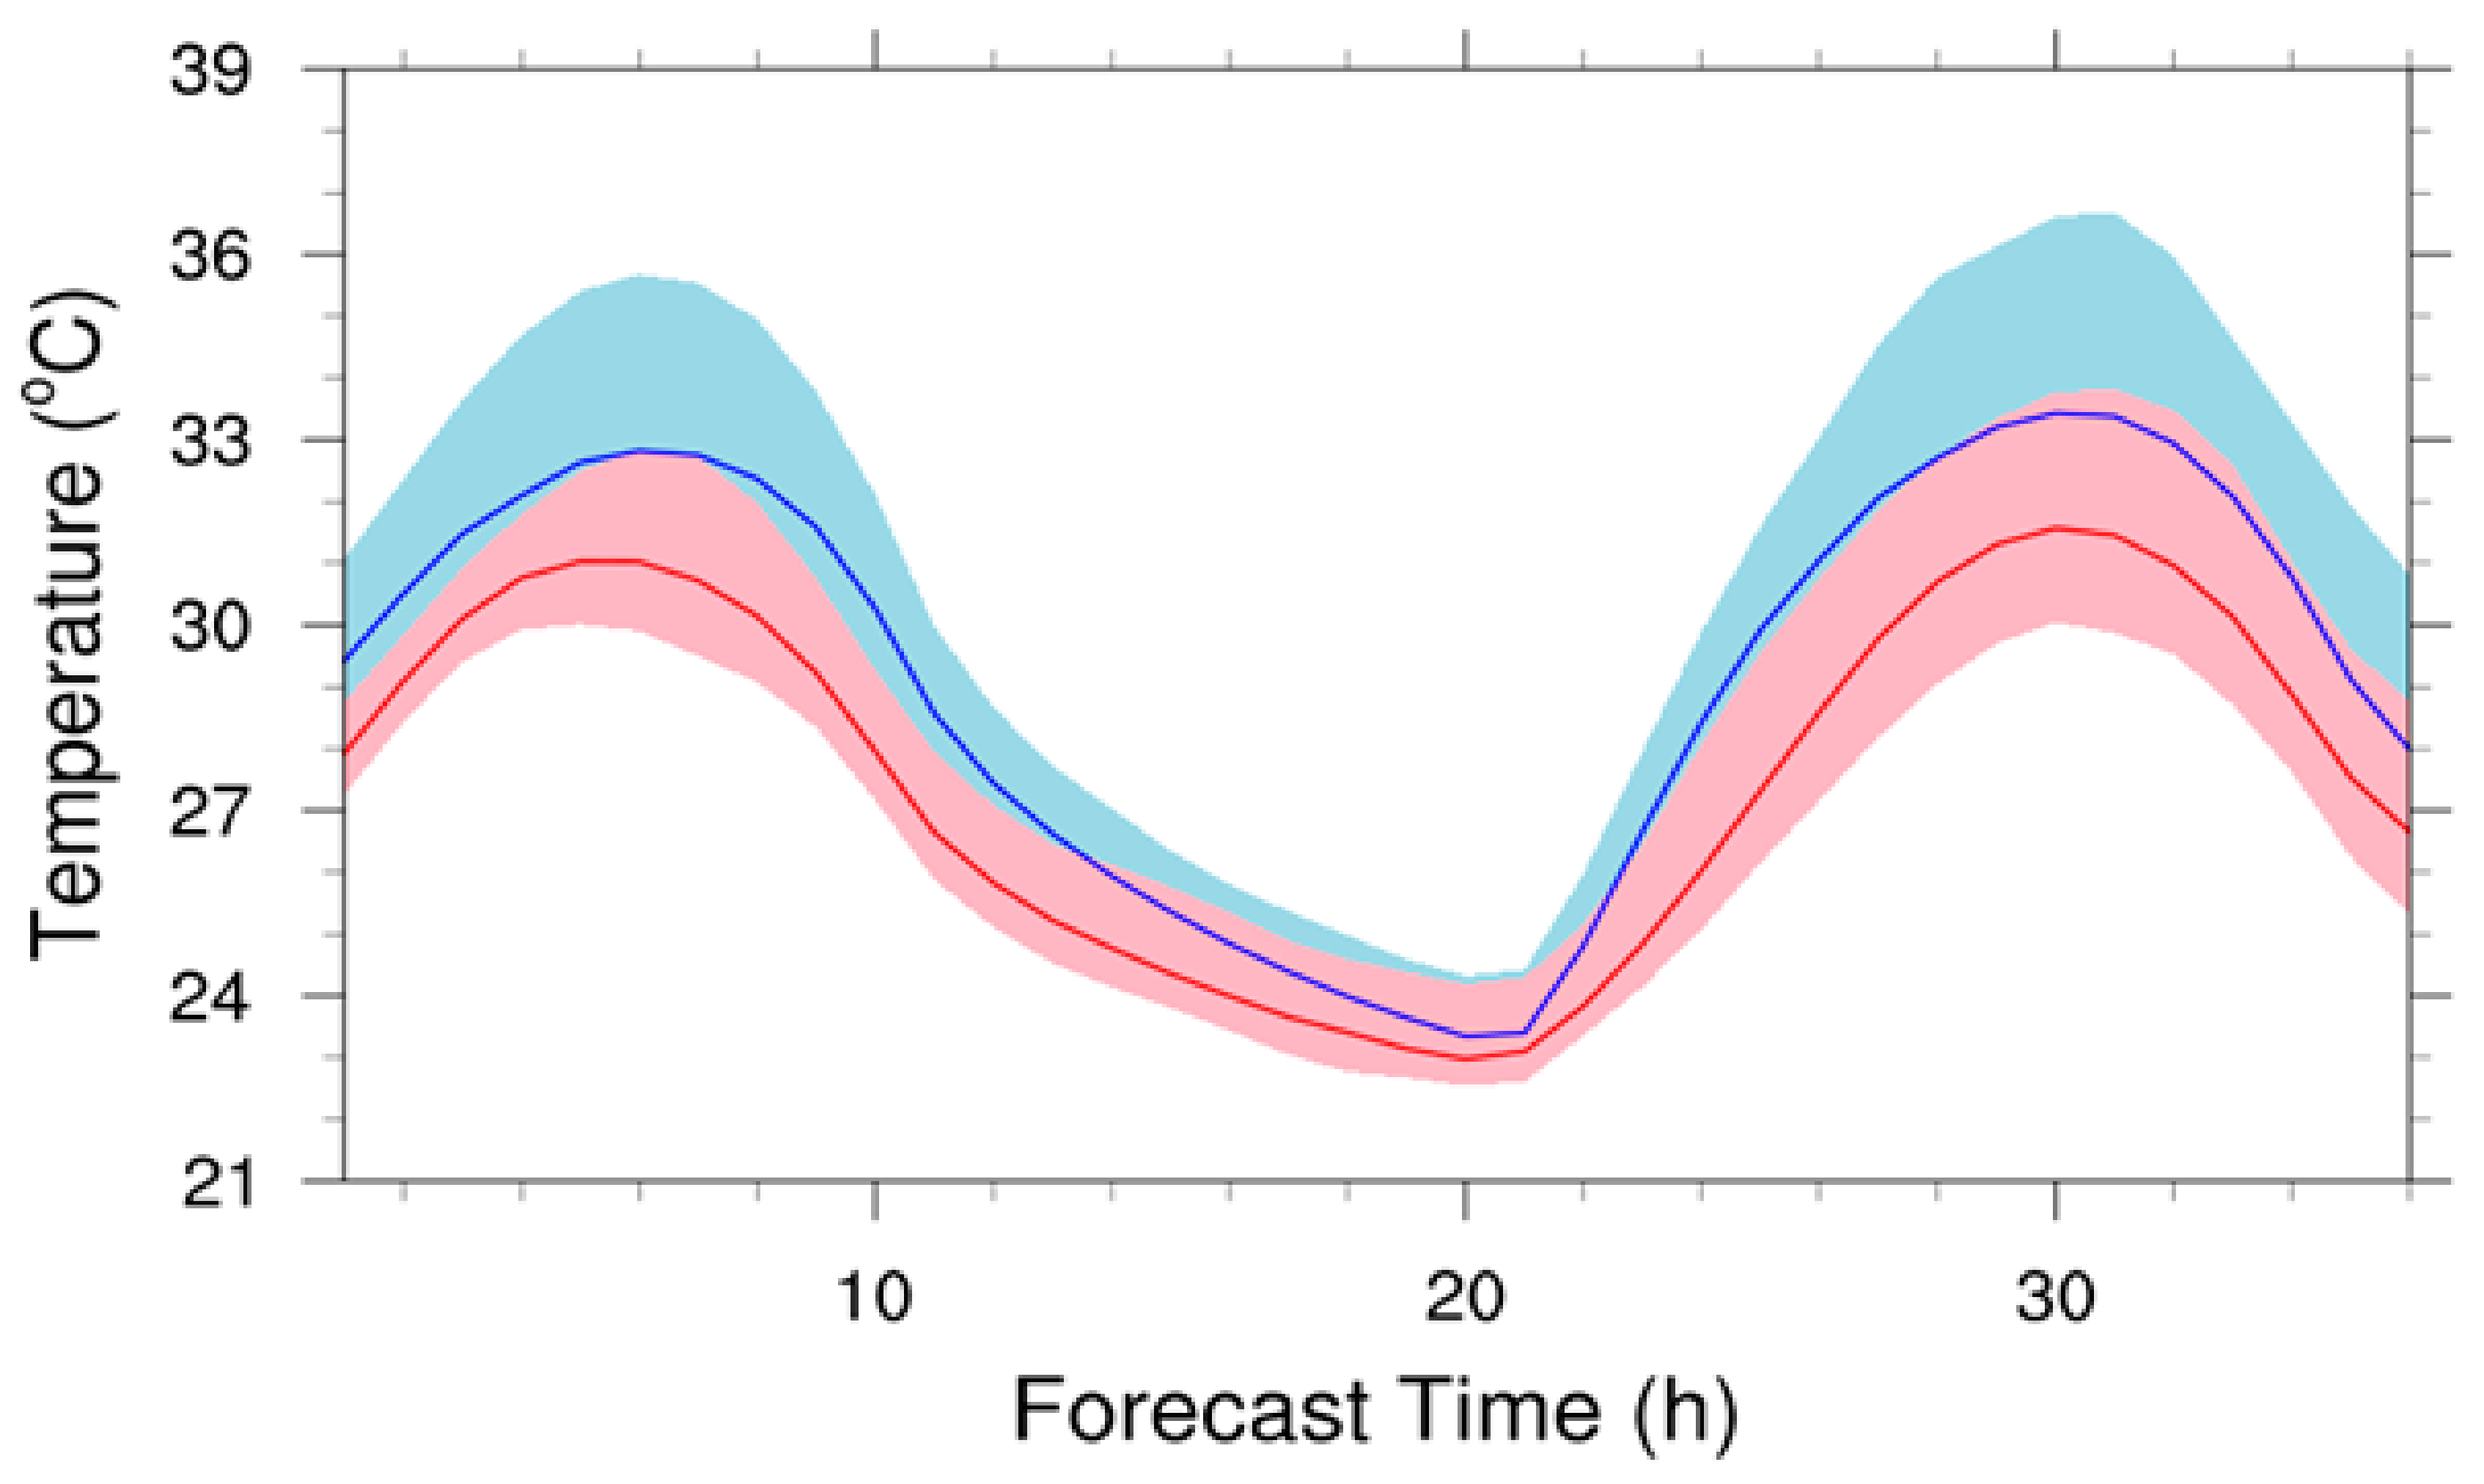
We compared the CTL time series with observation data of 1.5-m temperature averaged for 56 points (
Figure 2) to analyze the simulation performance of the model. CTL was underestimated by about 2 K and 0.5 K during daytime and nighttime, respectively, compared to AWS. However, the model could simulate the diurnal cycle of observations considerably well.
Figure 3 shows the spatial distribution of 1.5-m temperature in CTL. The temperature is high over the urban area but is lower than 28 °C in suburban areas, which is known as urban heat island (
Figure 1). During the daytime, high-temperature areas (more than 30 °C) are widely distributed in the urban area, and the high-temperature zone extends eastward of Seoul due to westerly winds blowing from the coast. At night, the temperature is lower than the average, but the pattern is similar to the average temperature. The 24–25 °C long line extending to the northwest region is characterized by a higher temperature than the surrounding region over the river area. The temperature distribution in the Seoul Metropolitan Area is mainly influenced by the distributions of the urban fraction and westerly winds. The 1.5-m relative humidity and boundary layer height are also consistent with the urban fraction. In summer, humidity reduction in the center of the urban area strengthens the heat island [
20]. The 10-m zonal winds are fast in urban and western areas but low in the eastern part of Seoul. The wind speed is increases as a strong convergence appears at the center of the urban area [
21].
Surface energy balance and skin temperature of CTL were analyzed by dividing the urban and suburban areas (
Figure 4). The net radiation was the sum of the downward net shortwave radiation and downward net longwave radiation, with positive values during the day when the amount of net shortwave radiation was concentrated and negative values at night with no net shortwave radiation and negative net longwave radiation. The sensible and latent heat differs greatly in urban and suburban areas. At night, sensible heat is positive in urban areas, but it is almost zero in suburban areas. The Bowen ratio, the ratio of sensible and latent heat fluxes, is close to 3.5 at 0.6 UTC in urban areas but is much lower than 1 in the suburban areas. In suburban areas, the surface is covered by vegetation, lakes, and rivers, and energy transfer from the surface to the atmosphere occurs through latent heat rather than sensible heat. Ground heat shows a similar pattern in urban and suburban areas. The gray dotted line shows heat storage, which is the net radiation minus sensible, latent, and ground heat fluxes. Heat appears to be stored in the surface during the day and released from the surface in the evening until the next morning. This energy balance of the urban and suburban areas is consistent with previous studies [
1]. The model well simulates the surface energy balance characteristics in urban and suburban areas. These characteristics are reflected in the diurnal cycle of the 1.5-m temperature.
The albedo distribution over the Seoul Metropolitan Area implemented in the CTL experiment is shown in
Figure 5. The model takes the albedo of the wall and the road as input data and then calculates the albedo of each tile with the canyon aspect ratio and solar zenith angle. The albedo that is implemented in the model is very complicated to verify by applying the calculation method, therefore we chose the method of calculating the albedo using the net shortwave radiation (
Qs *) and total downward shortwave radiation (
Qs).
Albedo is 0.16–0.18 southwest of the Seoul Metropolitan Area and 0.06–0.08 in the east. In urban areas, it ranges from 0.10 to 0.14. The Seoul Metropolitan Area has very low albedo, attributable to materials such as asphalt (0.05–0.20) and concrete (0.10–0.35).
When the albedo distributions of the wall and the road were changed by ±50% each, the albedo values in the urban area and west of Seoul became different from the CTL (
Figure 5). To confirm the change in albedo, albedo from the 56 sites in each experiment from urban and suburban areas were averaged (
Figure 6). When the wall and road albedos were changed by 50%, the albedos in the metropolitan area changed by about 8% and 5%, respectively, indicating that wall albedo changes more than road albedo.
Changes in 1.5-m temperature with the change in albedo were verified through the CTL experiment and each experiment (
Figure 7). When albedo decreases, temperature increases, and vice versa. In urban areas, the temperature changes by 0.06 °C during the day and 0.01 °C at night. The temperature change in suburban areas is about half that in urban areas. The temperature change is small because the albedo value is very low in the model, but the temperature change is estimated to be large in high-albedo areas.
The distribution of 1.5-m temperature bias between each experiment and CTL experiments were analyzed (
Figure 8). As the albedo increases, the temperature decreases, especially in areas with high urban fraction. There is a large spatial difference between the experiments of the wall and the road. The experiment of the wall showed a temperature change in central Seoul than the experiment of the wall. The road showed temperature changes in a relatively wider area.
To verify the characteristics of surface energy changes associated with the 1.5-m temperature change, differences in net radiation, sensible heat, latent heat, and ground heat fluxes and heat storage between decreased and increased albedo were examined (
Figure 9a,b). In urban areas, the decrease in albedo increases the net shortwave radiation to the surface, increasing the net radiation. The net radiation differs between walls and roads during the daytime because the amount of incident solar radiation depends on the building area, which is probably related. Sensible and ground heat increase, but the change in latent heat is small. The heat storage term is positive in the early morning and negative in the late afternoon. The increase in sensible heat may have played a role in increasing the atmospheric temperature.
The graph of net radiation is similar for both suburban and urban areas, but its value is small (
Figure 9c,d). Net radiation shows only small changes in suburban areas because the urban fraction is reduced, and the albedo decrease is smaller. As a result, the change in sensible and ground heat flux also appears to be small, and unlike urban areas, the latent heat increases during the day and night. Sensible heat is lower in suburban areas than in urban areas, therefore the effect of temperature increase is also small.
The vertical potential temperature distribution of 37.33° N, the latitude at which 1.5-m temperature changes significantly in the city at 06 UTC because the effect of albedo changes is greatest during the day, is shown in
Figure 10. Considering the results of the AWP experiment, the potential temperature increases with increasing altitude. In areas west of 126.8° E, the sea wind blows from the Yellow sea, and the atmosphere is more stable. In contrast, it has a constant temperature from the surface to an altitude of 1000 m at 127.1° E and 127.45° E, where the lower temperatures increase most significantly. The vertical constant temperature means that there is a vertical circulation, and the atmosphere is well mixed. In other sensitivity experiments, the vertical structure of potential temperature in the Seoul Metropolitan Area is similar. As a result of the difference between AWN and AWP, the potential temperature increases from altitudes 1200 m above the surface if albedo decreases. There is a significant increase in temperature in the west relative to 127.2° E. In contrast, in the case of road experiments, the temperature increases not only in the west but also in the east. At altitudes above 1200 m, the temperature decreases.
The change in vertical circulation was analyzed when the albedo changed (
Figure 11). It can be seen that the western wind is blowing, and there is a weak upward motion near 127.1° E. In AWN-AWP, the upward airflow of 126.8° E is bent at an altitude of about 300–600 m and joins the downward motion of 127.1° E. In contrast, in ARN-ARP, an upward motion appears at 127.2° E. It mixes with the surrounding atmosphere at an altitude of 600–1500 m. The difference between the location of the upward motion and the altitude that mixes with the surrounding atmosphere indicates the difference in the vertical structure of potential temperature.


