Article

The Climatology and Trend of Surface Wind Speed over Antarctica and the Southern Ocean and the Implication to Wind Energy Application

1
SOA Key Laboratory for Polar Science, Polar Research Institute of China, Shanghai 200136, China
2
Southern Marine Science and Engineering Guangdong Laboratory, Zhuhai 519000, China
3
Department of Geography, Environment and Spatial Sciences, Michigan State University, East Lansing, MI 48824, USA
*
Author to whom correspondence should be addressed.
Atmosphere 2020, 11(1), 108; https://doi.org/10.3390/atmos11010108
Submission received: 28 November 2019 / Revised: 1 January 2020 / Accepted: 13 January 2020 / Published: 16 January 2020

Abstract

:
Surface wind trends and variability over Antarctica and the Southern Ocean and their implications to wind energy in the region are analyzed using the gridded ERA-Interim reanalysis data between 1979 and 2017 and the Self-Organizing Map (SOM) technique. In general, surface winds are stronger over the coastal regions of East Antarctica and the Transantarctic Mountains and weaker over the Ross and Ronne ice shelves and the Antarctic Peninsula; and stronger in winter and weaker in summer. Winds in the southern Indian and Pacific Oceans and along coastal regions exhibit a strong interannual variability that appears to be correlated to the Antarctic Oscillation (AAO) index. A significantly positive trend in surface wind speeds is found across most regions and about 20% and 17% of the austral autumn and summer wind trends, respectively, and less than 1% of the winter and spring wind trends may be explained by the trends in the AAO index. Except for the Antarctic Peninsula, Ronne and Ross ice shelves, and small areas in the interior East Antarctica, most of the continent is found to be suitable for the development of wind power.

1. Introduction

As a clean, renewable energy resource, wind energy has been gaining attention in recent decades. Studies have identified many regions around the globe that are rich in wind energy resources both onshore [1,2,3,4,5,6] and offshore [7,8,9]. One continent that has vast regions of ample wind resources is Antarctica because of its unique geographical location and topography [10]. Several studies have examined wind energy potential in Antarctica, but most of these studies are limited to areas where there is an observational station including Casey, Davis, Dumont D’Urville, Marson, Macquarie [11], Maitri [12], SANAE IV [13], Wasa [14], and Princess Elisabeth [15]. There has been, to our knowledge, a lack of study on wind resources over the entire Antarctic continent and adjacent oceans.
The near-surface wind field in Antarctica is dominated largely by katabatic winds, large-scale downslope wind systems. Katabatic winds are especially strong in austral winter, as cold, dense air on the snow-covered interior plateau rushes down to the coast, making the continent the windiest place on earth. The strong seasonal and spatial variability of the katabatic winds contributes greatly to the variations of the Antarctic surface wind field. Mather and Miller [16] were some of the first to describe the katabatic winds in Eastern Antarctica. Later, diagnostic models were used to infer surface wind fields over the Antarctic continent [17,18,19]. The proliferation in high-resolution numerical modeling in the late 20th century resulted in a significant improvement in our knowledge about the forcing mechanisms for surface winds in Antarctica [20,21,22,23,24,25,26,27,28]. Parish [29] attributed the Antarctic surface winds to a pressure gradient force related to katabatic winds, a large-scale pressure gradient force and thermal winds. Van den Broeke and van Lipzig [30] and Parish and Cassano [31] indicated that the variations of the Antarctic surface winds are a result of seasonal and regional variations of the large-scale synoptic forces and local katabatic forcing. Yasunari and Kodama [32] and Simmonds and Law [33] revealed that the katabatic flows and near-surface winds in Antarctica are also influenced by the Antarctic polar vortex. Parish and Bromwich [34] noted that katabatic winds are involved in zonally averaged meridional circulations over the high southern latitudes.
Surface winds including katabatic winds in Antarctica have been changing significantly over time with different trends depending on location, season, and time period. To explore the variability and change of wind speed and to assess wind energy source at some stations, previous studies utilized data from observations to analyze wind speed change. Turner et al. [35] showed that for the period 1951–2000, seasonal mean surface wind speeds exhibited a significant positive trend for the summer season at Faraday, but a negative trend for the autumn season at Casey and a negative trend in all seasons but summer at Amundsen-Scott. Later, Turner et al. [36] recorded a significant positive (negative) trend in wintertime mean wind speed at Mawson and Davis (Halley) stations for the period 1979–2006. More recently, Chenoli et al. [37] noted a decreasing trend throughout the year at the McMurdo station over the period 1979–2005.
The strong spatial dependency of the trends in near-surface winds in Antarctica noted in the aforementioned studies motivated the current study that extends the trend analysis of near-surface winds from a few isolated locations to the entire Antarctic continent and the surrounding oceans. The novelty of this study lies in the focus on continent-scale spatial variability of the trends in surface wind and wind energy resources instead of trends at a specific location or a region and the search for a possible explanation for the spatial variability.
The rest of this paper is organized as follows. Data and method of analysis are described in Section 2. The results are presented in Section 3, starting with annual and interannual variation and trends averaged over five different regions of Antarctica and the Southern Ocean, which is followed by more in-depth statistical analyses on the interannual variability and trends. Conclusions are given in Section 4 along with some discussion of the limitations of the current work and potential future work.

2. Methods

The European Centre for Medium-Range Weather Forecasts (ECMWF) Interim Reanalysis (ERA-Interim) [38] dataset for the period 1979–2017 is used in this study. The temporal resolution of ERA-Interim data is six-hourly and the spatial resolution is about 80 km (T255) and 60 vertical levels from surface to 0.1 hPa. Produced with a more advanced data assimilation algorithm (12-h 4D-Var vs. 3D-Var as in previous reanalyses) and with more observational data, especially satellite data, ERA-Interim reanalysis demonstrated better performance in the assessment of the Antarctic surface winds and precipitation [39] as compared to most other contemporary reanalysis products with the exception of the newly released ERA-5 whose performance in Antarctica is yet to be evaluated. However, ERA-Interim still contains a large bias in surface wind speed in coastal regions due to the underestimation of katabatic winds [27,40]. The primary variable of interest for this study is 10 m wind speed, but other fields, such as the mean sea level pressure (MSLP), are also extracted from the ERA-Interim in order to explain the surface wind variability.
The 10 m wind speed variability in the domain south of the 60° S latitude line (Figure 1) is analyzed using the Self-Organizing Map technique (SOM) [41].
SOM is a neural-network-based clustering method that transforms high-dimensional input data into a two-dimensional array of nodes. The array is shown as a Sammon map [42] where the distance between two nodes suggests the similarity of their spatial patterns and thus the SOM array demonstrates a series of continuous varying spatial modes that capture more objectively the varying patterns in the input data. Like the empirical orthogonal function (EOF) method, the SOM method gives the main modes of the variability of a certain variable in a certain region. Unlike the EOF method, the SOM method is not confined by stringent requirement of orthogonality [43]. Nigro and Cassano [44] used the SOM method to examine surface wind patterns over the Ross Ice Shelf of Antarctica. Using the SOM method, Yu et al. [6] identified the main anomalous atmospheric circulation patterns related to the Antarctic melt-season sea ice trend. The outcome of SOM analysis depends on the number of nodes utilized and as a result, it is important to determine the number of nodes to use prior to the analysis. The criterion is that the number is neither too small to miss important patterns of variability, nor too large to complicate result interpretation with unnecessary details. A previous study using SOM for a similar domain [6] suggested that nine SOM nodes (3 × 3 grid) is optimal for describing the variability of seasonal wind speed in Antarctica and its surrounding oceans.
For each season of the year over the 38-year study period, seasonal mean wind speed is calculated at each grid point in the domain and the spatial pattern is then matched to one of the nine SOM patterns (nodes) based on the minimum Euclidean distance. The frequency of the occurrences of each SOM pattern is then calculated by the number of matches divided by the total number of years during the 38-year (1979–2017) study period. Following the previous method [45], the percentage of the total trend in the seasonal mean wind speed accounted for by a SOM pattern is estimated by the product of the SOM pattern and the trend in the frequency of occurrences of that SOM pattern.
Besides, the monthly Antarctic Oscillation (AAO) index is derived from the Climate Prediction Center (CPC) of the National Oceanic and Atmospheric Administration (NOAA) (https://www.cpc.ncep.noaa.gov/products/precip/CWlink/daily_ao_index/aao/aao.shtml). As first mode of atmospheric circulation variability in southern mid–high latitudes, the positive phase of the AAO index indicates positive (negative) height anomalies in southern middle (high) latitude and vice versa.

3. Results

3.1. Annual and Interannual Variability

For this analysis, the study domain is divided into two regions of land: East Antarctica (30° W–180° W) and West Antarctica (180° W–30° W), and three regions of ocean: the Pacific Ocean (100° E–80° W), Atlantic Ocean (80° W–20° E), and Indian Ocean (20° E–100° E) (Figure 1). The climatological annual cycle and interannual standard deviation of daily mean 10 m wind speeds for 1979–2017 averaged over each of the five regions and over the entire domain are shown in Figure 2.
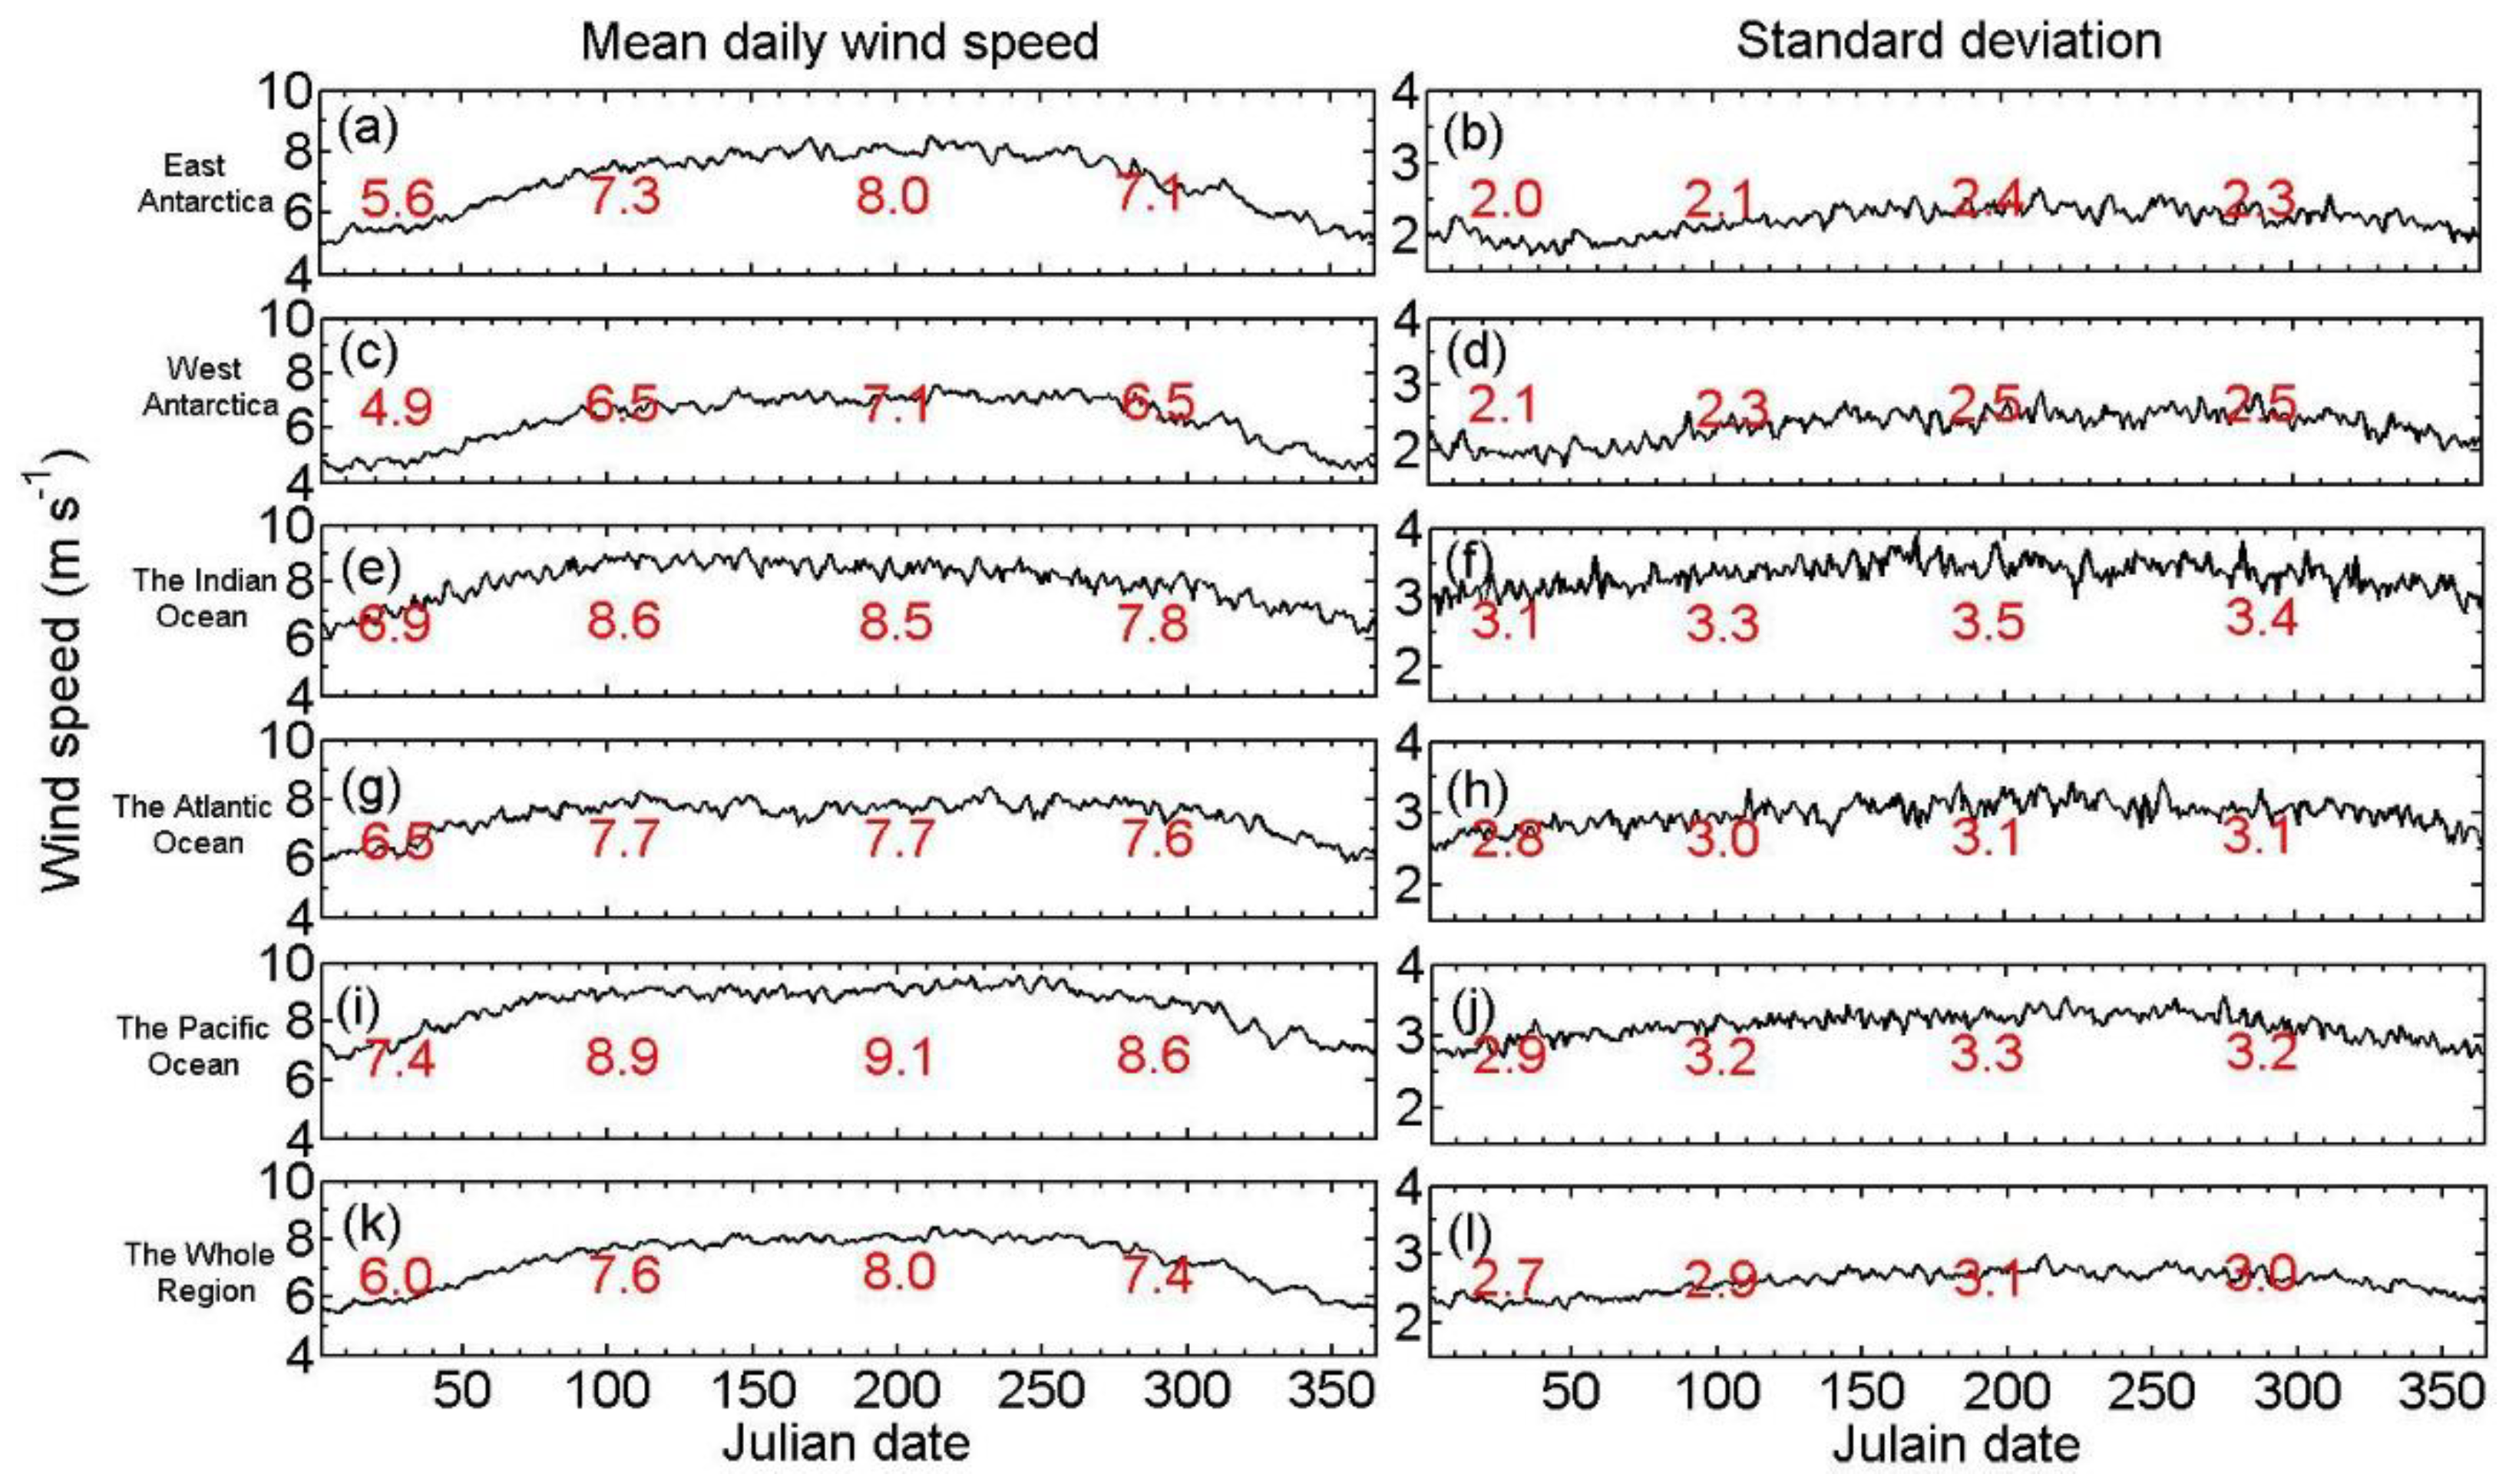
In all regions, wind speeds exhibit a distinct annual cycle with a minimum in austral summer (regional summer season means ranging from 4.9 m s−1 in West Antarctica to 7.4 m s−1 in the southern Pacific) and a maximum in austral winter (regional winter season means ranging from 7.1 m s−1 in West Antarctica to 9.1 m s−1 in the southern Pacific) except for the Indian Ocean, where the autumn value (8.6 m s−1) is slightly higher than that of winter (8.5 m s−1). The magnitudes of wind speeds vary substantially among the regions. Wind speeds averaged over West Antarctica (seasonal means ranging from 4.9 m s−1 in summer to 6.5 m s−1 in winter) are consistently weaker than those over East Antarctica (seasonal means from 5.6 m s−1 in summer to 7.3 m s−1 in winter) where strong katabatic winds prevail [36]. Winds are stronger over oceans throughout the year and among the three ocean regions, the strongest winds are over the southern Pacific (7.4 m s−1 summer—9.1 m s−1 winter) and weakest over the southern Atlantic (6.5 m s−1 summer–7.7 m s−1 winter). These differences in the average wind speeds over the three ocean regions appear to be consistent with the spatial pattern of cyclone density [46], which is not a surprise as wind speeds over the Southern Ocean have been linked to cyclone activities [10]. The amplitudes of the annual cycle also exhibit some differences among the regions. The largest amplitude of 3.5 m s−1 is found in East Antarctica, due possibly to the strong annual cycle of surface temperature and its related inversion over this region [47], and the smallest annual cycle of 2.5 m s−1 appears over the southern Atlantic Ocean, possibly a result of small seasonal variability of cyclone activity in the southern Atlantic Ocean [46].
A similar annual cycle is also seen in the interannual standard deviation of daily mean wind speed, ranging from 2.0 m s−1 in East Antarctica to 3.1 m s−1 in the Indian Ocean in austral summer, to 2.4 m s−1 in East Antarctica to 3.5 m s−1 in the Indian Ocean in austral winter. Among the five regions, the largest interannual variability occurs over the southern Indian Ocean, followed by the southern Pacific Ocean, while the smallest variability is in East Antarctica where surface winds are dominated by katabatic flows. The regional differences in the interannual variability are in good agreement with the spatial pattern of the cyclone activity density.
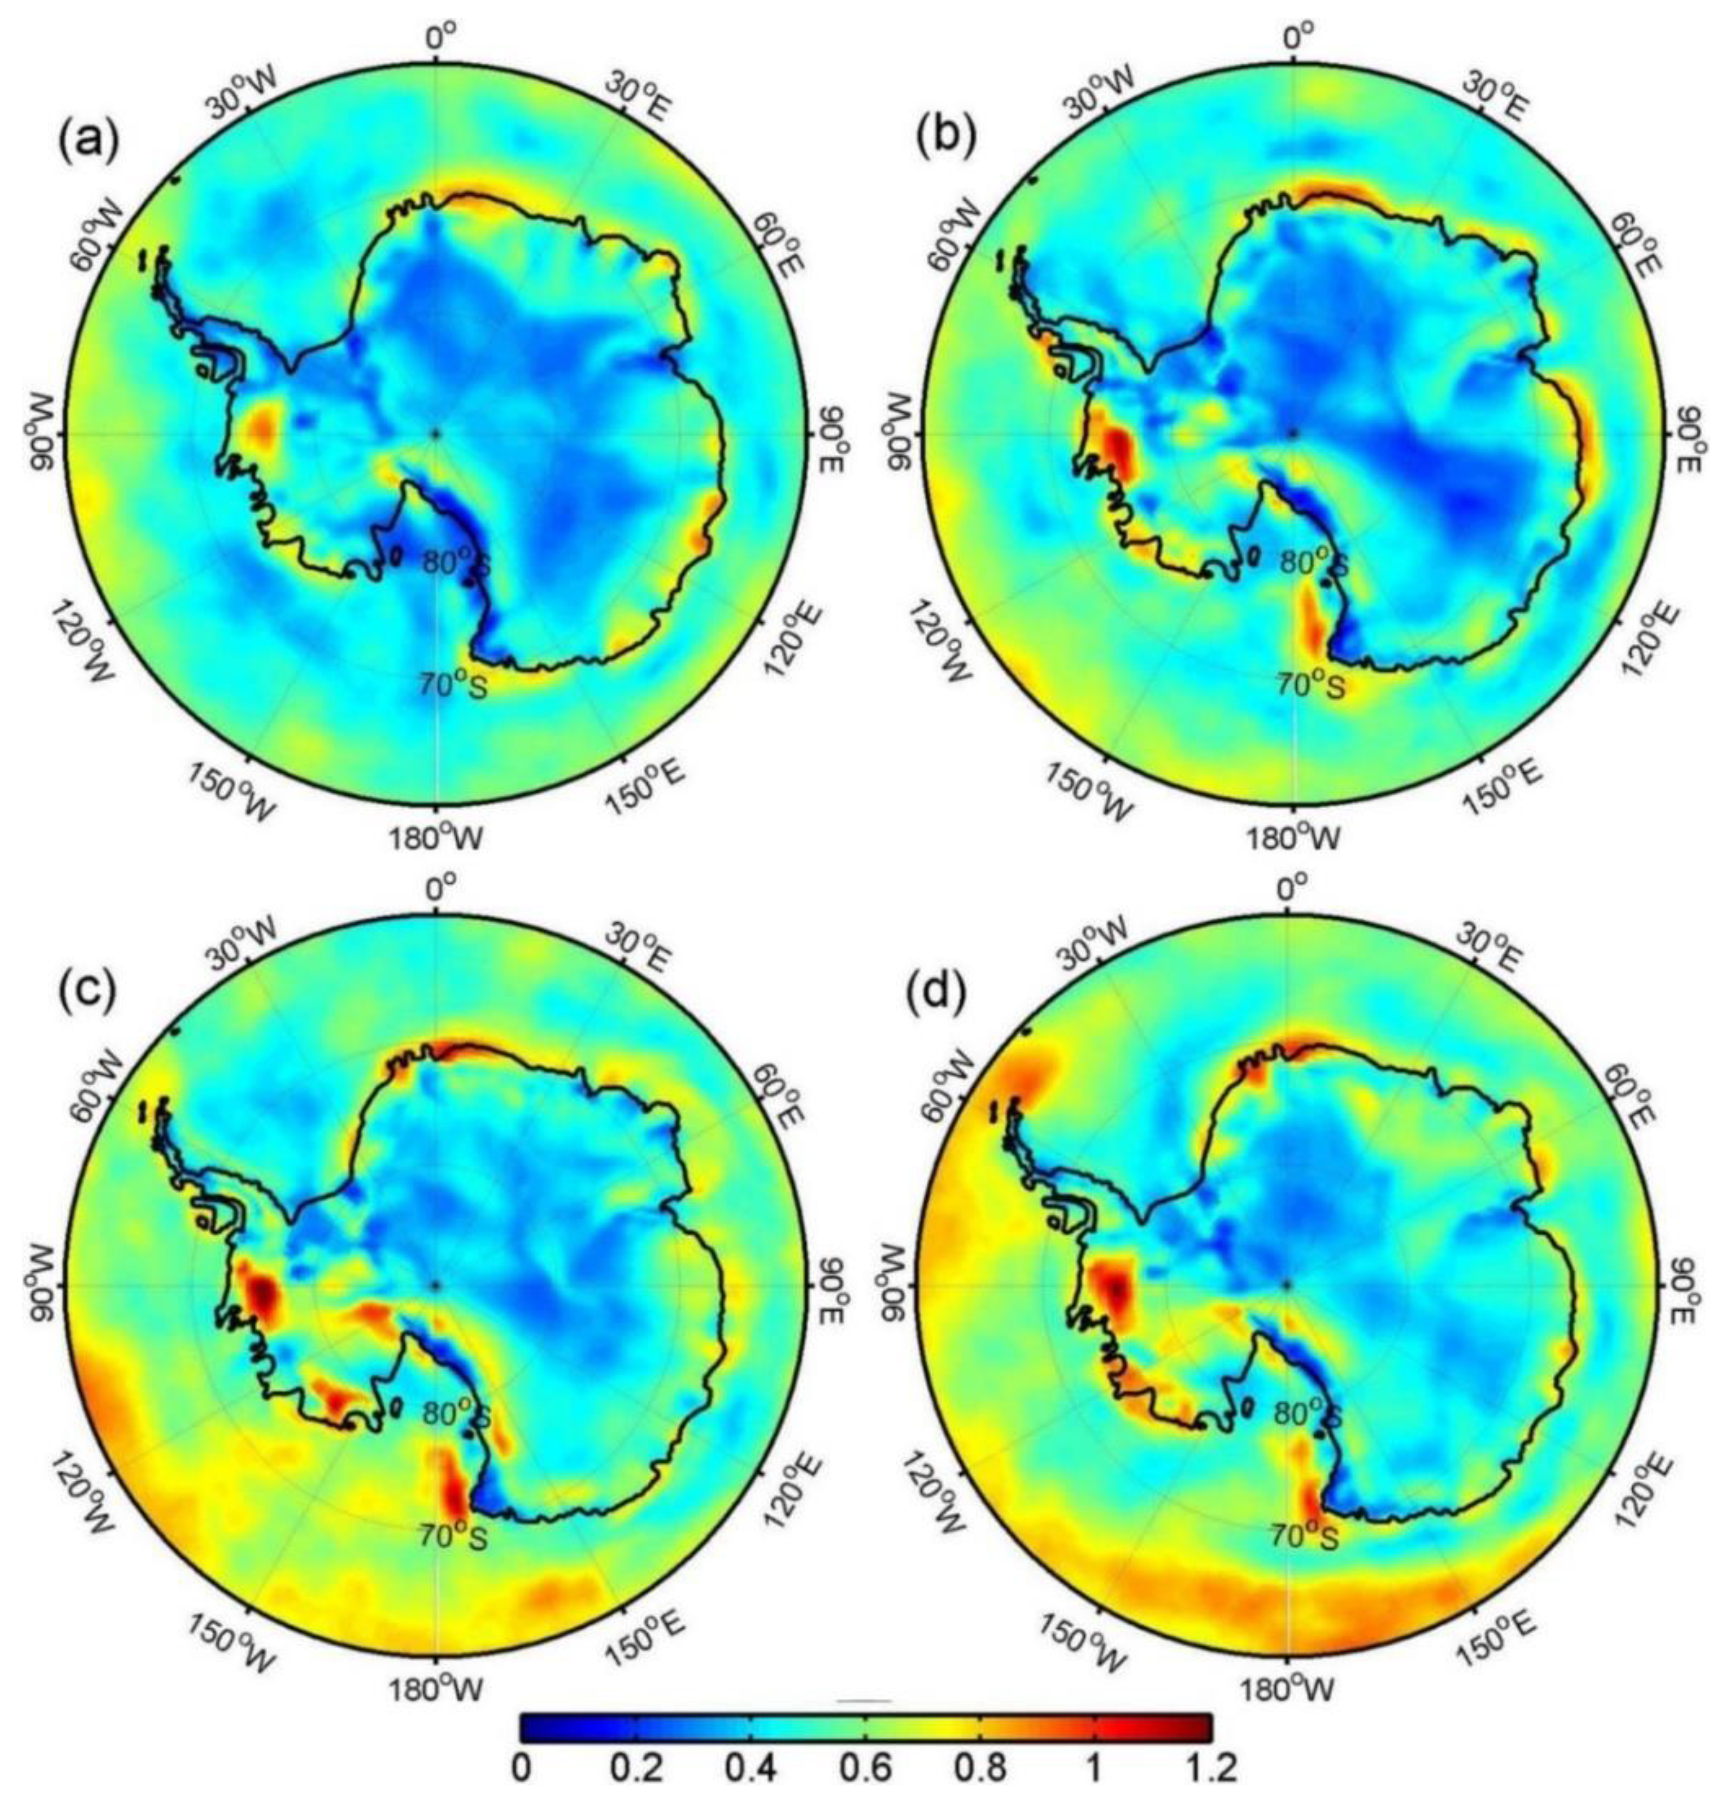
Despite the seasonal differences in the values of standard deviations, the spatial distributions of the interannual standard deviations (Figure 3) vary little with season. Larger standard deviations indicating stronger interannual variability occur over coastal regions where katabatic winds interact greatly with cyclonic activities [31]. The western Ross Sea and Transantarctic Mountains also show larger interannual variability. Small variability is seen over the interior of the Antarctic continent. In austral winter and spring, the southern Pacific Ocean and Drake Strait display large interannual variability, which is consistent with the variability of cyclone activity [48].
Some of the interannual variability of the seasonal mean surface wind speeds over Antarctica and the Southern Ocean may be explained by the main variability mode of atmospheric circulations on the interannual time scale for southern mid–high latitudes, namely, AAO or the Southern Annular Mode (SAM), characterized by out-of-phase height variations between the mid- and high latitudes [49]. Table 1 shows the correlation coefficients between the time series of the seasonal mean wind speed and the AAO index for each of the five regions.
No significant correlations are found between the Niño 3.4 index and regional and seasonal mean wind speeds, except for summer in the southern Atlantic region where winds are negatively correlated to Niño 3.4 (not shown). Significant and strong positive correlations exist between the AAO index and winds in the southern Pacific and Atlantic Oceans throughout the year and the Indian Ocean for austral spring and summer, which may be explained by the more (less) frequent and intense cyclone activities associated with positive (negative) phase of the AAO index over the Southern Ocean [48]. However, correlations with winds over land are weak and mostly insignificant except for winter in Eastern Antarctica where winds are negatively correlated with AAO, which is consistent with the relationship between the wintertime AAO index and cyclone density and depth [50,51] and cyclone frequency [52]. We make the correlations between seasonal surface roughness and the AAO indices. There are no significant correlations (not shown). The weak correlations over land between AAO and winds during nonwinter seasons are probably not related to local surface effects, but more to reduced cyclone activities [46].

3.2. Trends

Across all regions and seasons, the regional averaged trends in surface winds (Table 2) are overwhelmingly positive. Over the continent, trends are significant in spring and summer. Over oceans, trends are significant for all but the spring season over the southern Indian Ocean, all but the autumn season over the southern Atlantic Ocean, and for only the summer season over the southern Pacific Ocean.
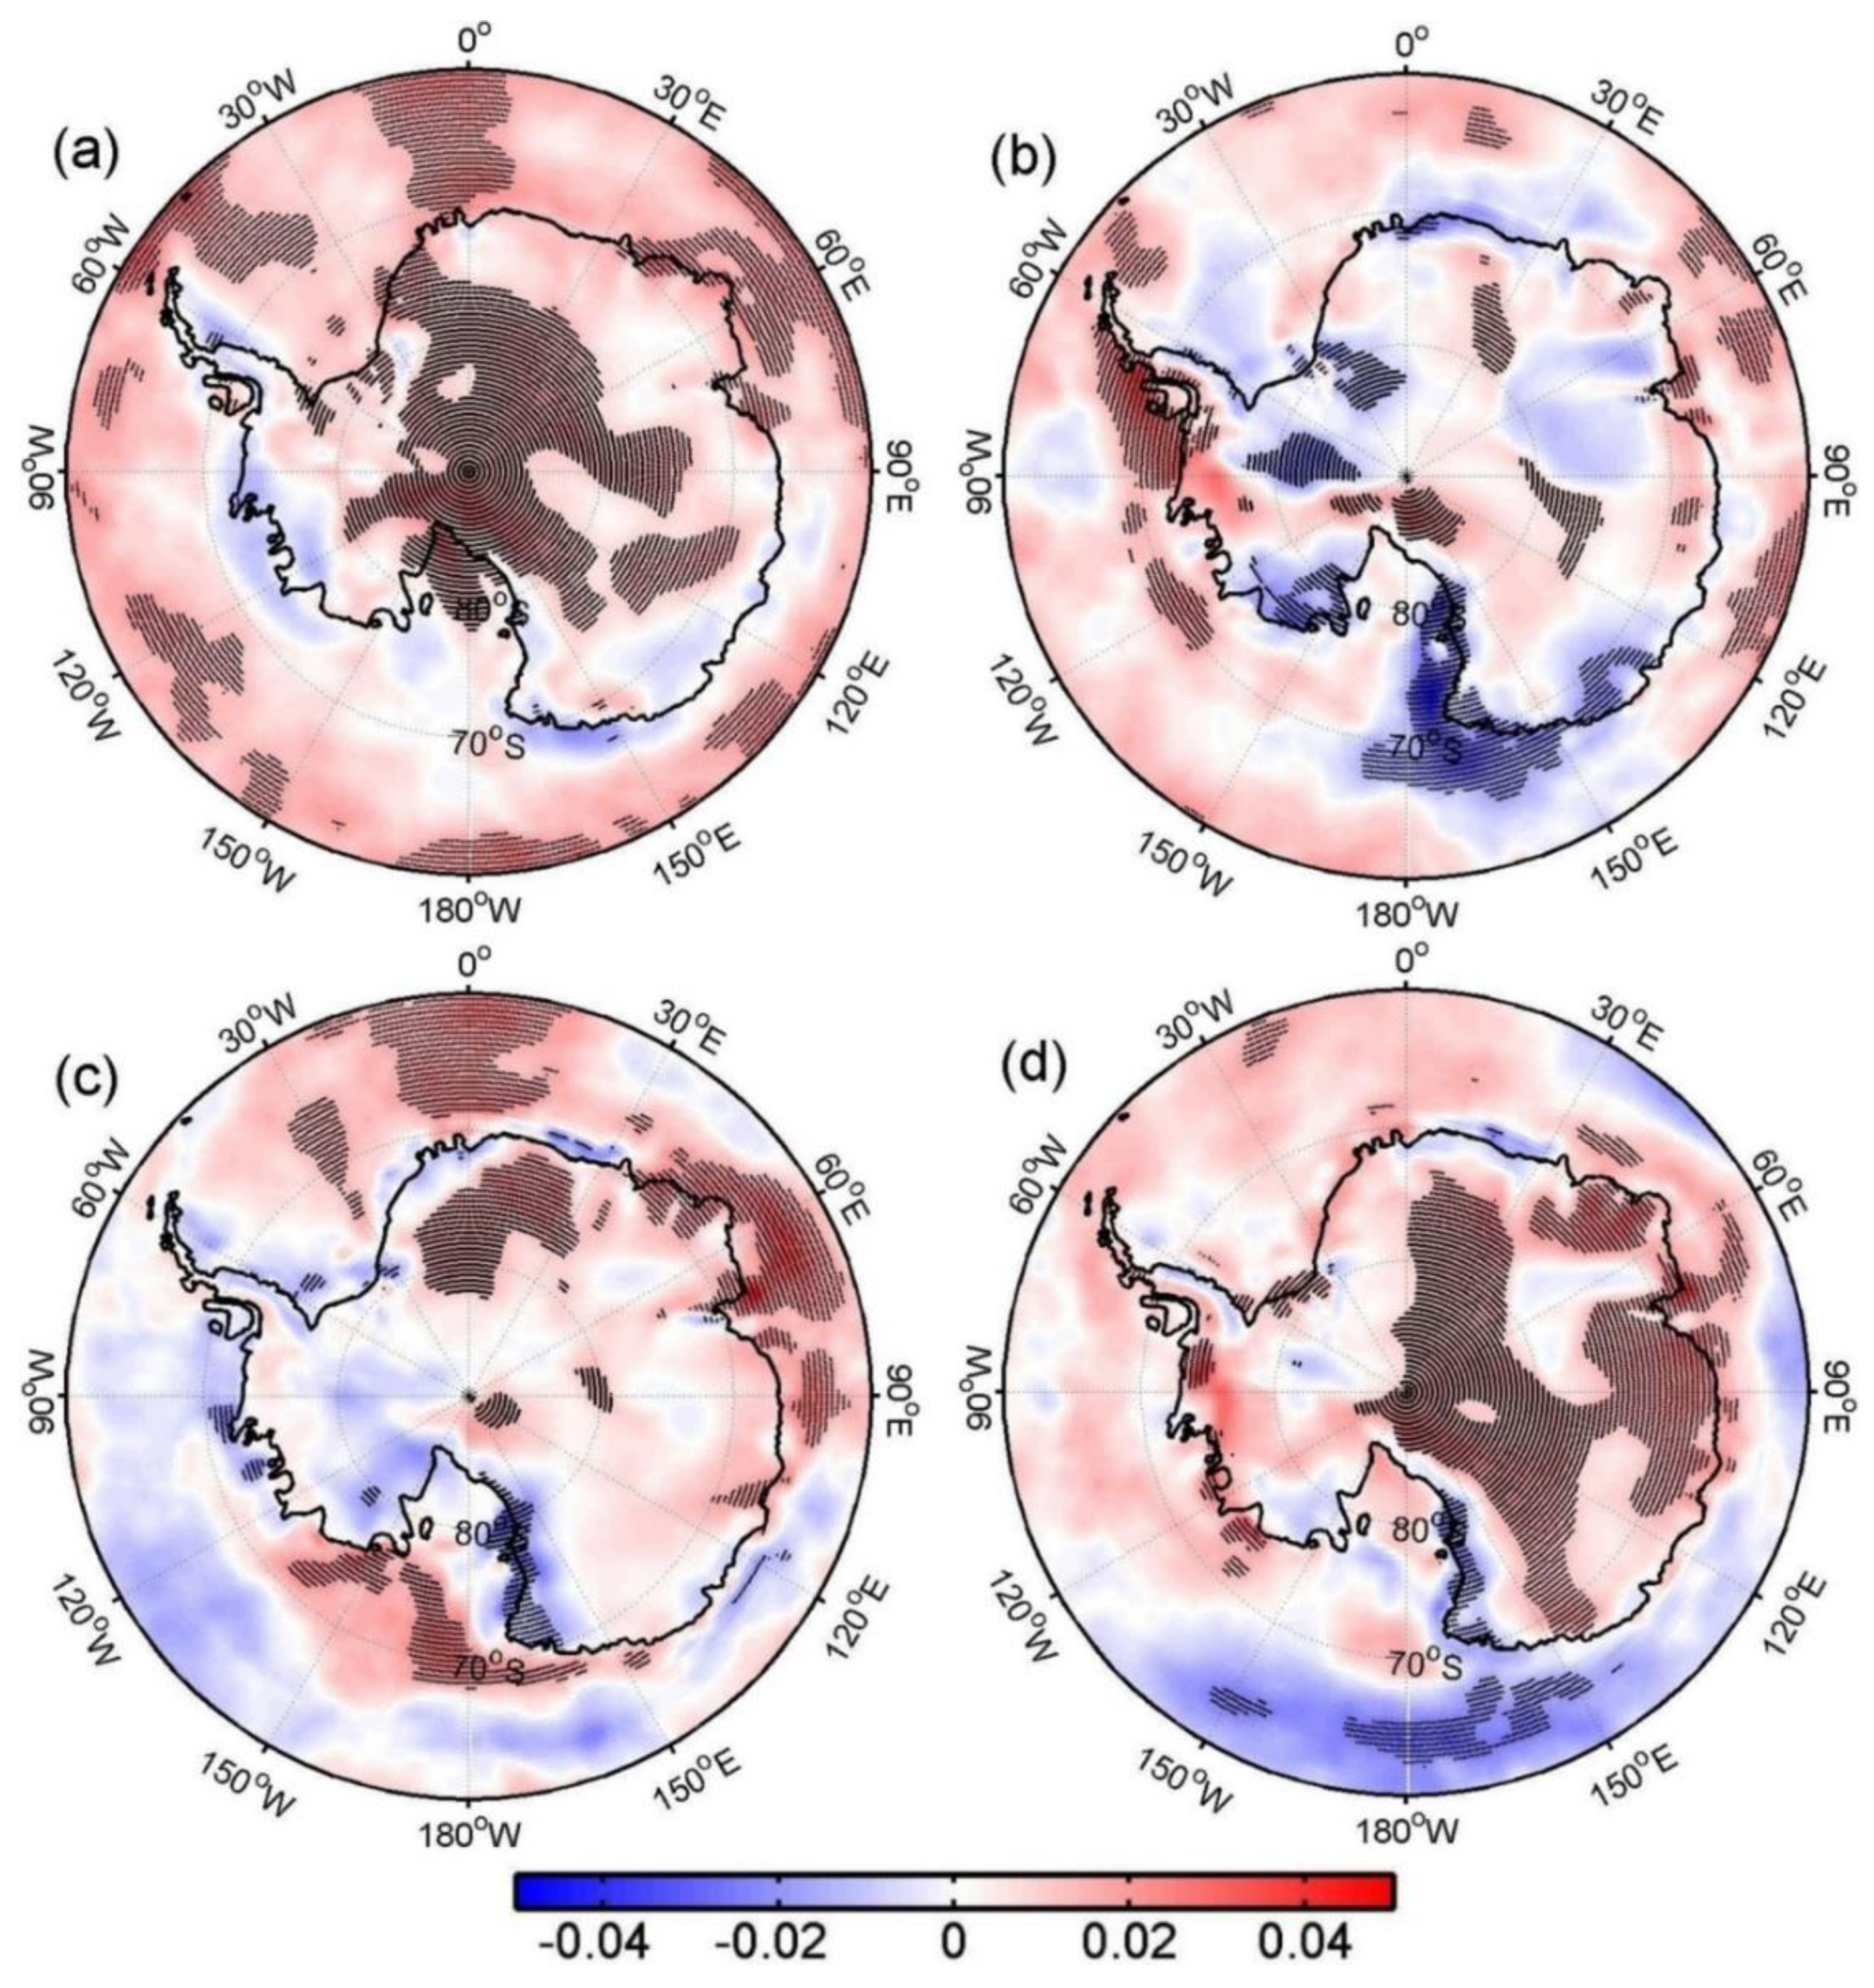
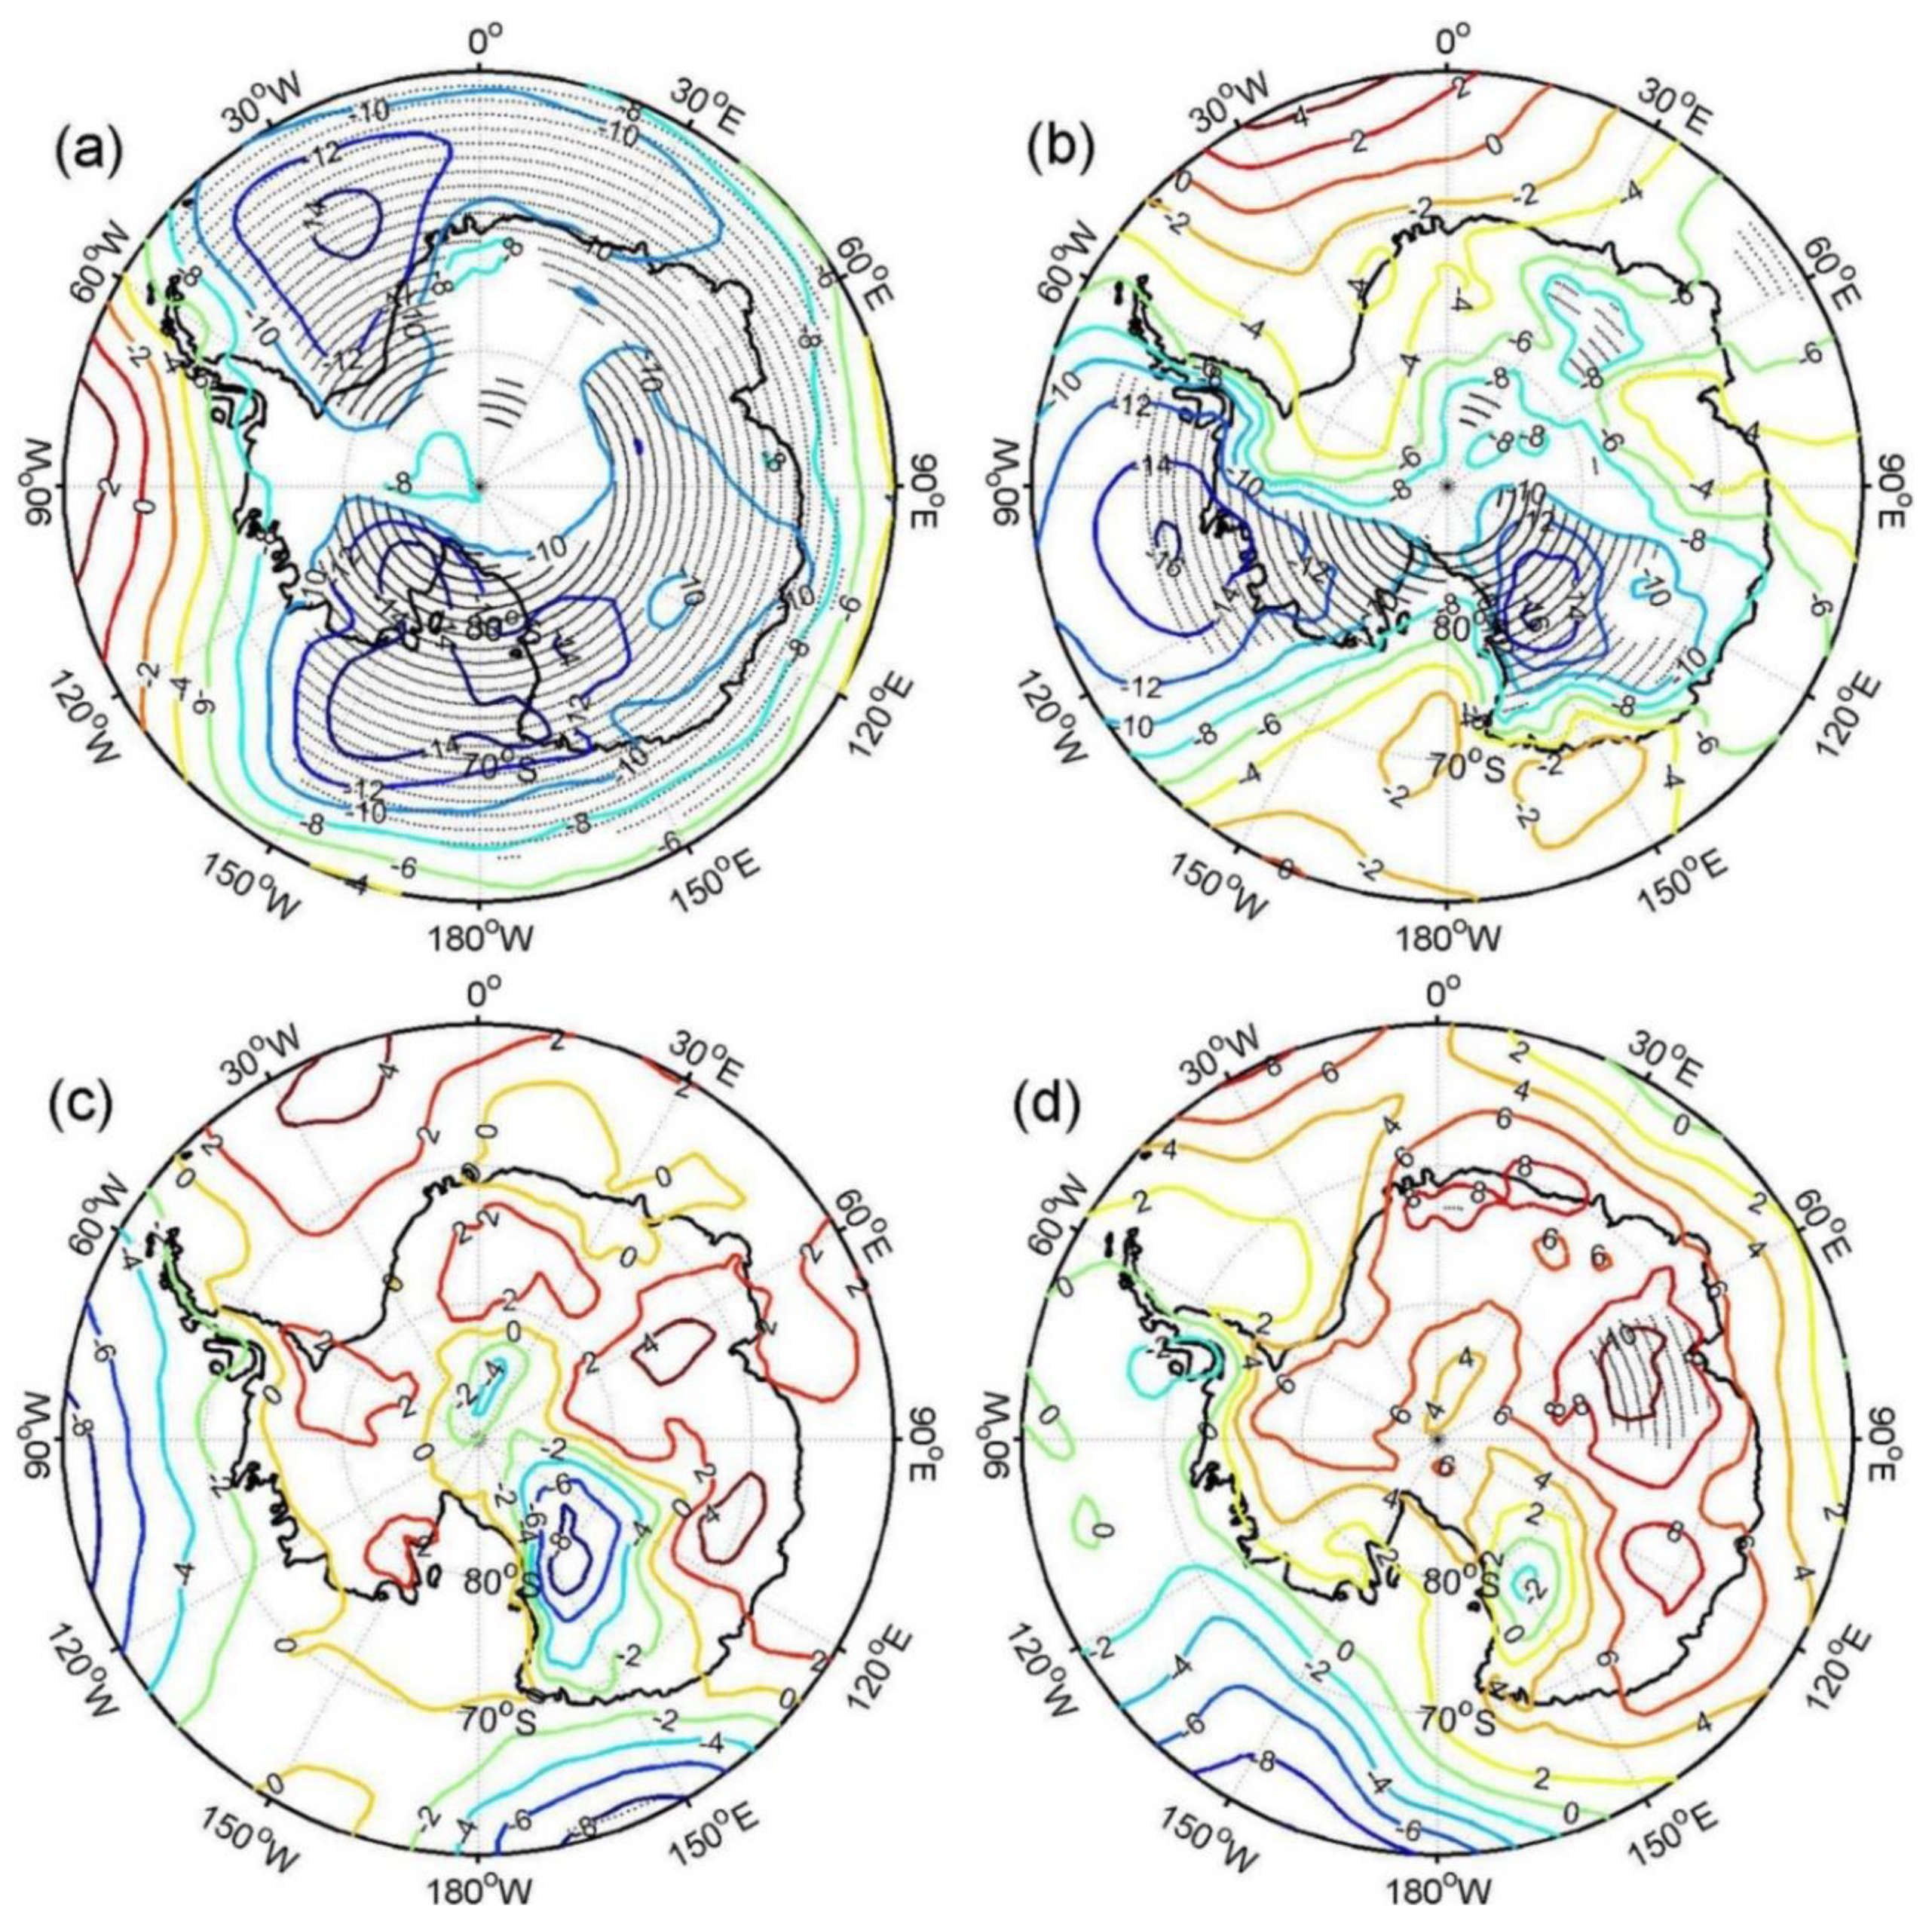
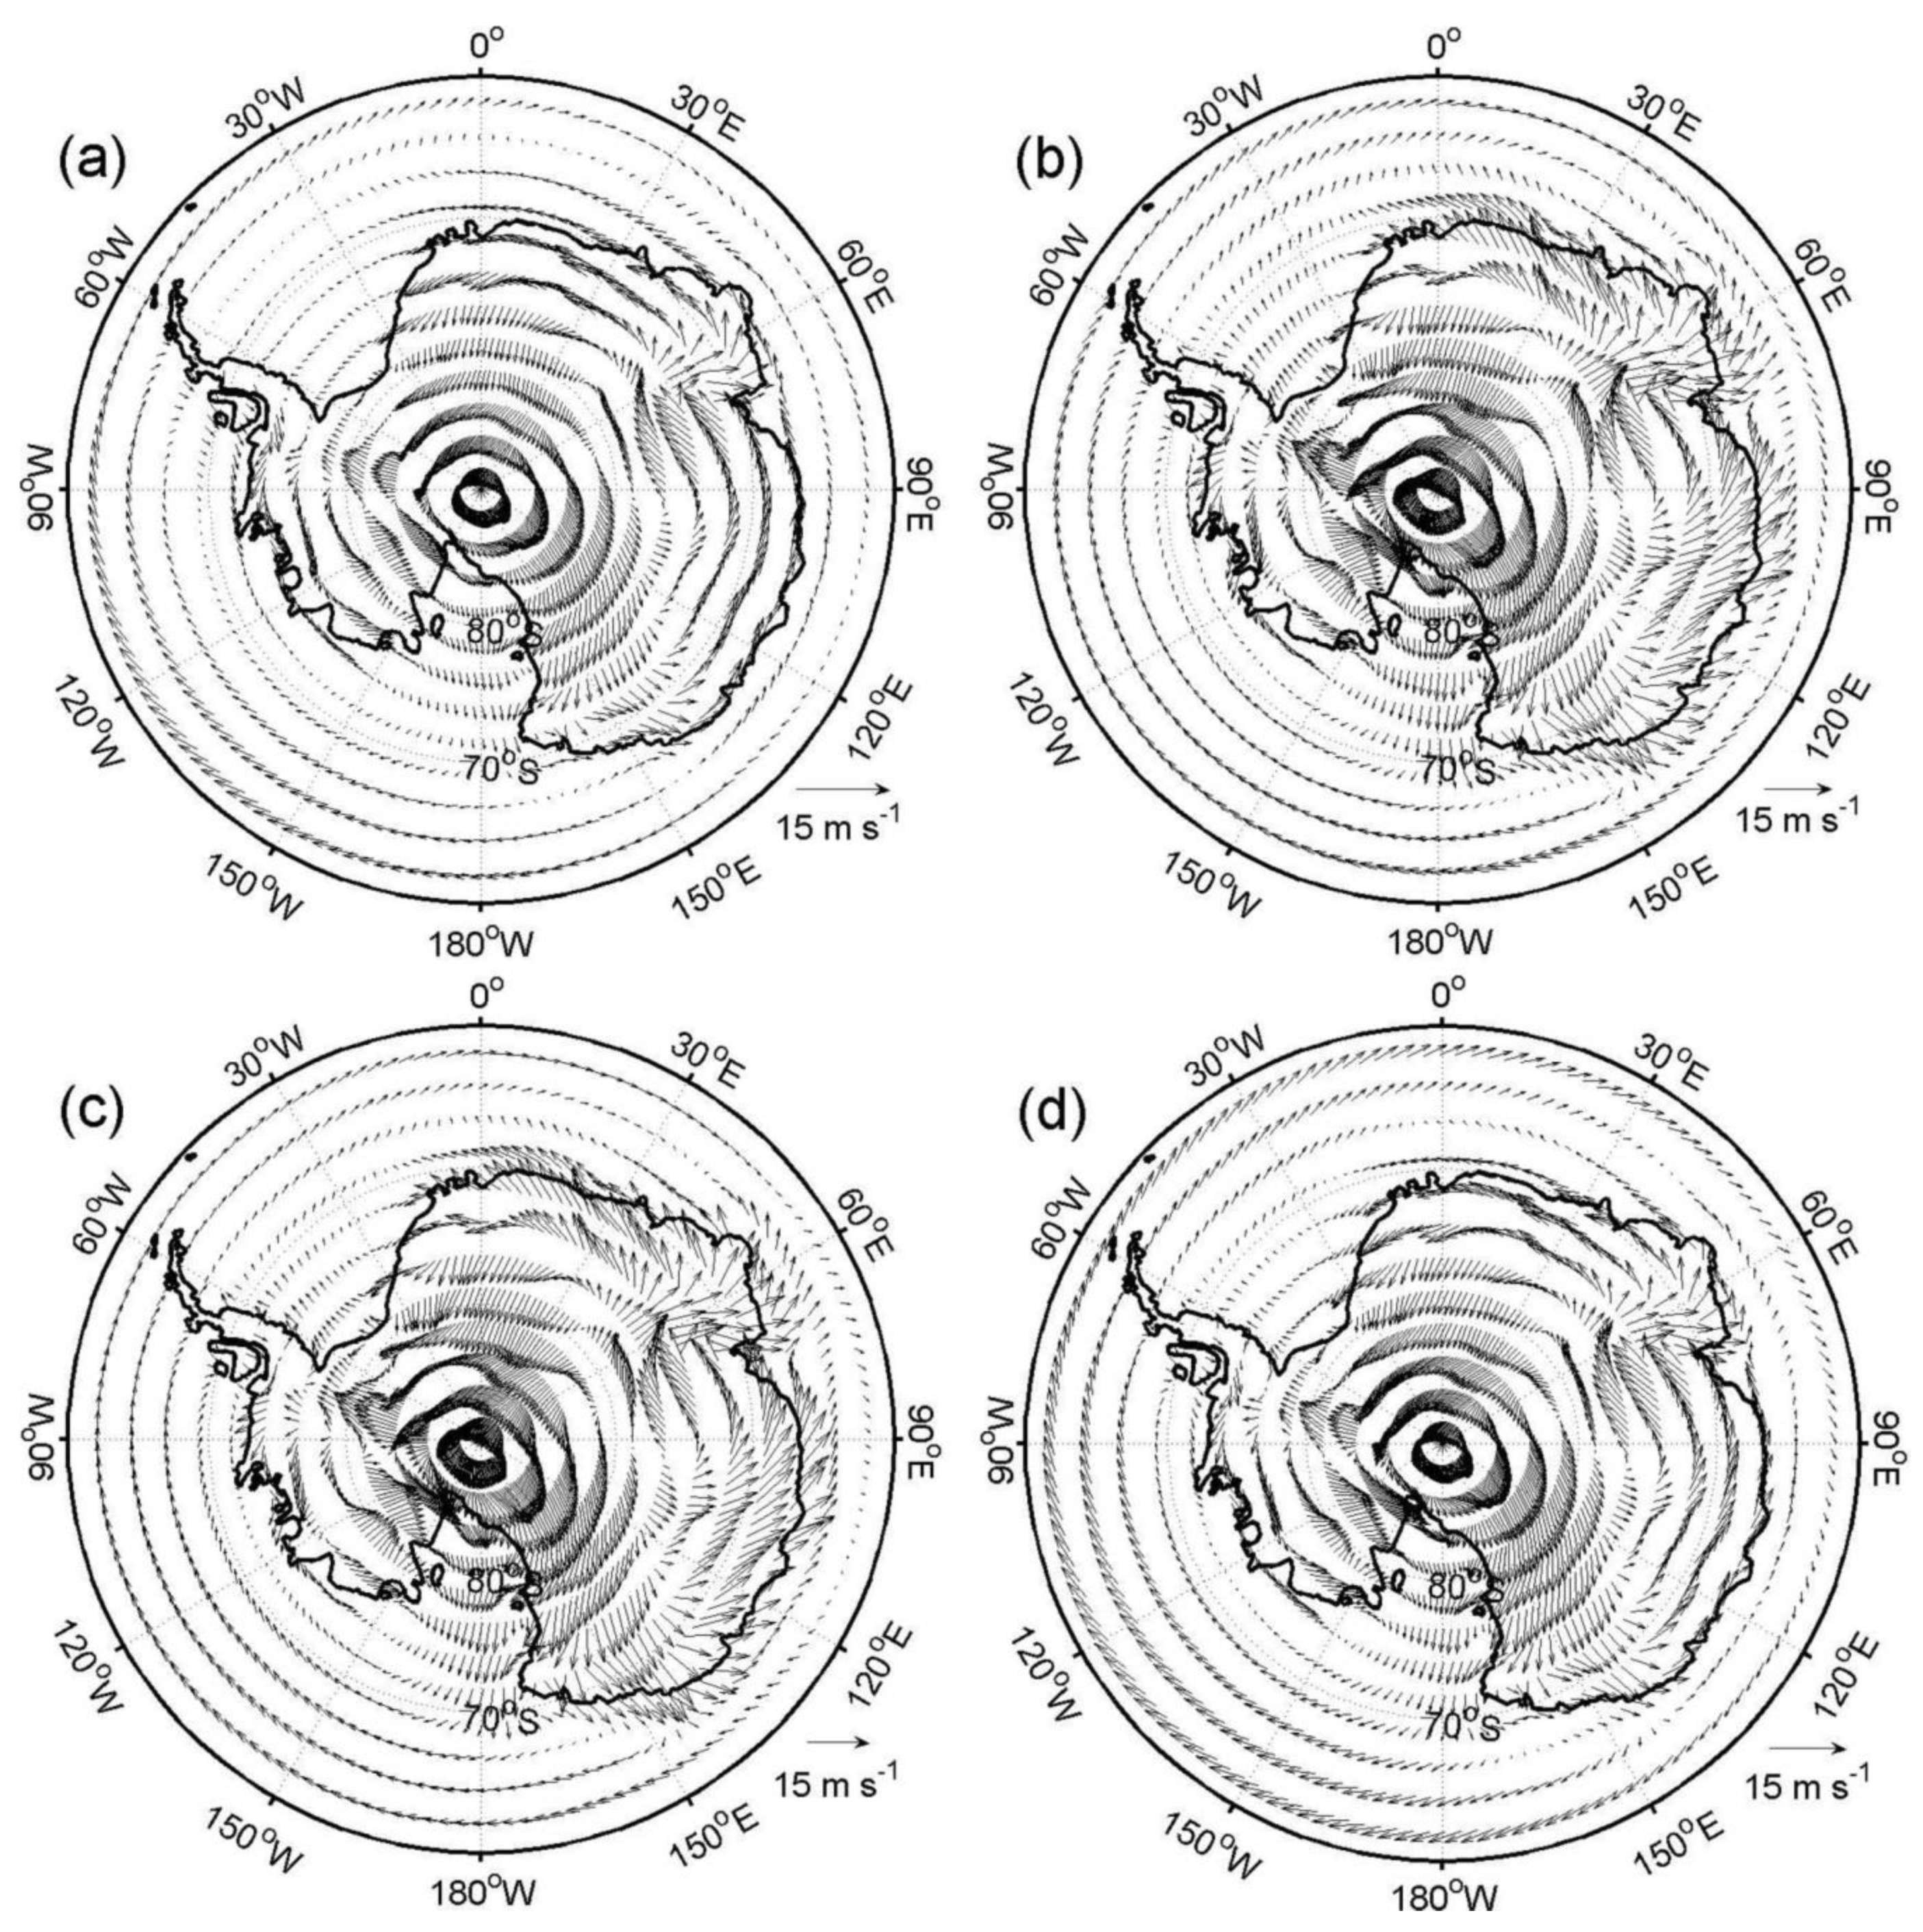
Although regional averaged trends are mostly positive, negative trends occur in some areas as shown by the spatial distribution of the trends in Figure 4. In austral summer, positive trends prevail over the entire domain except for some coastal areas (Figure 4a). Over the oceans, positive trends in wind speeds correspond to negative trends in MSLP (Figure 5a) that help enhance the climatological westerly winds and increase wind speeds (Figure 6a). Over the continent, the anomalous wind fields are generally consistent with the climatological wind fields (Figure 6a), giving rise to the positive trends over land.
In austral autumn, significant negative trends occur over the western Ross Sea and West Antarctica and the opposite occur over the southern Indian Ocean, the Amundsen Sea, and the Bellingshausen Sea. These spatial variations in the wind speed trends may be explained partially by the trends in the MSLP (Figure 5). The spatial patterns of trends resemble the results of Simmonds [53] (Figure 8 in that paper), though their data ranged from 1979 to 2013. The negative trends in MSLP over Wilkes Land and Adelie Terre Land (Figure 5a) produce an anomalous cyclone that weakens the mean katabatic wind over the western Ross Sea (Figure 6b) and leads to negative trends in wind speed there (Figure 4b). Similarly, the negative trends in MSLP over the Bellingshausen Sea and the Amundsen Sea (Figure 5b) produce an anomalous cyclone, strengthening the climatological northerly wind over the Bellingshausen Sea and westerly wind over the Amundsen Sea (Figure 6b) and leading to positive trends in these regions (Figure 4b). The positive trends in wind speed over the southern Indian Ocean are related to the stronger westerly winds induced by lower MSLP there. The negative trends in wind speeds over West Antarctica (Figure 4b) result from the opposite of the trends in wind field to the 38-year mean wind field (Figure 6b).
In austral winter, positive trends in wind speeds extend to the entire East Antarctica and most of the southern Indian and Atlantic Oceans and the Ross Sea (Figure 4c). In contrast, areas with negative trends shrink and only occur over the western coast of the Ross Sea and small patches of the Amundsen Sea (Figure 4c). The increased MSLP over the southern Atlantic Ocean (Figure 5c) generates anomalous westerly winds that are consistent with climatological westerly winds (Figure 6c) and contribute to the positive trends in wind speed in the region (Figure 4c). The same explanation can be applied to the southern Indian Ocean. The positive trends in wind speed over East Antarctica (Figure 4c) are associated with the easterly winds produced by positive trends in MSLP there (Figure 5c). The anticyclone over the Ross Sea produces winds in opposite directions over the eastern Ross Sea and its western coast, resulting in the opposite trends in the two regions (Figure 4c). The trends in seasonal wind speed in austral winter agree with the results of Turner et al. [36] (Table 2 in their paper), though they used observational data for the period 1979–2006. The negative trend in wintertime mean wind speed at McMurdo station [37] is consistent with the trend found here at the same location.
In austral spring, most of Antarctic continent is dominated by positive trends, but the trends are significant only in East Antarctica (Figure 4d) where increased MSLP (Figure 5d) induces an anomalous wind field (Figure 6d) that is consistent with climatological wind field (Figure 6d). The negative trends in wind speed over the western coast of the Ross Sea (Figure 4d) are associated with anomalous northerly winds opposing the climatological southerly winds (Figure 6c). The negative trend in MSLP over the southwestern Pacific Ocean (Figure 4d) generates anomalous easterly winds (Figure 6d), opposing the westerly climatological winds (Figure 6c) and resulting in negative trends in wind speeds there (Figure 4d).
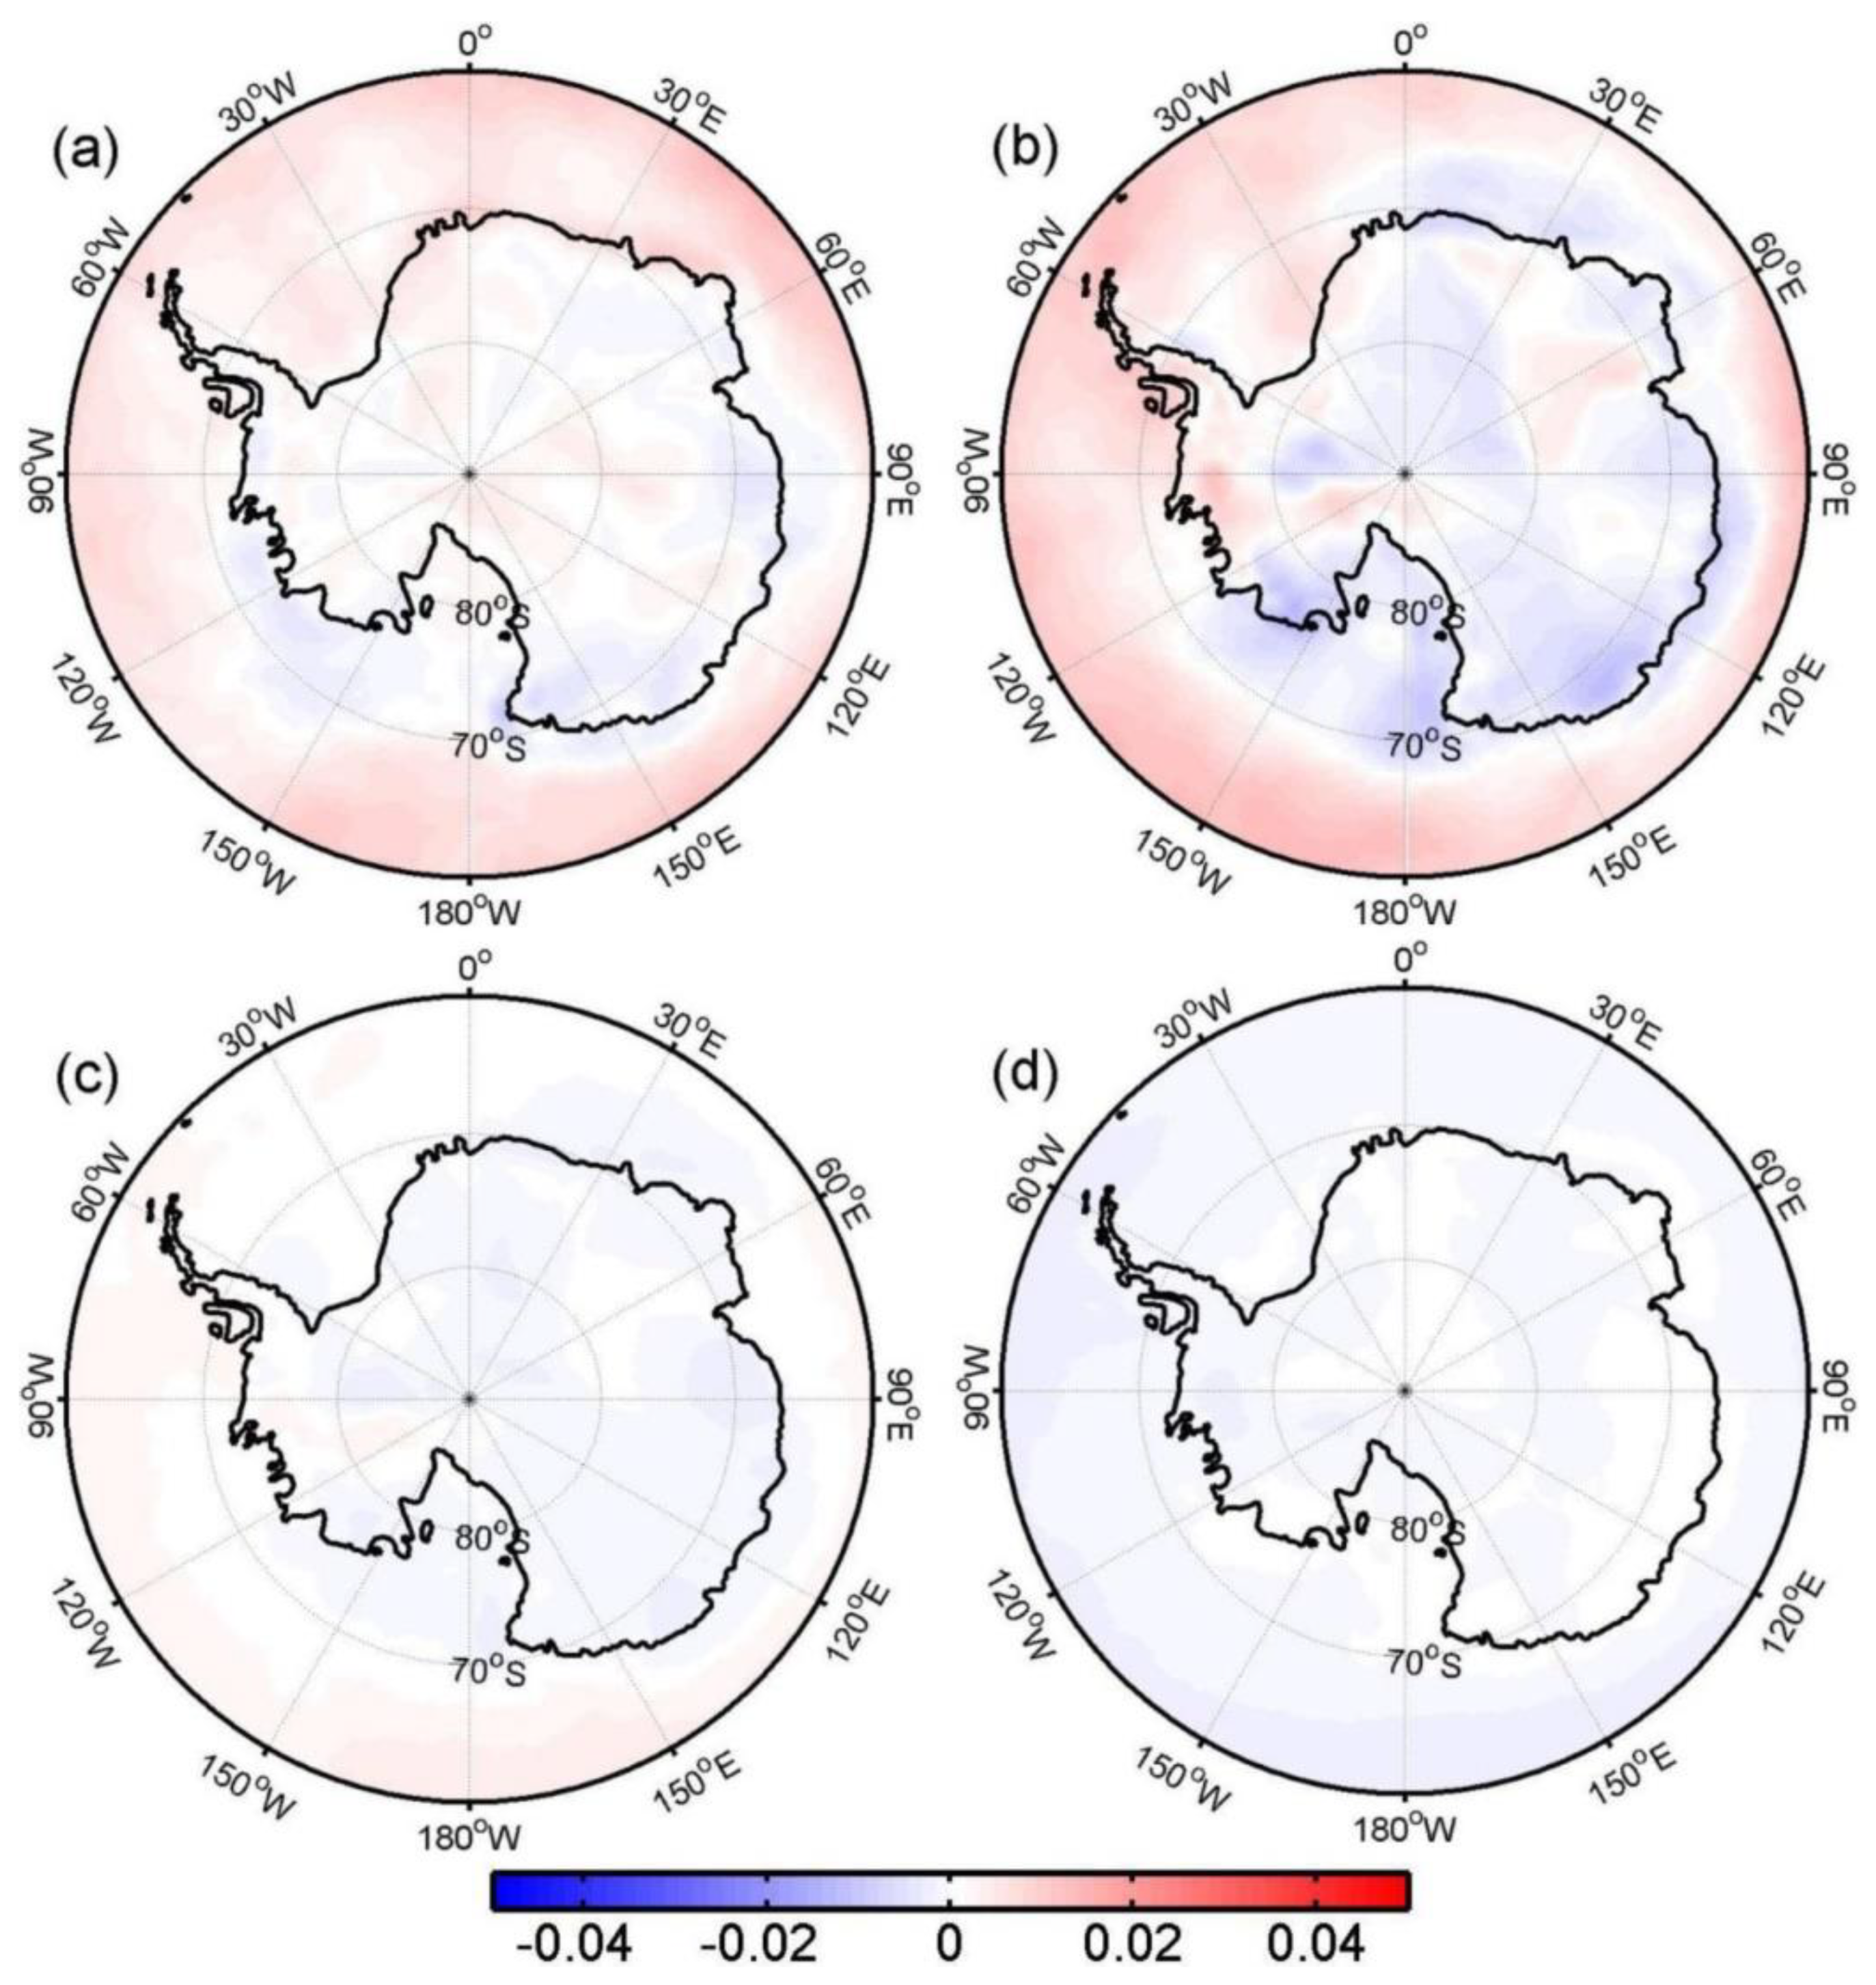
Given the close relationship between the surface wind speed variations and the AAO index as revealed in Table 1, we further examine the contribution of the AAO index to the trends in the seasonal surface wind speeds across the study domain. Following the method used in [45], the trends in wind speeds explained by the seasonal AAO index at each grid point are calculated by the product of the regression of seasonal wind speeds at that grid point onto the seasonal AAO index and the linear trend in the seasonal AAO index, and the results are shown in Figure 7. In general, AAO explains a larger portion of the trend over the Southern Ocean, which results from the impact of the AAO index on the strength of the westerly winds there. The positive phase of the AAO index corresponds to the stronger westerly winds over the Southern Ocean and vice versa. The larger trends in the seasonal AAO index in austral autumn and summer make a greater contribution to the total trends in wind speeds in these seasons. The contributions from the AAO index are small in spring and winter. The negative trends in austral spring over most of the study region result from a negative trend of the AAO index (−0.0038 year−1). The fractions averaged over grid points with significant trends in surface wind speeds explained by the AAO indices are about 19.5% in austral autumn and 16.6% in austral summer, but only 0.4% in austral winter and 0.3% in austral spring.

3.3. SOM Results

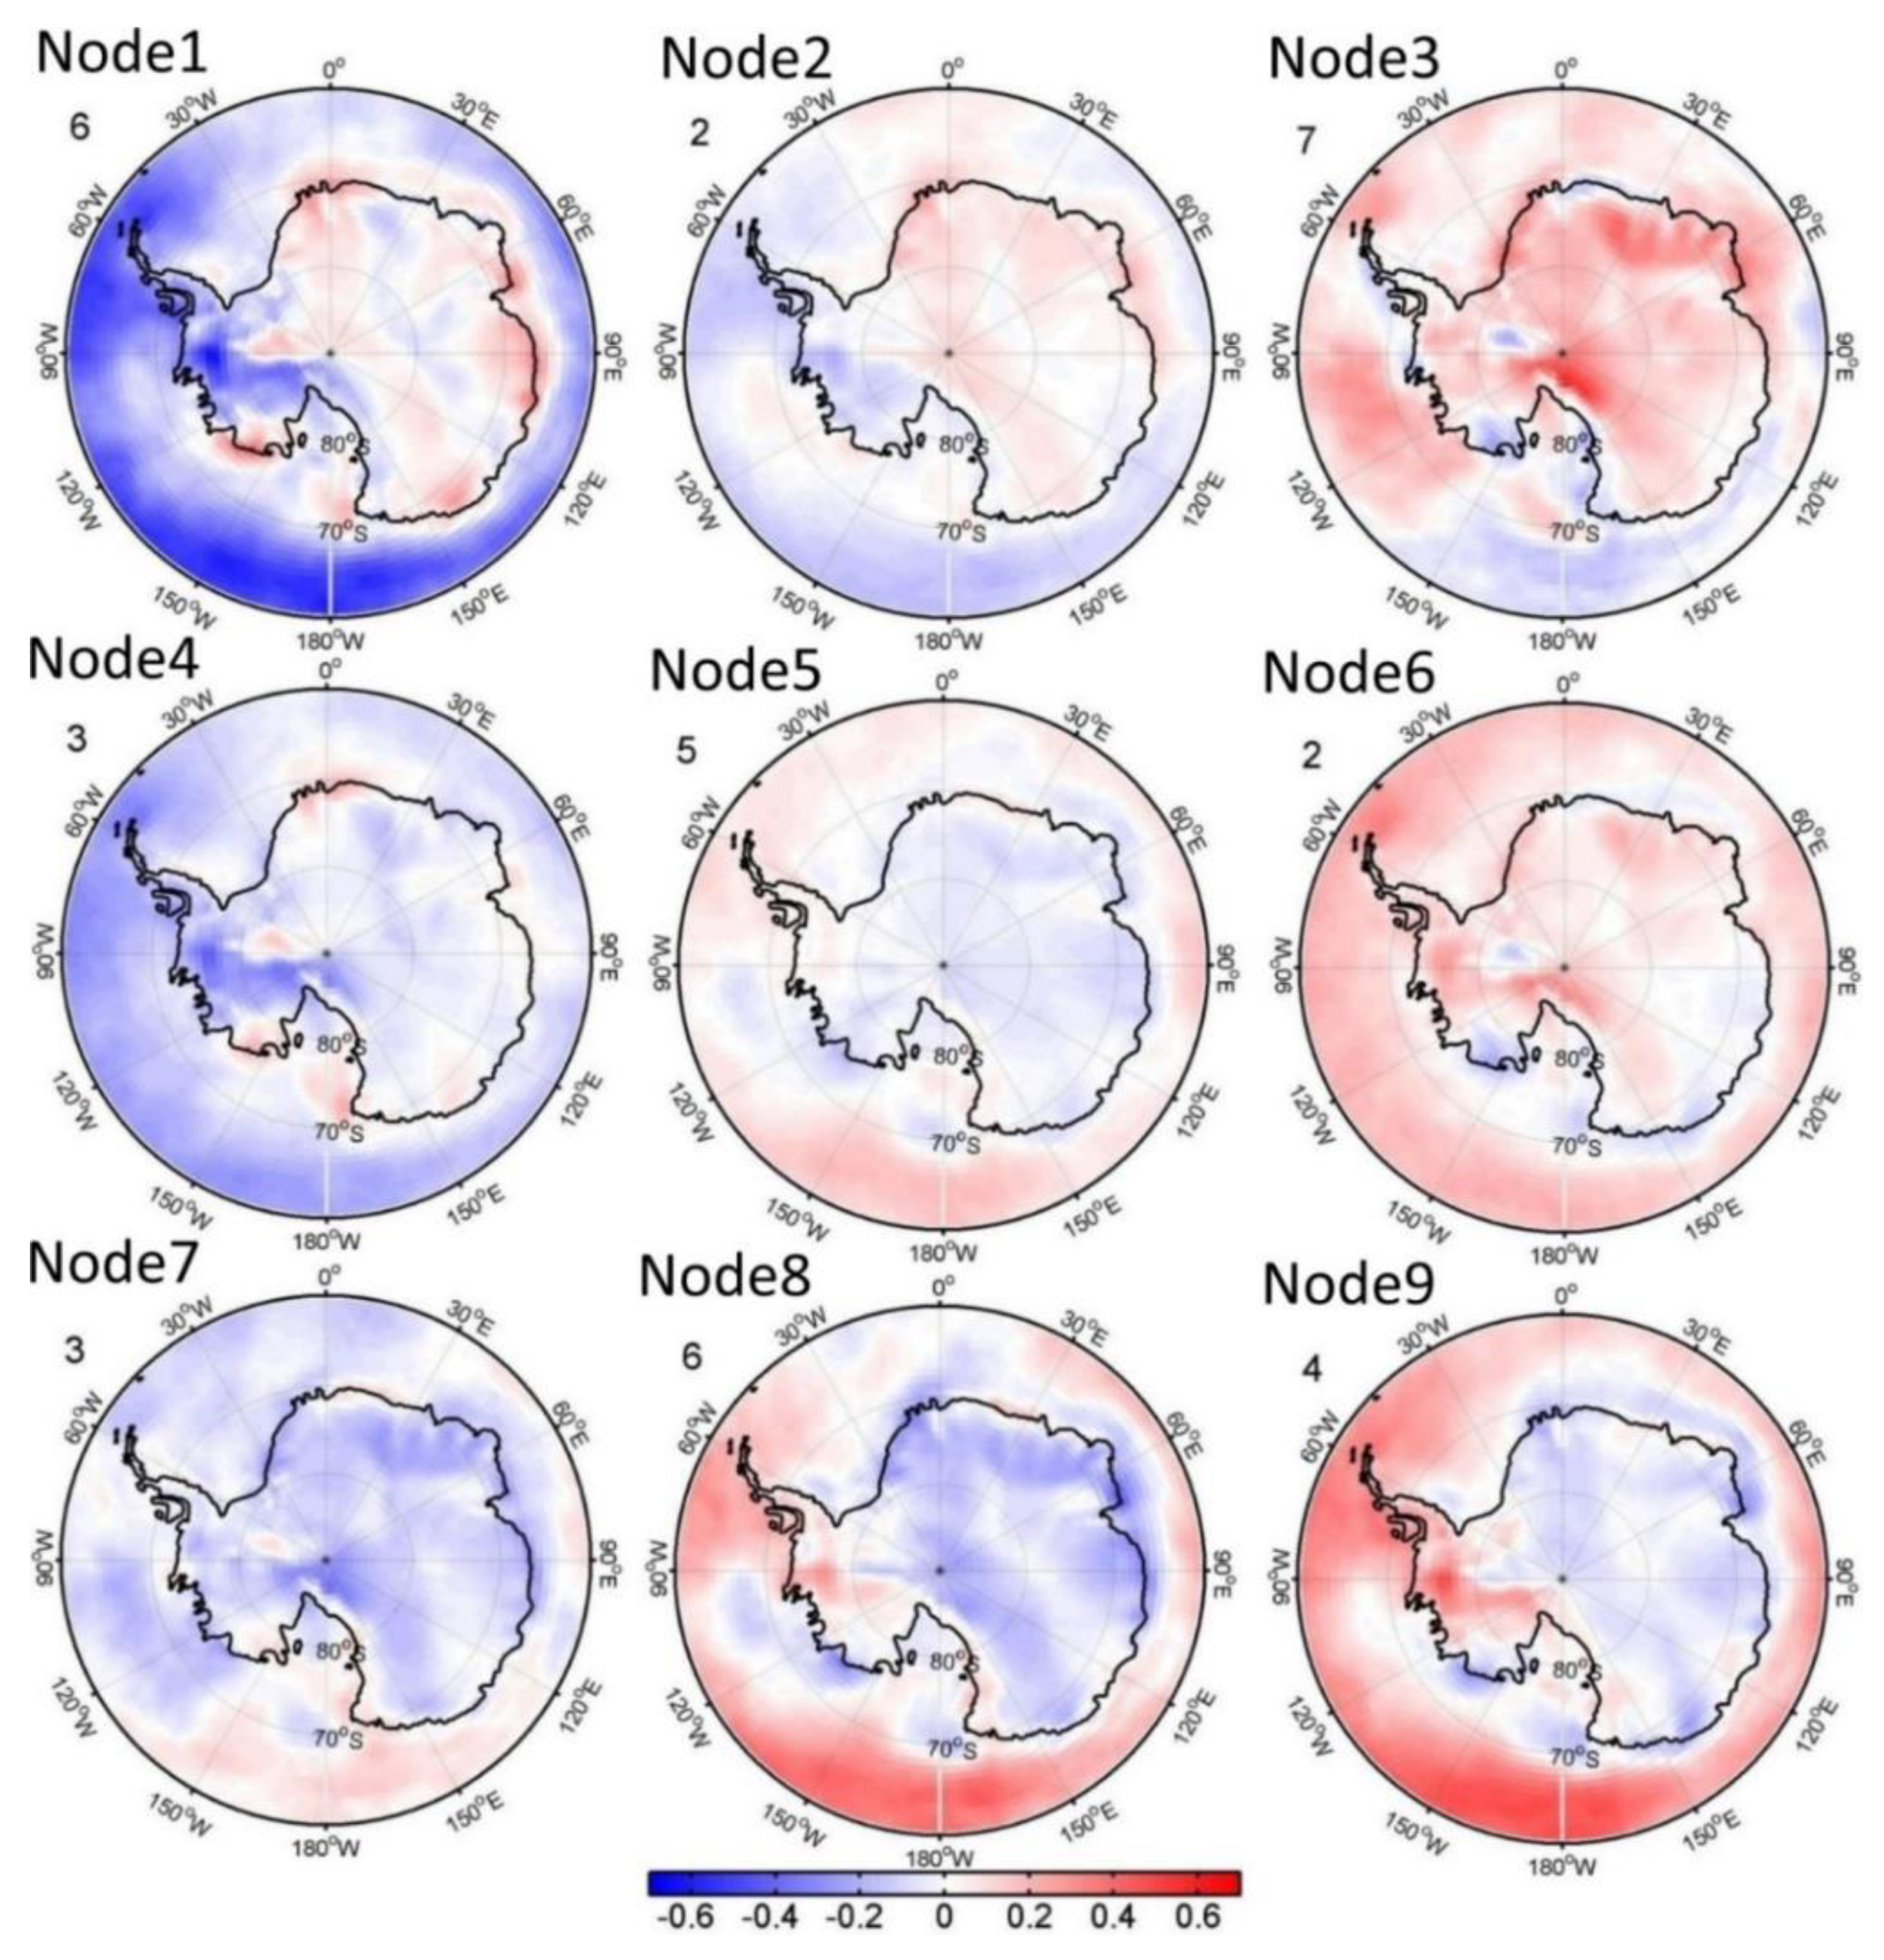
The trends and interannual variability in the surface wind speeds are further examined using the SOM method with a 3 × 3 grid. Similar to the discussion above, the discussion below is organized by seasons. For each season, the spatial pattern and occurrence time series for all 9 SOM nodes are first presented. This is followed by a discussion of trends in the occurrence time series and how much they contribute to the total trends. Finally, an explanation for the results is provided via composite analyses where MSLP and surface wind fields are composited over the time of occurrences of those nodes that make a large contribution to the total trend.
In austral summer, the mirrored pair, Nodes 3 and 7, occur at the same frequency (18.42%, Figure 8), the highest among the nodes, which is followed by another pair, Nodes 1 and 9, also occurring at exactly the same frequency (13.16%). Node 3 (7) is dominated by positive (negative) anomalies everywhere except for the coastal region of eastern East Antarctica and the Bellingshausen Sea. The occurrence time series of these two nodes exhibit significant trends in opposite directions (Table 3), contributing more than 10% to the grid-averaged summer total trend (Table 3). Node 6 also contributes to 8% of the grid-averaged total trend in summer wind speed.
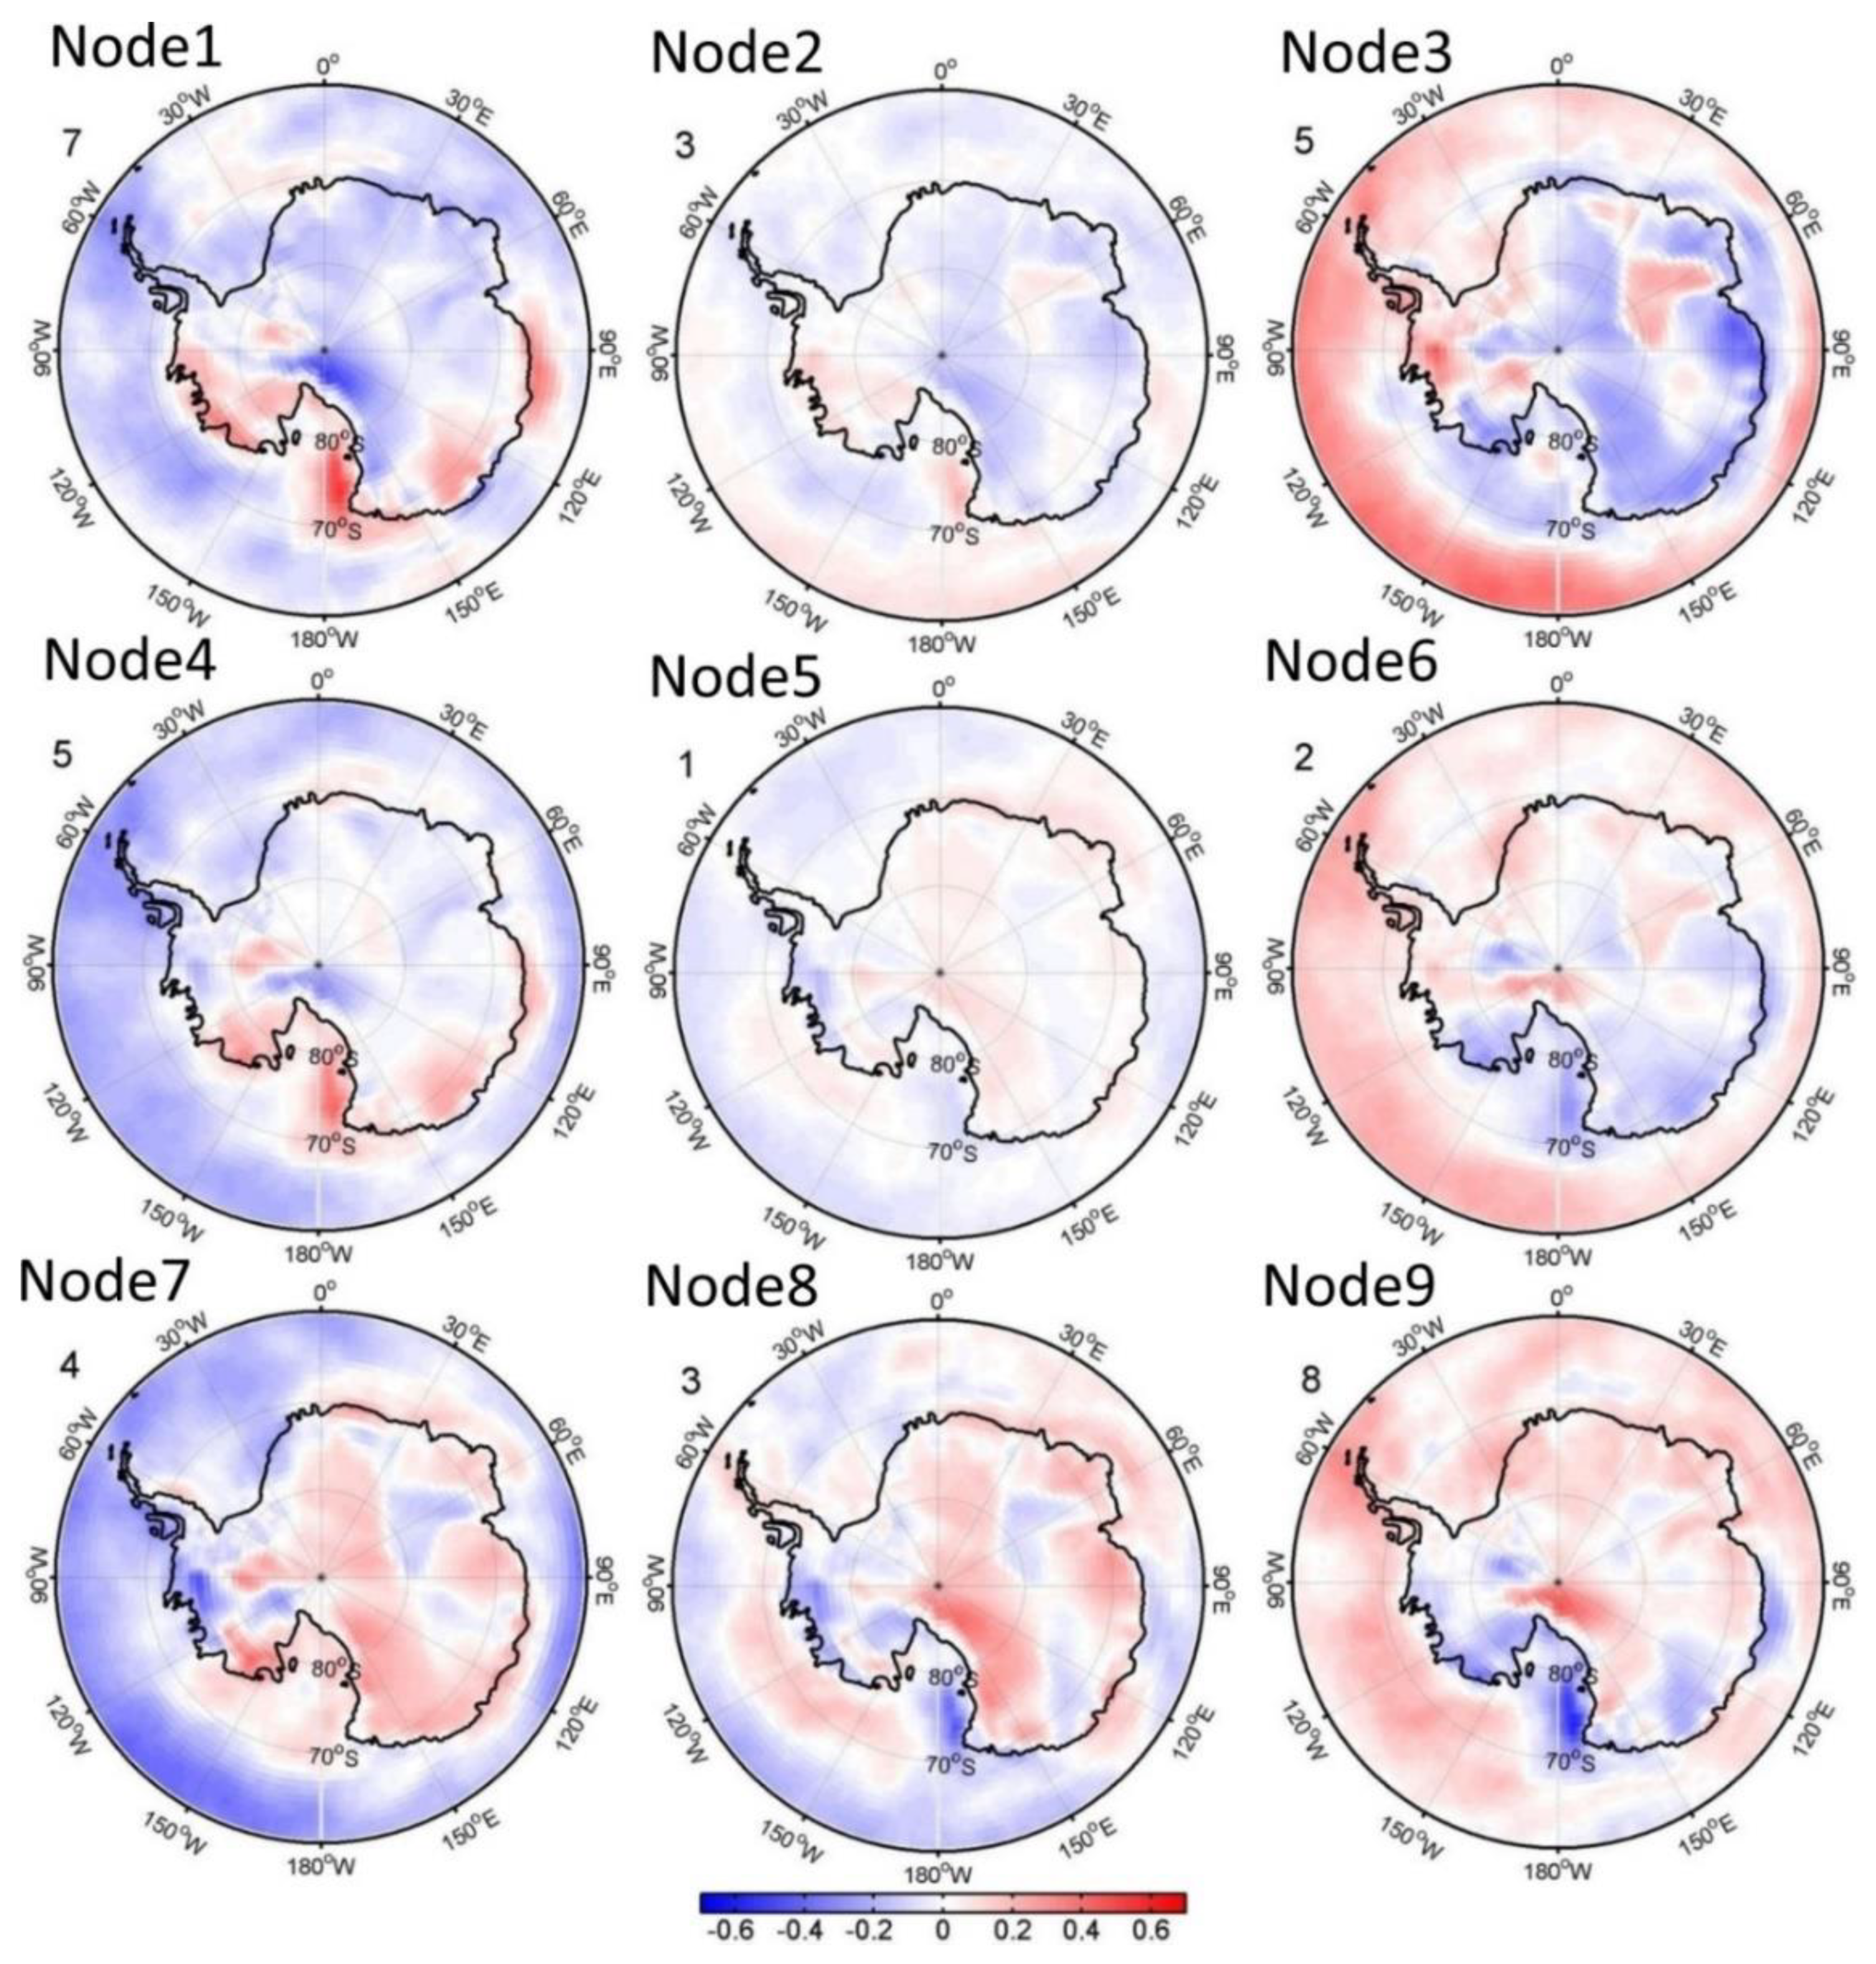
In austral autumn, the highest frequency of occurrences (21.05%) is Node 9 characterized by opposite phase of wind speed variability between the coastal region (90° E–90° W) and the rest of the domain (Figure 9). A reversed pattern is depicted by Node 1 that has the second highest frequency of occurrences (18.42%). The other pair of mirrored-pattern nodes is Nodes 3 (13.16%) and 7 (10.53%), with mostly positive anomalies over the ocean north of 70° S and mostly negative anomalies over land in Node 3 and the opposite in Node 7. Node 4 has the frequency of 13.16% and a spatial pattern similar to that of Node 1 and a mirror image to Node 4 is depicted by Node 6 but at a much lower frequency of 5.26%. Nodes 2 and 8 have identical frequencies of 7.89%, but nearly opposite spatial pattern. Node 5 has the lowest frequency of 2.63%.
Only Nodes 4 and 9 have significant trends in their occurrence time series (Table 3) and it is no surprise that these two nodes make the most contributions to the total wind speed trends for this season (Table 3). The spatial patterns of the trends (not shown) explained by Nodes 4 and 9 are quite similar and they resemble the spatial patterns in the seasonal wind speed trends (Figure 4b). The two nodes explain the same amount (8.2%, Table 3) of the total trends when averaged over the grid points with significant trends in surface wind speeds. No other nodes explain more than 5% of the total trend.
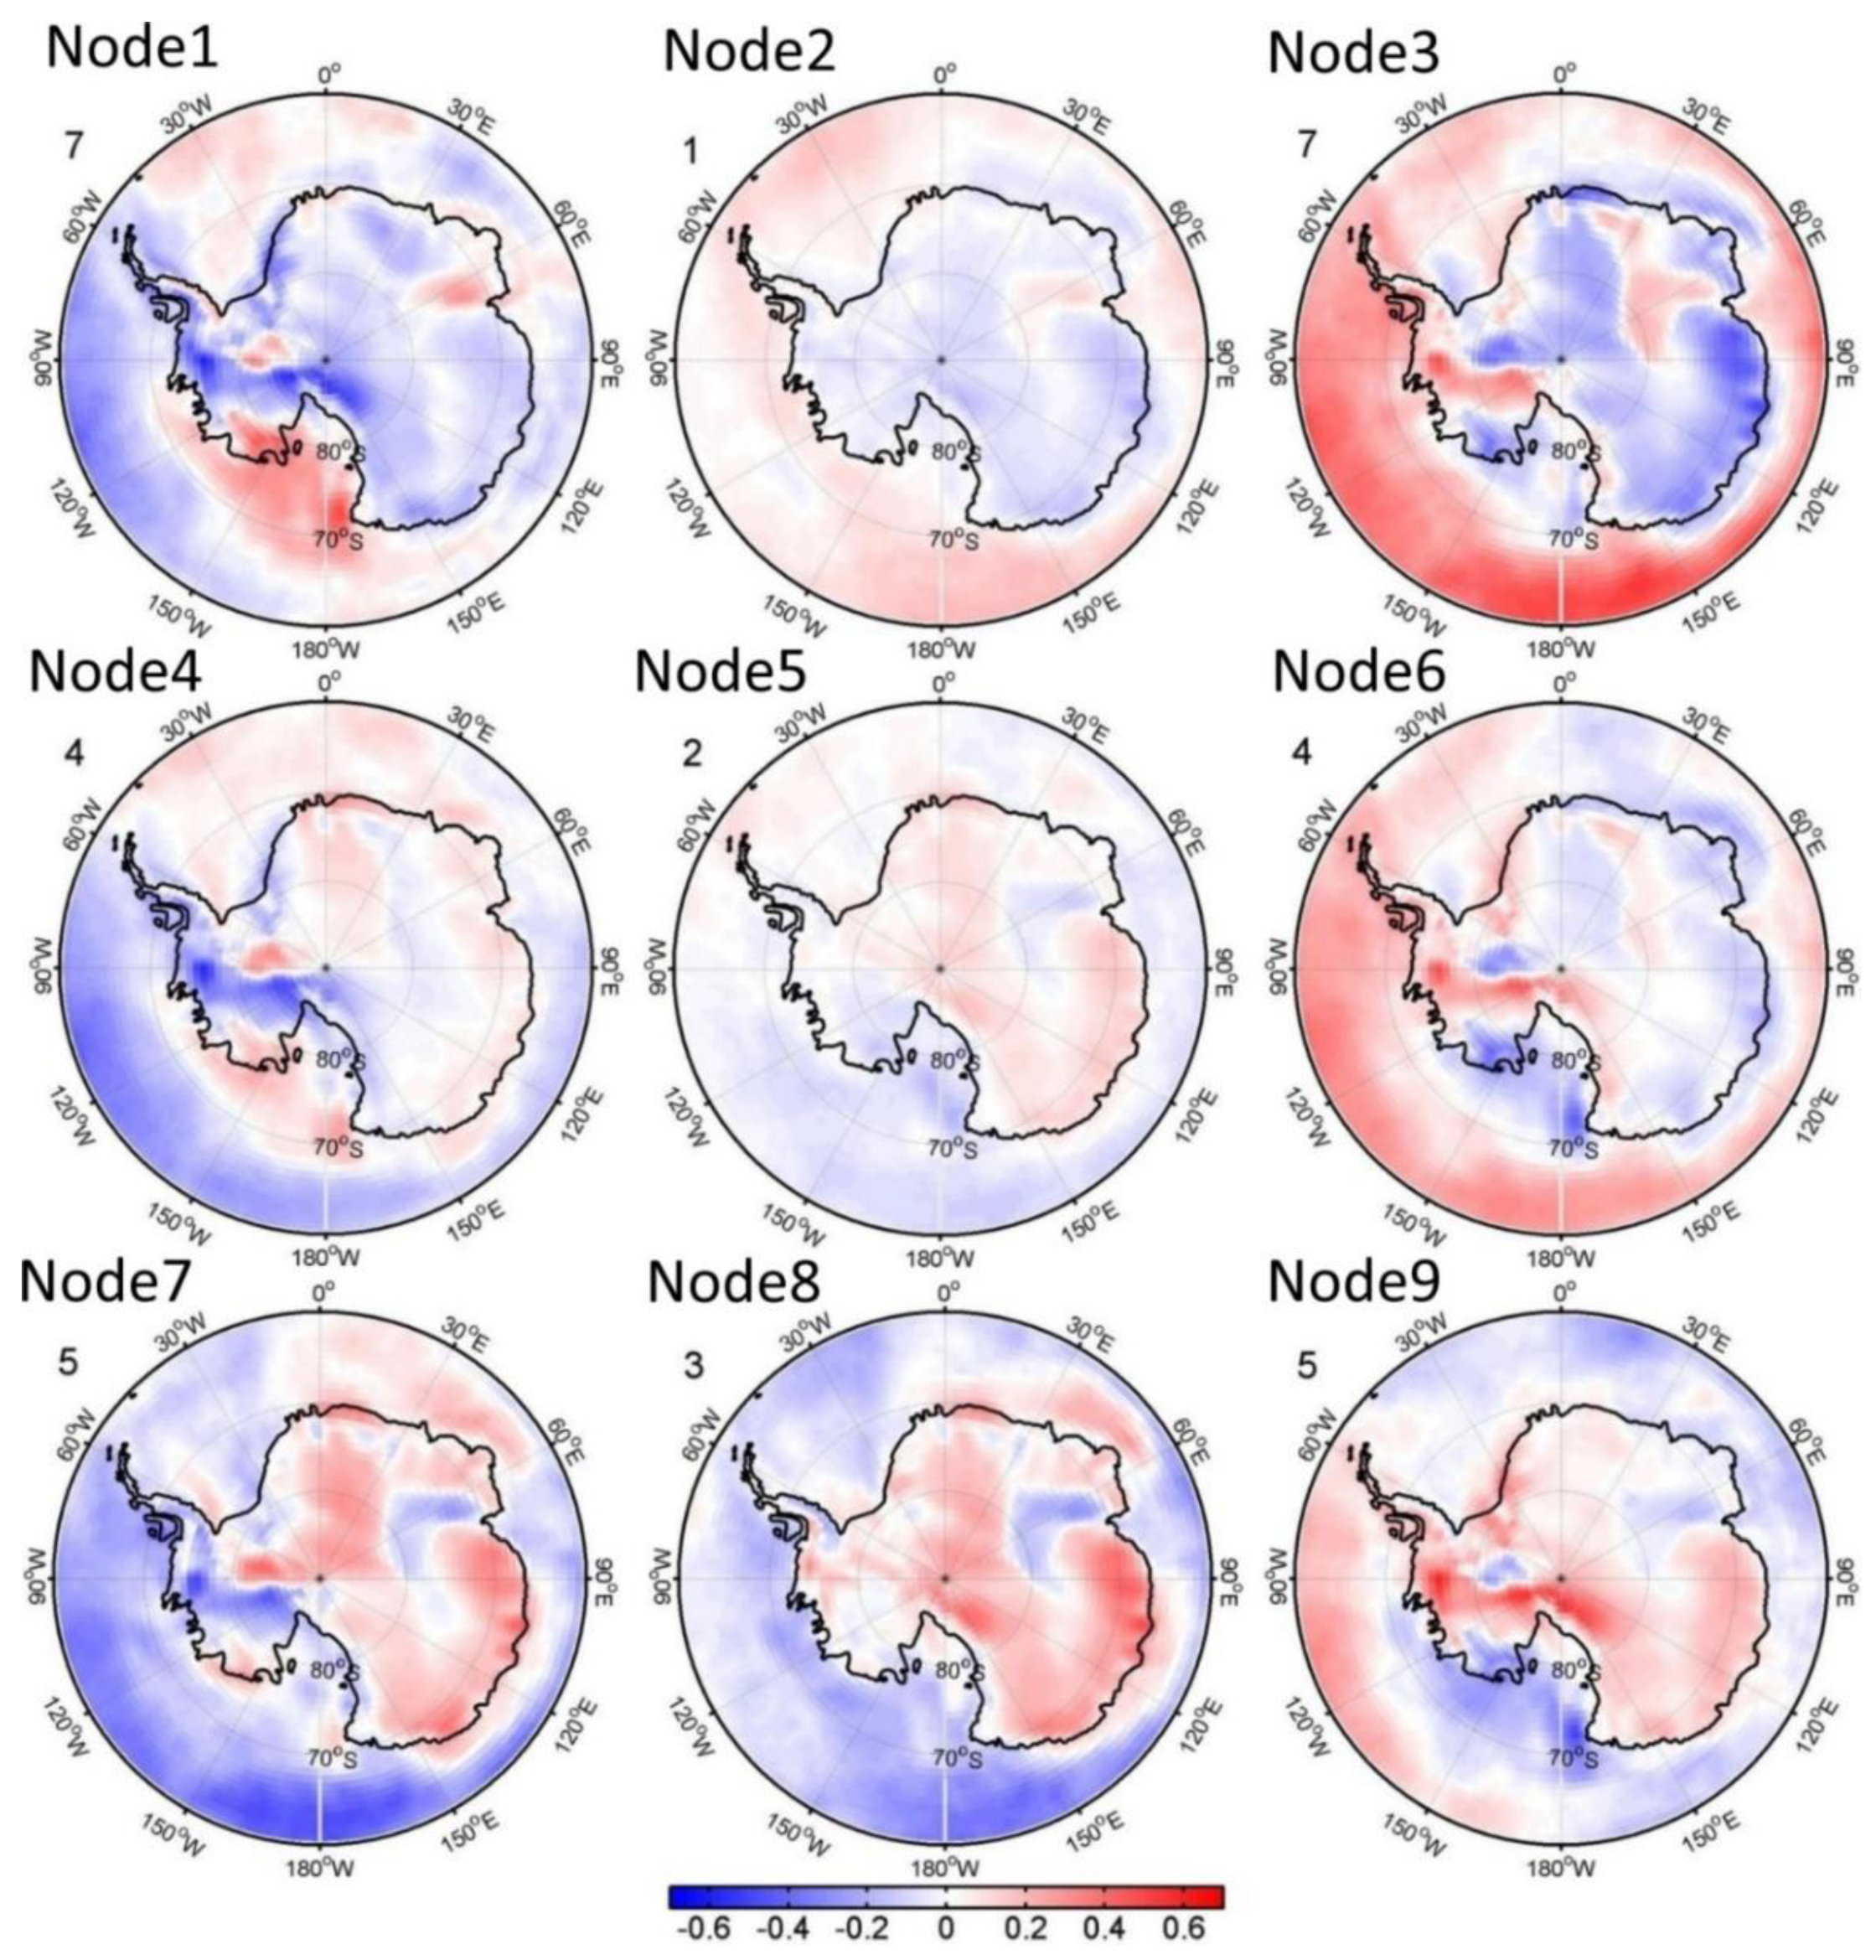
In austral winter (Figure 10), the pairs of mirror images (1–9, 3–7, 4–6, and 2–8) remain the same as those in autumn and the broad spatial features are also similar to autumn. However, the frequency associated with the main patterns is quite different and the details in the spatial distribution also differ. Node 1, occurring at 18.42%, is characterized by positive anomalies over the Weddell, Bellingshausen, and Ross Seas and Mac. Robertson Land and negative anomalies in the rest of the domain, and the opposite is seen in Node 9 but at a lower frequency of 13.16%. The second pair, Nodes 3 and 7, have the same frequencies, 18.42% vs. 13.16%, as Nodes 1 and 9. Node 3 (Node 7) depicts positive (negative) anomalies mainly over the oceans and negative (positive) anomalies over land. Nodes 4 and 6, which have 10.5% of frequency, represent transition states between Node 1 and 7 and between Node 3 and 9, respectively. There is no significant trend in the occurrence time series of all the SOM nodes (Table 3).
In austral spring (Figure 11), Node 3 has the highest frequency of occurrence (18.42%), showing changes in the opposite direction of the southwestern Pacific Ocean from the rest of the study region (Figure 10). A completely reversed pattern is seen in Node 7, however, at a much lower frequency (7.89%). Node 1 (15.79%) depicts an out-of-phase spatial variability between East Antarctica and a part of the Ross Sea and the rest of the study region, which is nearly mirrored by Node 9 (10.53%), Node 8 (15.79%), and Node 5 (13.16%). Node 3, which has the largest trend in the occurrence time series (Table 3), makes the most contribution to the total trend in spring wind speed, explaining 27.9% of grid-averaged trend in wind speed (Table 3). The contributions from Nodes 7 and 8 are more than 8%.
The spatial patterns of seasonal wind speed anomalies can be largely explained by the composites of MSLP and surface wind fields.

3.4. Wind Power Potential

Because there is no established classification scheme for wind power in Antarctica and the Southern Ocean, we adopt the classification of Archer and Jacobson [2]: class 1 (annual mean 10 m wind speed <5.9 m s−1) is unsuitable for the development of wind power; class 2 (5.9 ≤ V < 6.9 m s−1) is considered marginal; and only class 3 (≥6.9 m s−1) or above is suitable for wind power development. We calculated the percentage of the years over the 38-year study period at each grid point that falls into each class. The spatial patterns of the percentage for each class are shown in Figure 12. The regions unsuitable for wind power development (Class 1) include the Antarctic Peninsula, the ice shelves of the Weddell Sea and Ross Sea, Victoria Land, and small patches of interior East Antarctica. The regions falling into Class 2 extend inland from these ice shelves. A large region in the interior of East Antarctic is marginal for the development of wind power. Most of the Southern Ocean and the coastal regions of East Antarctica fall into Class 3 or above. Overall, most of the Antarctic continent is ample in wind energy resources and suitable for the development of wind power with the exception of the Antarctic Peninsula, Ronne and Ross ice shelves, and small patches of the interior of East Antarctica. However, high winds may damage wind turbines. As such, wind turbines have to be closed during the occurrences of high wind speeds exceeding 25 m s−1. Fortunately, despite being the continent of strongest winds, observations at several locations have indicated that the frequency of occurrences of 30-min wind speed of above 25 m s−1 is less than 5% [11].

4. Discussion and Conclusions

In this study, we revisit the annual and interannual variability and trend of surface wind resources over a domain south of 60° S including Antarctica and the Southern Ocean using the gridded ERA-Interim reanalysis data over 1979–2017 and the SOM technique.
Both the mean and interannual standard deviations of daily 10 m wind speeds show a marked annual cycle with a minimum in austral summer and a maximum in austral winter or autumn. The interannual variability of the surface winds is closely related to the AAO index, a climate variability mode for southern high latitude on interannual time scale. Significant positive correlations are found between the AAO index and the wind speeds averaged over the entire Southern Ocean for spring and summer, but reduced to only the southern Atlantic and Pacific Ocean in autumn and winter. Significant negative correlation exists between AAO and winter winds in the East Antarctica continent. AAO also contributes 20% and 17% to the surface wind speed trend in austral autumn and summer, respectively, during the stud period.
The seasonal mean wind speeds averaged over the 38-year study period display a similar spatial pattern, with strong winds over the coastal region of East Antarctica and the Transantarctic Mountains and weak winds over the Ross and Ronne ice shelves and the Antarctic Peninsula. The largest interannual variability, however, is found over the coastal region of West Antarctica and the southern Pacific Ocean.
Trends in seasonal wind speeds vary with season. Significant positive trends occur over most of the Antarctic continent and large regions of the Southern Ocean in austral summer, and in spring, the positive trends retreat to only East Antarctica while negative trends are seen over the southwestern Pacific Ocean. In austral autumn and winter, positive trends are distributed in some areas of the Southern Ocean and small areas inland, and negative trends develop over the Ross Sea and adjacent coastal regions and small areas of West Antarctica. These trends in the seasonal surface winds can be explained, at least partially, by the anomalous wind fields associated with the MSLP anomalies for each season.
The SOM and composite analyses entail the main modes influencing the trends in seasonal wind speeds. The two nodes related to the autumn AAO explain 16.4% of the autumn wind speed trends. Only 8% of the total spring wind speed trends is explained by the node (Node 8) related to positive phase AAO, while 28% of the trends is explained by a node (Node 3) associated with positive MSLP anomalies across most of study domain. The opposite spatial pattern of MSLP related to two nodes (Nodes 3 and 7) contributes to 25% of trends in summer wind speed, which exceeds 17% of the direct contributions from summer AAO. No SOM nodes make more than 2% contribution to winter wind speed trends.
Previous studies on global wind potential [7] identified the Antarctica continent as ample in wind energy resources. The current analyses of surface wind speeds have reinforced this finding by showing that except for the Antarctic Peninsula and Ronne and Ross ice shelves and some areas in East Antarctica, the majority of the Antarctica continent falls into Class 3 and above and, thus, are suitable for wind energy development. However, it may not be feasible to fully utilize the ample wind resources in the Antarctica continent except for localized wind turbine installations because of the extremely harsh environment. According to an overview of cold climate and wind energy [54], there are some serious challenges facing wind energy development in cold climate regions like Antarctica [55,56], including, but not limited to, (1) ice accretion and snow accumulation on rotor blades, reducing energy yield and accelerating fatigue; (2) potential of ice throw posing risk to human safety; (3) extremely cold temperature below the standard design range (usually −20 °C) posing challenges to materials and equipment; (4) limited access and safety of maintenance personnel; and in the case of Antarctica, (5) extreme wind guests associated with strong katabatic flows posing significant threat to wind turbine and infrastructure. Nevertheless, as the vast wind energy resources in cold climate are gaining increased attention, manufacturers are building turbines with better equipment to handle harsh winter conditions with de-icing mechanisms and extended temperature range, and so forth. Thus, development of wind energy in some regions of Antarctica may no longer be impractical in the near future.
A major caveat of using gridded global reanalysis data is the relatively coarse grid resolution that is unable to resolve steep slopes such as those in coastal regions of East Antarctica. The consequence of overall smoothed terrain is a reduction of terrain-induced wind speeds such as the katabatic winds in coastal East Antarctica as well as barrier winds over the western Weddell and Ross Seas [57,58]. The smoothed temperature gradients may also result in an underestimate of the strengths of sea and land breezes [59].
In addition, some results from the analyses are not fully understood. For example, the trends in summer AAO index cannot fully explain the trends in summer wind speed related to Nodes 3 and 7. The question is, what other factors, besides AAO, may influence surface wind trends? Previous studies have associated the change in Antarctic wind speed with the other climate modes, including the semiannual oscillation (SAO) and the Antarctic circumpolar wave (ACW) [60], nonannular component of the AAO [61], and the teleconnection mode related to El Niño–Southern Oscillation (ENSO), the Indian Ocean Dipole (IOD), and the AAO [62]. In this study, we only investigate seasonal mean wind speed. The climatology and trends of strong wind events require further study. Despite these limitations, the results of Antarctic surface wind fields and variability can provide some useful suggestions for the renewable energy industry and policy makers.

Author Contributions

L.Y. designed the research, analyzed the data, and wrote the first draft of the paper. S.Z. and B.S. revised the first draft and provided useful insights during various stages of the work. L.Y., S.Z. and B.S. reviewed the manuscript. All authors have read and agreed to the published version of the manuscript.

Funding

The authors thank ECMWF for producing ERA-Interim data. This research is supported by National Key R&D Program of China (No. 2018YFA0605701), the National Natural Science Foundation of China (No. 41941009 and 41941006), and Shanghai Pujiang Program (No. 17PJ1409800).

Conflicts of Interest

The authors declare no conflict of interest.

References

  1. Czisch, G.; Ernst, B. High Wind Power Penetration by the Systematic Use of Smoothing Effects within Huge Catchment Areas Shown in a European Example. In Wind Power 2001; American Wind Energy Association: Washington, DC, USA, 2001. [Google Scholar]
  2. Archer, C.L.; Jacobson, M.Z. Spatial and temporal distributions of U.S. winds and wind power at 80 m derived from measurements. J. Geophys. Res. 2003, 108, 4289. [Google Scholar] [CrossRef]
  3. McVicar, T.R.; Van Niel, T.G.; Li, M.L.; Roderick, M.L.; Rayner, D.P.; Ricciardulli, L.; Donohue, R.J. Wind speed climatology and trends for Australia, 1975–2008: Capturing the stilling phenomenon and comparison with near-surface reanalysis output. Geophys. Res. Lett. 2008, 35, L20403. [Google Scholar] [CrossRef] [Green Version]
  4. Madhu, S.; Payal, S. A review of wind energy scenario in India. Int. Res. J. Environ. Sci. 2014, 3, 87–92. [Google Scholar]
  5. Yu, L.; Zhong, S.; Bian, X.; Heilman, W.E. Climatology and trend of wind power resources in China and its surrounding regions: A revisit using Climate Forecast System Reanalysis data. Int. J. Climatol. 2016, 36, 2173–2188. [Google Scholar] [CrossRef]
  6. Yu, L.; Zhong, S.; Zhou, M.; Sun, B.; Lenschow, D.H. Antarctic summer sea ice trend in the context of high-latitude atmospheric circulation changes. J. Clim. 2018, 31, 3909–3920. [Google Scholar] [CrossRef]
  7. Lu, X.; McElroy, M.B.; Kiviluoma, J. Global potential for wind-generated electricity. Proc. Natl. Acad. Sci. USA 2009, 106, 10933–10938. [Google Scholar] [CrossRef] [Green Version]
  8. Capps, S.B.; Zender, C.S. Estimated global ocean wind power potential from QuikSCAT observations, accounting for turbine characteristics and sitting. J. Geophys. Res. 2010, 115, D09101. [Google Scholar] [CrossRef] [Green Version]
  9. Zheng, C.W.; Pan, J. Assessment of the global ocean wind energy resource. Renew. Sustain. Energy Rev. 2014, 33, 382–391. [Google Scholar] [CrossRef]
  10. King, J.C.; Turner, J. Antarctic Meteorology and Climatology, 1st ed.; Cambridge University Press: Cambridge, UK, 1997; 409p. [Google Scholar]
  11. Guichard, A.; Magill, P.; Godon, P.; Lyons, D.; Brown, C. Potential for significant wind power generation at Antarctic stations. In Proceedings of the Seventh Symposium on Antarctic and Logistics Operation (SCALOP), Cambridge, UK, 6–7 August 1996. [Google Scholar]
  12. Ramesh, M.P. Wind Energy Applications in Indian Antarctic Station Maitri, Antarctica. In Sixteenth Indian Expedition to Antarctica; Scientific Report; Technical Publication No. 14; Department of Ocean Development: New Delhi, India, 2000; pp. 1–36. [Google Scholar]
  13. Teetz, H.W.; Harms, T.M.; von Backström, T.W. Assessment of the wind power potential at SANAE IV base, Antarctica: A technical and economic feasibility study. Renew. Energy 2003, 28, 2037–2061. [Google Scholar] [CrossRef]
  14. Lindquist, A. Wind Power in Antarctica-a Feasibility Study for Wasa. Master’s Thesis, Royal Swedish Academy of Sciences, Stockholm, Sweden, 2004. [Google Scholar]
  15. Rodrigo, J.S.; van Beeck, J.; Gorle, C.; Berte, J.; Dewilde, L.; Cabooter, Y.; Pattyn, F. Wind power in the future Belgian Antarctic research station. In Proceedings of the European Wind Energy Conference and Exhibition, Athens, Greece, 27 February 2006. [Google Scholar]
  16. Mather, K.B.; Miller, J.S. Wind drainage off the high plateau of eastern Antarctica. Nature 1966, 209, 281–284. [Google Scholar] [CrossRef]
  17. Parish, T.R. Surface airflow over East Antarctica. Mon. Weather Rev. 1982, 110, 84–90. [Google Scholar] [CrossRef] [Green Version]
  18. Parish, T.R.; Bromwich, D.H. The inversion wind pattern over West Antarctica. Mon. Weather Rev. 1986, 114, 849–860. [Google Scholar] [CrossRef] [Green Version]
  19. Parish, T.R.; Bromwich, D.H. The surface wind field over the Antarctic ice sheet. Nature 1987, 328, 51–54. [Google Scholar] [CrossRef]
  20. Parish, T.R.; Waight, K.T. The forcing of Antarctic katabatic winds. Mon. Weather Rev. 1987, 115, 2214–2226. [Google Scholar] [CrossRef] [Green Version]
  21. Gallée, J.; Schayes, G. Development of a three-dimensional Meso-γ primitive equation model: Katabatic winds simulation in the area of Terra Nova Bay, Antarctica. Mon. Weather Rev. 1994, 122, 671–685. [Google Scholar] [CrossRef] [Green Version]
  22. Van Lipzig, N.P.M.; van Meijgaard, E.; Oerlemans, J. Evaluation of a regional atmospheric model using measurements of surface heat exchange processes from a site in Antarctica. Mon. Weather Rev. 1994, 127, 11994–12011. [Google Scholar] [CrossRef]
  23. Hines, K.M.; Bromwich, D.H.; Parish, T.R. A mesoscale modeling study of the atmospheric circulation of high southern latitudes. Mon. Weather Rev. 1995, 123, 1146–1165. [Google Scholar] [CrossRef] [Green Version]
  24. Heinemann, G. Idealized simulations of the Antarctic katabatic wind system with a three-dimensional mesoscale model. J. Geophys. Res. 1997, 102, 13825–13834. [Google Scholar] [CrossRef]
  25. Bromwich, D.H.; Cassano, J.J.; Klein, T.; Heinemann, G.; Hines, K.M.; Steffen, K.; Box, J.E. Mesoscale modeling of katabatic winds over Greenland with the Polar MM5. Mon. Weather Rev. 2001, 129, 2290–2309. [Google Scholar] [CrossRef]
  26. Powers, J.G.; Monaghan, A.J.; Cayette, A.M.; Bromwich, D.H.; Kuo, Y.-H.; Manning, K.W. Real-time mesoscale modeling over Antarctica: The Antarctic mesoscale prediction system. Bull. Am. Meteorol. Soc. 2003, 84, 1533–1545. [Google Scholar] [CrossRef]
  27. Rodrigo, J.S.; Buchlin, J.M.; van Beeck, J.; Lenaerts, J.T.M.; van den Broeke, M.R. Evaluation of the Antarctic surface wind climate from ERA reanalyses and RACMO2/ANT simulations based on automatic weather stations. Clim. Dyn. 2013, 40, 353–376. [Google Scholar] [CrossRef]
  28. Bintanja, R.; Severijns, C.; Haarsma, R.; Hazeleger, W. The future of Antarctica’s surface winds simulated by a high-resolution global climate model: I. Model description and validation. J. Geophys. Res. 2014, 119, 7136–7159. [Google Scholar] [CrossRef]
  29. Parish, T.R. Surface winds over the Antarctic continent: A review. Rev. Geophys. 1988, 26, 169–180. [Google Scholar] [CrossRef]
  30. Van den Broeke, M.R.; van Lipzig, N.P.M. Factors controlling the near-surface wind field in Antarctica. Mon. Weather Rev. 2003, 131, 733–743. [Google Scholar] [CrossRef]
  31. Parish, T.R.; Cassano, J.J. Diagnosis of the katabatic wind influence on the wintertime antarctic surface wind field from numerical simulations. Mon. Weather Rev. 2003, 131, 1128–1139. [Google Scholar] [CrossRef]
  32. Yasunari, T.; Kodama, S. Intraseasonal variability of katabatic wind over East Antarctica and planetary flow regime in the Southern Hemisphere. J. Geophys. Res. 1993, 98, 13063–13070. [Google Scholar] [CrossRef]
  33. Simmonds, I.; Law, R. Associations between Antarctic katabatic flow and the upper level winter vortex. Int. J. Climatol. 1995, 15, 403–421. [Google Scholar] [CrossRef]
  34. Parish, T.R.; Bromwich, D.H. Reexamination of the near-surface airflow over the Antarctic continent and implications on atmospheric circulations at high southern latitudes. Mon. Weather Rev. 2007, 135, 1961–1973. [Google Scholar] [CrossRef]
  35. Turner, J.; Colwell, S.R.; Marshall, G.J.; Lachlan-Cope, T.; Carleton, A.M.; Jones, P.D.; Lagun, V.E.; Reid, P.A.; Iagovkina, S. Antarctic climate change during the last 50 years. Int. J. Climatol. 2005, 25, 279–294. [Google Scholar] [CrossRef]
  36. Turner, J.; Chenoli, S.N.; Samah, A.A.; Marshall, G.; Philips, T.; Orr, A. Strong wind events in the Antarctic. J. Geophys. Res. 2009, 114, D18103. [Google Scholar] [CrossRef] [Green Version]
  37. Chenoli, S.N.; Turner, J.; Samah, A.A. A climatology of strong wind events at McMurdo station, Antarctica. Int. J. Climatol. 2013, 33, 2667–2681. [Google Scholar] [CrossRef] [Green Version]
  38. Dee, D.P.; Uppala, S.M.; Simmons, A.J.; Berrisford, P.; Poli, P.; Kobayashi, S.; Andrae, U.; Balmaseda, M.A.; Balsamo, G.; Bauer, P.; et al. The ERA-Interim reanalysis: Configuration and performance of the data assimilation system. Q. J. R. Meteorol. Soc. 2011, 137, 553–597. [Google Scholar] [CrossRef]
  39. Bromwich, D.H.; Nicolas, J.P.; Monaghan, A.J. An assessment of precipitation changes over Antarctica and the Southern Ocean since 1989 in contemporary global reanalyses. J. Clim. 2011, 24, 4189–4209. [Google Scholar] [CrossRef] [Green Version]
  40. Klöwer, M.; Jung, T.; König-Langlo, G.; Semmler, T. Aspects of weather parameters at Neumayer station, Antarctica, and their representation in reanalysis and climate model data. Meteorol. Z. 2013, 22, 699–709. [Google Scholar] [CrossRef] [Green Version]
  41. Kohonen, T. Self-Organizing Maps; Springer: Berlin/Heidelberg, Germany, 2001; 501p. [Google Scholar]
  42. Sammon, J.W. A non-linear mapping for data structure analysis. IEEE Trans. Comput. 1969, 18, 401–409. [Google Scholar] [CrossRef]
  43. Reusch, D.B.; Alley, R.B.; Hewitson, B.C. Relative performance of self-organizing maps and principal component analysis in pattern extraction from synthetic climatological data. Polar Geogr. 2005, 29, 188–212. [Google Scholar] [CrossRef]
  44. Nigro, M.A.; Cassano, J.J. Identification of surface wind patterns over the Ross Ice Shelf, Antarctica, using self-organizing maps. Mon. Weather Rev. 2014, 142, 2361–2378. [Google Scholar] [CrossRef]
  45. Johnson, N.C. How many ENSO flavors can we distinguish? J. Clim. 2013, 26, 4816–4827. [Google Scholar] [CrossRef]
  46. Jones, D.A.; Simmonds, I. A climatology of Southern Hemisphere extratropical Cyclones. Clim. Dyn. 1993, 9, 131–145. [Google Scholar] [CrossRef]
  47. Kodama, Y.; Wendler, G. Wind and temperature regima along the slope of Adélie Land, Antarctica. J. Geophys. Res. 1986, 91, 6735–6741. [Google Scholar] [CrossRef]
  48. Carleton, A.M. A synoptic climatology of satellite-observed extratropical cyclones activity for the Southern Hemisphere winter. Arch. Meteorol. Geophys. Bioklimatol. 1979, 27, 265–279. [Google Scholar] [CrossRef]
  49. Thompson, D.W.J.; Wallace, J.M. Annular modes in the extratropical circulation. Part I: Month-to-month variability. J. Clim. 2000, 13, 1000–1016. [Google Scholar] [CrossRef]
  50. Mends, D.; Souza, E.P.; Marengo, J.A.; Mendes, M.C.D. Climatology of extratropical cyclones over the South American-southern oceans sector. Theor. Appl. Climatol. 2010, 100, 239–250. [Google Scholar] [CrossRef] [Green Version]
  51. Pezza, A.B.; Durrant, T.; Simmonds, I.; Smith, I. Southern hemisphere synoptic behavior in extreme phases of SAM, ENSO, sea ice extent, and Southern Australia rainfall. J. Clim. 2008, 21, 5566–5584. [Google Scholar] [CrossRef]
  52. Eichler, T.P.; Gottschalck, J. A comparison of southern hemisphere cyclone track climatology and interannual variability in coarse-gridded reanalysis datasets. Adv. Meteorol. 2013, 2013, 891260. [Google Scholar] [CrossRef]
  53. Simmonds, I. Comparing and contrasting the behavior of Arctic and Antarctic sea ice cover the 35 year period 1979-2013. Annu. Glaciol. 2015, 56, 18–28. [Google Scholar] [CrossRef] [Green Version]
  54. Wallenius, T.; Lehtomäki, V. Overview of cold climate wind energy: Challenges, solutions, and future needs. Wires Energy Environ. 2016, 5, 128–135. [Google Scholar] [CrossRef]
  55. Lacroix, A.; Manwell, J.F. Wind Energy: Cold Weather Issues; University of Massachusetts at Amherst, Renewable Energy Laboratory: Golden, CO, USA, 2000. [Google Scholar]
  56. Barristi, L. Wind Turbines in Cold Climates: Icing impacts and mitigation system. In Green Energy and Technology; Springer International Publishing: Cham, Switzerland, 2015; p. 333. [Google Scholar]
  57. Parish, T.R. The influence of the Antarctic Peninsula on the wind field over the western Weddell Sea. J. Geophys. Res. 1983, 88, 2684–2692. [Google Scholar] [CrossRef]
  58. Steinhoff, D.F.; Chaudhuri, S.; Bromwich, D.H. A case study of a Ross Ice Shelf air stream event: A new perspective. Mon. Weather Rev. 2009, 137, 4030–4046. [Google Scholar] [CrossRef]
  59. Pettré, P.; Payan, C.; Parish, T.R. Interaction of katabatic flow with local thermal effects in a coastal region of Adélie Land, East Antarctica. J. Geophys. Res. 1993, 98, 10429–10440. [Google Scholar] [CrossRef]
  60. Simmonds, I. Modes of atmospheric variability over the Southern Ocean. J. Geophys. Res. 2003, 108, 8078. [Google Scholar] [CrossRef]
  61. Matthewman, N.J.; Magnusdottir, G. Clarifying ambiguity in intraseasonal Southern Hemisphere climate modes during austral winter. J. Geophys. Res. 2012, 117, D03105. [Google Scholar] [CrossRef] [Green Version]
  62. Liess, S.; Kumar, A.; Snyder, P.K.; Kawale, J.; Steinhaeuser, K.; Semazzi, F.H.M.; Ganguly, A.R.; Samatova, N.F.; Kumar, V. Different modes of variability over the Tasman Sea: Implications for regional climate. J. Clim. 2014, 27, 8466–8486. [Google Scholar] [CrossRef] [Green Version]
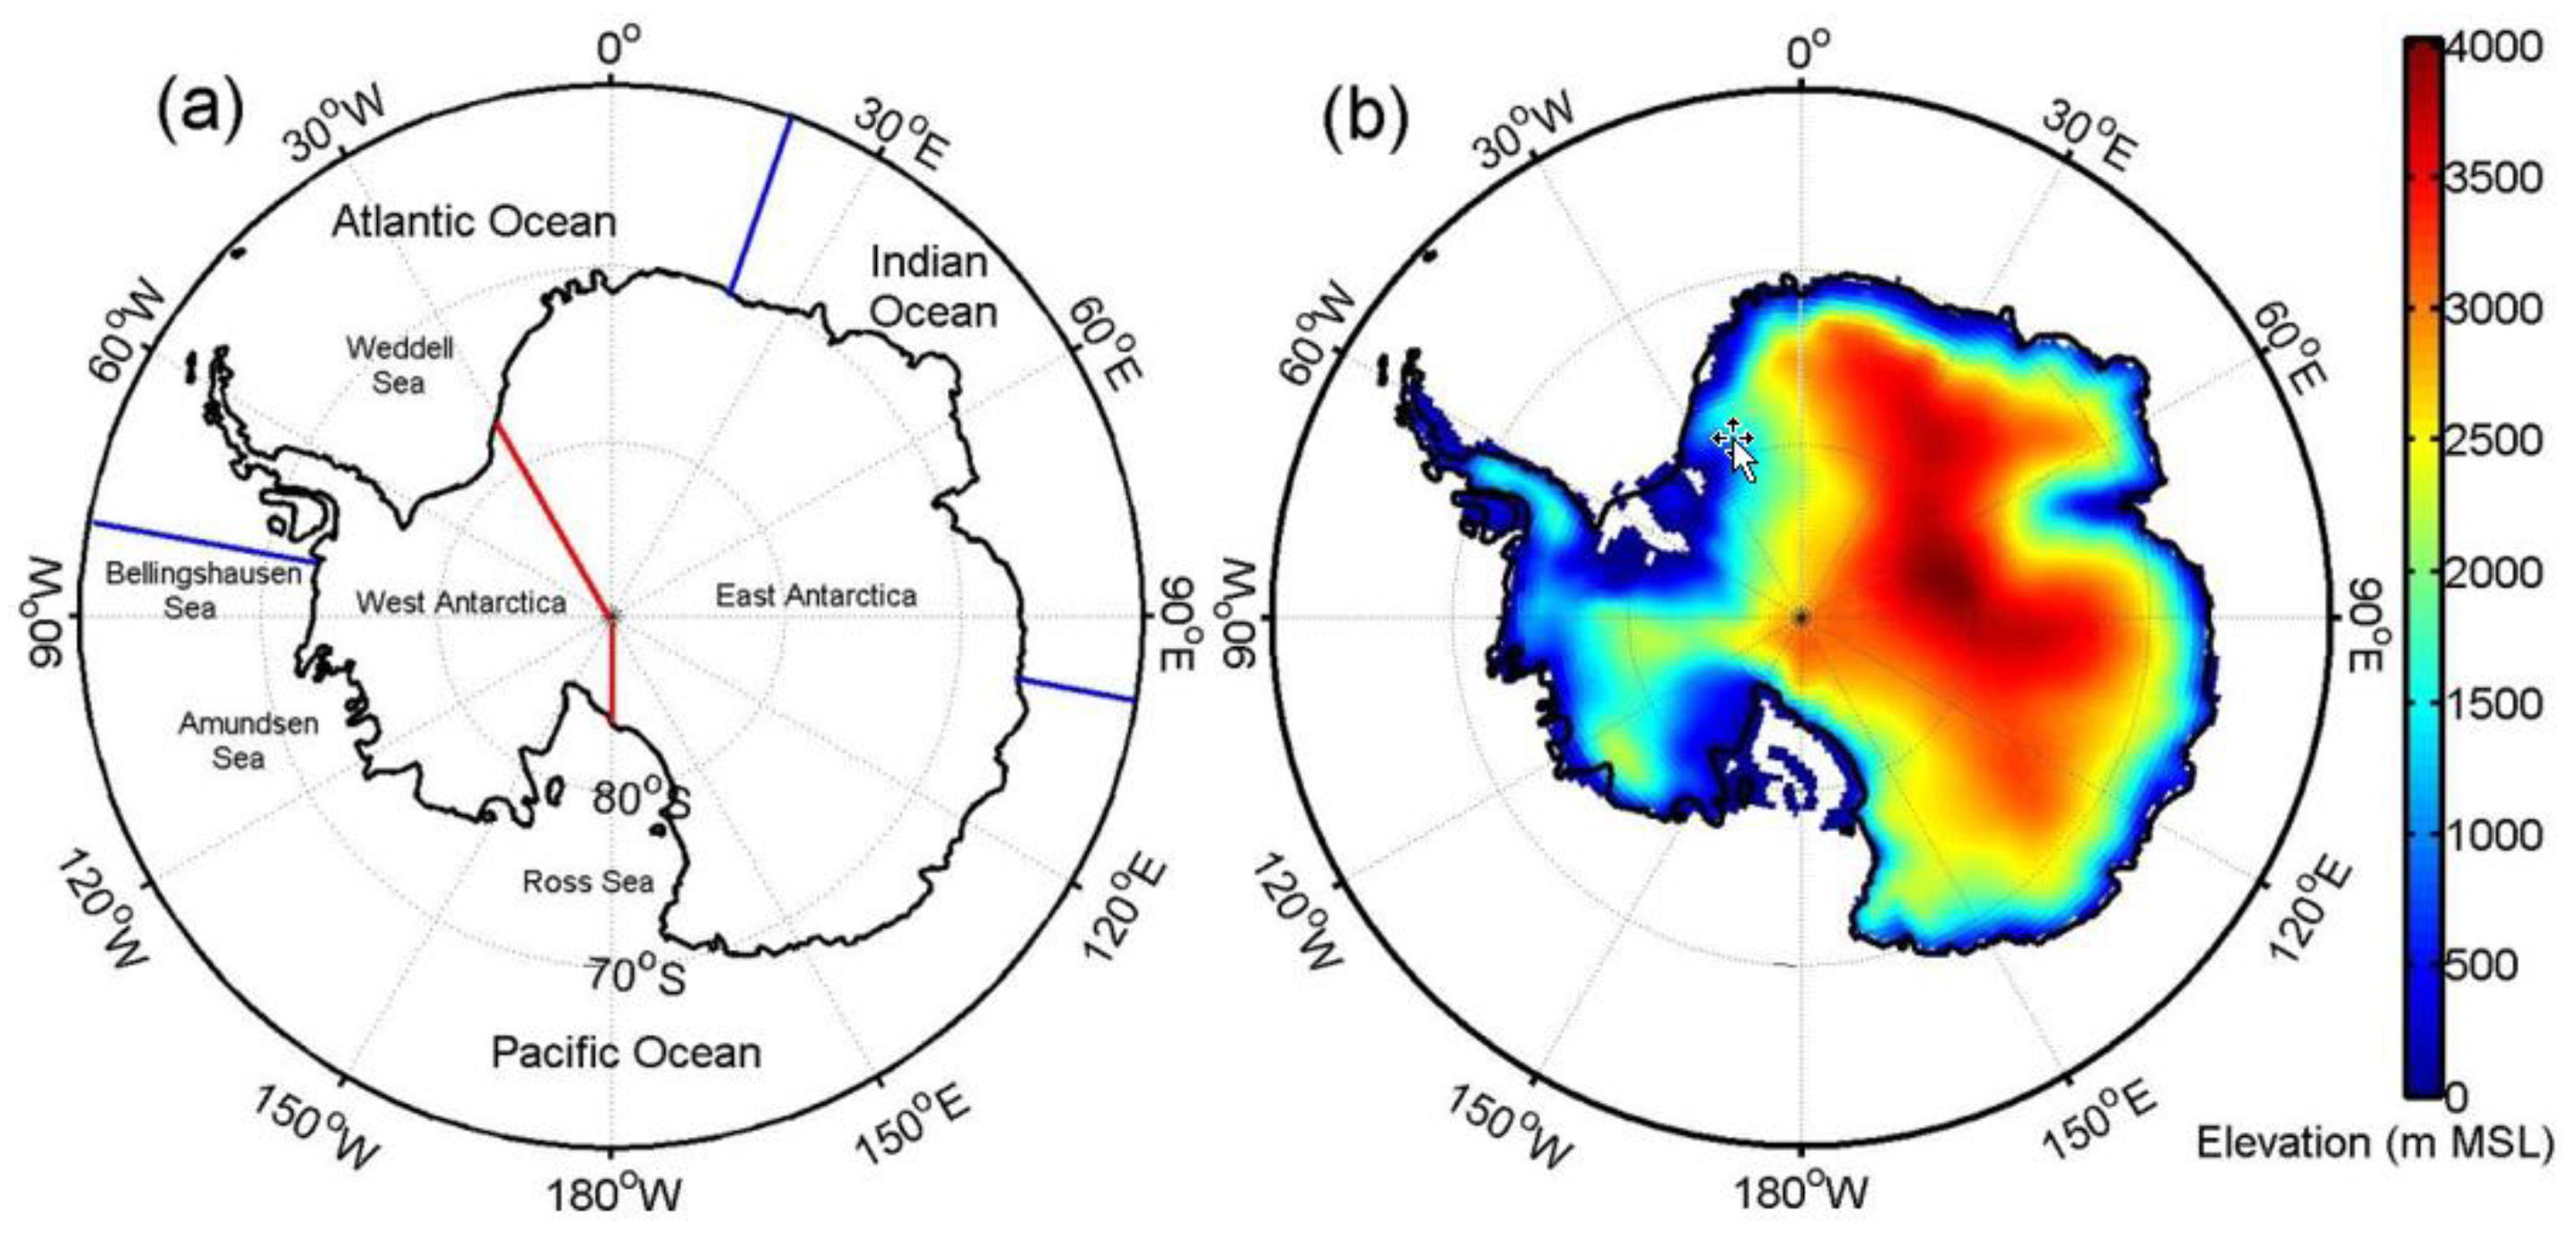
Figure 1. The study domain (south of 60° S) partitioned into five sectors (West Antarctica, East Antarctica, Pacific Ocean, Atlantic Ocean, and Indian Ocean) (a) and the topography as resolved by the ERA-Interim (b).
Atmosphere 11 00108 g001
Figure 2. Time series of domain-averaged mean daily wind speed (a,c,e,g,i,k) and standard deviation (b,d,f,h,j,l) (unit: m s−1), (a,b) for East Antarctica; (c,d) for West Antarctica; (e,f) for the Indian Ocean; (g,h) for the Atlantic Ocean; (i,j) for the Pacific Ocean; (k,l) for the whole region. The numbers from left to right indicate seasonal mean values for austral summer (DJF), autumn (MAM), winter (JJA), and spring (SON).
Atmosphere 11 00108 g002
Figure 3. Interannual standard deviation of seasonal mean wind speed (unit: m s−1) from 1979 to 2017 over the Antarctic continent and its surrounding seas for austral summer (DJF) (a), austral autumn (MAM) (b), austral winter (JJA) (c), and austral spring (SON) (d).
Atmosphere 11 00108 g003
Figure 4. Trends in seasonal mean wind speed (unit: m s−1 year−1) from 1979 to 2017 over the Antarctic continent and its surrounding seas for austral summer (DJF) (a), austral autumn (MAM) (b), austral winter (JJA) (c), and austral spring (SON) (d). The filled regions are significant above the 95% confidence level.
Atmosphere 11 00108 g004
Figure 5. Trends in seasonal mean sea level pressure (unit: Pa year−1) from 1979 to 2017 over the Antarctic continent and its surrounding seas for austral summer (DJF) (a), austral autumn (MAM) (b), austral winter (JJA) (c), and austral spring (SON) (d). The filled regions are significant above the 95% confidence level.
Atmosphere 11 00108 g005
Figure 6. Seasonal mean wind vector fields averaged from 1979 to 2017 over the Antarctic continent and its surrounding seas for austral summer (DJF) (a), austral autumn (MAM) (b), austral winter (JJA) (c), and austral spring (SON) (d).
Atmosphere 11 00108 g006
Figure 7. AAO-related trends in seasonal mean wind speed (m s−1 yr−1) from 1979 to 2017 over the Antarctic continent and its surrounding seas for austral summer (DJF) (a), austral autumn (MAM) (b), austral winter (JJA) (c), and austral spring (SON) (d).
Atmosphere 11 00108 g007
Figure 8. The SOM patterns of the austral summer (DJF) wind speed anomalies (unit: m s−1) for a 3 × 3 grid for the period 1979 to 2017. The number at the top-left corner of each panel denotes the number of seasons for each node.
Atmosphere 11 00108 g008
Figure 9. The SOM patterns of the austral autumn (MAM) wind speed anomalies (unit: m s−1) for a 3 × 3 grid for the period 1979 to 2017. The number at the top-left corner of each panel denotes the number of seasons for each node.
Atmosphere 11 00108 g009
Figure 10. The SOM patterns of the austral winter (JJA) wind speed anomalies (unit: m s−1) for a 3 × 3 grid for the period 1979 to 2017. The number at the top-left corner of each panel denotes the number of seasons for each node.
Atmosphere 11 00108 g010
Figure 11. The SOM patterns of the austral spring (SON) wind speed anomalies (unit: m s−1) for a 3 × 3 grid for the period 1979 to 2017. The number at the top-left corner of each panel denotes the number of seasons for each node.
Atmosphere 11 00108 g011
Figure 12. The percentage of the 38-year annual mean wind speeds ranked into each wind power class.
Atmosphere 11 00108 g012
Table 1. Correlation coefficients between seasonal wind speeds over the Antarctic continent (East Antarctica and West Antarctica) and its surrounding oceans (Indian, Atlantic, and Pacific Oceans) and the Antarctic oscillation (AAO) for the four seasons over the period 1979–2017. The asterisk indicates that the significance of the trend is above the 95% confidence level.
RegionsSummer (DJF)Autumn (MAM)Winter (JJA)Spring (SON)
East Antarctica0.16−0.29−0.51 *−0.02
West Antarctica0.16−0.00−0.090.40
Indian Ocean0.53 *0.270.190.36 *
Atlantic Ocean0.44 *0.71 *0.47 *0.55 *
Pacific Ocean0.39 *0.62 *0.58 *0.62 *
Whole region0.37 *0.290.060.45 *
Table 2. Trends (m s−1 year−1) in seasonal wind speed over the Antarctic land (East Antarctica and West Antarctica) and its surrounding ocean (Indian, Atlantic, and Pacific Oceans) for the four seasons over the period 1979–2017. The bold number indicates that the significance of the trend is above the 95% confidence level.
RegionsSummer (DJF)Autumn (MAM)Winter (JJA)Spring (SON)
East Antarctica0.01080.00230.00520.0115
West Antarctica0.01000.0000−0.00200.0079
Indian Ocean0.01300.00670.01260.0048
Atlantic Ocean0.01190.00590.00730.0079
Pacific Ocean0.00690.00210.0014−0.0026
The whole region0.01010.00240.00350.0070
Table 3. Trends in the occurrence time series for the nine SOM nodes and the percentages they explain of the trends in the seasonal mean wind speeds averaged over grid points with statistically significant trends. Asterisks denote above 95% confidence level.
Node1Node2Node3Node4Node5Node6Node7Node8Node9
Summer−0.0032−0.00020.0117 *−0.0050−0.00030.0093 *−0.0156 *−0.00020.0036
(DJF)2.9%0.0%11.4%4.3%0.0%8.2%13.5%0.0%3.0%
Autumn−0.0050−0.00710.0023−0.0115 *0.00120.0063−0.00370.00320.0098 *
(MAM)3/8%1.9%0.5%8.2%0.1%3.1%1.4%1.5%8.2%
Winter−0.00450.0001−0.00340.00720.0020−0.0009−0.00030.0010−0.0012
(JJA)0.6%0.0%0.5%1.2%0.3%0.0%0.0%0.2%0.0%
Spring0.0066−0.00500.0198 *0.0010−0.00560.0002−0.0086 *−0.00830.0001
(SON)1.3%−2.2%27.9%−0.4%2.0%0.1%8.7%8.1%−0.0%