Brake Wear Particle Emissions of a Passenger Car Measured on a Chassis Dynamometer


Abstract
1. Introduction
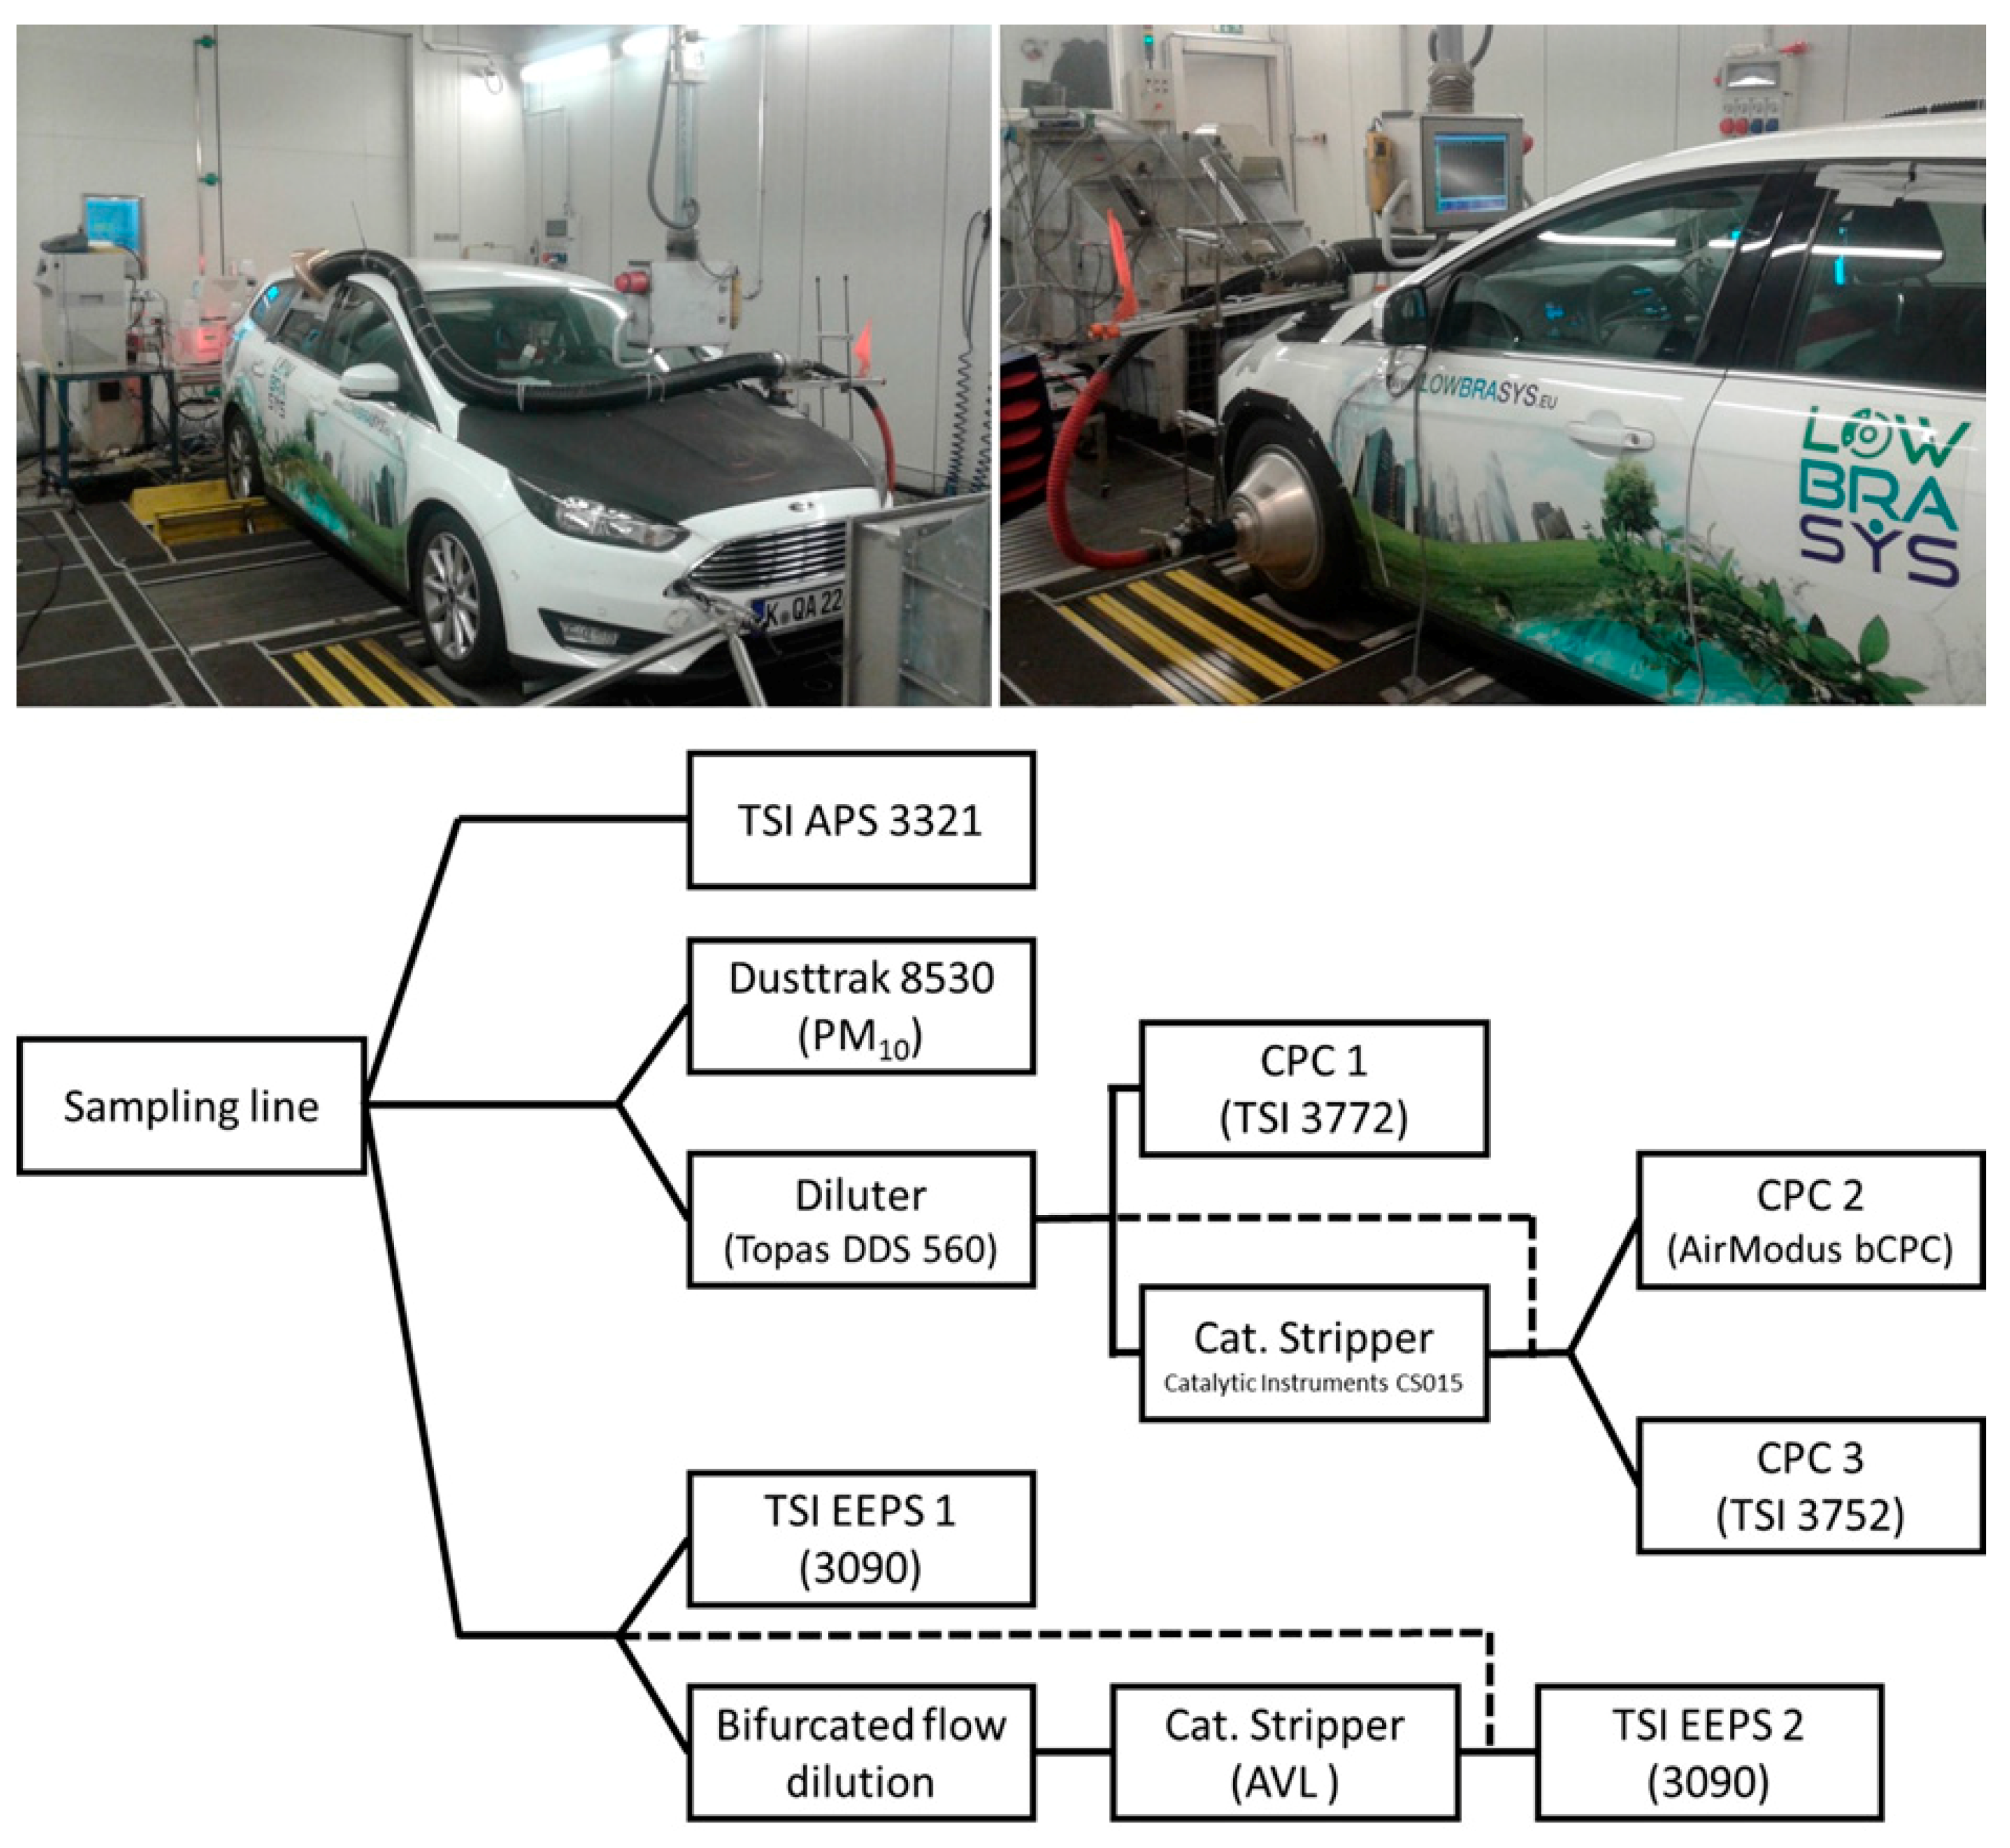
2. Material and Methods
3. Results and Discussion
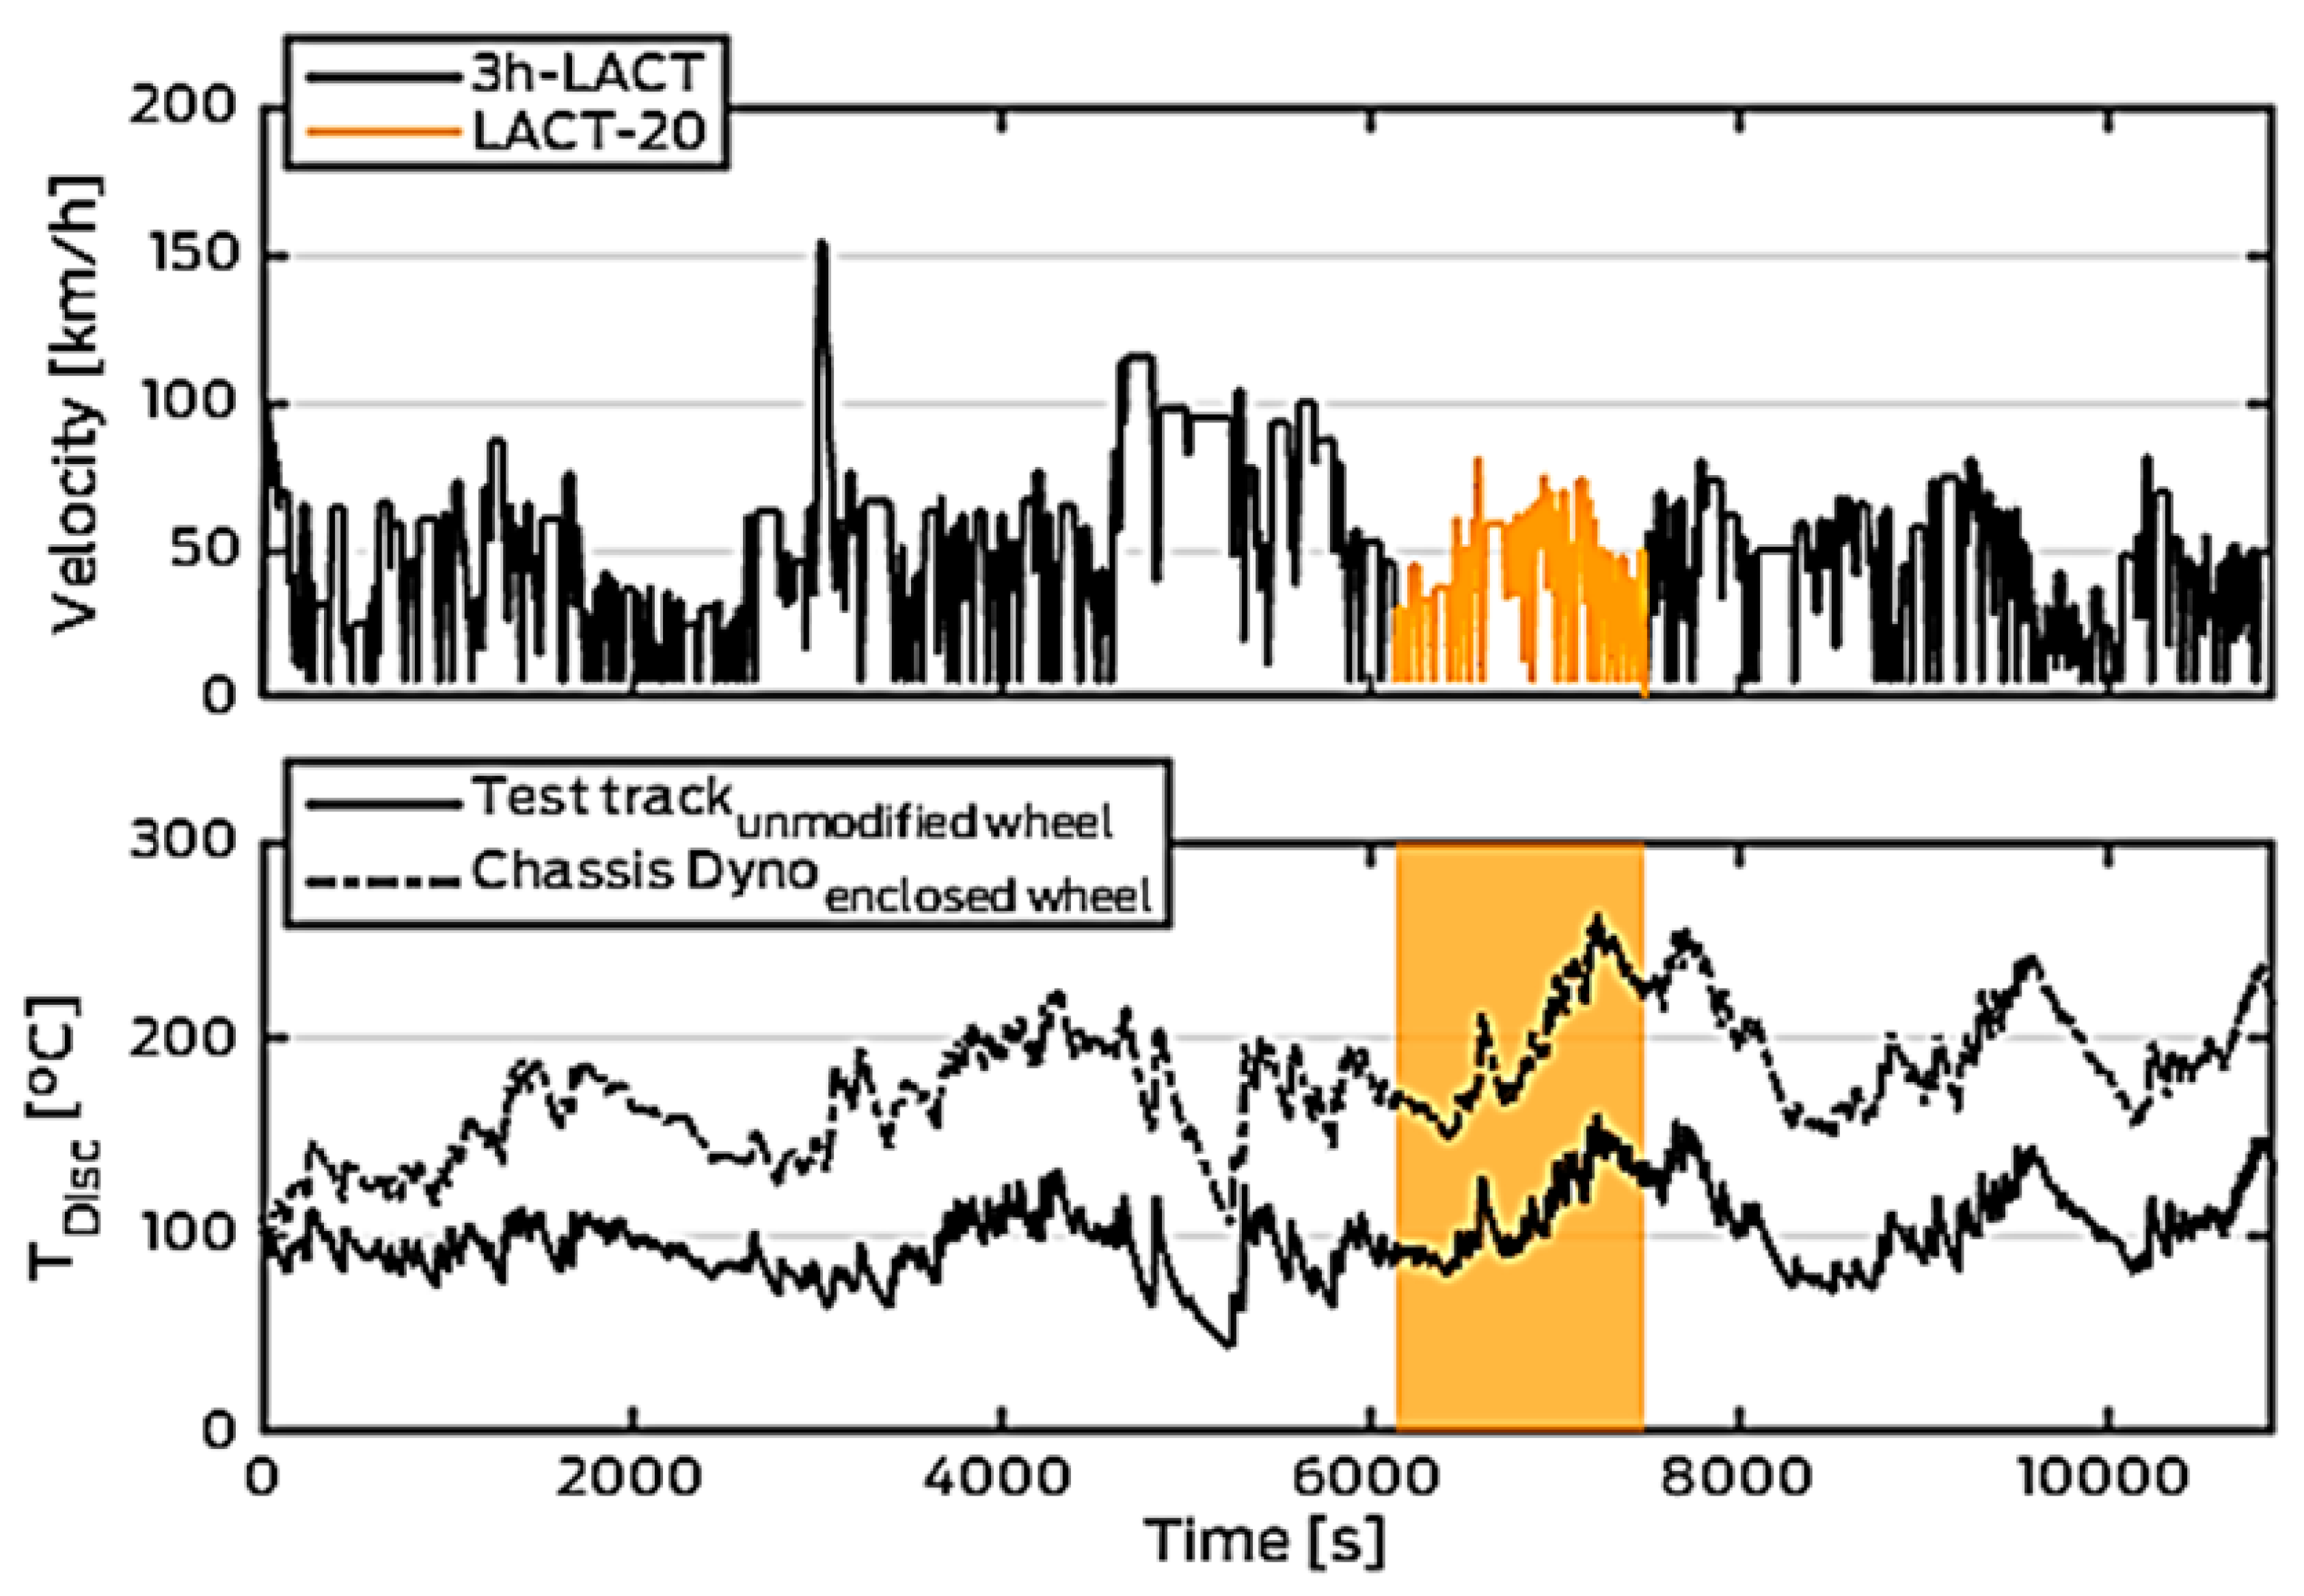
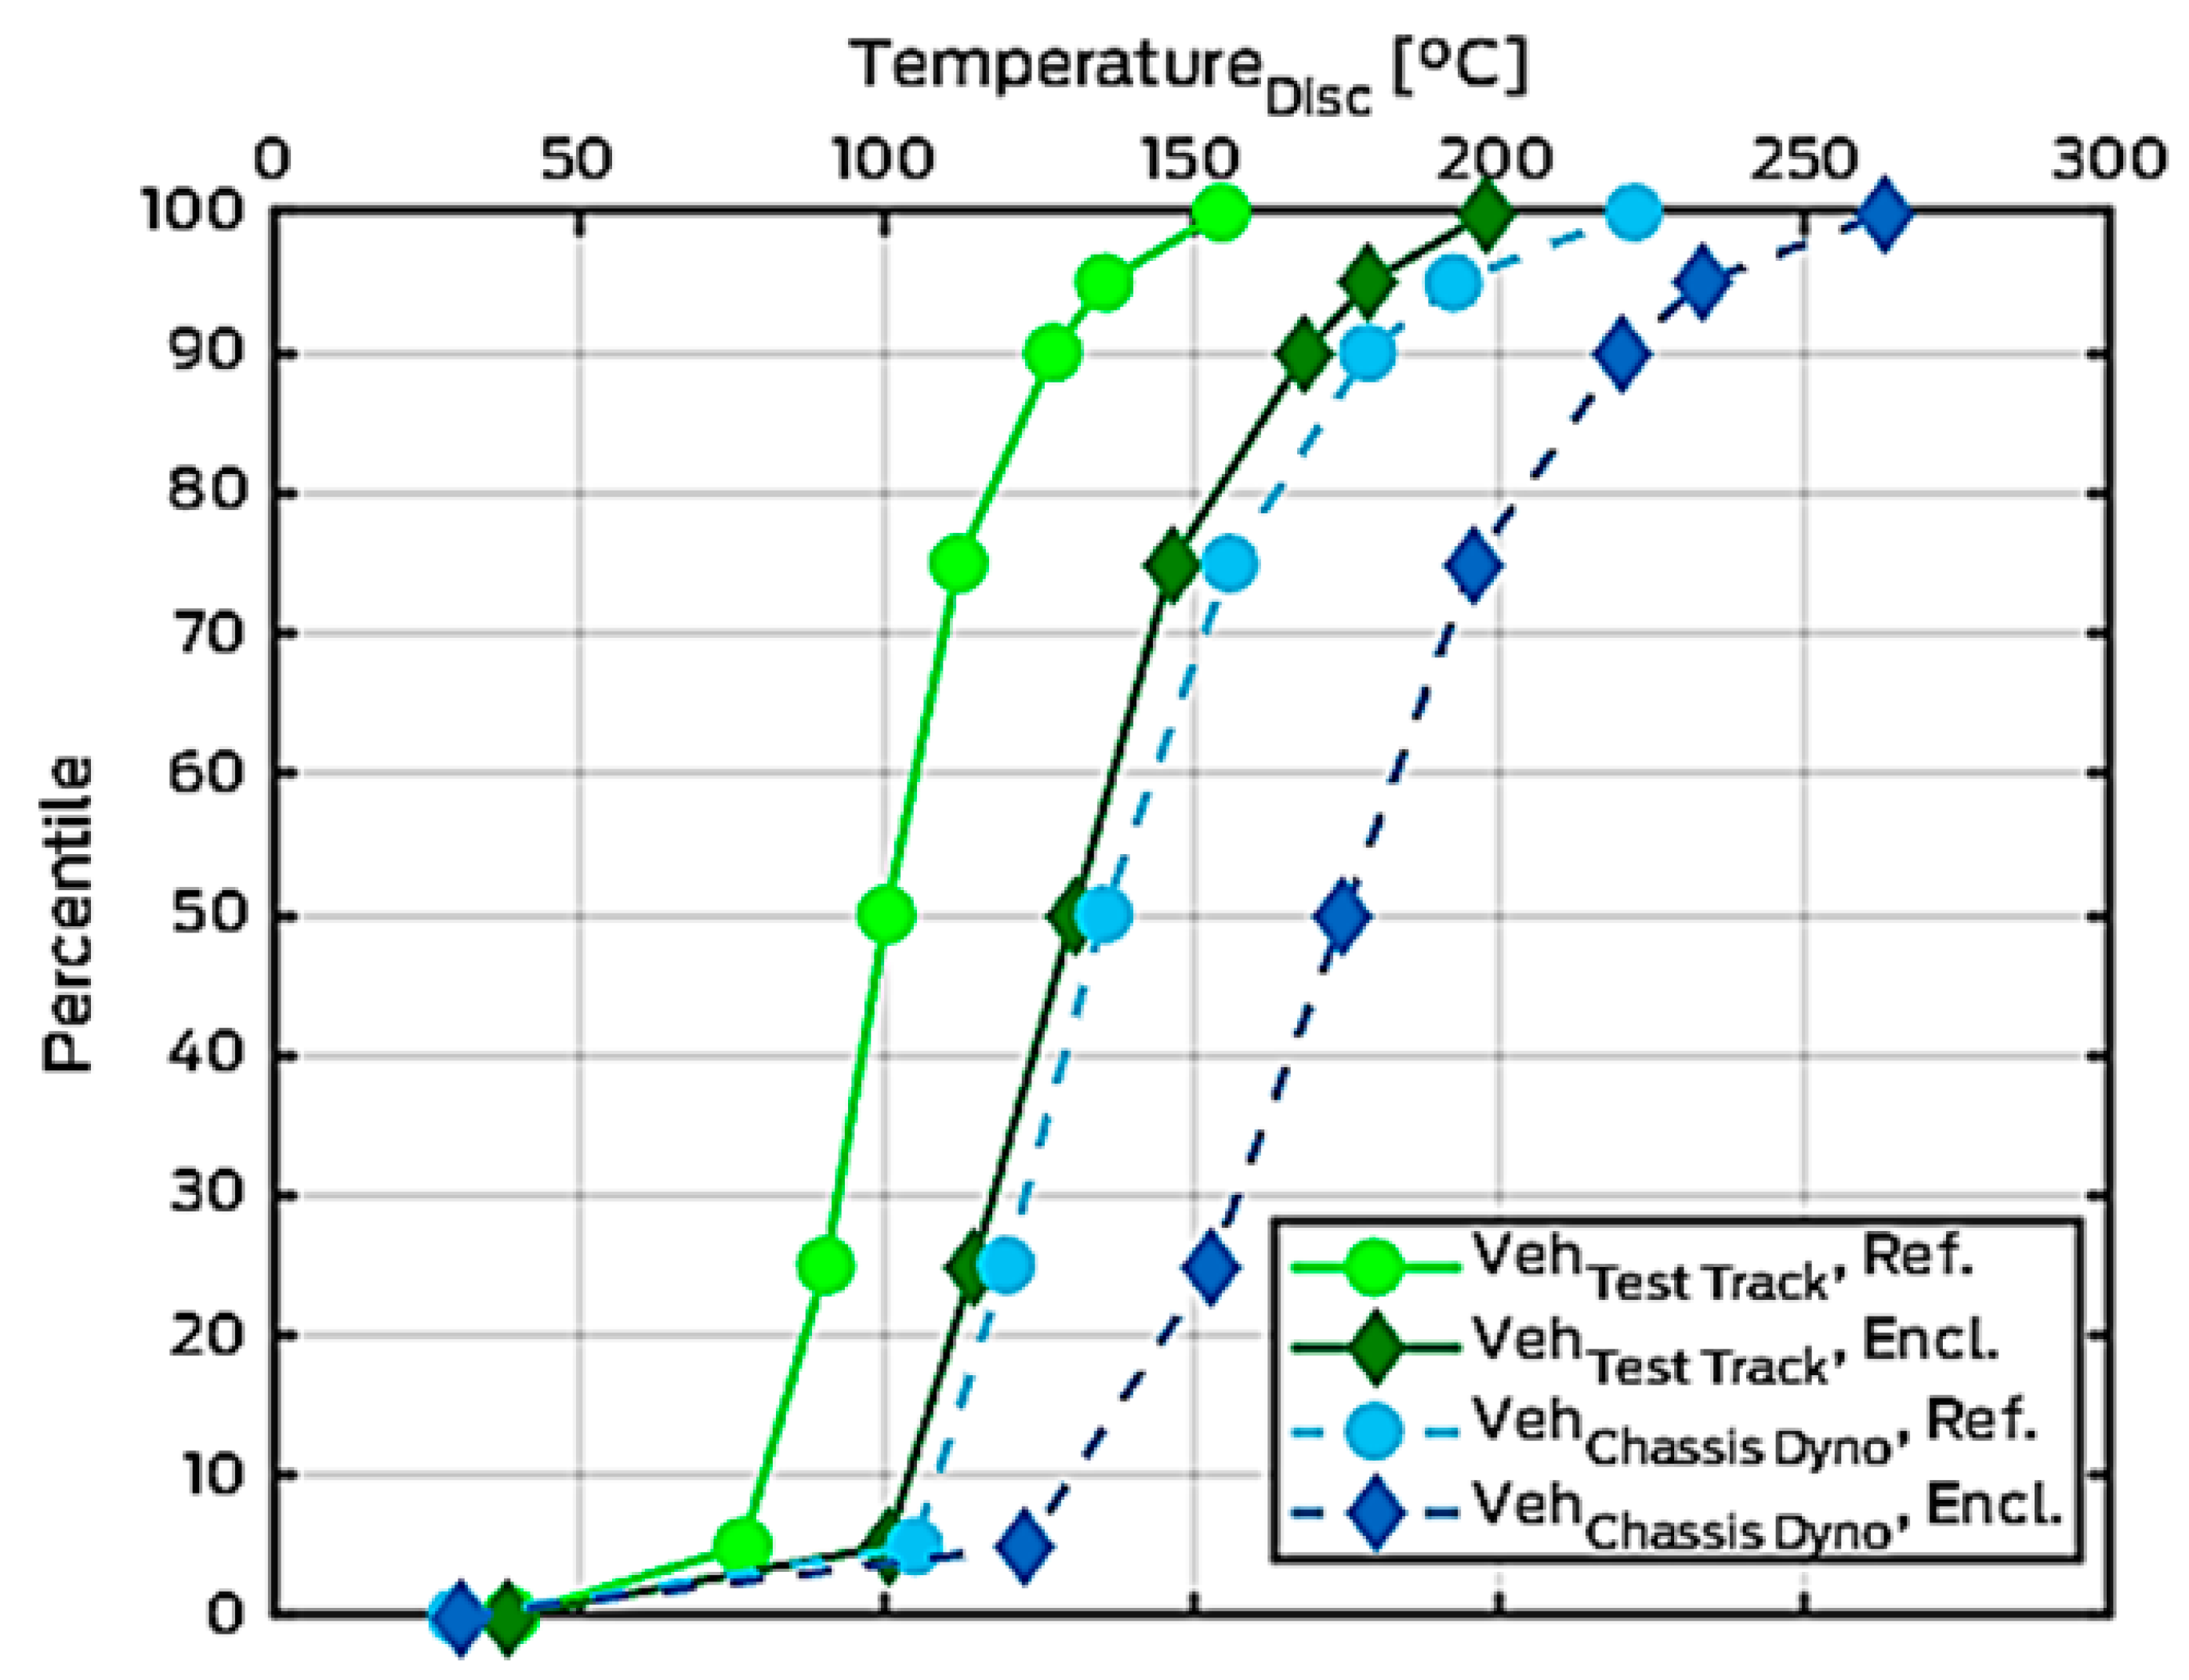
3.1. Brake Temperatures
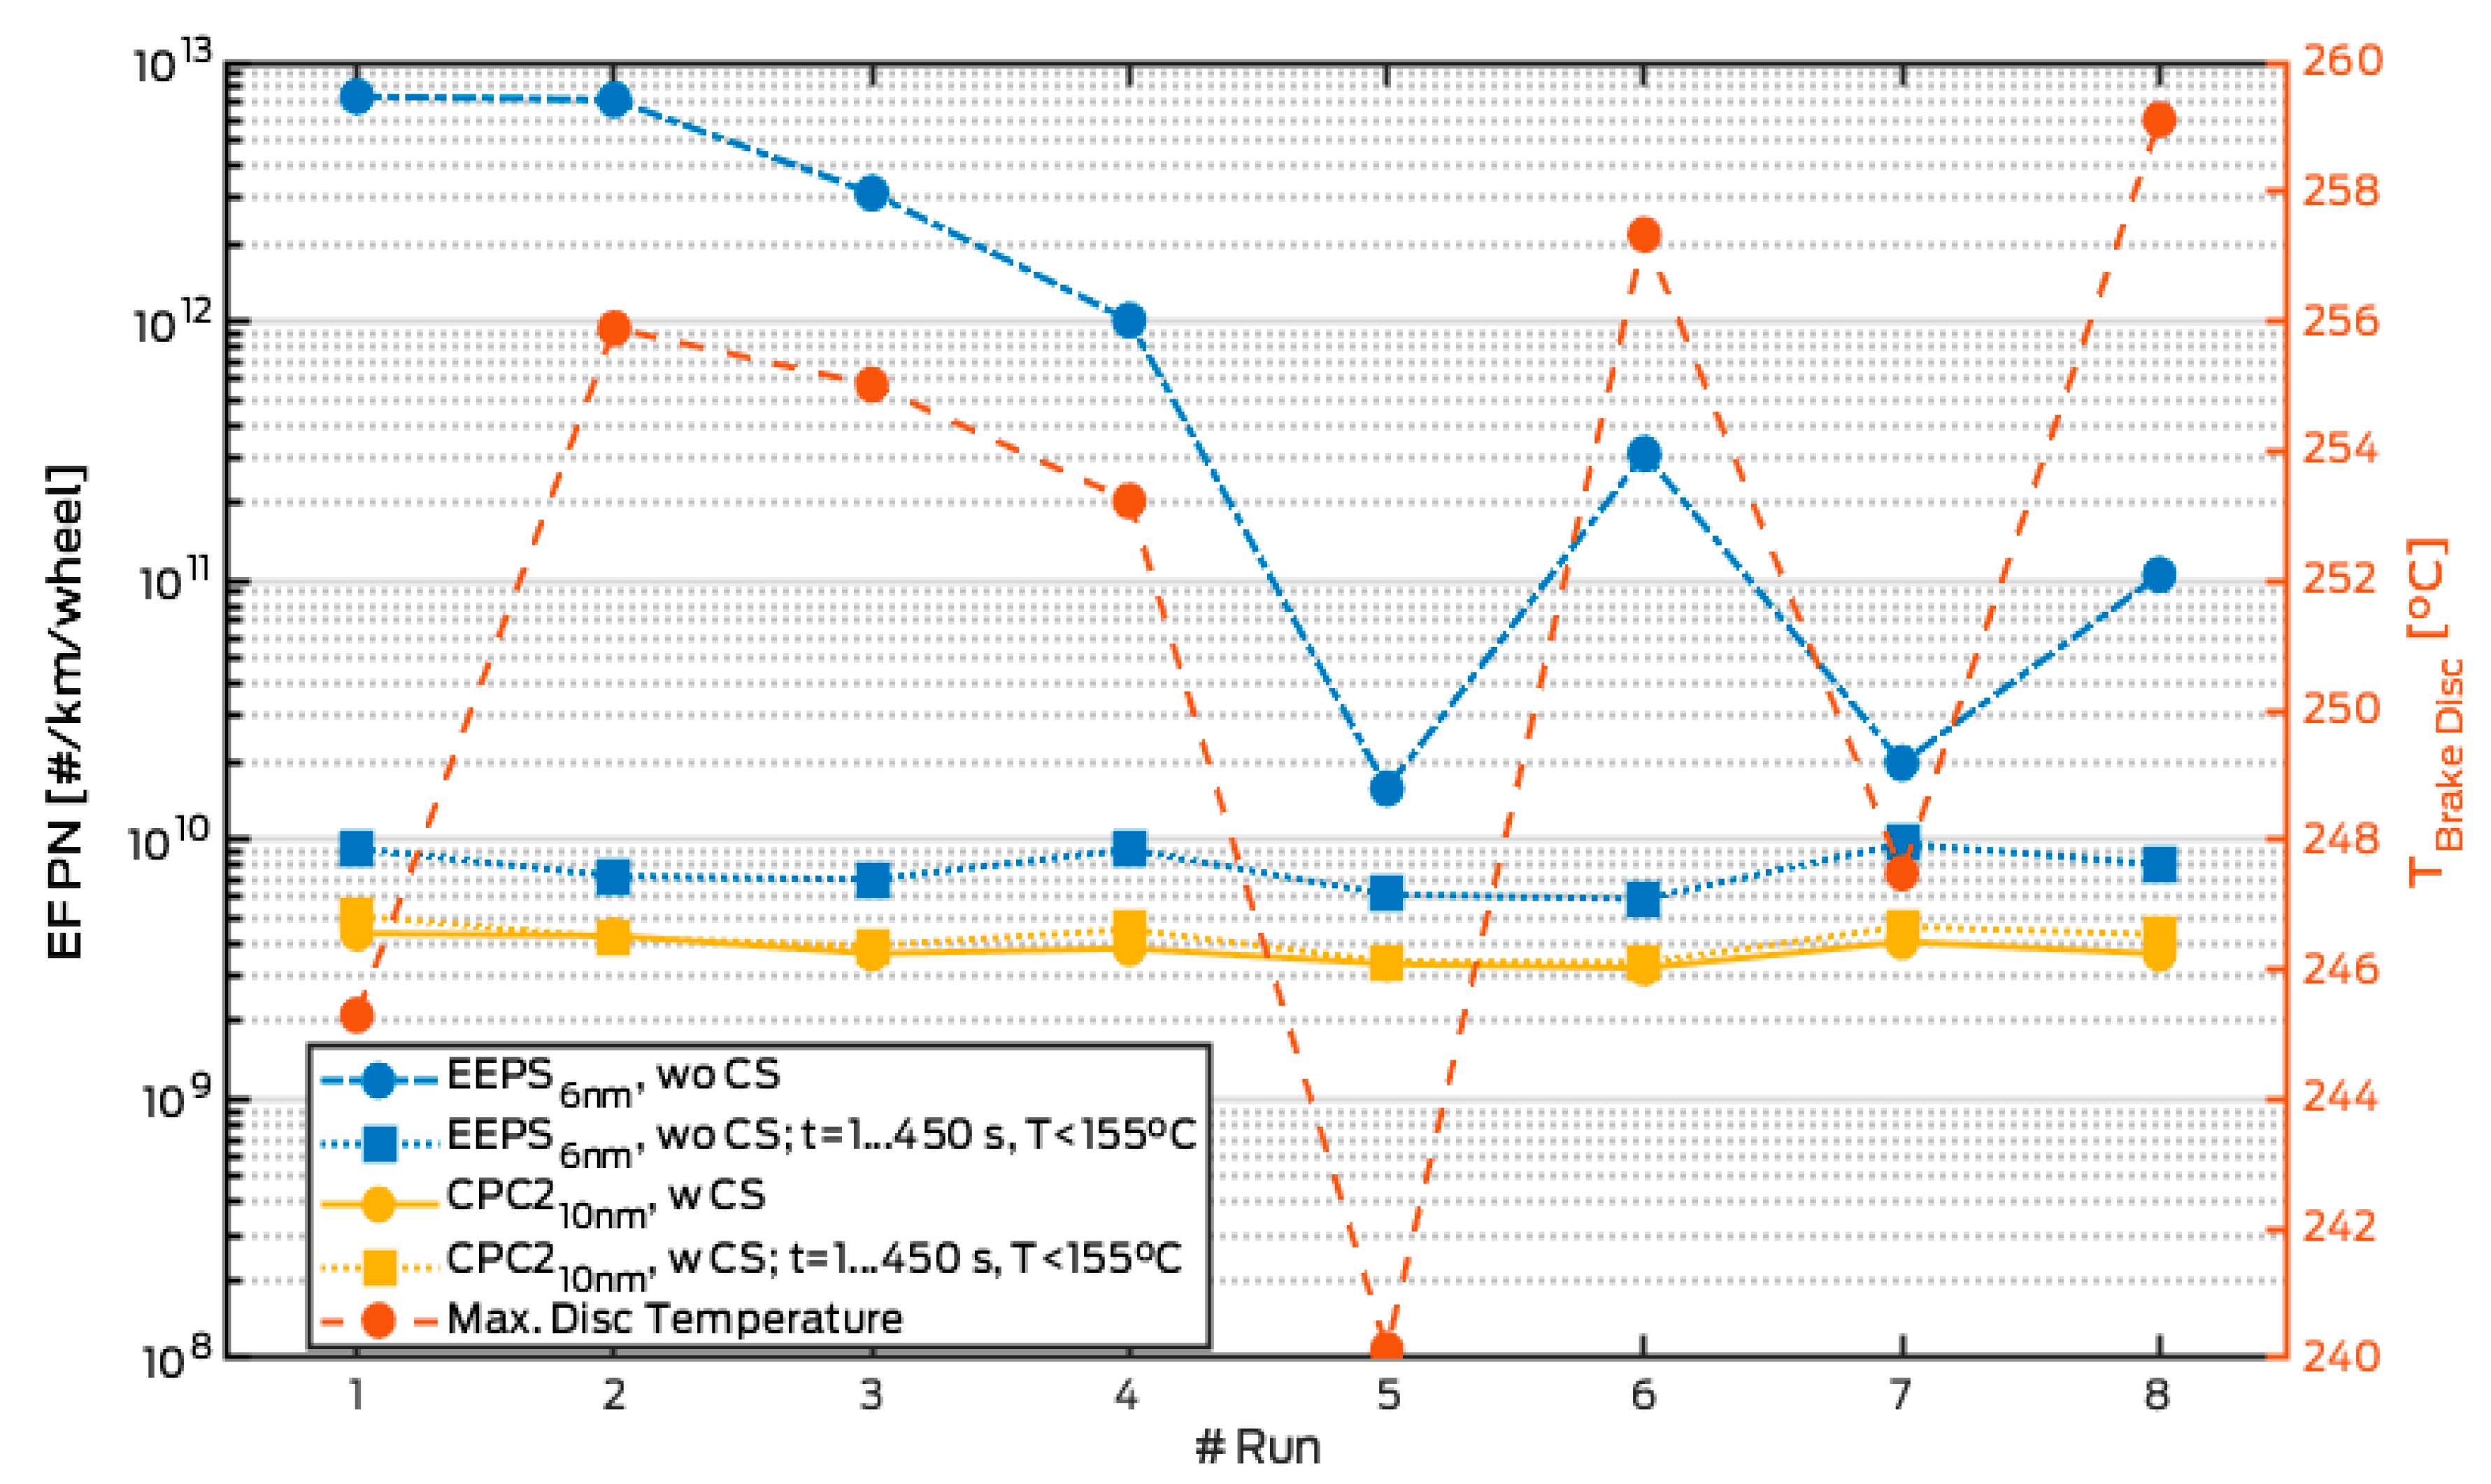
3.2. Repeatability Measurement (LACT-20)
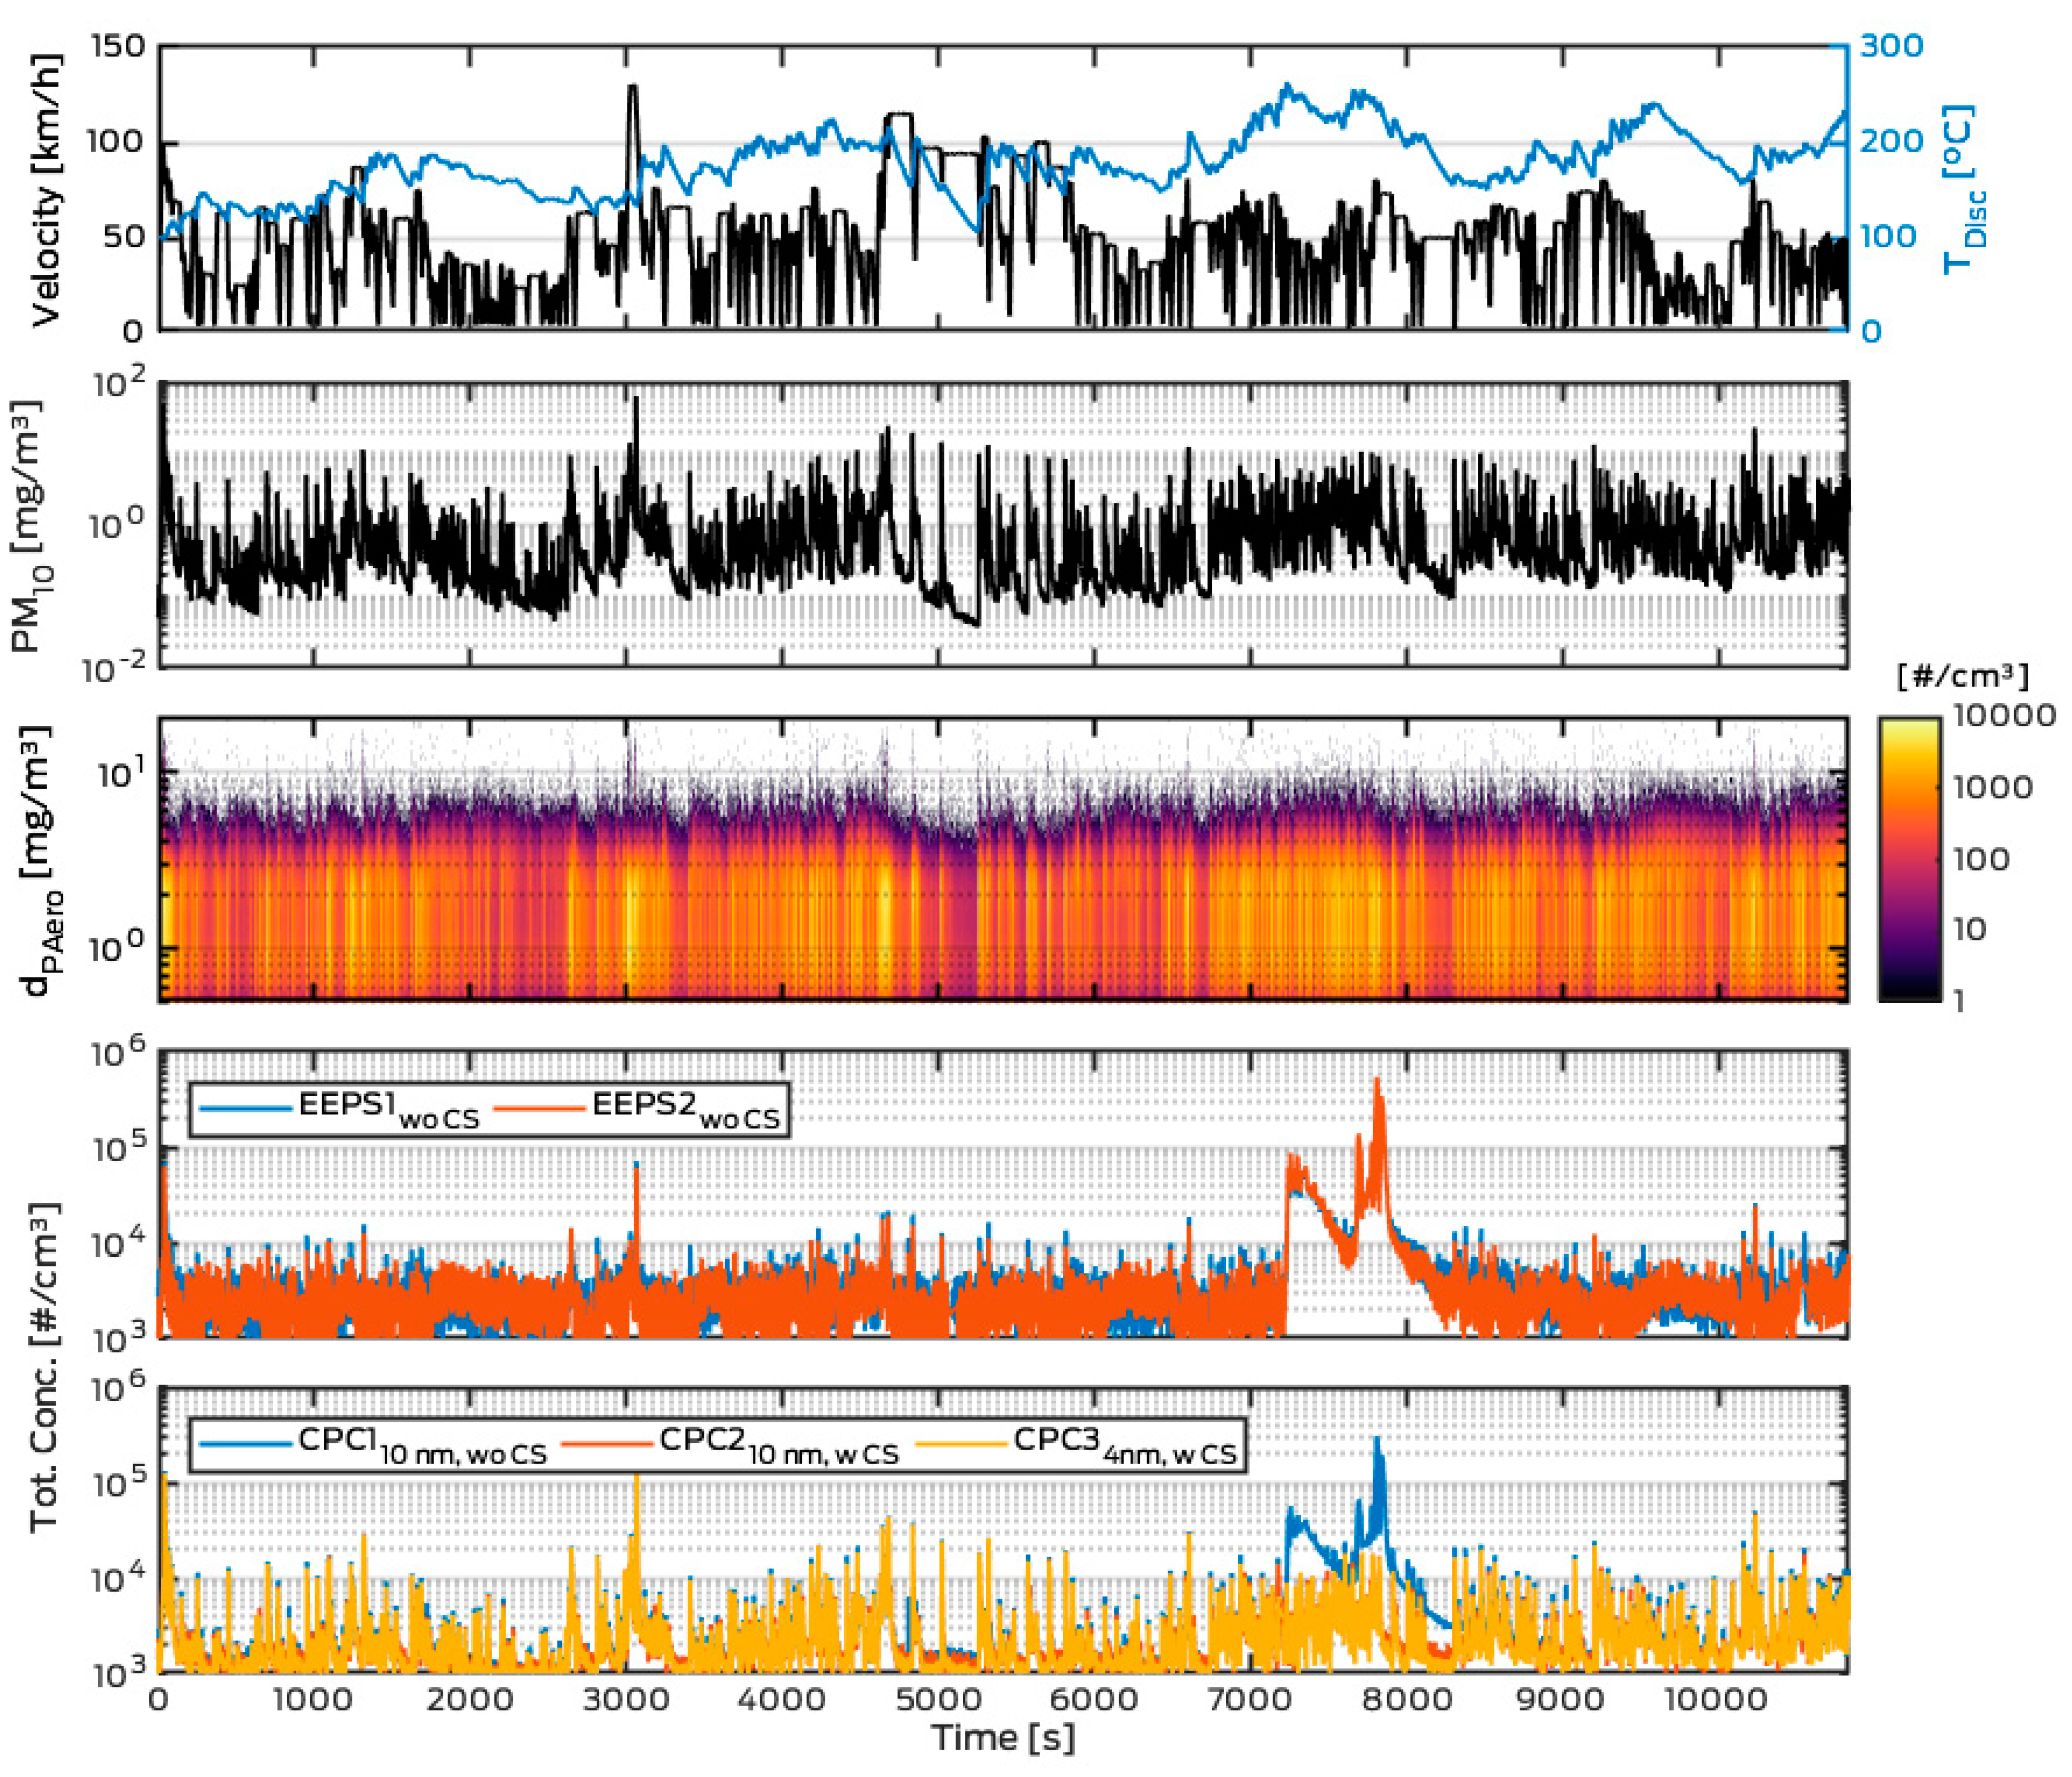
3.3. 3h-LACT
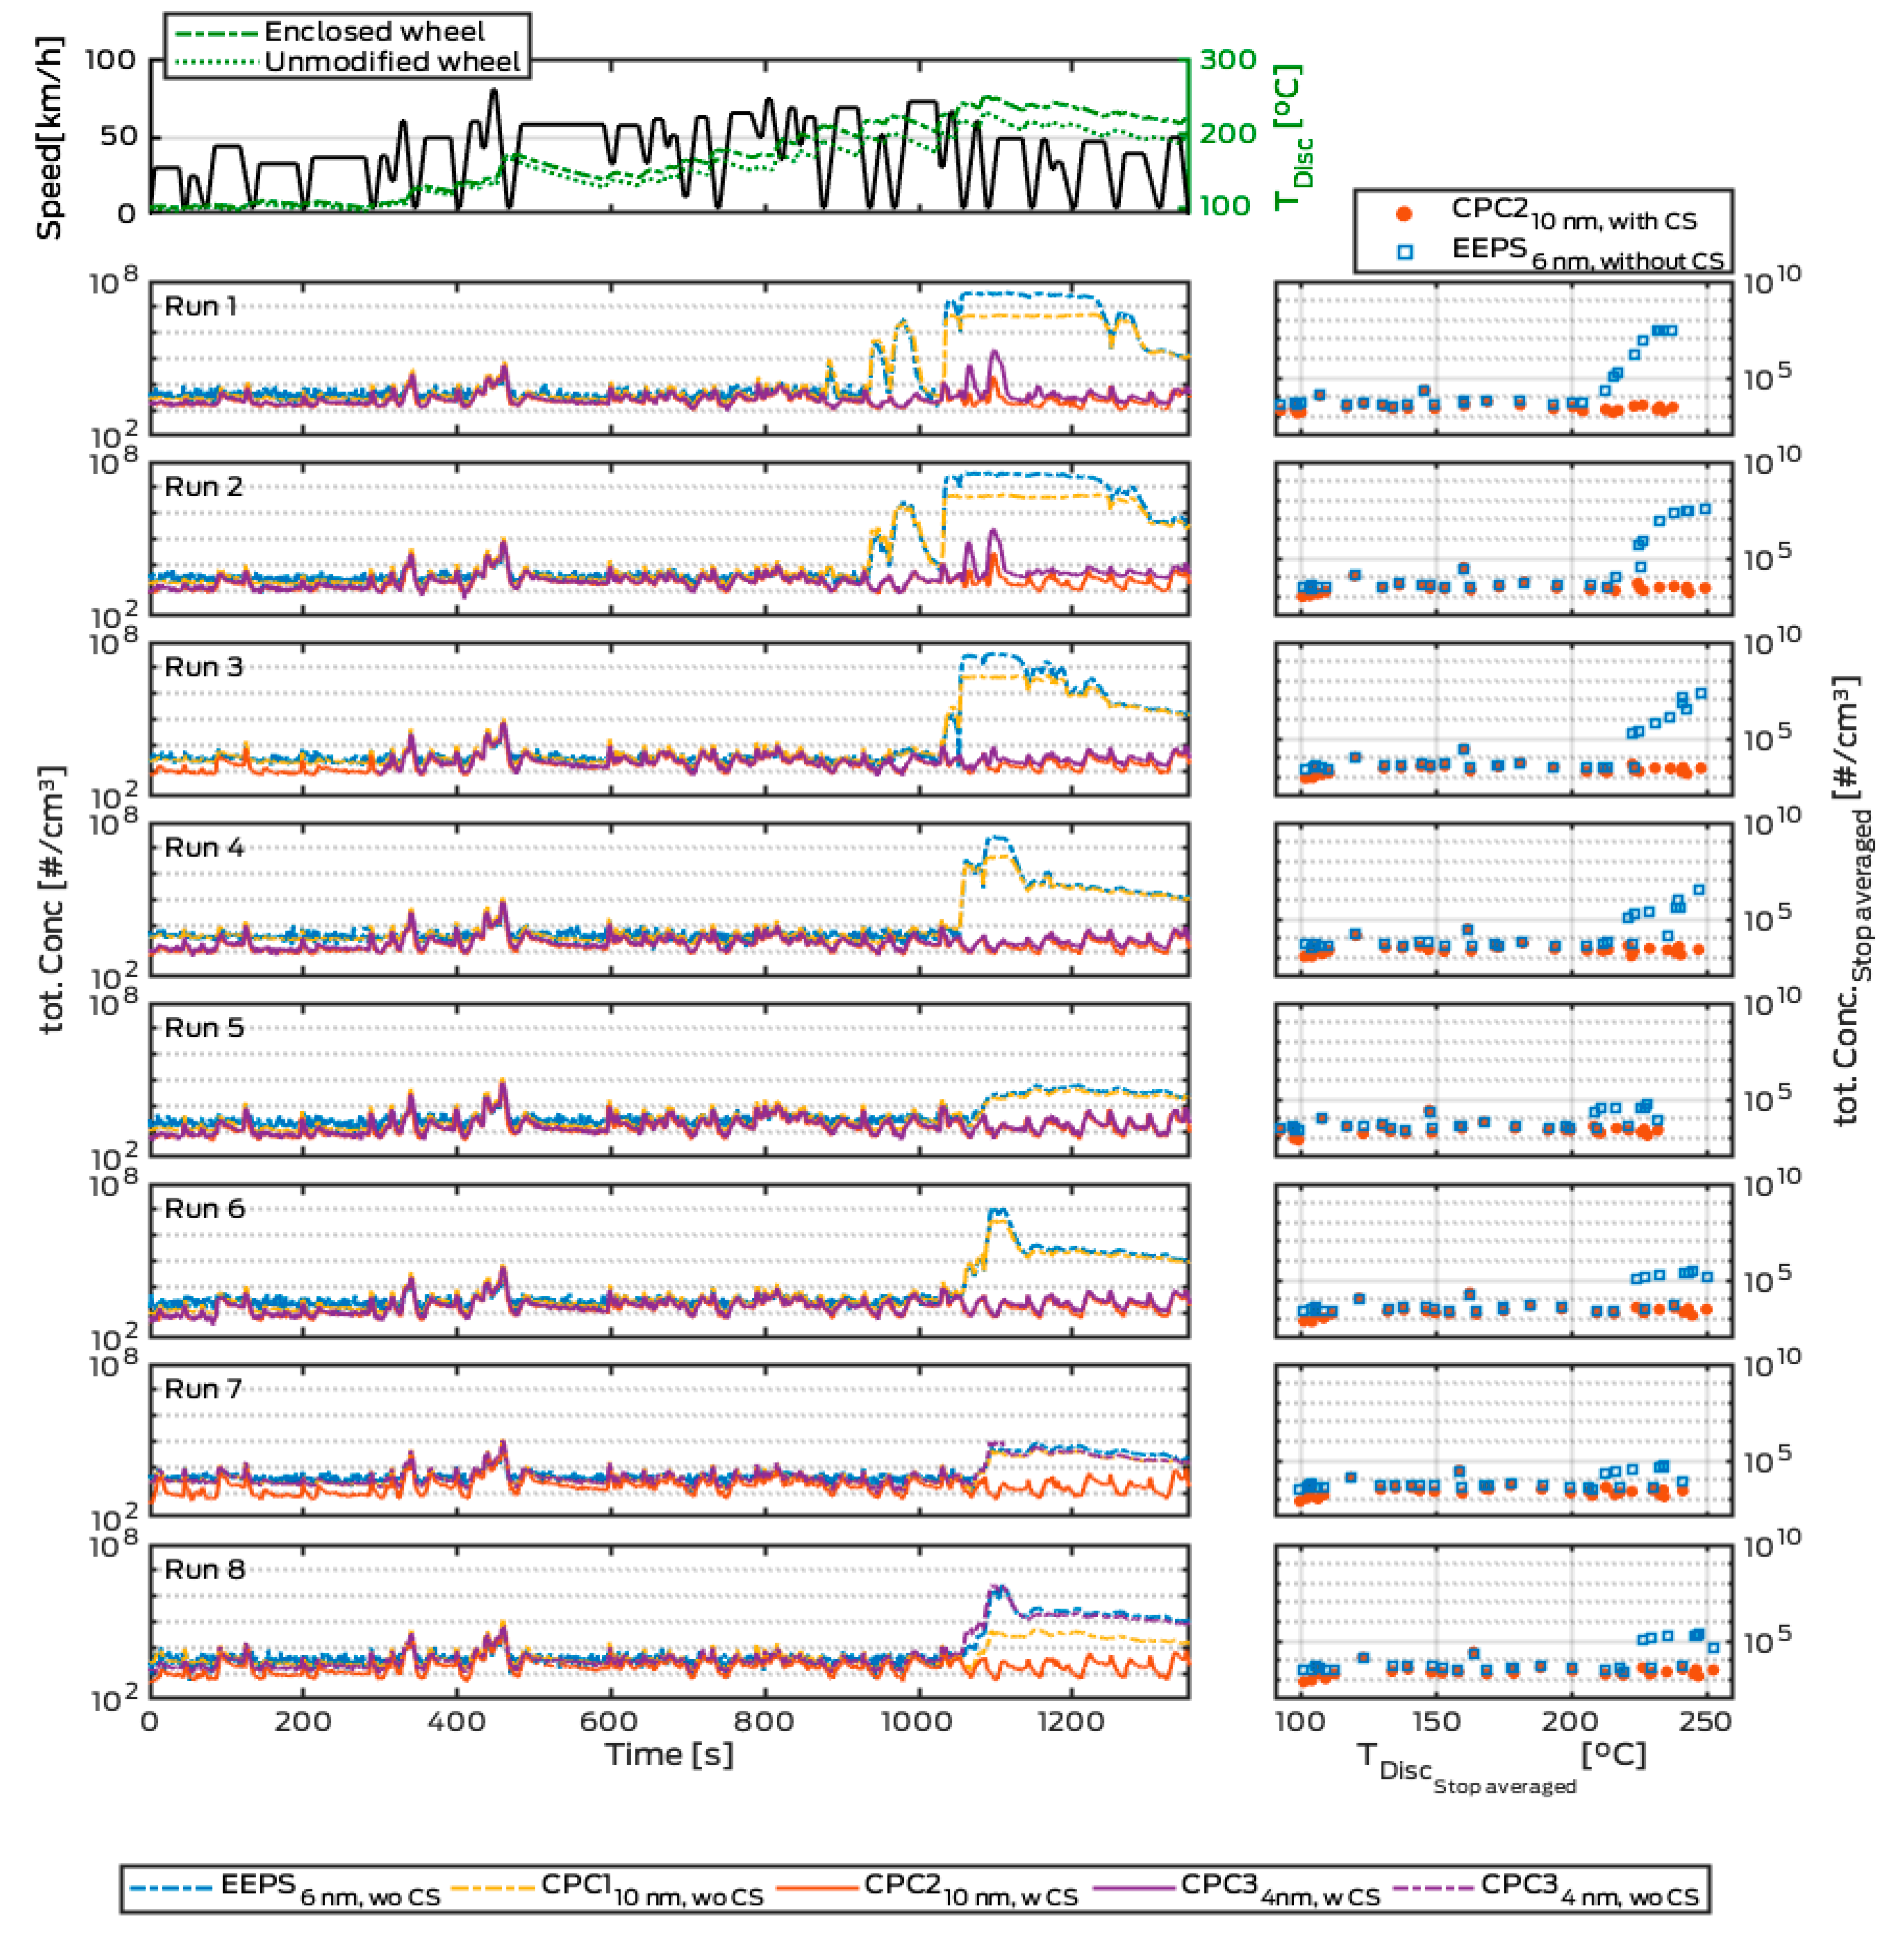
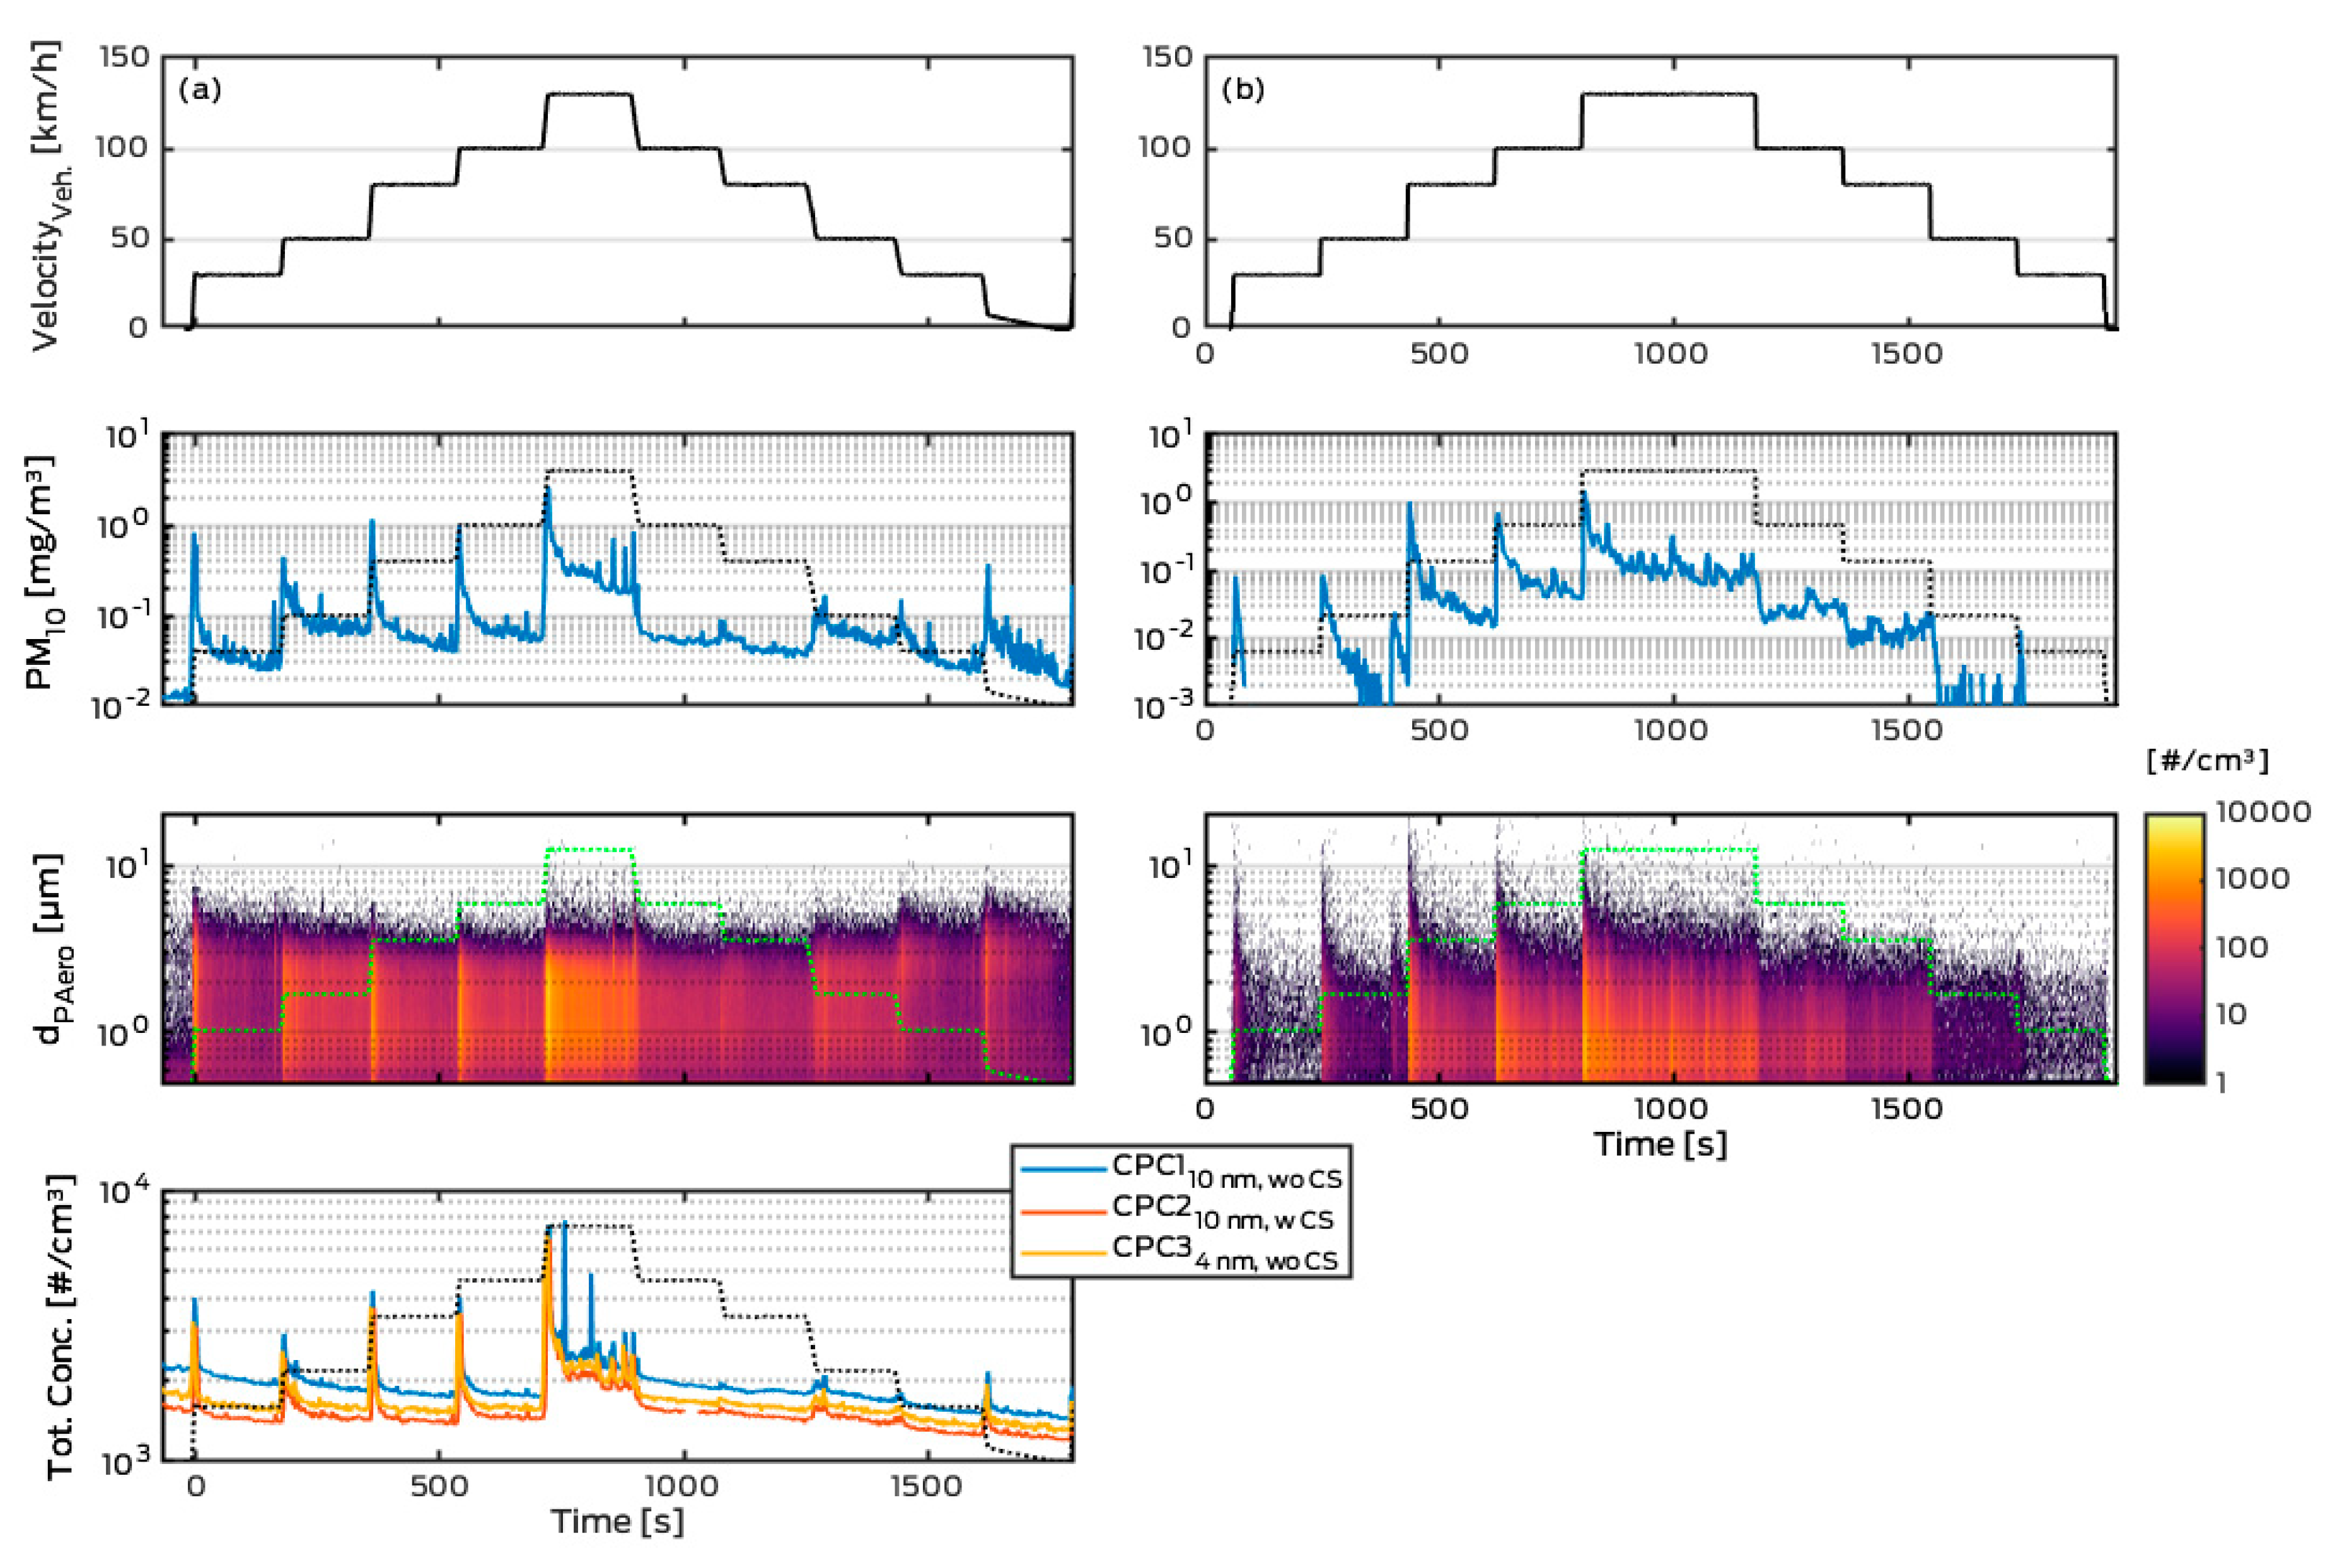
3.4. Pyramid Cycle
4. Conclusions
Author Contributions
Funding
Acknowledgments
Conflicts of Interest
References
- Padoan, E.; Amato, F. Vehicle Non-Exhaust Emissions: Impact on Air Quality. In Non-Exhaust Emissions—An Urban Air Quality Problem for Public Health—Impact and Mitigation Measures; Elsevier: Amsterdam, The Netherlands, 2018; Chapter 2; pp. 21–57. [Google Scholar]
- Denier van der Gon, H.A.C.; Gerlofs-Nijland, M.E.; Gehrig, R.; Gustafsson, M.; Janssen, N.; Harrison, R.M.; Hulskotte, J.; Johansson, C.; Jozwicka, M.; Keuken, M.; et al. The policy relevance of wear emissions from road transport, now and in the future—An international workshop report and consensus statement. Am. J. Air Waste Manag. Assoc. 2013, 63, 136–149. [Google Scholar] [CrossRef] [PubMed]
- Amato, F.; Cassee, F.R.; Denier van der Gon, H.A.C.; Gehrig, R.; Gustafsson, M.; Hafner, W.; Harrison, R.M.; Jozwicka, M.; Kelly, F.J.; Moreno, T.; et al. Urban air quality: The Challenge of traffic non-exhaust emissions. J. Hazard. Mater. 2014, 30, 31–36. [Google Scholar] [CrossRef] [PubMed]
- Denier van der Gon, H.A.C.; Hulskotte, J.; Jozwicka, M.; Kranenburg, R.; Kuenen, J.; Visschedijk, A. European Emission Inventories and Projections for Road Transport. Non-Exhaust Emissions. In Non-Exhaust Emissions—An Urban Air Quality Problem for Public Health—Impact and Mitigation Measures; Elsevier: Amsterdam, The Netherlands, 2018; Chapter 5; pp. 102–121. [Google Scholar]
- Collier, S.; Yoon, S.; Long, J.; Pournazeri, S.; Herner, J.; Stanard, A.; Koupal, J.; Kishan, S.; Agudelo, C.; Vedula, R.; et al. Brake-wear PM Research for California Emission Inventory. In Proceedings of the 50th PMP IWG Meeting, Brussels, Belgium, 3–4 April 2019; Available online: https://wiki.unece.org/display/trans/PMP+50th+Session (accessed on 16 September 2019).
- Grigoratos, T.; Martini, G. Brake wear particle emissions, A review. Environ. Sci. Pollut. Res. 2015, 22, 2491–2504. [Google Scholar] [CrossRef] [PubMed]
- Mathissen, M.; Grochowicz, J.; Schmidt, C.; Vogt, R.; Farwick zum Hagen, F.; Grabiec, T.; Steven, H.; Grigoratos, T. A novel real-world braking cycle for studying brake wear particle emissions. Wear 2018, 414–415, 219–226. [Google Scholar] [CrossRef]
- Garg, B.D.; Cadle, S.H.; Mulawa, P.A.; Groblicki, P.J. Brake wear particulate matter emissions. Environ. Sci. Technol. 2000, 34, 4463–4469. [Google Scholar] [CrossRef]
- Iijima, A.; Sato, K.; Yano, K.; Kato, M.; Kozawa, K.; Furuta, N. Emission factor for antimony in brake abrasion dust as one of the major atmospheric antimony sources. Environ. Sci. Technol. 2008, 42, 2937–2942. [Google Scholar] [CrossRef] [PubMed]
- Hulskotte, J.; Roskam, G.D.; Denier van der Gon, H. Elemental composition of current automotive braking materials and derived air emission factors. Atmos. Environ. 2014, 99, 436–445. [Google Scholar] [CrossRef]
- Hagino, H.; Oyama, M.; Sasaki, S. Laboratory testing of airborne brake wear particle emissions using a dynamometer system under urban city driving cycles. Atmos. Environ. 2016, 131, 269–278. [Google Scholar] [CrossRef]
- Lugovyy, D.; Gramstat, S. Novel WLTP cycle—PM and PN results. In Proceedings of the 50th PMP IWG Meeting, Brussels, Belgium, 3–4 April 2019; Available online: https://wiki.unece.org/display/trans/PMP+50th+Session (accessed on 16 September 2019).
- Mamakos, A.; Arndt, M.; Augsburg, K.; Hesse, D. Brake Dust PM Results measured on a Dyno running the Novel Test Cycle. In Proceedings of the 50th PMP IWG Meeting, Brussels, Belgium, 3–4 April 2019; Available online: https://wiki.unece.org/display/trans/PMP+50th+Session (accessed on 16 September 2019).
- Robere, M. Exploratory Brake Emissions Benchmarking—A Design of Experiments. In Proceedings of the 50th PMP IWG Meeting, Brussels, Belgium, 3–4 April 2019; Available online: https://wiki.unece.org/display/trans/PMP+50th+Session (accessed on 16 September 2019).
- zum Hagen, F.H.F.; Mathissen, M.; Grabiec, T.; Hennicke, T.; Rettig, M.; Grochowicz, J.; Vogt, R.; Benter, T. Study of Brake Wear Particle Emissions: Impact of Braking and Cruising Conditions. Environ. Sci. Technol. 2019, 53, 5143–5150. [Google Scholar] [CrossRef]
- Mamakos, A.; Arndt, M.; Augsburg, K.; Hesse, D. First insights on brakewear PN over the novel cycle. In Proceedings of the 48th PMP IWG Meeting, Ispra, Italy, 7–8 November 2018; Available online: https://wiki.unece.org/display/trans/PMP+48th+Session (accessed on 16 September 2019).
- Baldauf, R.; Devlin, R.; Gehr, P.; Giannelli, R.; Hassett-Sipple, B.; Jung, H.; Martini, G.; McDonald, J.; Sacks, J.; Walker, K. Ultrafine Particle Metrics and Research Considerations: Review of the 2015 UFP Workshop. Int. J. Environ. Res. Public Health 2016, 13, 1054. [Google Scholar] [CrossRef]
- Li, Y.; Lane, K.; Corlin, L.; Patton, A.; Durant, J.; Thanikachalam, M.; Woodin, M.; Wang, M.; Brugge, D. Association of long-term near-highway exposure to ultrafine particles with cardiovascular diseases, diabetes and hypertension. Int. J. Environ. Res. Public Health 2017, 14, 461. [Google Scholar] [CrossRef] [PubMed]
- Mathissen, M.; Scheer, V.; Vogt, R.; Benter, T. Investigation on the potential generation of ultrafine particles from the tire–road interface. Atmos. Environ. 2011, 45, 6172–6179. [Google Scholar] [CrossRef]
- Kwak, J.H.; Kim, H.; Lee, J.; Lee, S. Characterization of non-exhaust coarse and fine particles from on-road driving and laboratory measurements. Sci. Total Environ. 2013, 458–460, 273–282. [Google Scholar] [CrossRef] [PubMed]
- Chasapidis, L.; Grigoratos, T.; Zygogianni, A.; Tsakis, A.; Konstandopoulos, A. Study of brake wear particle emissions of a minivan on a chassis dynamometer. Emiss. Control Sci. Technol. 2018, 4, 271–278. [Google Scholar] [CrossRef]
- Hagino, H.; Oyama, M.; Sasaki, S. Airborne brake wear particle emission due to braking and accelerating. Wear 2015, 334–335, 44–48. [Google Scholar] [CrossRef]
- Agudelo, C.; Deacon, P.; Marschall, M.; Markiewicz, R.; Hortet, A.; Tiwari, A.; Anderson, R. Systematic assessment of brake emissions during dynamometer tests. In Proceedings of the EuroBrake2017 Conference, Dresden, Germany, 2–4 May 2017. EB2017-VDT-026. [Google Scholar]
- Gramstat, S.; Cserhati, A.; Lugovyy, D.; Schroder, M. Investigations of brake particle emissions—Testing method, vehicle peculiarities and friction material influence. In Proceedings of the EuroBrake2017 Conference, Dresden, Germany, 2–4 May 2017. EB2017-VDT-016. [Google Scholar]
- Matějka, V.; Metinoz, I.; Wahlström, J.; Alemani, M.; Perricone, G. On the running-in of brake pads and discs for dyno bench tests. Tribol. Int. 2017, 115, 424–431. [Google Scholar] [CrossRef]
- Perricone, G.; Matějka, V.; Alemani, M.; Valota, G.; Bonfanti, A.; Ciotti, A.; Olofsson, U.; Söderberg, A.; Wahlström, J.; Nosko, O.; et al. A concept for reducing PM10 emissions for car brakes by 50%. Wear 2018, 396–397, 135–145. [Google Scholar] [CrossRef]
- zum Hagen, F.H.F.; Mathissen, M.; Grabiec, T.; Hennicke, T.; Rettig, M.; Grochowicz, J.; Vogt, R.; Benter, T. Real-Driving Measurements of Brake Wear Particle Emissions. Atmos. Environ. 2019. submitted. [Google Scholar]
- Verma, P.C.; Alemani, M.; Gialanella, S.; Lutterotti, L.; Olofsson, U.; Straffelini, G. Wear debris from brake system materials: A multi-analytical characterization approach. Tribol. Int. 2016, 94, 249–259. [Google Scholar] [CrossRef]
- Wahlström, J.; Lyu, Y.; Matějka, V.; Söderberg, A. A pin-on-disc tribometer study of disc brake contact pairs with respect to wear and airborne particle emissions. Wear 2017, 384–385, 124–130. [Google Scholar]
- Alemani, M.; Wahlström, J.; Olofsson, U. On the influence of car brake system parameters on particulate matter emissions. Wear 2018, 396–397, 67–74. [Google Scholar] [CrossRef]
- Federici, M.; Gialanella, S.; Leonardi, M.; Perricone, G.; Straffelini, G. A preliminary investigation on the use of the pin-on-disc test to simulate offbrake friction and wear characteristics of friction materials. Wear 2018, 410–411, 202–209. [Google Scholar] [CrossRef]
- Lyu, Y.; Bergseth, E.; Wahlström, J.; Olofsson, U. A pin-on-disc study on the tribology of cast iron, sinter and composite railway brake blocks at low temperatures. Wear 2019, 424–425, 48–52. [Google Scholar] [CrossRef]
- Kukutschová, J.; Filip, P. Review of Brake Wear Emissions a Review of Brake Emission Measurement Studies: Identification of Gaps and Future Needs. Non-Exhaust Emissions. In Non-Exhaust Emissions—An Urban Air Quality Problem for Public Health—Impact and Mitigation Measures; Elsevier: Amsterdam, The Netherlands, 2018; Chapter 5; pp. 102–121. [Google Scholar]
- Münchhoff, J. PMP group meeting on non-exhaust emissions—Initial input of Audi to brake particle emissions. In Proceedings of the 35th PMP IWG Meeting, Brussels, Belgium, 4–5 March 2015; Available online: https://wiki.unece.org/display/trans/PMP+35th+Session (accessed on 16 September 2019).
- Grigoratos, T.; Martini, G. Brake Wear Particle Emissions—Current Status within the PMP IWG. In Proceedings of the EuroBrake2016 Conference, Milan, Italy, 13–15 June 2016. [Google Scholar]
- Mosleh, M.; Blau, P.J.; Dumitrescu, D. Characteristics and morphology of wear particles from laboratory testing of disc brake materials. Wear 2004, 256, 1128–1134. [Google Scholar] [CrossRef]
- Wahlström, J.; Söderberg, A.; Olander, L.; Jansson, A.; Olofsson, U. A pin-on-disc simulation of airborne wear particles from disc brakes. Wear 2010, 268, 763–769. [Google Scholar] [CrossRef]
- Sanders, P.G.; Xu, N.; Dalka, T.M.; Maricq, M. Airborne brake wear debris: Size distributions, composition, and a comparison of dynamometer and vehicle tests. Environ. Sci. Technol. 2003, 37, 4060–4069. [Google Scholar] [CrossRef]
- Iijima, A.; Sato, K.; Yano, K.; Kato, M.; Tago, H.; Kato, M.; Kimura, H.; Furuta, N. Particle size and composition distribution analysis of automotive brake abrasion dusts for the evaluation of antimony sources of airborne particulate matter. Atmos. Environ. 2007, 41, 4908–4919. [Google Scholar] [CrossRef]
- Osterle, W.; Bresch, H.; Dorfe, I.; Fink, C.; Giese, A.; Prietzel, C.; Seeger, S.; Walter, J. Examination of airborne brake dust. In Proceedings of the 6th European Conference on Braking JEF 2010, Lille, France, 24–25 November 2010. [Google Scholar]
- Kukutschová, J.; Moravec, P.; Tomašek, V.; Matějka, V.; Smolik, J.; Schwarz, J.; Seidlerova, J.; Šafařova, K.; Filip, P. On airborne nano/micro-sized wear particles released from low-metallic automotive brakes. Environ. Pollut. 2011, 159, 998–1006. [Google Scholar] [CrossRef]
- Vlcek, J.; Drongova, L.; Topinkova, M.; Matějka, V.; Kukutschova, J.; Vavro, M.; Tomková, V. Identification of phase composition of binders from alkali-activated mixtures of granulated blast furnace slag and fly ash. Ceramics—Silikáty 2014, 58, 79–88. [Google Scholar]
- Mathissen, M.; Evans, C. “Lowbrasys Brake Wear Cycle—3h LACT”. Mendeley Data, v1, 2019. Available online: http://dx.doi.org/10.17632/4cgs6myx9d.1 (accessed on 16 September 2019).
- Rubino, L.; Philips Paul, R.; Twigg Martyn, V. Measurements of Ultrafine Particle Number Emissions from a Light-Duty Diesel Engine Using SMPS, DMS, ELPI and EEPS; SAE Technical Paper; SAE: Warrendale, PA, USA, 2005; ISSN 0148-7191. [Google Scholar] [CrossRef]
- Kaminski, H.; Kuhlbusch, T.A.J.; Rath, S.; Götz, U.; Sprenger, M.; Wels, D.; Polloczek, J.; Bachmann, V.; Dziurowitz, N.; Kiesling, H.-J.; et al. Comparability of mobility particle sizers and diffusion chargers. J. Aerosol. Sci. 2013, 57, 156–178. [Google Scholar] [CrossRef]
- Zimmerman, N.; Jeong, C.-H.; Wang, J.M.; James, M.R.; Wallace, J.S.; Evans, G.J. A source-independent empirical correction procedure for the fast mobility and engine exhaust particle sizers. Atmos. Environ. 2015, 100, 178–184. [Google Scholar] [CrossRef]
- Perricone, G.; Matĕjka, V.; Alemani, M.; Wahlström, J.; Olofsson, U. A Test Stand Study on the Volatile Emissions of a Passenger Car Brake Assembly. Atmosphere 2019, 10, 263. [Google Scholar] [CrossRef]


| Reference | Method | Type of System |
|---|---|---|
| [36] | Pin-on-disc | Open system |
| [37] | Closed system | |
| [28] | Closed system | |
| [29] | Closed system | |
| [30] | Closed system | |
| [31] | Closed system | |
| [32] | Closed system | |
| [38] | Brake Dyno | Open system |
| [39] | Open system | |
| [40] | Open system | |
| [8] | Closed system | |
| [9] | Closed system | |
| [41] | Closed system | |
| [22] | Closed system | |
| [26] | Closed system | |
| [11] | Closed system | |
| [24] | Closed system | |
| [23] | Closed system | |
| [27] | Closed system | |
| [21] | Chassis dyno | Open system |
| [19] | On-Road | Open system |
| [20] | Open system |
© 2019 by the authors. Licensee MDPI, Basel, Switzerland. This article is an open access article distributed under the terms and conditions of the Creative Commons Attribution (CC BY) license (http://creativecommons.org/licenses/by/4.0/).
Share and Cite
Mathissen, M.; Grigoratos, T.; Lahde, T.; Vogt, R. Brake Wear Particle Emissions of a Passenger Car Measured on a Chassis Dynamometer. Atmosphere 2019, 10, 556. https://doi.org/10.3390/atmos10090556
Mathissen M, Grigoratos T, Lahde T, Vogt R. Brake Wear Particle Emissions of a Passenger Car Measured on a Chassis Dynamometer. Atmosphere. 2019; 10(9):556. https://doi.org/10.3390/atmos10090556
Chicago/Turabian StyleMathissen, Marcel, Theodoros Grigoratos, Tero Lahde, and Rainer Vogt. 2019. "Brake Wear Particle Emissions of a Passenger Car Measured on a Chassis Dynamometer" Atmosphere 10, no. 9: 556. https://doi.org/10.3390/atmos10090556
APA StyleMathissen, M., Grigoratos, T., Lahde, T., & Vogt, R. (2019). Brake Wear Particle Emissions of a Passenger Car Measured on a Chassis Dynamometer. Atmosphere, 10(9), 556. https://doi.org/10.3390/atmos10090556