Article

Generative Adversarial Networks Capabilities for Super-Resolution Reconstruction of Weather Radar Echo Images

1
College of Software Engineering, Chengdu University of Information Technology, Chengdu 610225, China
2
College of Electronic Engineering, Chengdu University of Information Technology, Chengdu 610225, China
3
CMA Key Laboratory of Atmospheric Sounding, Chengdu 610225, China
*
Author to whom correspondence should be addressed.
Atmosphere 2019, 10(9), 555; https://doi.org/10.3390/atmos10090555
Submission received: 17 July 2019 / Revised: 18 August 2019 / Accepted: 10 September 2019 / Published: 16 September 2019
(This article belongs to the Section Meteorology)

Abstract

:
Improving the resolution of degraded radar echo images of weather radar systems can aid severe weather forecasting and disaster prevention. Previous approaches to this problem include classical super-resolution (SR) algorithms such as iterative back-projection (IBP) and a recent nonlocal self-similarity sparse representation (NSSR) that exploits the data redundancy of radar echo data, etc. However, since radar echoes tend to have rich edge information and contour textures, the textural detail in the reconstructed echoes of traditional approaches is typically absent. Inspired by the recent advances of faster and deeper neural networks, especially the generative adversarial networks (GAN), which are capable of pushing SR solutions to the natural image manifold, we propose using GAN to tackle the problem of weather radar echo super-resolution to achieve better reconstruction performance (measured in peak signal-to-noise ratio (PSNR) and structural similarity index (SSIM)). Using authentic weather radar echo data, we present the experimental results and compare its reconstruction performance with the above-mentioned methods. The experimental results showed that the GAN-based method is capable of generating perceptually superior solutions while achieving higher PSNR/SSIM results.

1. Introduction

Severe weather events can cause serious environmental, social, and economic damages. Data from China’s first national climate change adaptation strategy issued in 2013 show that extreme weather events have killed more than 2000 people each year on average since the 1990s. They also resulted in more than 200 billion yuan ($32 billion) in direct economic damage annually [1]. The new generation of the Doppler weather radar system, which is capable of detecting the motion of rain droplets and the intensity of precipitation, plays an important part in locating and determining the type of severe convective weather events. Certain severe mesoscale convective weather systems emerge abruptly and have short durations. They tend to be hard to notice in the early stages of development and can develop rapidly in the middle and late stages. For example, thunderstorms often produce short-lived, small-scale hazardous weather events, including hail, damaging winds, and tornadoes that last only a few minutes. This results in fewer valid data in the distance direction due to radar resolution limitations, and hence echo images with limited resolution. Also, due to certain constraints, it’s sometimes difficult to obtain the radar base data of weather events; only degraded low resolution radar echo images are available. Enhancing the resolution of weather radar echo images can lead to better perceptual quality for human viewers, more detailed analysis about the meteorological targets in question, better forecasting performance of echo extrapolation models, and better support for extreme weather forecasting, which are all conducive to disaster prevention and mitigation.
Peleg et al. [2] studied and contributed to the understanding of the relationship between air temperature and convection by analyzing the characteristics of rainfall at the storm and convective rain cell scale using high spatial-temporal resolution (1 km, 5 min) weather radar data estimates from a uniquely long weather radar record (24 years). Smith et al. [3] introduced a long-term, high-resolution radar rainfall data set for the Baltimore metropolitan area covering 2000–2009, and utilized it to characterize spatial heterogeneities in rainfall for the Baltimore metropolitan region, both in terms of mean rainfall and rainfall extremes. The study found that high-resolution rainfall fields are especially useful for examining the distribution of rainfall from a drainage basin perspective. Fries et al. [4] used high-resolution radar images and ground station data to provide high-resolution precipitation maps required by the precise estimation of precipitation quantities in tropical mountain regions. These studies suggest that weather radar data of higher spatial-temporal resolution contains more detailed information about the atmospheric motion and meteorological targets that allow for more timely forecasts and an in-depth analysis of weather events.
Thus, in the literature, various super-resolution methods have been proposed. Resolution can be improved by newer radar hardware facilities (e.g., larger antenna, denser networks) or, faced with the constraints imposed by existing systems, by implementing a different azimuthal sampling strategy in conjunction with a narrower antenna pattern [5]. Meanwhile, there are research studies focused on radar base data super-resolution without changing the radar hardware or sampling strategy. A minimum entropy spectrum extrapolation technique for radar super-resolution proposed by Yao et al. [6] is one of the earlier methods. Nielsen et al. [7] proposed a numerical method to generate a high temporal resolution precipitation time series by combining weather radar measurements with a nowcast model. The proposed interpolation method performs better than a traditional interpolation of weather radar rainfall where the radar observation is considered constant in time between measurements. Gallardo-Hernando et al. [8] proposed super-resolution techniques based on auto-regressive coefficients for wind turbine clutter spectrum enhancement in meteorological radars. Li et al. [9,10] proposed a two-dimensional deconvolution technique on oversampled reflectivity data to simultaneously improve range and angular resolution, whose experimental results were shown to be efficient for range and angular resolution enhancement of reflectivity data. However, deconvolution is an ill-posed problem, of which the solution is not only sensitive to noise, but would also easily deteriorate by the noise amplification when excessive iterations are conducted. Tan et al. [11] proposed a penalized maximum likelihood angular super-resolution method to tackle the above-mentioned problems of deconvolution. The experimental results demonstrate the effectiveness and superior performance of the proposed method. Li et al. [12] also proposed a new super-resolution model based on the idea of sub-division in one resolution volume for geostationary weather radar and an oversampling technique along the radar’s spiral scan track. The experimental results show that the proposed model and reconstruction process are efficient for the horizontal resolution improvement of reflectivity data, and more refined details could be present through reconstruction. Zha et al. [13] proposed a novel method for angular super-resolution imaging in scanning radar using the alternating direction method for solving the constrained optimization problem, and the simulation results showed that it outperformed a number of existing deconvolution algorithms in terms of stability and precision. Wu et al. [14] proposed a novel angular super-resolution approach for scanning radar using truncated singular value decomposition (TSVD) with the least squares optimization technique. The experimental results demonstrate that the proposed method can improve the azimuth resolution without noise amplification and loss of edge information. He et al. [15] proposed an improved iterative back-projection algorithm to improve data resolution based on a sliding window reconstruction model using the temporal correlation constraint. Zeng et al. [16] analyzed the sparsity and data redundancy of weather radar data and studied its temporal and spatial correlation and proposed a compression scheme based on prediction coding, providing a theoretical basis for using data correlation for weather radar echo super-resolution. Zhang et al. [17] proposed a novel nonlocal self-similarity sparse representation (NSSR) model for weather radar echo super-resolution that exploits the sparse data composition and data redundancy of weather radar echo data. The experimental results demonstrated that the proposed NSSR outperformed current general-purpose radar echo super-resolution methods.
However, for the hardware-based methods, a large-scale upgrade of radar hardware facilities to radar stations for obtaining super-resolution radar data might not be a viable option due to time and money constraints, as well as other factors. Also, traditional radar echo super-resolution methods may have problems adapting to new data or suffer from a long iteration time [17]. For challenging degraded echo images, the textural detail in the reconstructed echoes of traditional approaches is typically absent, resulting in unsatisfying super-resolution (SR) solutions. Furthermore, some current traditional [18,19,20] or deep learning-based [21,22] weather radar echo extrapolation methods and forecasting models were primarily based on weather radar echo maps, which are often constant altitude plan position indicator (CAPPI) images. As the prediction lead time increases, the radar echo extrapolated from these models becomes increasingly blurred and deformed. Therefore, more robust and powerful radar echo super-resolution methods are called for.
In recent years, deep learning techniques have seen rapid developments, which are known to surpass traditional methods at various challenging tasks such as image classification and spatial time-series (e.g., weather data) prediction. Shi et al. [21] proposed a convolutional Long short-term memory (ConvLSTM) network and used it to build an end-to-end trainable model for the precipitation nowcasting problem that outperforms traditional methods. Krinitskiy et al. [23] developed a novel approach for the detection and classification of Polar mesocyclones based on the use of deep convolutional neural networks (DCNNs). Booz et al. [24] proposed a deep learning-based weather forecast system and analyzed the relationship between the prediction accuracy and data volume, as well as data recency. These studies demonstrate deep learning’s superior performance in learning the complex inherent structures and patterns of weather data.
Deep learning-based super-resolution models have also been actively explored and often achieve the state-of-the-art performance on various SR benchmarks [25]. Various deep learning-based SR methods have been proposed, ranging from the early convolutional neural networks (CNN)-based method (e.g., SRCNN [26,27]) to the recent generative adversarial nets (GAN) [28] based approach (e.g., SRGAN [29]), which is capable of generating realistic textures during single image super-resolution. However, very few previous studies have examined the weather radar echo super-resolution problem from the deep learning perspective. Therefore, it’s interesting to explore how these deep learning SR models perform on weather radar level-II data products without prior knowledge compared with traditional super-resolution methods.
In this paper, we propose a GAN-based weather radar super-resolution method to tackle the challenging task of super-resolution reconstruction of weather radar echo images. Here, our focus is on the capability of GANs to generate perceptually superior solutions of weather radar echo super-resolution compared with the classical improved iterative back-projection (IBP) algorithms [15] and a nonlocal self-similarity sparse representation (NSSR) [17] method that utilizes the data redundancy of radar data.
The rest of this paper is organized as follows: Section 2 presents the problem definitions of weather radar echo super-resolution reconstruction and an overview of generative adversarial networks (GAN) in the context of radar echo super-resolution. We also provide a brief introduction to echo image quality assessment. Section 3 describes the proposed weather radar super-resolution method based on generative adversarial networks. Section 4 details the experiment and presents the experimental results. Section 5 concludes this paper.

2. Radar Echo Super-Resolution Reconstruction

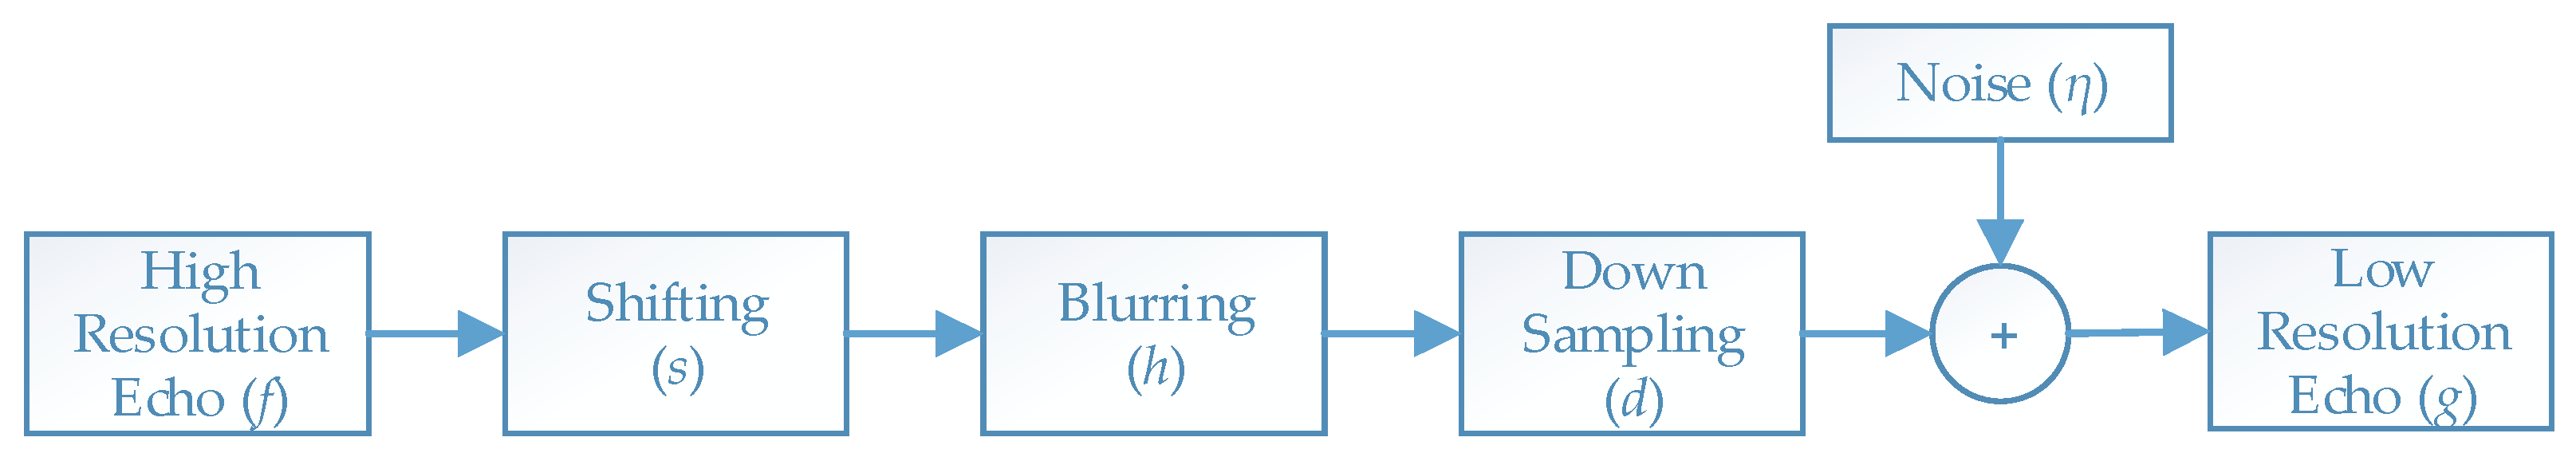
2.1. Problem Definitions

In real-life systems, radar echo maps are often constant altitude plan position indicator (CAPPI) images. Due to certain constraints mentioned in Section 1, it’s sometimes difficult to obtain the radar base data of weather events [4]; instead, only degraded low resolution radar echo maps are available, or the higher quality echo images have been lost. Weather radar echo super-resolution is then defined as the task of recovering high-resolution (HR) echoes from low-resolution (LR) echoes. Note that this definition of super-resolution, borrowed from image processing paradigms and performed on the image level of moment radar base data, is different from the process of improving the spatial-temporal resolution of radar base data by upgrading radar hardware facilities or changing the sampling strategy [5]. Generally, the LR echo can be modeled as the output of a degradation process:
g ( m , n ) = Ψ ( f ( x ,   y ) ;   δ )
Here, g is an observed LR echo image of size m × n , f is the corresponding HR echo image of size x × y , Ψ represents a degradation mapping function, and δ denotes the parameters of the degradation process. The degradation process of weather radar echo can be modeled with disruptive factors such as blurring, deformation, shifting, noise, etc., which result in a low-resolution imaging model, as shown in Figure 1.
The inclusion of these factors in the model of Equation (1) results in:
g ( m , n ) = d ( h ( s ( f ( x ,   y ) ) ) ) + η ( m ,   n )
where s is a shifting function, h is a blurring function, d is a down-sampling operator, and η is an additive noise. In matrix form, this can be rewritten as:
g = A f + η
in which A stands for all the above-mentioned degradation factors. This imaging model has been used in many SR works [30]. The reconstruction process of LR echoes is the reverse process of the LR imaging model, as shown in Figure 2.
The blurring function models any blurring effect that is imposed on the LR observed echo, such as for example that introduced by the scanning of radar antennas. The shifting function changes depending on the type of motion between the HR echo and the LR observations. Some classical works mostly focus on the discussion of the motion prediction and blur estimation [30]. However, under general conditions, the degradation process (i.e., Ψ and δ in Equation (1)) is unknown and ill-posed; sometimes, only LR echoes are provided. In this case, researchers are required to recover HR echo from the corresponding LR echo, so that f r is nearly identical to the ground truth HR echo f , following the process:
f r ( x , y ) = R ( g ( m , n ) ; θ )
where R is the super-resolution reconstruction model, and θ represents the parameters of R . To this end, the objective of weather radar echo super-resolution is as follows:
θ ^ = arg min θ L ( f r ,   f ) + λ Φ ( θ )
where L ( f r ,   f ) represents the loss function between the generated HR echo f r and the ground truth echo f ; Φ ( θ ) is the regularization term, and λ is its tuning hyper-parameter. Although the most popular and default choice of loss function for SR is pixel-wise mean squared error (i.e., pixel loss), more powerful models tend to use a combination of multiple loss functions, which will be covered in Section 2.2.

2.2. GAN for Radar Echo Super-Resoultion Reconstruction

Recent advances in deep learning, especially generative adversarial networks (GAN) [28], provide some useful inspirations on how to tackle the problem formulated in Section 2.1. Due to the generative nature of GAN, it provides a powerful framework for generating plausible-looking natural images with high perceptual quality. It encourages the reconstructions to move toward regions of the search space with a high probability of containing echoes that are closer to the HR echo manifold [29]. Also, according to the philosophy of deep learning approaches, if we have a reasonable end-to-end model and sufficient data for training, we are able to train a powerful model that is capable of generating high-quality reconstruction solutions. The weather radar echo super-resolution problem satisfies the data requirement because it’s easy to collect a huge amount of radar echo data continuously.
Generative adversarial networks (GANs), as proposed by Goodfellow et al. [28], are deep neural net architectures comprised of two nets, competing against one another (thus, the “adversarial”). Two models are simultaneously trained: a generative model G that captures the data distribution, generating new data instances, and a discriminative model D that evaluates them for authenticity, i.e., estimates the probability that a sample came from the training data rather than G . The training procedure for G is to maximize the probability of D making a mistake. In the original work [28], D and G play the following two-player minimum–maximum (min–max) game with the value function V ( D , G ) :
min G   max D V ( D , G ) = E x p d a t a ( x ) [ log D ( x ) ] + E z p z ( z ) [ log ( 1 D ( G ( z ) ) ) ]
where p d a t a ( x ) is the learned distribution over data x , and p z ( z ) is a prior on input noise. This model provides a powerful framework for generating plausible-looking natural images with high perceptual quality. In the context of radar echo super-resolution, a discriminator network D θ D is defined and optimized in an alternating manner along with a generator network G θ G to solve the adversarial min–max problem:
min θ G   max θ D E f p t r a i n ( f ) [ log D θ D ( f ) ] + E f r p G ( f r ) [ log ( 1 D θ D ( G θ G ( f r ) ) ) ]
The general goal is to train a generative model G to fool a differentiable discriminator D that is trained to distinguish super-resolved echoes from real echoes. With this approach, the generator can learn to create solutions that are highly similar to real echoes, and thus difficult to classify by D . This encourages perceptually superior solutions residing in the subspace and manifold of natural echo images [29]. This is in contrast to SR solutions obtained by minimizing pixel-wise error measurements, such as the mean squared error (MSE) [27], which while achieving particularly high PSNR, often lack high-frequency content, which results in perceptually unsatisfying solutions with overly smooth textures.
The definition of loss function l S R for evaluating the quality of generated radar echoes compared with ground-truth echoes in training is critical for the performance of a generator network. While l S R is commonly modeled based on the MSE, a perceptual loss, proposed by Johnson et al. [31] and improved in [29], was designed to assess a solution with respect to perceptually relevant characteristics. The perceptual loss was formulated as the weighted sum of a content loss ( l x S R ) and an adversarial loss component ( l G e n S R ):
l S R = l x S R + 10 3 l G e n S R
possible choices for the content loss l x S R include pixel-wise MSE loss [31,32] and Visual Geometry Group (VGG) loss [29,33] that is closer to perceptual similarity. The adversarial loss l G e n S R is defined based on the probabilities of the discriminator D θ D ( G θ G ( f ) ) over all the training samples as:
l G e n S R = n = 1 N log D θ D ( G θ G ( f ) )
where D θ D ( G θ G ( f ) ) is the probability that the reconstructed echo G θ G ( f ) is a natural-looking HR echo.

2.3. Radar Echo Image Quality Assessment

The process of determining image quality is termed image quality assessment (IQA). In general, IQA methods include subjective methods based on the human observer’s perceptual evaluation such as mean opinion score (MOS) and objective methods based on computational models (e.g., peak signal-to-noise ratio (PSNR) and structural similarity index (SSIM)). The subjective methods are close to human perception, but usually inconvenient and expensive; so, the objective methods are the most widely used in SR works, even though they are sometimes unable to capture human visual perception very accurately [29].
Peak signal-to-noise ratio (PSNR) is commonly used to measure the reconstruction quality of lossy transformation (e.g., image compression). For radar echo super-resolution, PSNR is defined via the maximum possible pixel value (denoted as L) and the mean squared error (MSE) between HR–LR echo pairs. Given the ground truth echo f and reconstructed echo f r , both of which have N × N pixels, the MSE and the PSNR (in dB) between them are defined as follows:
M S E = 1 N i = 1 N ( f ( i ) f r ( i ) ) 2
P S N R = 10 log 10 ( L 2 M S E )
In general cases using 8-bit image representations, L equals 255, and the typical values for the PSNR vary from 20 to 40, where higher is better. When L is fixed, the PSNR correlates only to the pixel-level MSE between echoes, affected only by the difference between the pixel values at the same position. This leads to PSNR’s poor performance in representing the quality of the super-resolved echoes.
The human visual system (HVS) is highly adapted to extract structural information from the viewing field [34]. Then, the structural similarity index (SSIM) [35] is proposed for measuring the structural similarity between images, based on three components of an image: luminance, contrast, and structure. It’s calculated on various sliding windows of an image. The SSIM index between two original HR echo f and its reconstructed counterpart f r of common size N × N is defined as:
S S I M ( f , f r ) = ( 2 μ f μ f r + c 1 ) ( 2 σ f f r + c 2 ) ( μ f 2 + μ f r 2 + c 1 ) ( σ f 2 + σ f r 2 + c 2 )
where μ and σ are the mean and the standard deviation of the image intensity, estimating luminance and contrast; σ f f r is the covariance of f and f r , measuring structural similarity; c 1 = ( k 1 L ) 2 and c 2 = ( k 2 L ) 2 are two variables stabilizing the division with a weak denominator with k 1 1 , k 2 1 , and L being the dynamic range of the pixel values.
The resultant SSIM index is a decimal value between −1 and 1, with value 1 achievable in the case of two identical sets of data, which indicates perfect structural similarity. A value of 0 indicates no structural similarity. Since the SSIM evaluates the reconstruction quality from the perspective of the HVS, it better suits the requirements of perceptual assessment [36], and is also widely used in SR models.
Radar echo data are sampled at discrete angles along each angle of elevation, and hence are only an approximation of reality [37]. For some weather forecasting models, the visual representation of the radar echo image is insignificant. This might raise concern about the validity of image processing-based evaluation metrics on weather radar echo images. However, as mentioned in Section 1, some current weather radar echo extrapolation methods were primarily based on weather radar echo maps, which are often constant altitude plan position indicator (CAPPI) images. Several verification techniques were proposed in the literature to characterize the forecast performance of these models (e.g., Gilbert skill score, variograms, etc.). However, no single verification technique gives a complete picture of the forecast performance, and assessing the reconstructed performance of echo images in terms of these metrics is out of scope of this study. Due to the necessity of comparing the performance of reconstruction with literature works and the lack of appropriate forecasting performance-oriented evaluation metrics for reconstructed echo image quality, image processing-based evaluation methods were used in this study. Since objective methods are currently the most widely used evaluation criteria for SR models [25], we use PSNR and SSIM in our assessment of the GAN model for weather radar echo super-resolution.

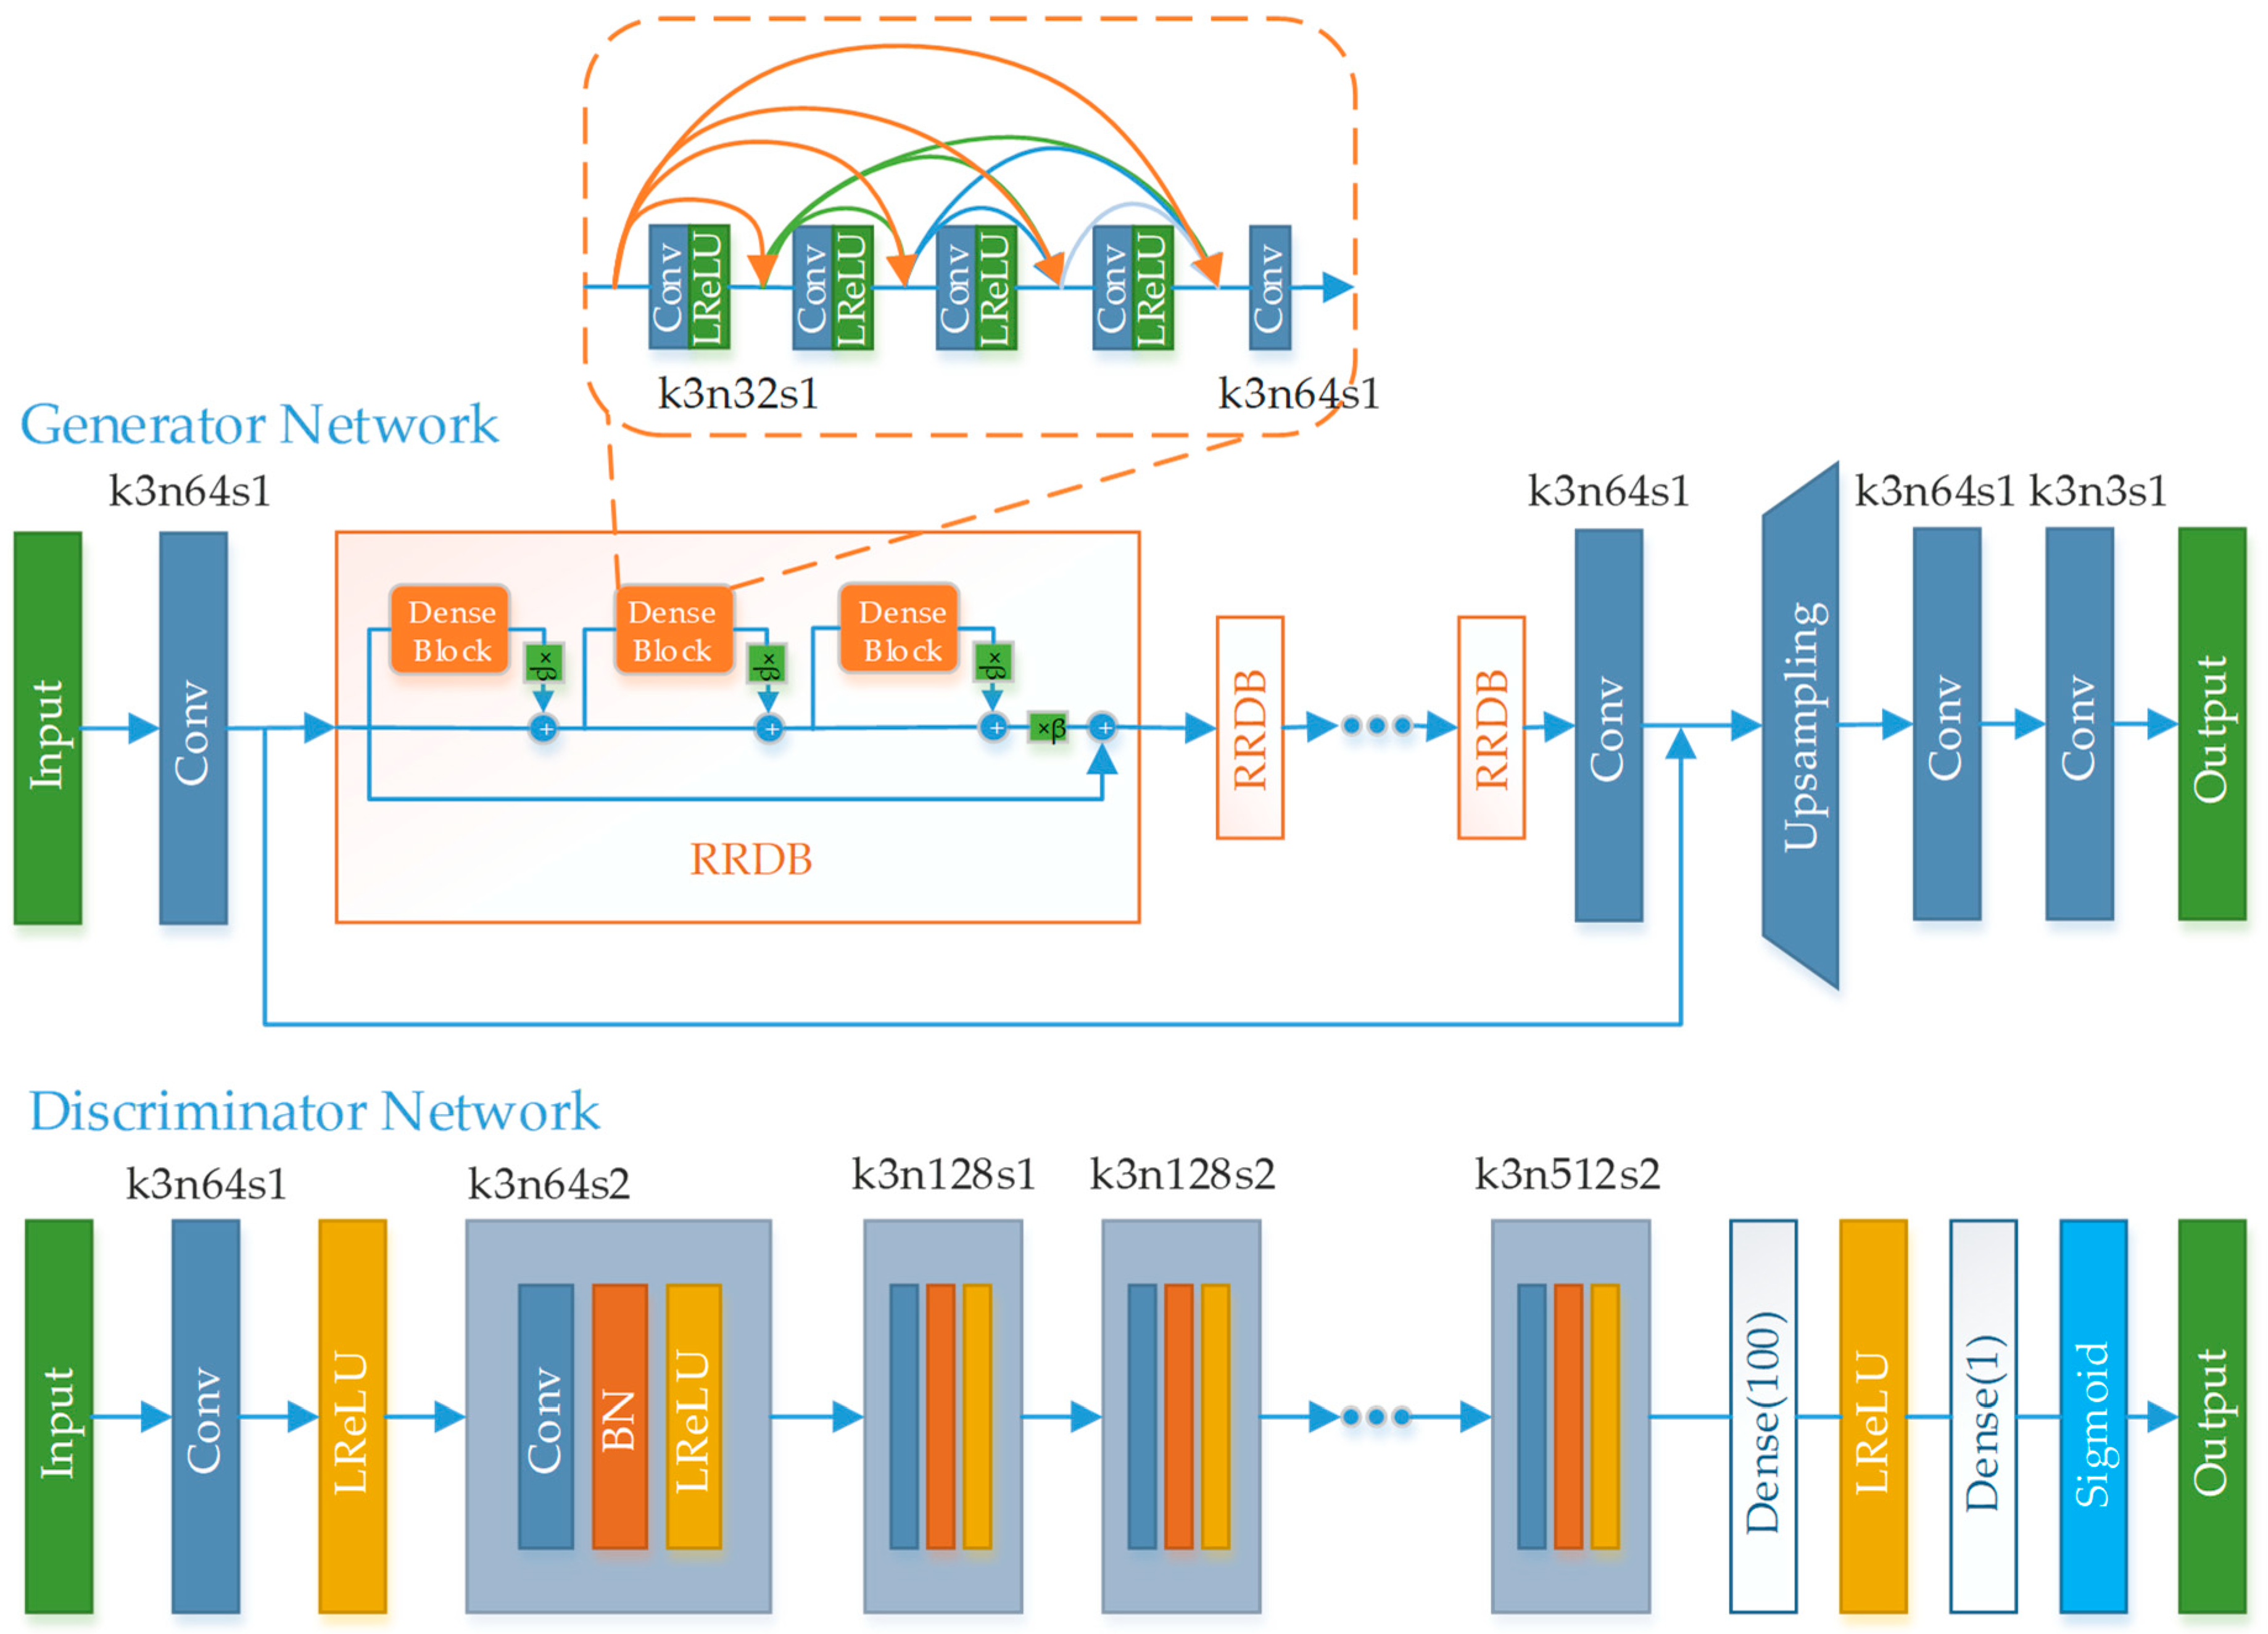
3. Generative Adversarial Network of the Proposed Method
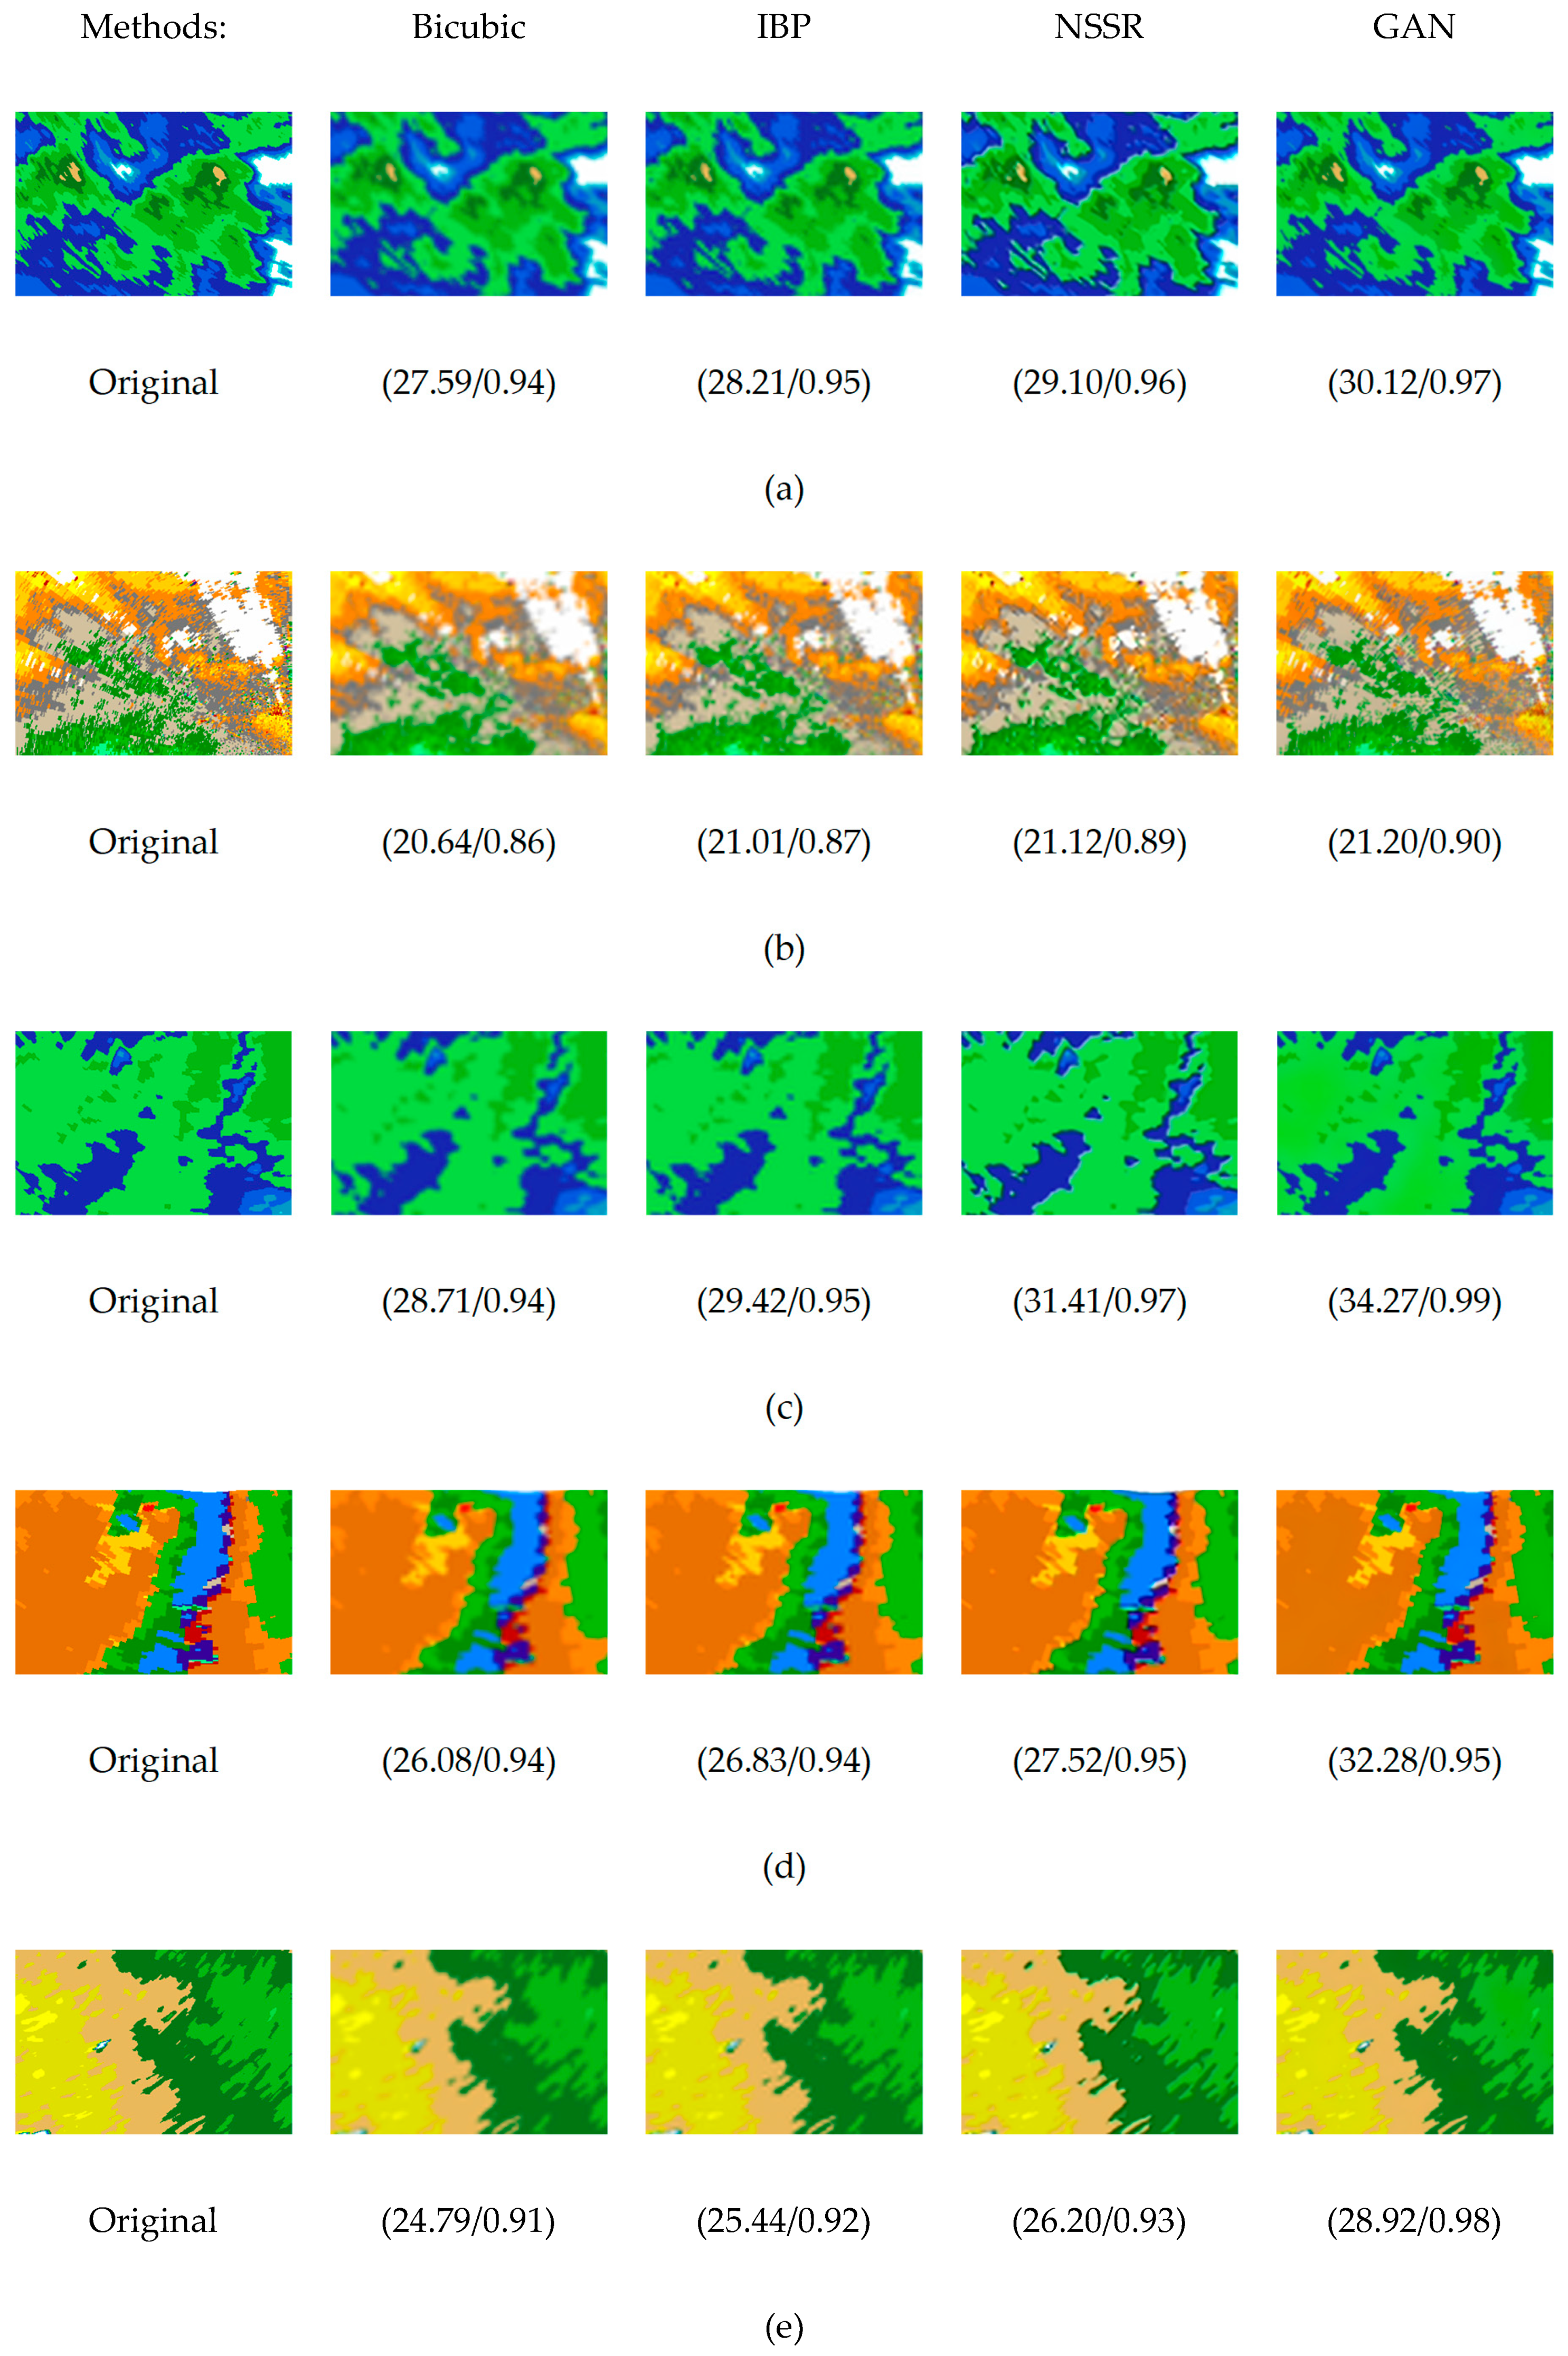
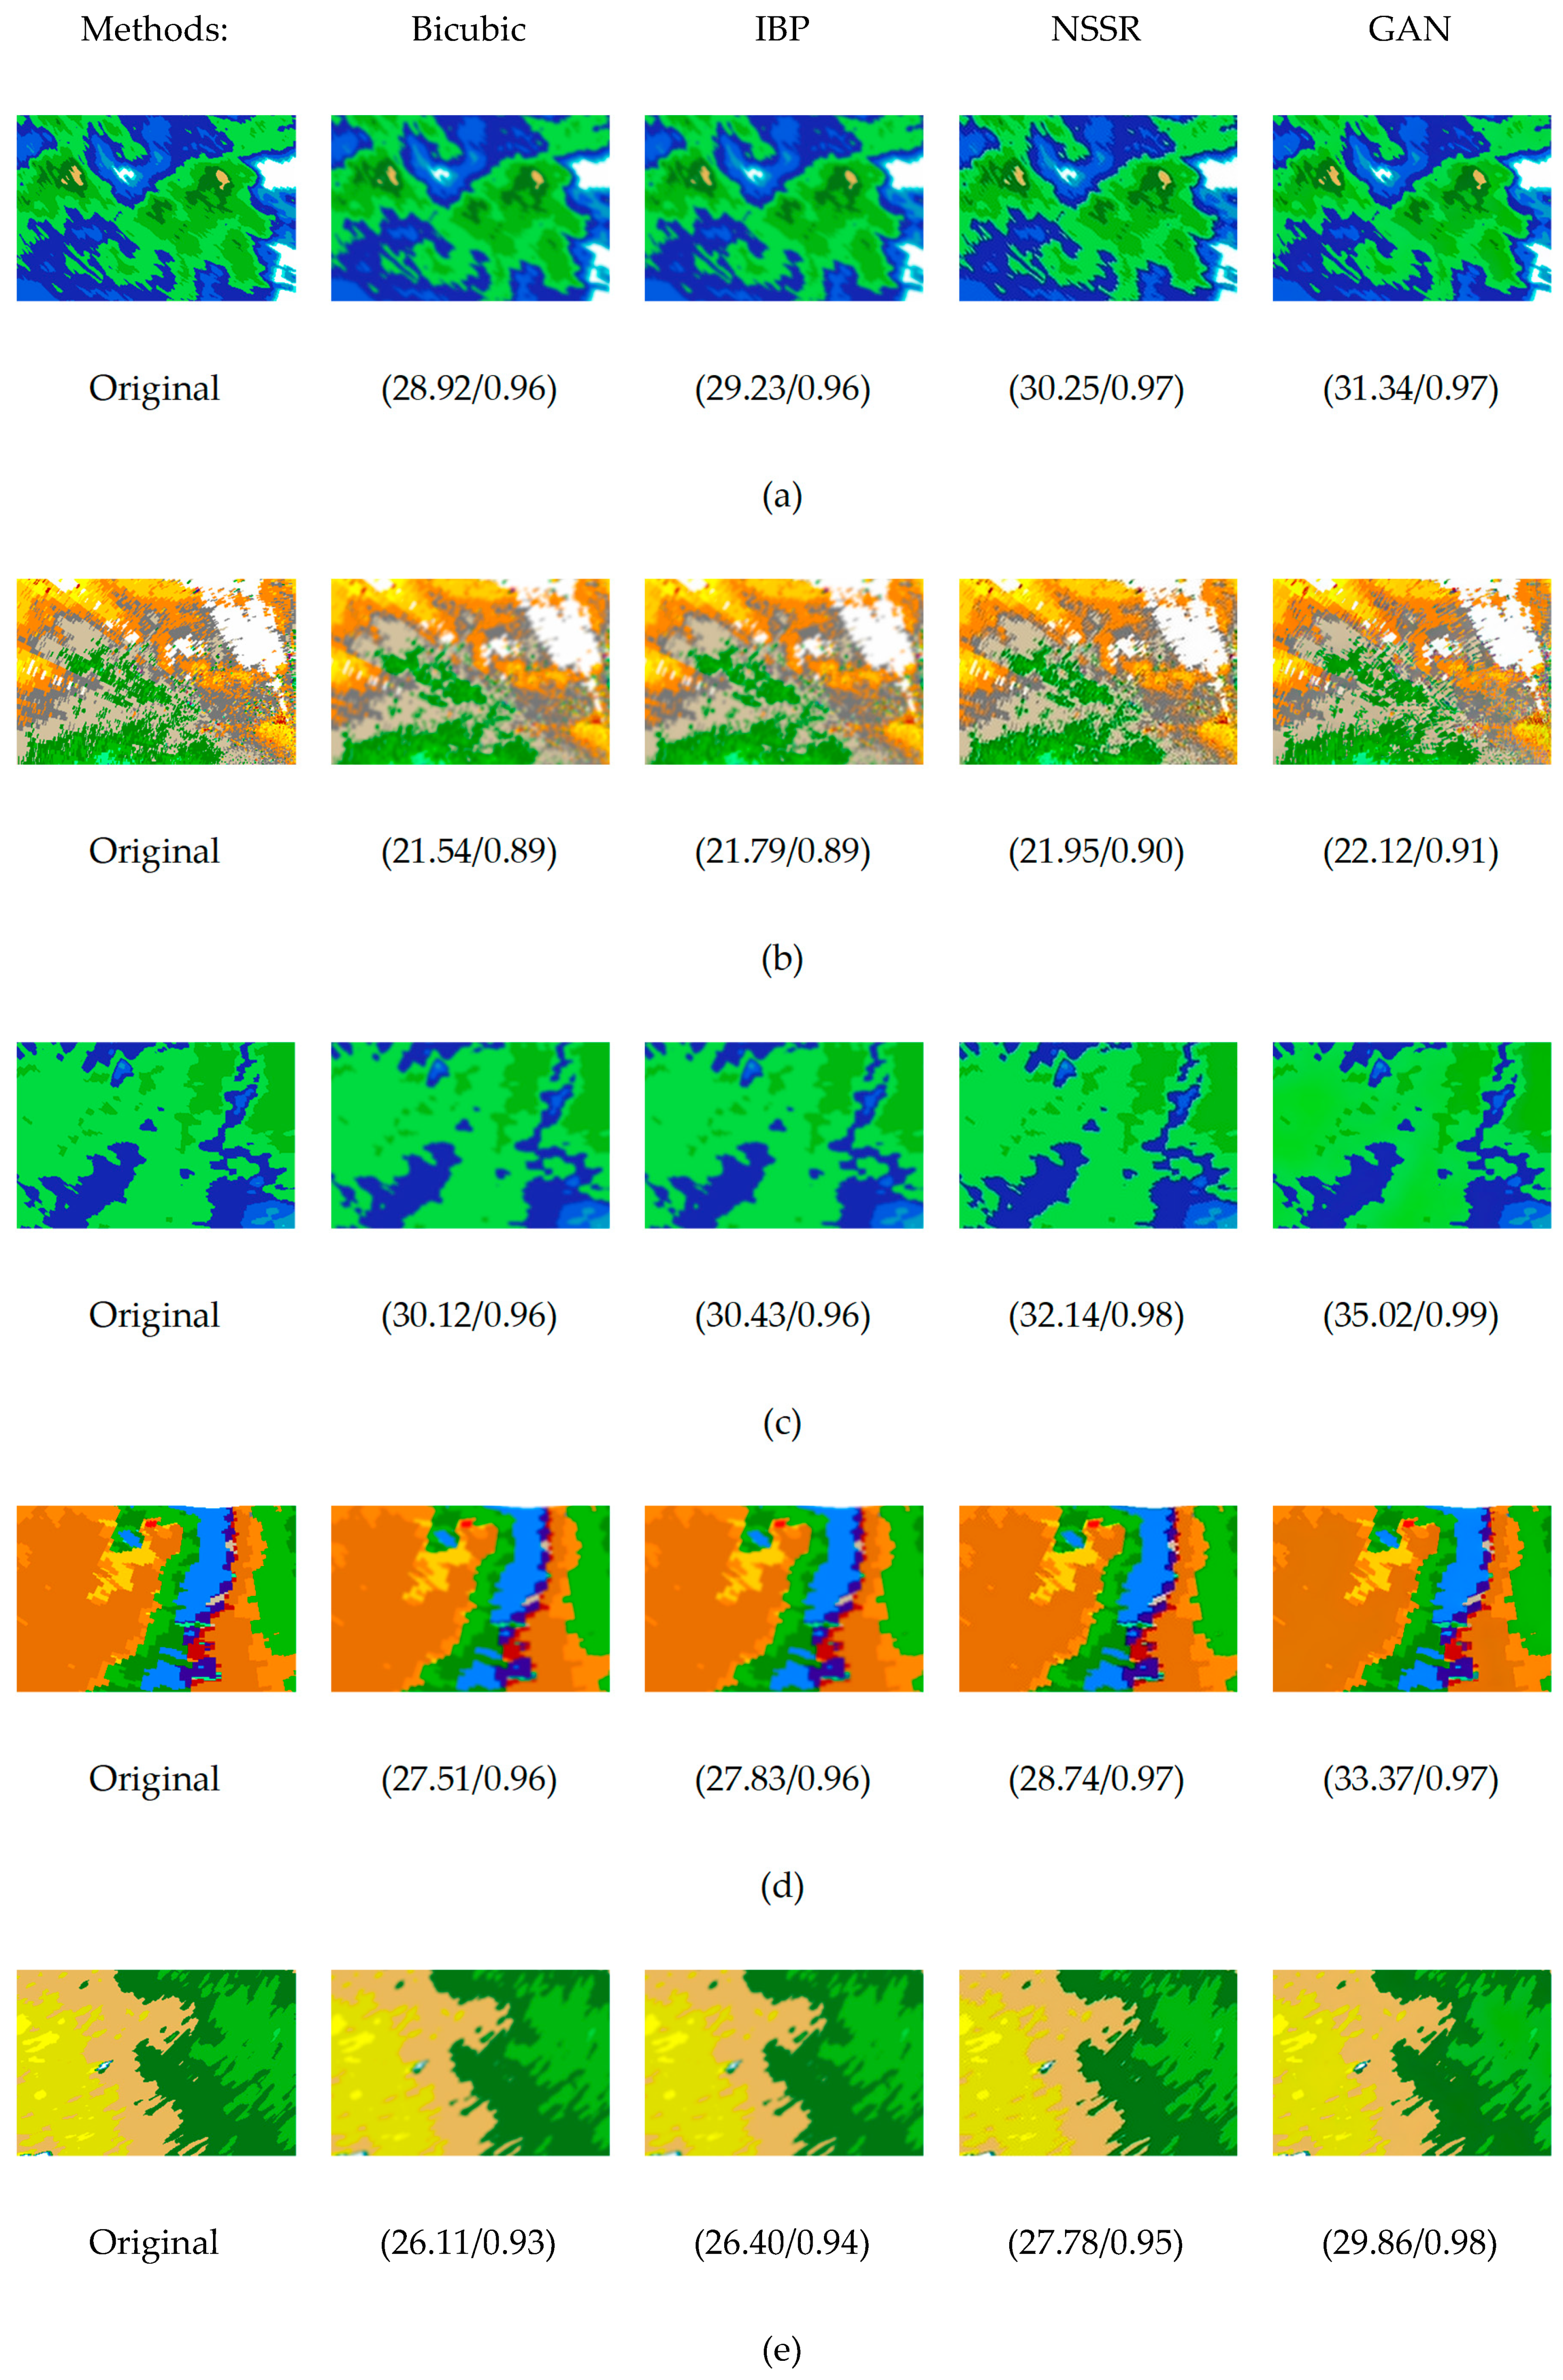
We propose using a generative adversarial network (GAN) for the problem of weather radar echo super-resolution (Figure 3). We employ the basic architecture of SRGAN [29], which is a seminal work that is capable of generating realistic textures during single image super-resolution, since radar echo tend to have rich edge information and contour textures. All batch normalization (BN) [38] layers in the generator network were removed, and a new deep residual-in-residual dense block (RRDB) structure proposed in ESRGAN (enhanced SRGAN) [39] was added. BN layers were found to introduce unpleasant artifacts and limit the generalization ability when the statistics of HR and LR data differ a lot [39]. Removing BN layers has empirically proven to increase performance while reducing computational complexity and memory [40]. The design of a deeper and more complex structure RRDB, allowing for residual connection across different architectural layers of the network, is based on the observation that more layers and connections could always enhance performance [41].
The discriminator network that discriminates real HR echoes from generated SR solutions was trained to solve the maximization problem in Equation (7). It was designed following the architectural guidelines in [43]. The discriminator network output was also improved based on the Relativistic GAN [44]. In standard GAN, the generator G is trained to increase the probability that fake data is real, but it will also decrease the probability that real data is real, since it would account for a priori knowledge that half of the data in the mini-batch is fake [44]. The standard discriminator estimates the probability that one input echo x is real and natural (1 for real and 0 for fake), as formulated in Equation (13):
D ( x ) = σ ( C ( x ) )
where σ is the sigmoid function and C ( x ) is the non-transformed discriminator output. However, a relativistic discriminator, denoted as D R a , tries to predict the probability that a real echo x r is relatively more realistic than a fake one x f , as formulated in Equation (14):
D R a ( x r , x f ) = σ ( C ( x r ) E x f [ C ( x f ) ] )
where E x f [ ] represents the operation of taking the average for all fake data in the mini-batch.
Then, the discriminator loss is defined as:
L D R a = E x r [ log ( D R a ( x r , x f ) ) ] E x f [ log ( 1 D R a ( x f , x r ) ) ]
The adversarial loss for a generator is in a symmetrical form:
L G R a = E x r [ log ( 1 D R a ( x r , x f ) ) ] E x f [ log ( D R a ( x f , x r ) ) ] ,
where x f = G ( x i ) and x i stands for the input LR echoes. Since the adversarial loss for a generator contains both x r and x f , the generator benefits from the gradients from both generated data and real data in adversarial training, and hence helps to learn sharper edges and more detailed textures. The total loss for the generator, as put forward in [39], is:
L G = L p e r c e p + λ L G R a + η L 1
where L 1 = E x i G ( x i ) y 1 is the content loss that evaluate the 1-norm distance between recovered image G ( x i ) and the ground-truth y ; λ , η are the coefficients to balance different loss terms, and L p e r c e p is the perceptual loss defined in Equation (8) [29]. Extensive MOS tests [29] show that even though the SR models trained with adversarial loss and content loss may achieve lower PSNR compared to those trained with pixel loss, they bring significant gains in perceptual quality.

4. Experiments

4.1. Data

We used a level-II data product (images plotted from base weather radar echo data) from the S-band China New-Generation Weather Radar (CINRAD-SA) and the X-band dual-polarization Radar (XPRAD) provided by China Meteorological Administration. For CINRAD-SA radar, we used data from the 2008 sustained blizzard event in Yancheng, Jiangsu; the strong convective wind and hail event in Dangyang, Hubei on 2 April 2008; the tornado and hail event in Yancheng, Jiangsu on 27 May 2008; the Typhoon Hagupit landing in Haikou, Guangdong on 23 September 2008; and the Typhoon event in Xuzhou, Jiangsu on 18 August 2018. For XPRAD radar, we used the rainfall data in the South China Heavy Rainfall Observation Experiment in May 2016.
For CINRAD-SA radar, the reflectivity data has 360 radials with 460 range bins per radial direction, and the distance resolution is 1 km. The mean radial velocity data format is slightly different, which contains 920 range bins for each of the 360 radials in an elevation cut, and the distance resolution is 0.25 km. For XPRAD data, the reflectivity, differential reflectivity, and correlation coefficient data products contain 14 elevation cuts, and each elevation cut includes 360 radials with 4000 range bins per radial direction. The distance resolution of the XPRAD data is 0.075 km. We used the first 600 range bins because of the stronger rainfall attenuation in the X-band results. Example radar echo images are shown in Figure 4. Super-resolved images for the reference methods, including improved IBP [15] and NSSR [17], were obtained from Zhang et al. [17].

4.2. Methods and Training Details

The reflectivity ZSA and radial velocity VSA of CINRAD-SA radar; and reflectivity Zh, differential reflectivity Zdr, and radial velocity Vxd of XPRAD radar were used in the experiments. For each category, 100 records were used for training and 10 for validation, totaling 500 records for training and 50 records for validation. Original HR images were plotted from these data records and saved using the MATLAB print function with the resolution parameter of 600 dpi, resulting in images of pixel size 3500 × 2625, which were later center-cropped to 2200 × 2200 to get rid of the extra white space. However, during training, there is no need to read the whole large images due to limited computing resources. Hence, the 500 HR images were subsequently cropped to sub-images with a sliding window of step 360, resulting in 18,000 sub-images of pixel size 480 × 480. Common data augmentation [45] methods such as random horizontal flips and 90, 180, and 270-degree rotations were also used during training.
Since the weather radar echo degradation process, as shown in Figure 1, is ill-defined and irreversible, and that the point spread functions for different imaging systems are different, a Gaussian filter is usually used to simulate the process of the degradation of radar echo [9,15,30,46,47]. The LR images are obtained by first applying a Gaussian filter of kernel size 7 × 7 and standard deviation of 1.5 to the cropped sub-images using the MATLAB Gaussian kernel function, and then down-sampling them by scaling factors of ×2 and ×4 using the MATLAB bicubic kernel function. An example of a high-resolution echo image patch and the output from the degradation process using the patch from Figure 4a is shown in Figure 5.
Two models with scaling factors of ×2 and ×4 were trained. For both models, the mini-batch size was set to 13, with the total number of iterations set to 500 k and a validation frequency to 5 k. The spatial size of the cropped HR patch was 128 × 128. It was observed that training a deeper network benefits from a larger patch size, since an enlarged receptive field helps to capture more semantic information [39]. However, it’s more time-consuming, and needs more computing resources.
A model using L1 pixel-wise loss was pre-trained with a starting learning rate of 2 × 10⁻⁴, which decayed by a factor of 2 every 2 × 10⁵ of mini-batch updates. Then, the trained model is employed as an initialization for the generator. Then, the generator is trained using the loss function in Equation (17) with λ = 5 × 10⁻³ and η = 1 × 10⁻². The learning rate is set using a multistep scheme where it’s set to 1 × 10⁻⁴ initially and halved at 50 k, 100 k, 200 k, and 300 k iterations. Pre-training helps GAN-based methods avoid undesired local optima for the generator, and the discriminator receives relatively good starting super-resolved images instead of extreme fake ones (black or noisy images) [39].
Adam [48] was used for optimization with β1 = 0.9 and β2 = 0.999 for both the generator and the discriminator network. For the generator, a deep network of 23 RRDB blocks was used. For discriminator network, seven convolutional layers–batch normalization–Leaky Relu (Conv–BN–LReLU) basic blocks was used. The models were implemented using the PyTorch framework and were trained using NVIDIA GTX 1060 GPU.
The PSNR (peak signal-to-noise ratio) and SSIM (structural similarity index), as described in Section 2.3, were used as evaluation criteria of the super-resolved echo images. The models were compared with bicubic interpolation, improved IBP [15], and NSSR [17].

4.3. Results

For CINRAD-SA radar, the first elevation cut of the reflectivity and mean radial velocity data of the CINRAD-SA radar at 09:36 (BJT) on 19 May 2018 in Beijing, China was used as test data (Figure 4a,b), which has 360 radials with 460 range bins per radial direction for reflectivity, and 920 range bins radial direction for radial velocity. The qualitative results and visual comparison of different radar echo reconstruction methods for CINRAD-SA radar echo and their corresponding PSNR/SSIM scores are presented in Figure 6a,b and Figure 7a,b.
From Figure 6a,b and Figure 7a,b, we can see that the reconstructed radar echoes by bicubic interpolation and IBP tend to be blurred and smoothed, losing much high-frequency information during reconstruction, while both NSSR and GAN are capable of recovering most of the crisp and sharp details of echo edges and contours. However, the reconstructed echo by GAN is more visually similar to the original image than that of NSSR, with the latter having a more distorted look. For ×2 images, NSSR introduced some unwanted noise. For challenging images such as the radial velocity depicted in Figure 4b, GAN achieves a higher PSNR/SSIM result while retaining more details than NSSR, which have more color grouping and dissolved textures in the reconstructed echoes. According to Figure 6a,b and Figure 7a,b, GAN achieves a higher PSNR/SSIM score on reconstructed radar echoes while having more natural-looking results than all the compared methods on CINRAD-SA data.
In order to determine the feasibility of the GAN-based method on different weather conditions, five groups of CINARAD-SA data from severe convective weather events, rainfall events, and cloudless days were selected as test data. The reconstructed radar echo was compared with the original high-resolution radar echo using PSNR and SSIM as evaluation metrics. The results are shown in Table 1 (×4) and Table 2 (×2). We can see that the GAN achieves the highest PSNR and SSIM result on all tested weather conditions compared with other algorithms; GAN has improved significantly on severe weather and rainfall reconstruction, while having the highest PSNR/SSIM scores on cloudless days, because of its more sparse data composition. Within the same weather conditions, the PSNR/SSIM results of reflectivity data were consistently better than those of velocity; this is due to velocity data having more small and fine-grained edge information and a wider data range, as can be seen in Figure 4a,b, which is challenging for all the compared algorithms. As can be expected, the results of upscale factor of ×2 (Table 2) were consistently better than those of upscale factor of ×4 (Table 1).
To verify that the GAN-based method is also applicable to dual-polarization weather radar (XPRAD) data, the first elevation cut of the reflectivity (Zh), differential reflectivity (Zdr), and radial velocity (Vxd) data of the XPRAD radar in Xinfeng County, Guangdong Province, China on 28 May 2016 at 07:39 (BJT) were selected as the test data. Each has 360 radials with 600 range bins per radial direction (Figure 4c–e). The qualitative results and visual comparison of different radar echo reconstruction methods for XPRAD radar echo and their corresponding PSNR/SSIM scores are presented in Figure 6c–e and Figure 7c–e. Similar to CINRAD-SA radar echoes, bicubic interpolation and IBP tend to over-smooth the echo details, while the colors from NSSR are slightly distorted and dissolved. As can be seen in Figure 4, the selected XPRAD test echo was not as extreme as that in the CINRAD-SA radar, where the echo image has more layered contours and details. In addition, the radial velocity images from XPRAD radar has less velocity ambiguity phenomenon, as can be seen in Figure 4d; hence, the reconstruction of XPRAD radar echo is less challenging and achieves better PSNR/SSIM. This demonstrates that the GAN-based method is also applicable to selected XPRAD data, and achieves better results than all the compared methods.
Similarly, to test the applicability of the GAN-based method on different weather conditions for dual-polarization radar, five groups of XPRAD data from severe convective weather events, rainfall events, and cloudless days were selected as test data. The reconstructed radar echoes were compared with the original high-resolution radar echoes, and the results are shown in Table 3 (×4) and Table 4 (×2). From Table 3 and Table 4, again we can see that the GAN-based method achieves the highest PSNR and SSIM results compared with the other methods. It is capable of adapting to various weather conditions. As mentioned, compared with CINARAD-SA radar echoes, XPRAD radar data are more sparse, and the edge and contour information in the echoes are not as rich. For example, the radial velocity of XPRAD radar in Figure 4d have a more “pixelated” appearance, which results in a higher PSNR/SSIM score on average for reconstructed XPRAD radar echoes and more significant improvements from GAN-based models. As is the case with CINRAD-SA radar echoes, the highest PSNR/SSIM scores of reconstructed XPRAD radar echoes are on cloudless days. The reconstructed XPRAD radar echo by GAN has seen significant improvements across all weather conditions.

5. Conclusions

The results in Section 4 demonstrate the versatility of the GAN-based method for the super-resolution reconstruction of level-II weather radar data products. The method is suitable for the super-resolution reconstruction of both CINRAD-SA radar data and dual-polarized XPRAD weather radar data. It achieves better perceptual quality and PSNR/SSIM results than IBP and NSSR. In particular, it has excellent reconstruction capabilities of edge and structural details of weather radar echoes, and does not introduce unpleasant artifacts such as those of NSSR. The GAN-based method can be applied to enhance the resolution of weather radar echoes and fed to downstream spatial-time weather data processing pipelines such as precipitation nowcasting systems, as well as used to post-process the degraded output of some current radar echo extrapolation models. We also compared the time used by GAN and NSSR during the experiment. The results showed that for reconstructing a single image under the same environment (Windows 10, Intel Core i7-7700, 16GB RAM), NSSR takes minutes to converge, while a feed-forward run of GAN-based method takes only seconds. However, the training process of the GAN-based method is more time consuming, and requires more computing resources. Future work needs to concentrate on reducing the training time by redesigning the GAN architecture and adding online training capability to meet the needs of real-time super-resolution reconstruction.

Author Contributions

H.C. and X.Z. conceived and designed the experiments; H.C. and X.Z. selected the architectural design of the GAN model; H.C., X.Z. performed the experiments; H.C., X.Z., Y.L., and Q.Z. analyzed the results; Y.L. and Q.Z. supervised the work and provided comments on the results; H.C. wrote this paper. X.Z., Y.L., and Q.Z. provided comments on drafts.

Funding

This research received no external funding.

Acknowledgments

We want to acknowledge the Guangdong Meteorological Bureau and the Chinese Academy of Meteorological Sciences for providing the weather radar data used in this study.

Conflicts of Interest

The authors declare no conflict of interest.

References

  1. China: National Climate Change Adaptation Strategy. Available online: http://preventionweb.net/go/35854 (accessed on 30 July 2019).
  2. Peleg, N.; Marra, F.; Fatichi, S.; Molnar, P.; Morin, E.; Sharma, A.; Burlando, P. Intensification of Convective Rain Cells at Warmer Temperatures Observed from High-Resolution Weather Radar Data. J. Hydrometeorol. 2018, 19, 715–726. [Google Scholar] [CrossRef]
  3. Smith, J.A.; Baeck, M.L.; Villarini, G.; Welty, C.; Miller, A.J.; Krajewski, W.F. Analyses of a long-term, high-resolution radar rainfall data set for the Baltimore metropolitan region. Water Resour. Res. 2012, 48. [Google Scholar] [CrossRef]
  4. Fries, A.; Rollenbeck, R.; Bayer, F.; Gonzalez, V.; Oñate-Valivieso, F.; Peters, T.; Bendix, J. Catchment precipitation processes in the San Francisco valley in southern Ecuador: Combined approach using high-resolution radar images and in situ observations. Meteorol. Atmos. Phys. 2014, 126, 13–29. [Google Scholar] [CrossRef]
  5. Torres, S.M.; Curtis, C.D. Initial Implementation of Super-Resolution Data on The Nexrad Network. In Proceedings of the AMS Annual Meeting: 23rd Conference on IIPS, San Antonio, TX, USA, 15–18 January 2007. [Google Scholar]
  6. Yao, H.; Wang, J.; Liu, X. A Minimum Entropy Spectrum Extrapolation Technique and Its Application to Radar Super-Resolution. Mod. Radar 2005, 27, 18–19. [Google Scholar]
  7. Nielsen, J.E.; Thorndahl, S.; Rasmussen, M.R. A numerical method to generate high temporal resolution precipitation time series by combining weather radar measurements with a nowcast model. Atmos. Res. 2014, 138, 1–12. [Google Scholar] [CrossRef]
  8. Gallardo-Hernando, B.; Muñoz-Ferreras, J.M.; Pérez-Martínez, F. Super-resolution techniques for wind turbine clutter spectrum enhancement in meteorological radars. IET Radar Sonar Navig. 2011, 5, 924–933. [Google Scholar] [CrossRef]
  9. Li, X.; He, J.; He, Z.; Zeng, Q. Weather radar range and angular super-resolution reconstruction technique on oversampled reflectivity data. J. Inf. Comput. Sci. 2011, 8, 2553–2562. [Google Scholar]
  10. Li, X.; He, J.; He, Z. Weather radar angular resolution improvement of reflectivity data. Comput. Eng. Appl. 2011, 47, 18–20. [Google Scholar]
  11. Tan, K.; Li, W.; Zhang, Q.; Huang, Y.; Wu, J.; Yang, J.M. Penalized Maximum Likelihood Angular Super-Resolution Method for Scanning Radar Forward-Looking Imaging. Sensors 2018, 18, 912. [Google Scholar] [CrossRef]
  12. Li, X.; He, J.; He, Z.; Zeng, Q. Geostationary weather radar super-resolution modelling and reconstruction process. Int. J. Simul. Process Model. 2012, 7, 81–88. [Google Scholar] [CrossRef]
  13. Zha, Y.; Liu, L.; Yang, J.; Huang, Y. An alternating direction method for angular super-resolution in scanning radar. In Proceedings of the 2017 IEEE International Geoscience and Remote Sensing Symposium (IGARSS), Fort Worth, TX, USA, 23–28 July 2017; pp. 1626–1629. [Google Scholar]
  14. Wu, Y.; Zhang, Y.; Zhang, Y.; Huang, Y.; Yang, J. TSVD with least squares optimization for scanning radar angular super-resolution. In Proceedings of the 2017 IEEE Radar Conference (RadarConf), Seattle, WA, USA, 8–12 May 2017; pp. 1450–1454. [Google Scholar]
  15. He, J.; Ren, H.; Zeng, Q.; Li, X. Super-Resolution reconstruction algorithm of weather radar based on IBP. J. Sichuan Univ. (Nat. Sci. Ed.) 2014, 51, 947–952. [Google Scholar]
  16. Zeng, Q.; He, J.; Shi, Z.; Li, X. Weather Radar Data Compression Based on Spatial and Temporal Prediction. Atmosphere 2018, 9, 96. [Google Scholar] [CrossRef]
  17. Zhang, X.; He, J.; Zeng, Q.; Shi, Z. Weather Radar Echo Super-Resolution Reconstruction Based on Nonlocal Self-Similarity Sparse Representation. Atmosphere 2019, 10, 254. [Google Scholar] [CrossRef]
  18. Mandapaka, P.V.; Germann, U.; Panziera, L.; Hering, A. Can Lagrangian Extrapolation of Radar Fields Be Used for Precipitation Nowcasting over Complex Alpine Orography? Weather Forecast. 2011, 27, 28–49. [Google Scholar] [CrossRef]
  19. Pop, L.; Sokol, Z.; Minářová, J. Nowcasting of the probability of accumulated precipitation based on the radar echo extrapolation. Atmos. Res. 2019, 216, 1–10. [Google Scholar] [CrossRef]
  20. Zou, H.; Wu, S.; Shan, J.; Yi, X. A Method of Radar Echo Extrapolation Based on TREC and Barnes Filter. J. Atmos. Ocean. Technol. 2019, 36, 1713–1727. [Google Scholar] [CrossRef]
  21. Shi, X.; Chen, Z.; Wang, H.; Yeung, D.-Y.; Wong, W.; Woo, W. Convolutional LSTM Network: A machine learning approach for precipitation nowcasting. In Proceedings of the Neural Information Processing Systems 28: Annual Conference on Neural Information Processing Systems 2015, Montreal, QC, Canada, 7–12 December 2015; pp. 802–810. [Google Scholar]
  22. Shi, E.; Li, Q.; Gu, D.; Zhao, Z. Convolutional Neural Networks Applied on Weather Radar Echo Extrapolation. DEStech Trans. Comput. Sci. Eng. 2017. [Google Scholar] [CrossRef]
  23. Krinitskiy, M.; Verezemskaya, P.; Grashchenkov, K.; Tilinina, N.; Gulev, S.; Lazzara, M. Deep Convolutional Neural Networks Capabilities for Binary Classification of Polar Mesocyclones in Satellite Mosaics. Atmosphere 2018, 9, 426. [Google Scholar] [CrossRef]
  24. Booz, J.; Yu, W.; Xu, G.; Griffith, D.; Golmie, N. A Deep Learning-Based Weather Forecast System for Data Volume and Recency Analysis. In Proceedings of the 2019 International Conference on Computing, Networking and Communications (ICNC), Honolulu, HI, USA, 18–21 February 2019; pp. 697–701. [Google Scholar]
  25. Wang, Z.; Chen, J.; Hoi, S.C.H. Deep Learning for Image Super-resolution: A Survey. arXiv 2019, arXiv:1902.06068. Available online: https://arxiv.org/pdf/1902.06068.pdf (accessed on 12 September 2019).
  26. Dong, C.; Loy, C.C.; He, K.; Tang, X. Learning a Deep Convolutional Network for Image Super-Resolution. In Proceedings of the Computer Vision—ECCV 2014, Zurich, Switzerland, 6–12 September 2014; Fleet, D., Pajdla, T., Schiele, B., Tuytelaars, T., Eds.; Springer International Publishing: Berlin/Heidelberg, Germany, 2014; pp. 184–199. [Google Scholar]
  27. Dong, C.; Loy, C.C.; He, K.; Tang, X. Image Super-Resolution Using Deep Convolutional Networks. IEEE Trans. Pattern Anal. Mach. Intell. 2016, 38, 295–307. [Google Scholar] [CrossRef]
  28. Goodfellow, I.; Pouget-Abadie, J.; Mirza, M.; Xu, B.; Warde-Farley, D.; Ozair, S.; Courville, A.; Bengio, Y. Generative Adversarial Nets. In Advances in Neural Information Processing Systems 27; Ghahramani, Z., Welling, M., Cortes, C., Lawrence, N.D., Weinberger, K.Q., Eds.; Curran Associates, Inc.: Red Hook, NY, USA, 2014; pp. 2672–2680. [Google Scholar]
  29. Ledig, C.; Theis, L.; Huszar, F.; Caballero, J.; Cunningham, A.; Acosta, A.; Aitken, A.; Tejani, A.; Totz, J.; Wang, Z.; et al. Photo-Realistic Single Image Super-Resolution Using a Generative Adversarial Network. In Proceedings of the 2017 IEEE Conference on Computer Vision and Pattern Recognition (CVPR), Honolulu, HI, USA, 21–26 July 2017; pp. 105–114. [Google Scholar]
  30. Nasrollahi, K.; Moeslund, T.B. Super-resolution: A comprehensive survey. Mach. Vis. Appl. 2014, 25, 1423–1468. [Google Scholar] [CrossRef]
  31. Johnson, J.; Alahi, A.; Fei-Fei, L. Perceptual Losses for Real-Time Style Transfer and Super-Resolution. arXiv 2016, arXiv:1603.08155. Available online: https://arxiv.org/pdf/1603.08155.pdf (accessed on 12 September 2019).
  32. Bruna, J.; Sprechmann, P.; LeCun, Y. Super-Resolution with Deep Convolutional Sufficient Statistics. arXiv 2015, arXiv:1511.05666. Available online: https://arxiv.org/pdf/1511.05666.pdf (accessed on 12 September 2019).
  33. Simonyan, K.; Zisserman, A. Very Deep Convolutional Networks for Large-Scale Image Recognition. arXiv 2014, arXiv:1409.1556. Available online: https://arxiv.org/pdf/1409.1556.pdf (accessed on 12 September 2019).
  34. Wang, Z.; Bovik, A.C.; Lu, L. Why is image quality assessment so difficult? In Proceedings of the 2002 IEEE International Conference on Acoustics, Speech, and Signal Processing, Orlando, FL, USA, 13–7 May 2002; Volume 4, pp. IV-3313–IV-3316. [Google Scholar]
  35. Zhou, W.; Bovik, A.C.; Sheikh, H.R.; Simoncelli, E.P. Image quality assessment: From error visibility to structural similarity. IEEE Trans. Image Process. 2004, 13, 600–612. [Google Scholar]
  36. Wang, Z.; Bovik, A.C. Mean squared error: Love it or leave it? A new look at Signal Fidelity Measures. IEEE Signal Process. Mag. 2009, 26, 98–117. [Google Scholar] [CrossRef]
  37. Weather Radar. Wikipedia. Available online: https://en.wikipedia.org/wiki/Weather_radar (accessed on 12 September 2019).
  38. Ioffe, S.; Szegedy, C. Batch Normalization: Accelerating Deep Network Training by Reducing Internal Covariate Shift. arXiv 2015, arXiv:1502.03167. [Google Scholar]
  39. Wang, X.; Yu, K.; Wu, S.; Gu, J.; Liu, Y.; Dong, C.; Loy, C.C.; Qiao, Y.; Tang, X. ESRGAN: Enhanced Super-Resolution Generative Adversarial Networks. arXiv 2018, arXiv:1809.00219. Available online: https://arxiv.org/pdf/1809.00219.pdf (accessed on 12 September 2019).
  40. Lim, B.; Son, S.; Kim, H.; Nah, S.; Lee, K.M. Enhanced Deep Residual Networks for Single Image Super-Resolution. arXiv 2017, arXiv:1707.02921. Available online: https://arxiv.org/pdf/1707.02921.pdf (accessed on 12 September 2019).
  41. Zhang, Y.; Li, K.; Li, K.; Wang, L.; Zhong, B.; Fu, Y. Image Super-Resolution Using Very Deep Residual Channel Attention Networks. arXiv 2018, arXiv:1807.02758. Available online: https://arxiv.org/pdf/1807.02758.pdf (accessed on 12 September 2019).
  42. Xu, B.; Wang, N.; Chen, T.; Li, M. Empirical Evaluation of Rectified Activations in Convolutional Network. arXiv 2015, arXiv:1505.00853. Available online: https://arxiv.org/pdf/1505.00853.pdf (accessed on 12 September 2019).
  43. Radford, A.; Metz, L.; Chintala, S. Unsupervised Representation Learning with Deep Convolutional Generative Adversarial Networks. arXiv 2015, arXiv:1511.06434. Available online: https://arxiv.org/pdf/1511.06434.pdf (accessed on 12 September 2019).
  44. Jolicoeur-Martineau, A. The relativistic discriminator: A key element missing from standard GAN. arXiv 2018, arXiv:1807.00734. Available online: https://arxiv.org/pdf/1807.00734.pdf (accessed on 12 September 2019).
  45. Mikołajczyk, A.; Grochowski, M. Data augmentation for improving deep learning in image classification problem. In Proceedings of the 2018 International Interdisciplinary PhD Workshop (IIPhDW), Swinoujście, Poland, 9–12 May 2018; pp. 117–122. [Google Scholar]
  46. Dong, W.; Zhang, L.; Shi, G.; Li, X. Nonlocally Centralized Sparse Representation for Image Restoration. IEEE Trans. Image Process. 2013, 22, 1620–1630. [Google Scholar] [CrossRef] [PubMed]
  47. Glasner, D.; Bagon, S.; Irani, M. Super-resolution from a single image. In Proceedings of the 2009 IEEE 12th International Conference on Computer Vision, Kyoto, Japan, 29 September–2 October 2009; pp. 349–356. [Google Scholar]
  48. Kingma, D.P.; Ba, J. Adam: A Method for Stochastic Optimization. arXiv 2014, arXiv:1412.6980. Available online: https://arxiv.org/pdf/1412.6980.pdf (accessed on 12 September 2019).
Figure 1. Low-resolution imaging model of weather radar echo.
Atmosphere 10 00555 g001
Figure 2. Reconstruction process of low-resolution (LR) echo.
Atmosphere 10 00555 g002
Figure 3. Architecture of the generative adversarial network (GAN)-based method with corresponding kernel size (k), number of feature maps (n), and stride (s) indicated for each convolutional layer. We used 23 residual-in-residual dense blocks (RRDBs) in the generator network and seven Conv-BN-LReLU blocks in the discriminator network. (Nomenclature: Conv–convolutional layers; LReLU–Leaky Rectified Linear Units [42]; BN–batch normalization [38]).
Atmosphere 10 00555 g003
Figure 4. Example test radar echo images with selected patches for comparison shown in Plan Position Indicator (PPI). (a,b) are the first elevation cut of the reflectivity and radial velocity data of the S-band China New-Generation Weather Radar (CINRAD-SA) at Beijing, China on 19 May 2018 at 09:36 (BJT), which has 360 radials with 460 range bins per radial direction for reflectivity, and 920 range bins per radial direction for radial velocity; (ce) are the first elevation cut of reflectivity, radial velocity, and differential reflectivity data of the X-band dual-polarization Radar (XPRAD) radar at Xinfeng, Guangdong on 28 May 2016 at 07:39 (BJT), which has 360 radials with 600 range bins per radial direction.
Atmosphere 10 00555 g004
Figure 5. Example of a high-resolution echo image patch (Figure 4a) and the output low-resolution patch from the degradation process.
Atmosphere 10 00555 g005
Figure 6. Qualitative reconstructed results of generative adversarial networks (GAN)-based methods and comparison with bicubic, iterative back-projection (IBP), and nonlocal self-similarity sparse representation (NSSR) using images from Figure 4 with upscale factors of ×4. Peak signal-to-noise ratio (PSNR) and structural similarity index (SSIM) results are shown below individual patch. GAN-based methods produces more crisp edges and details than other methods. (ae) reconstructed result patch using image from Figure 4a–e (×4).
Atmosphere 10 00555 g006
Figure 7. Same with Figure 6. Cropped patch of reconstructed results with the upscaling factor of ×2. (ae) reconstructed result patch using image from Figure 4a–e (×2).
Atmosphere 10 00555 g007
Table 1. Average peak signal-to-noise ratio (PSNR) (dB) and structural similarity index (SSIM) results of the reconstructed echo of five groups of level-II data products of the CINRAD-SA radar (×4). IBP: Iterative Back Projection. NSSR: Nonlocal Self Similarity Sparse Representation. GAN: Generative Adversarial Networks.
MethodsSevere WeatherRainfallCloudless
ReflectivityVelocityReflectivityVelocityReflectivityVelocity
Bicubic26.5709 21.441727.578520.638329.000024.0140
0.91450.88010.94120.85970.96520.9353
IBP27.197421.855728.197621.008429.604224.3899
0.92360.88870.94740.86920.96890.9395
NSSR28.181922.060429.331221.032630.808324.3498
0.93800.90410.95090.87080.97180.9437
GAN29.826022.071030.091121.163731.304824.3735
0.96210.90970.96970.89730.98260.9519
Table 2. Average PSNR (dB) and SSIM results of the reconstructed echo of five groups of level-II data products of the CINRAD-SA radar (×2).
MethodsSevere WeatherRainfallCloudless
ReflectivityVelocityReflectivityVelocityReflectivityVelocity
Bicubic27.8990 22.374028.903221.533030.351624.8831
0.93700.90440.95630.88660.97440.9476
IBP28.204522.604729.212321.766630.668325.1020
0.94150.90980.95940.89290.97630.9504
NSSR29.548022.484930.001821.548431.522924.7074
0.94820.92260.96100.87480.97730.9536
GAN30.594122.707130.496022.196032.099825.5752
0.98050.92350.97830.91020.98890.9612
Table 3. Average PSNR (dB) and SSIM results of the reconstructed echo of five groups of level-II data products of XPRAD radar (×4).
MethodsSevere WeatherRainfallCloudless
ZhVxdZdrZhVxdZdrZhVxdZdr
Bicubic28.8036 26.017224.376131.938228.500427.153536.924633.911431.1582
0.94270.94280.90480.97470.97200.95530.99240.99160.9848
IBP29.515926.760225.028132.664429.224327.793337.645334.645831.7911
0.94910.94630.91510.97760.97360.96010.99330.99210.9865
NSSR31.408128.860227.153736.744233.499229.404140.381338.375432.5530
0.96270.94870.95960.98240.97710.97430.99460.99410.9939
GAN34.567932.367028.564238.613835.458230.961443.793642.410834.5021
0.98580.94960.96860.99350.98500.98510.99810.99730.9947
Table 4. Average PSNR (dB) and SSIM results of the reconstructed echo of five groups of level-II data products of XPRAD radar. (×2).
MethodsSevere WeatherRainfallCloudless
ZhVxdZdrZhVxdZdrZhVxdZdr
Bicubic30.213927.448125.697333.368829.916428.461538.373335.356432.4229
0.95970.95970.93100.98220.98020.96740.99470.99410.9888
IBP30.522727.761725.991833.682630.227628.754638.693335.671132.7062
0.96270.96250.93590.98350.98160.96970.99510.99450.9896
NSSR32.240428.172427.915437.959234.519430.114741.613539.451033.5485
0.97570.95540.96450.98700.98180.98070.99760.99540.9966
GAN35.603533.035529.003039.293535.881231.539444.636343.414534.9678
0.99740.96130.98650.99590.99590.99230.99850.99910.9968

