Article

Brake Wear Particle Emissions of a Passenger Car Measured on a Chassis Dynamometer

1
Ford-Werke GmbH, Süsterfeldstr, 200, 52072 Aachen, Germany
2
European Commission, Joint Research Centre, Via E. Fermi 2749, 21027 Ispra, Italy
*
Author to whom correspondence should be addressed.
Atmosphere 2019, 10(9), 556; https://doi.org/10.3390/atmos10090556
Submission received: 30 July 2019 / Revised: 10 September 2019 / Accepted: 15 September 2019 / Published: 17 September 2019
(This article belongs to the Section Air Quality)

Abstract

:
Brake wear emissions with a special focus on particle number (PN) concentrations were investigated during a chassis dynamometer measurement campaign. A recently developed, well-characterized, measurement approach was applied to measure brake particles in a semi-closed vehicle setup. Implementation of multiple particle measurement devices allowed for simultaneous measurement of volatile and solid particles. Estimated PN emission factors for volatile and solid particles differed by up to three orders of magnitude with an estimated average solid particle emission factor of 3∙109 # km−1 brake−1 over a representative on-road brake cycle. Unrealistic high brake temperatures may occur and need to be ruled out by comparison with on-road temperature measurements. PN emissions are strongly temperature dependent and this may lead to its overestimation. A high variability for PN emissions was found when volatile particles were not removed. Volatiles were observed under high temperature conditions only which are not representative of normal driving conditions. The coefficient of variation for PN emissions was 1.3 without catalytic stripper and 0.11 with catalytic stripper. Investigation of non-braking sections confirmed that particles may be generated at the brake even if no brakes are applied. These “off-brake-event” emissions contribute up to about 30% to the total brake PM10 emission.

1. Introduction

Brake wear emissions is a topic which has received increased attention over recent years. This is reflected by the continuously increasing number of non-exhaust related studies published over the last 25 years worldwide [1], with most of them addressing brake wear PM emissions. One of the main reasons why non-exhaust emissions were overlooked in the past was due to their relative relevance to air quality. Until recently, road transport emissions were dominated to almost 90% by exhaust emissions [2,3]. However, during the last decade its proportion gradually decreased to almost 50% due to the application of stringent exhaust emissions regulations [4] and due to technological improvements introduced mainly in the exhaust aftertreatment domain. As a result, non-exhaust emissions have become an important topic–not only scientifically–but also at a political level [5].
Despite the increased interest of the scientific community on brake emissions, it is true that the vast majority of the results reported in the literature are not consistent [6,7]. For instance, experimentally measured brake wear PM10 emission factors (EFs) of passenger cars have been reported to vary from 0.1 mg∙km−1 to 15 mg∙km−1 per vehicle [8,9,10,11,12,13,14,15]. This range is wide and introduces a big uncertainty when the contribution of brake wear emissions to ambient PM concentrations are studied. Brake wear EFs depend on parameters like the type of the friction material, the type of the brake assembly, and the applied driving conditions [11]. Following the development of a WLTP-based braking cycle in 2018 [7], most studies focused on the application of realistic braking patterns, but still the range of reported EFs remained relatively wide [12,13,14]. Similarly, experimentally measured brake wear PM2.5 EFs vary from 0.1 mg∙km−1 to 5 mg∙km−1 per vehicle [8,11,13]. Finally, particle number (PN) EFs reported by various researchers also appear to be inconsistent [12,14,15,16]. This is probably due to more variations on the setup and measurement protocols when PN related studies are examined. One has to keep in mind that traffic related PN emissions, particularly ultrafine particle emissions, are becoming more relevant due to demonstrated negative health effects [17,18].
One important reason for the observed inconsistencies in the measurement of PM and PN EFs is the lack of a standardized methodology for sampling and measuring brake wear particle emissions [7]. Indeed, in most references provided previously, different sampling and measurement setups were employed. Brake wear particles can be studied in a relatively controlled environment in the laboratory or under uncontrolled real-world conditions on the road [19,20]. Laboratory studies can be carried out at full vehicle level on a roller chassis bench [21], at brake couple level on a brake dynamometer [11,22,23,24,25,26,27], or at brake component level on a pin-on-disc configuration [28,29,30,31,32]. Table 1 gives an overview of different methods applied by different researchers for sampling and measuring brake wear particles. The table is definitely not comprehensive; however, it intends to give an idea on the different setups that have been applied for brake emissions measurement.
Each configuration comes with its advantages and disadvantages depending on the scope of the study and the level of required measurement accuracy. Testing conditions at pin-on-disc configurations are considerably different from the real conditions of the automotive brakes operation. This includes the size of the tested friction couple, the adopted sliding velocity and deceleration, and the particle generation rate as well as the airflow regime [28,30]. According to Kukutschová et al. [33], these differences result in lower energy generated per area which can also influence parameters of wear particles [30]. Overall, pin-on-disc configurations seem to be the ideal solution for investigating the underlying phenomena but not for studying the levels of brake particle emissions at vehicle level. Brake dynamometer testing is conducted with real hardware and brake materials of real size, trying to simulate real-world driving/braking conditions. Brake dyno configurations are usually designed to be closed in order to avoid interferences and contamination from other sources. Closed systems come with the advantage that conditions for isokinetic sampling and high particles collection efficiency can be optimized. Another advantage of closed systems is the possibility to control the cleanness of the incoming air, as well as precisely control the temperature and humidity levels. However, testing conditions at the brake dyno level differ from real conditions at full vehicle level in terms of aerodynamics. Special attention is required to correctly replicate aerodynamics in order to avoid significant differences to the temperature of the brake system [7]. Chassis dynamometer testing is conducted with a real vehicle, thus simulating almost real-world driving/braking conditions. Chassis dyno studies are very scarce, therefore no generalized conclusions regarding the advantages and disadvantages of the method based on research data can be made. Chasapidis et al. [21] mentioned that it is rather challenging to distinguish between particles coming from brake and tire wear in such configuration. Also, there are some questions regarding the actual cooling of the brake system in the lab compared to real-world applications.
The Particle Measurement Program (PMP), which is an informal working group under the auspices of the United Nations Working Party on Pollution and Energy (GRPE), has been mandated by the GRPE to develop a commonly accepted methodology for sampling and measuring brake wear particles. The first step included the development of a new braking cycle which would be representative of real-world conditions [7]. The next step involves the definition of the appropriate setup for sampling and measuring brake wear particles. In this framework, discussions on whether the proposed methodology should be based on each of the previously described configurations took place at the PMP level [34]. It has been decided to proceed with the brake dyno approach [35]; however, there has been a question on whether accurate and representative of on-road conditions measurements could also be performed at the chassis dyno level.
The aim of the current paper is to present a measurement approach for sampling and measuring brake wear particles at a chassis dynamometer level. The advantages and disadvantages of the methodology are discussed, and the representativeness of the method is assessed.

2. Material and Methods

A mid-size passenger vehicle with 15” disc and floating caliper type brakes was used as the test vehicle. The loaded vehicle mass was 1600 kg. The conventional brake material was replaced by a novel material composition developed in the EU project LOWBRASYS. The new system–not yet at a series production status–consists of a novel cast-iron rotor coated by an approximately 70 µm thin surface of WC-CoCr using high-velocity oxygen fuel (HVOF) coatings [29,30,31]. The lining of the novel friction material contained geopolymers that were based on alkaline-activated blast furnace slag [42]. The measurement approach was thoroughly characterized and described in detail in Farwick zum Hagen et al. [15]. The front left wheel is partly enclosed with a housing. This experimental design is a compromise between an open system which lacks a sufficient signal-to-noise ratio and a fully-closed system which lacks realistic brake cooling. Furthermore, particle losses that naturally occur at the vehicle wheel are also conserved. At the end of the housing a rotary joint is connected to flexible, conductive tubing that leads into the vehicle where it is connected to a sampling plenum. A blower is used to generate an airflow through the transport lines. A sampling inlet is placed in the airstream and a connected flow splitter is used to split up the air to the different measurement devices. The remaining particle-laden air is directed outside to avoid any contamination of the vehicle cabin. During chassis dynamometer testing there is only a single blower directly in front of the vehicle generating a velocity dependent airflow. However, this airflow will differ from actual on-road testing. While it is unclear how this affects particle aspiration, the same models established from an on-road tracer gas characterization were applied [15].
Brake emissions were studied in a test cell (Joint Research Center–JRC, VELA2), on a 4 × 4 chassis dynamometer equipped with 48“ diameter rollers. For the purposes of this study only front wheels were rolling. The dynamometer maximum power absorbing operation is 150 kW @ 100 km/h (MAHA Haldenwang, Germany).
The particle number measurement devices included two condensational particle counters (CPC) with 50% detection efficiency at 10 nm particle diameter (CPC110nm is a CPC 3772 TSI Ltd; CPC210nm is an AM20, Airmodus Inc.) as well as one CPC with 50% detection efficiency at 4 nm particle diameter (CPC34nm is a CPC3752, TSI Ltd). PN size distributions were measured with two Engine Exhaust Particle Sizers (EEPS1 and EEPS2, TSI Ltd.) in the default matrix mode with approximate measurement size range from 6 nm to 560 nm. In addition, an aerosol photometer with integrated gravimetric sampling and PM10 -impactor upstream (DustTrak 8530, TSI Ltd.) as well as an Aerodynamic Particle Sizer (APS, Aerodynamic Particle Sizer 3321, TSI Ltd.) were used for particle mass measurements and sizing of larger particles. The manufacturer provided size range for the DustTrak is from 0.1 µm to 10 µm and from 0.5 µm to 20 µm for APS. Dusttrak data was calibrated with data from the internal gravimetric sampling. Figure 1 provides a top-view of the instrumented vehicle on the chassis dynamometer as well as an overview of all measurement devices used during the campaign.
In the measurement setup EEPS1 was used to measure the total particle emission without any dilution in all of the tests. EEPS2 was first used with a catalytic stripper (CS1, AVL, temperature 300 °C) and bifurcated flow dilution (dilution ratio 1/9), yet transferred later parallel to EEPS1 as it was observed that measured concentrations were below the EEPS2 detection limit in the first measurement position, see text below. For CPCs the sample was diluted with a bifurcated flow diluter (Topas DDS 560) by using a constant dilution ratio of 100 in all of the tests. CPC110nm was used to measure total PN (both volatile and solid fraction), while CPC2 and CPC34nm were used mostly after a catalytic stripper (CS2, Catalytic instruments CS5015). The sample flow through the CS2 was 1.3 LPM. Some tests were performed for CPC210nm and CPC34nm, also without CS, in order to determine comparability of CPC110nm and CPC210nm and to check if there are detectable volatile particle emissions below 10 nm. Please note that the large particle instrument sampling, namely APS and DustTrak, were conducted without any dilution or sample treatment. All PN values were corrected for dilution factor and the particle concentration reduction factor (PCRF) caused by the catalytic strippers.
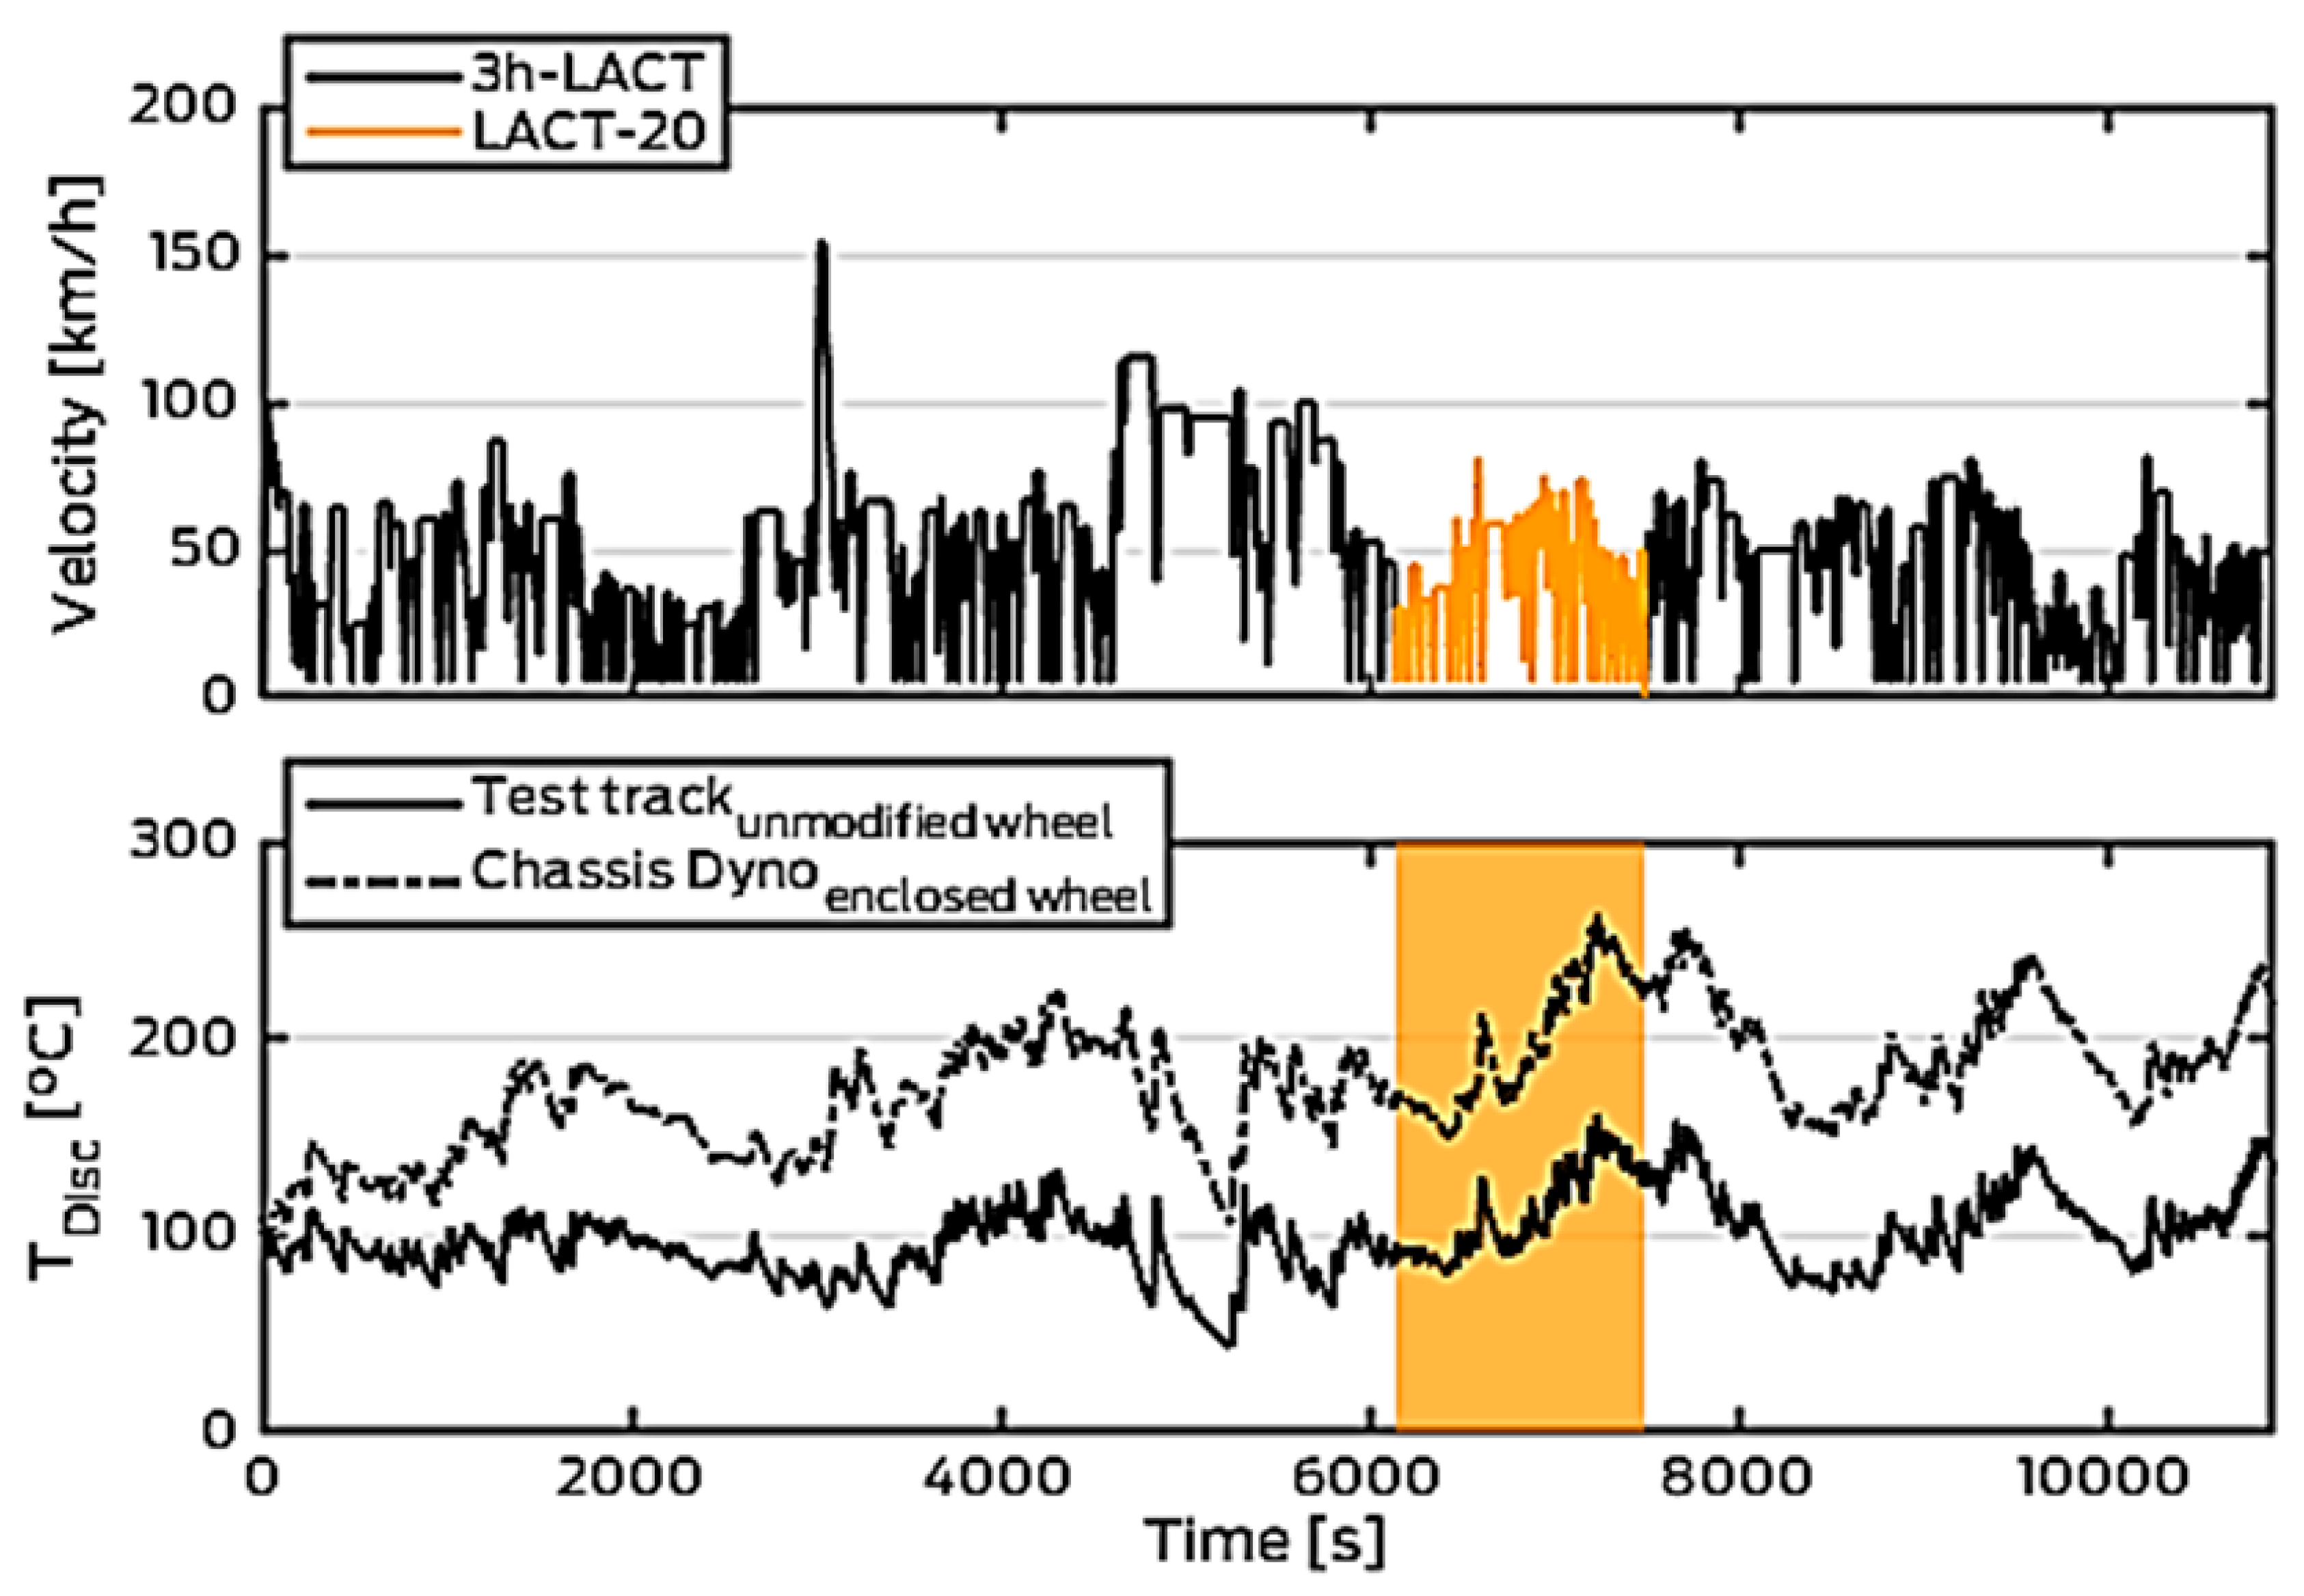
A time-controlled version of the 3h-Los Angeles City Traffic (LACT) cycle was applied [43]. This cycle was developed in the EU co-funded project LOWBRASYS and is a short version of an existing brake procedure (LACT) that was generated from actual on-road driving data and addresses typical urban, extra-urban, and highway drive conditions. Additionally, a subset of the 3h-LACT was selected which is called LACT-20 due to its duration of application, 20 min (22.5 min, total length: 15.8 km). This subset of stops is the section with the highest temperatures observed during on-road testing and it was used to assess repeatability of measurements. The short run-time of the LACT-20 allowed several measurements repetitions per day to assess repeatability. Both driving cycles and an exemplary vehicle disc brake temperature are shown in Figure 2.
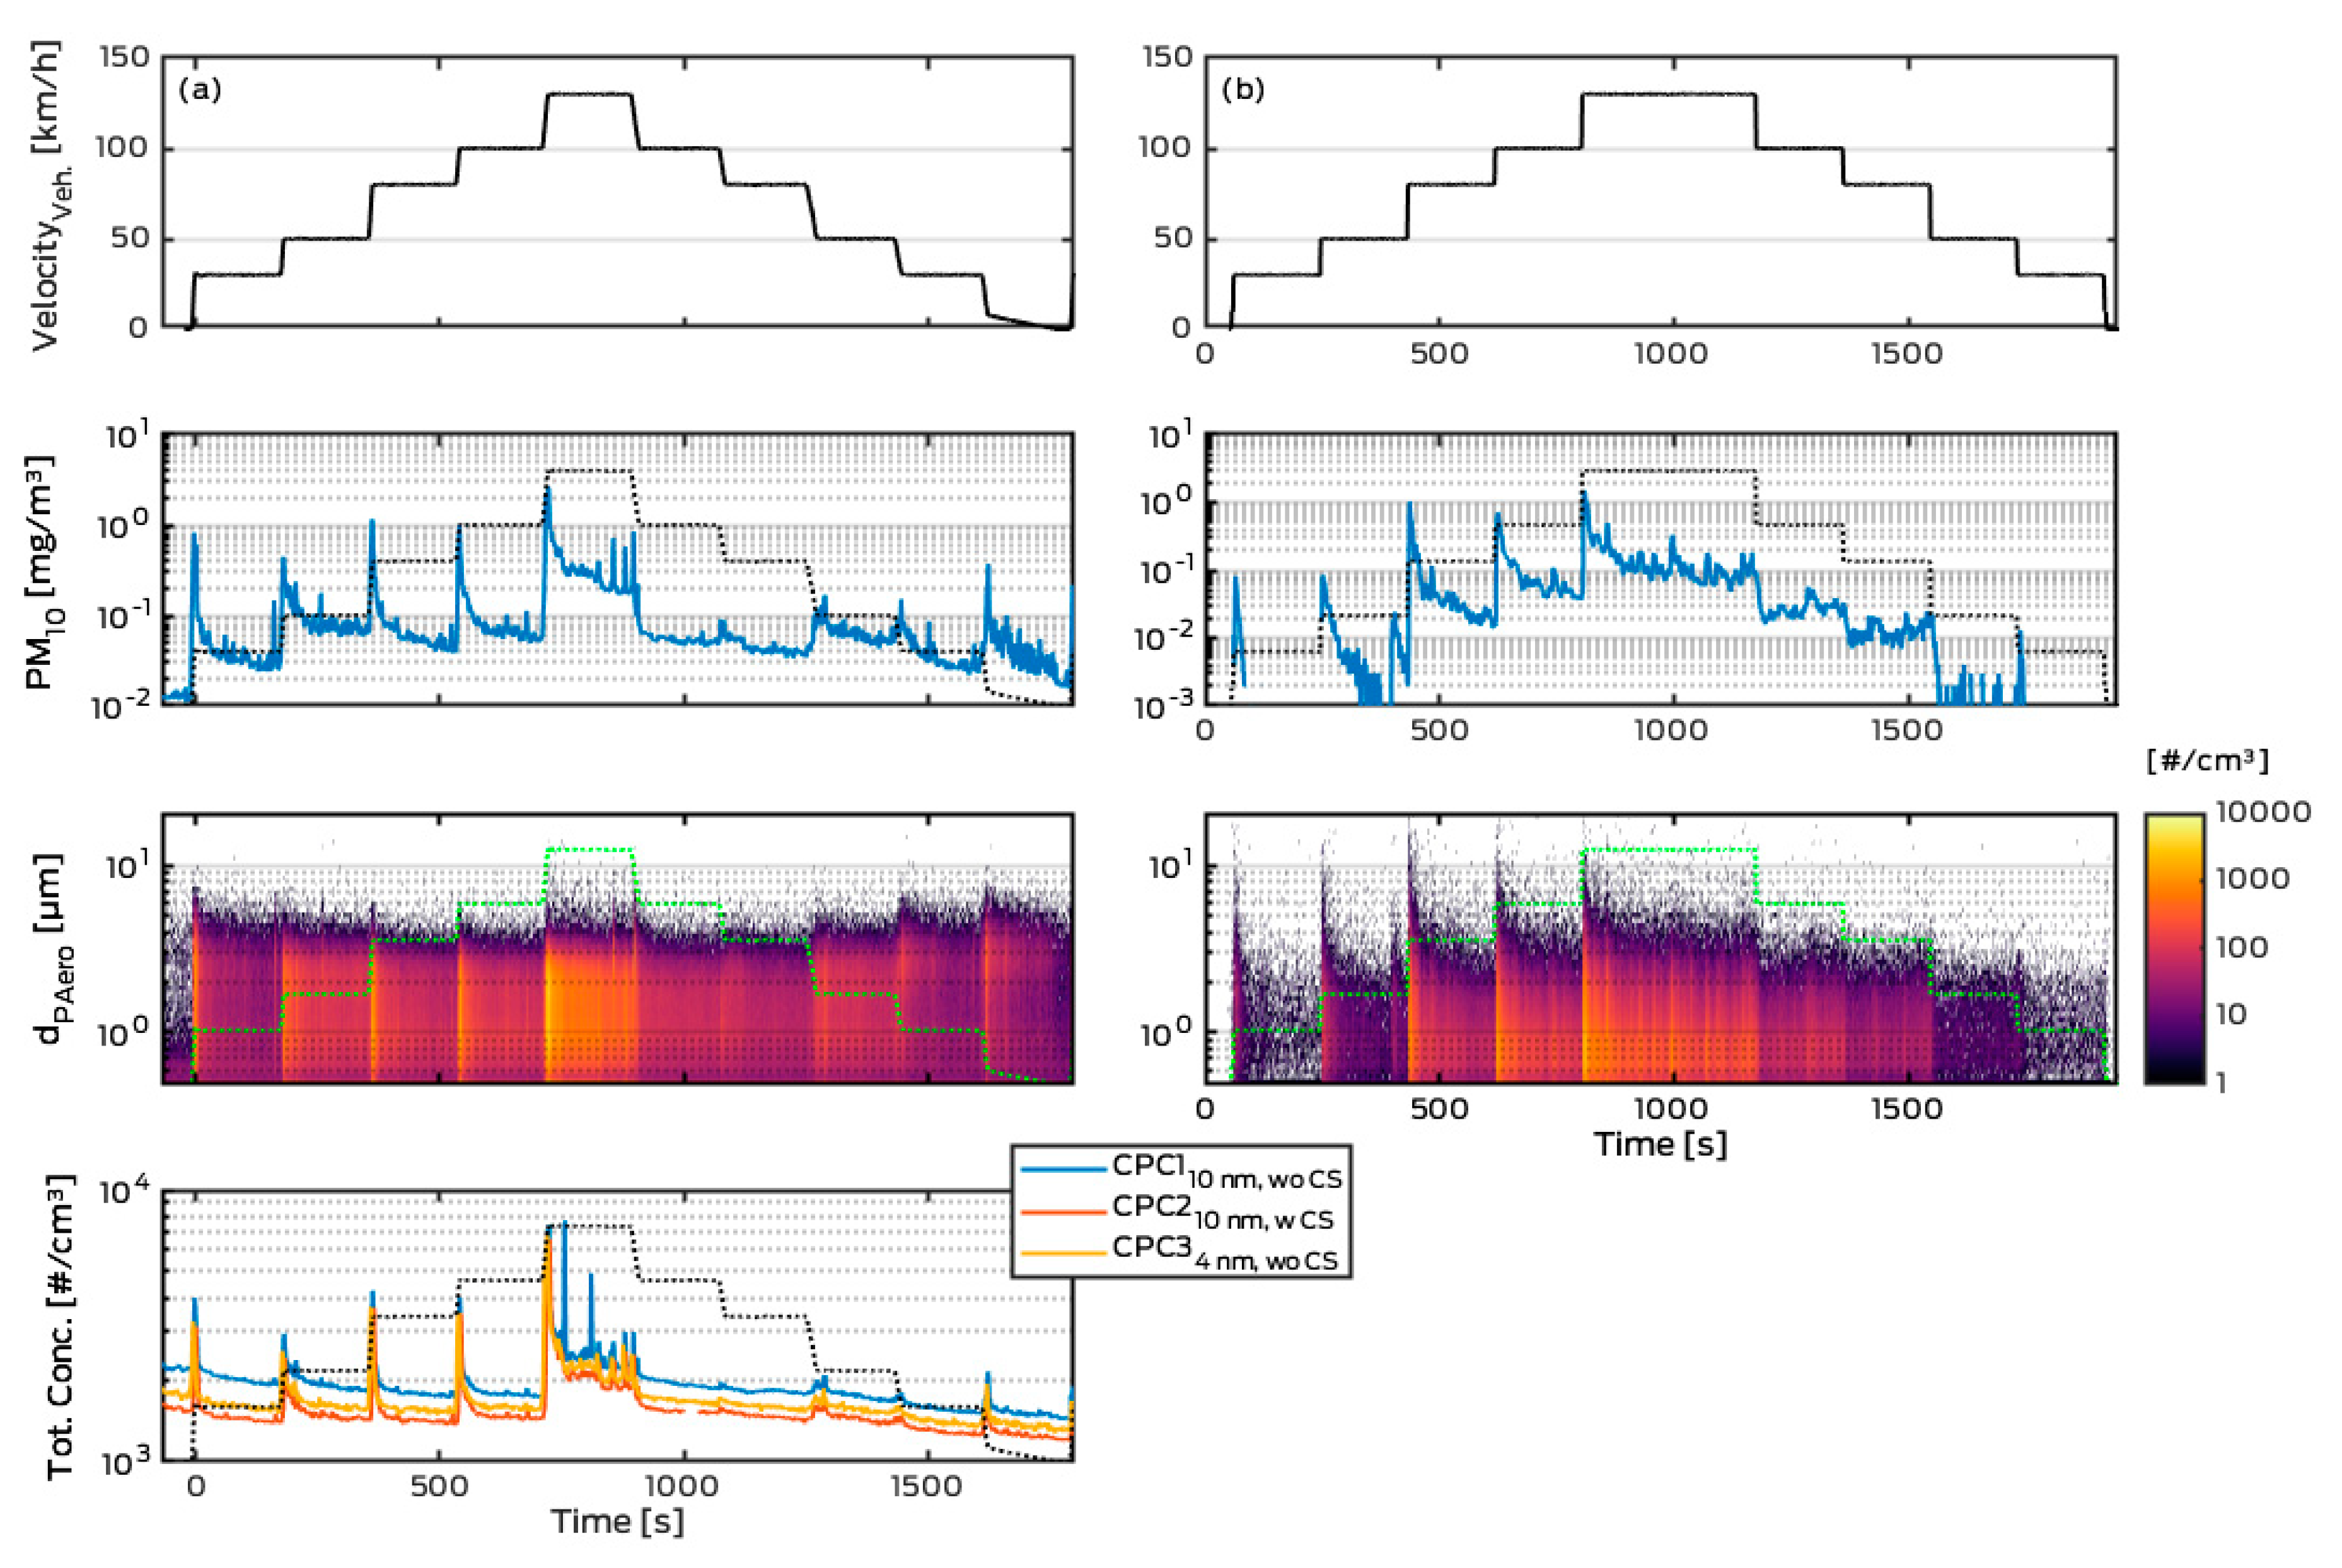
A third cycle was used to investigate particle emissions during non-braking sections. The so-called pyramid cycle consists of five repetitions of 170 s constant velocity sections at velocities of 30, 50, 80, 100, and 130 km/h as proposed by Farwick zum Hagen et al. [27]. These velocity sections are driven in an ascending and descending order with a 10 s acceleration/deceleration phase between each velocity section. This results in a total cycle length of 1800 s which was repeated once. There is no brake application during this one-hour drive. The pyramid cycle was designed to investigate brake drag emissions.

3. Results and Discussion

3.1. Brake Temperatures

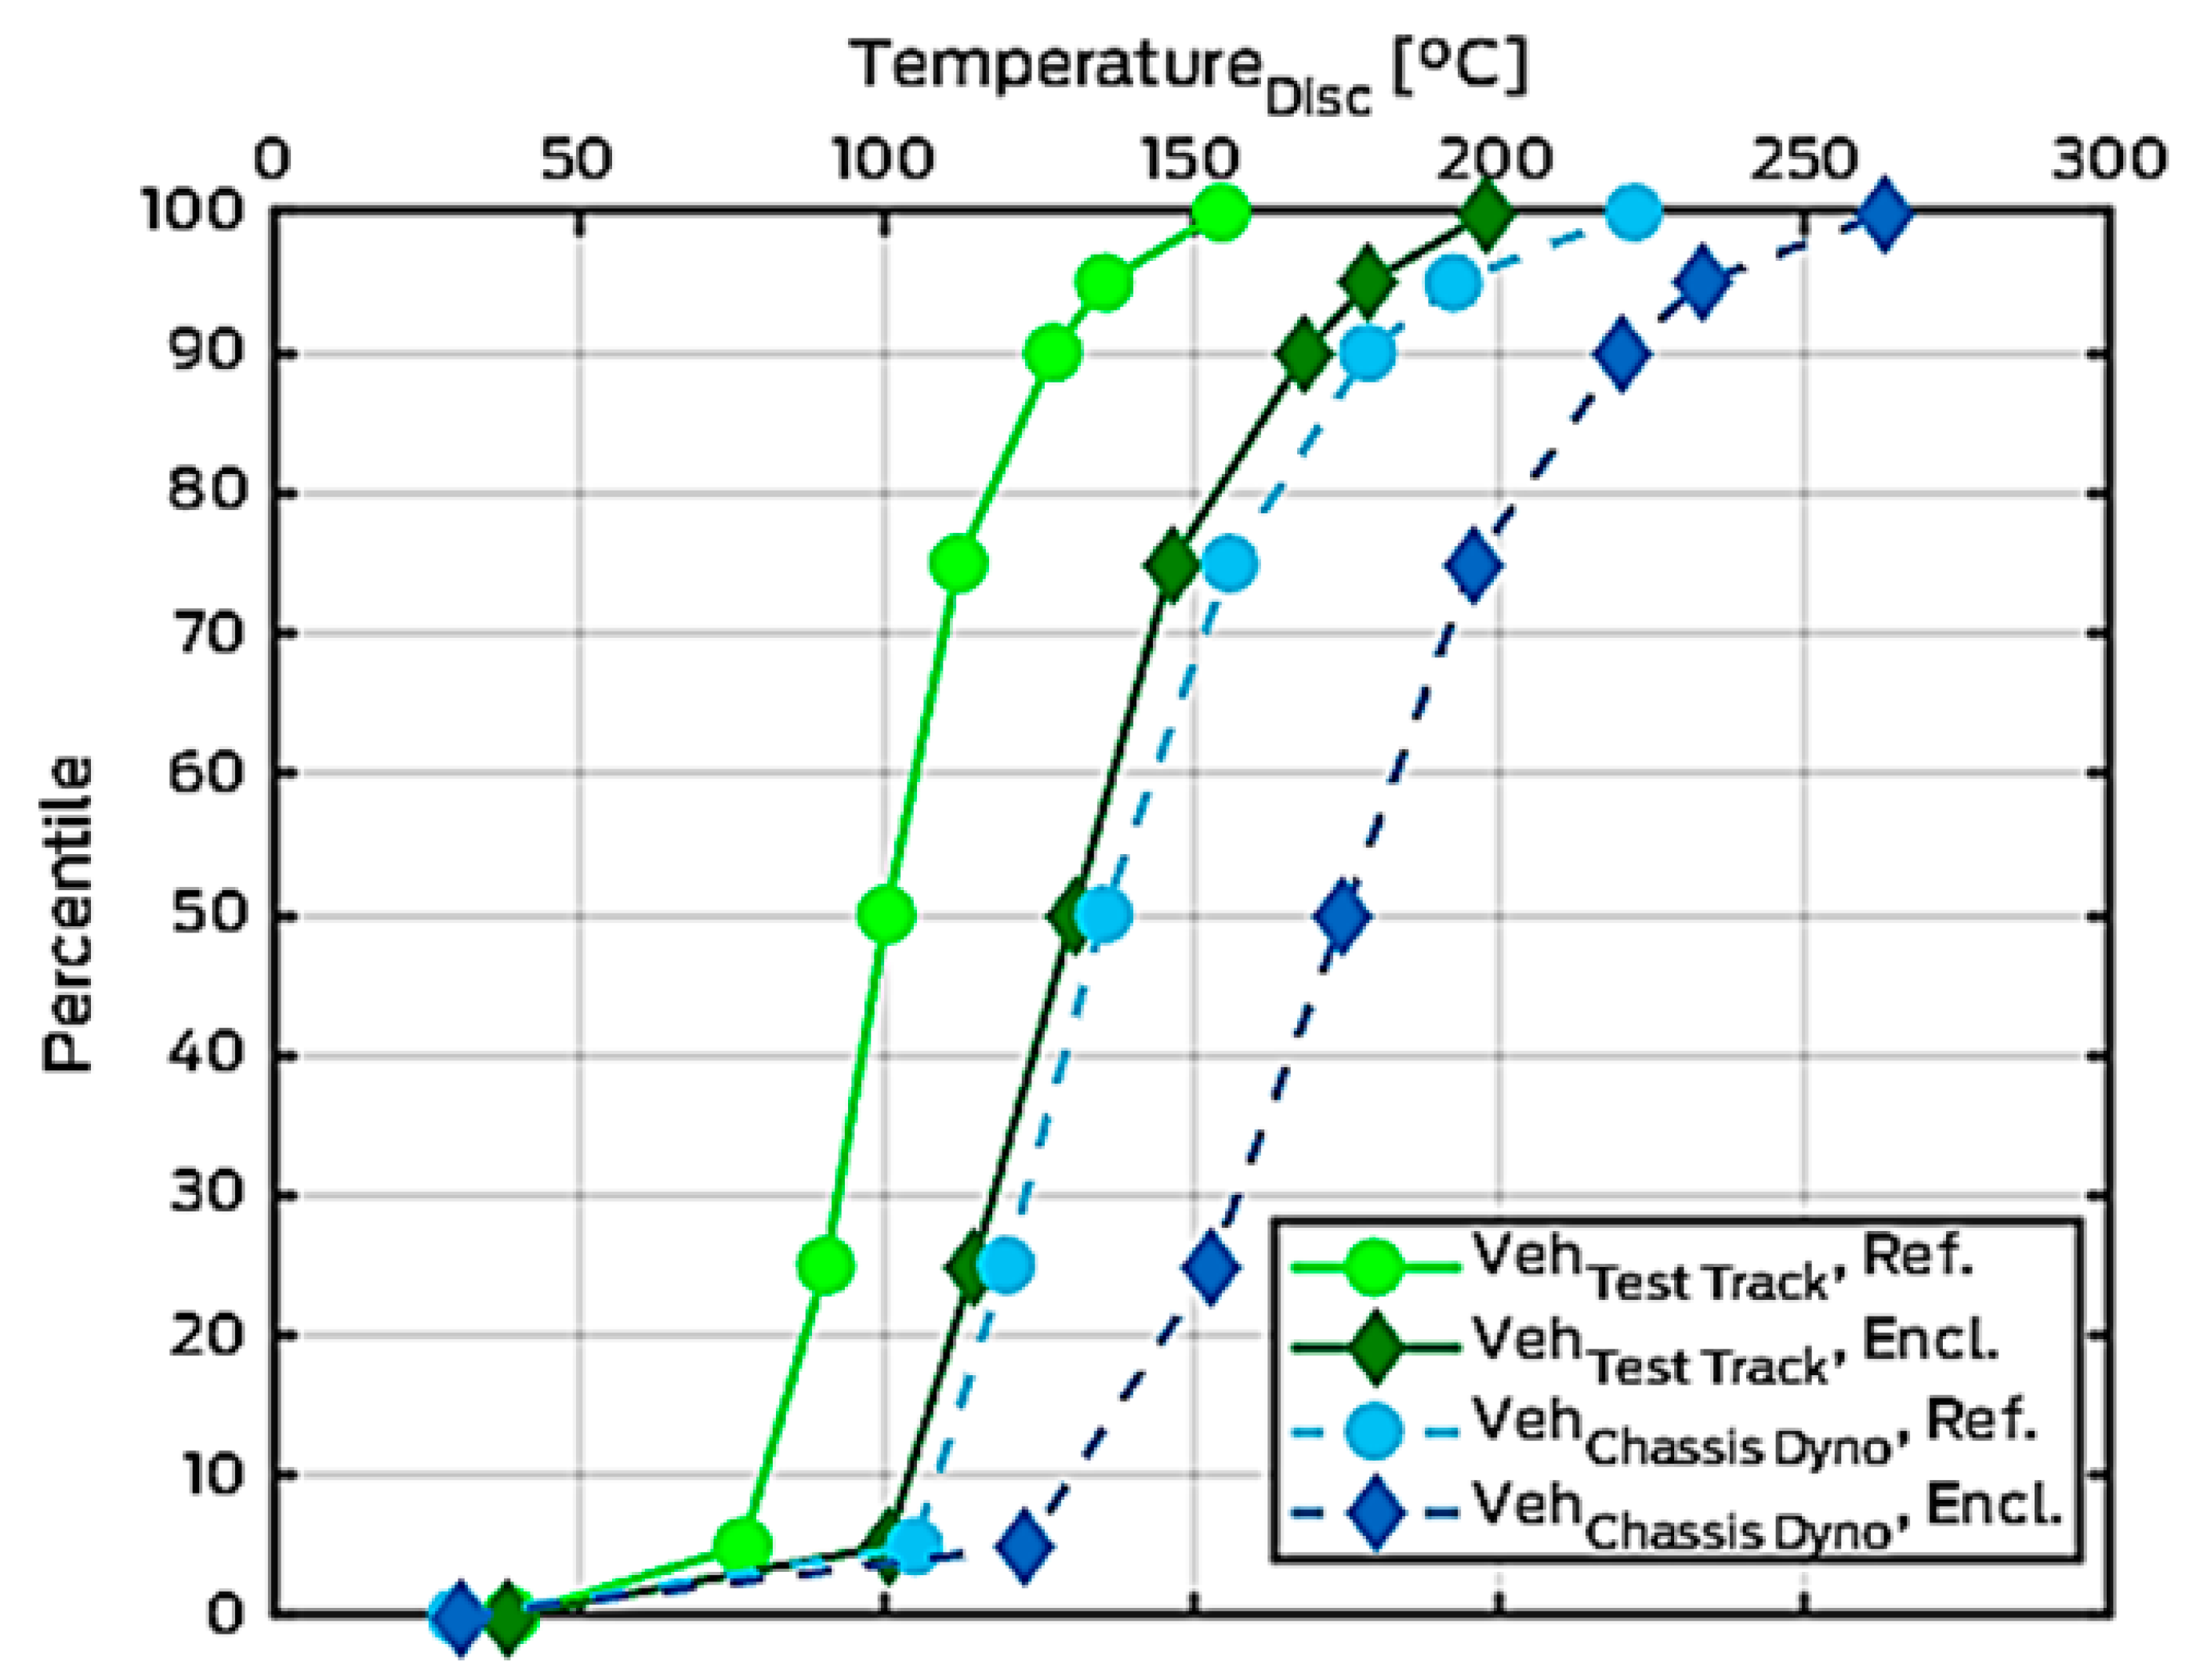
Brake temperatures appear to have large influence on PN emissions [7,15,30]. Figure 3 compares brake disc temperatures recorded with sliding thermocouples during the 3h-LACT at the chassis dynamometer and on the test track. Test track data originates from a previous study with identical vehicles, measurement setup, and brake material [15].
Both on the test track as well as on the chassis dynamometer there is an average 42 °C difference (test track: 42 °C, chassis dynamometer: 43 °C) in maximum brake disc temperatures between the enclosed wheel and the reference (unmodified) wheel. Higher temperatures in the enclosed wheel are caused by the limited airflow/cooling of the brake disc. In addition, the chassis dynamometer cooling fan is not sufficient to reproduce on-road brake cooling as evident by the shift in brake disc temperatures in Figure 3. Overall, the maximum brake disc temperatures at the enclosed measurement wheel are approximately 110 °C higher than observed at an unmodified wheel in the field. This can be seen as a limitation of the measurement method adopted in the present study as the estimated PN emission factors are expected to be higher on the dynamometer than these expected from the same vehicle in the field. Although applying a real-world test cycle, the applied measurement procedure leads to higher brake disc temperatures compared to an unmodified vehicle which may cause potential artefacts. For the vehicle measurement approach, one needs to balance between representative temperatures and sufficient signal-to-noise ratio as discussed by Farwick zum Hagen et al. [15].

3.2. Repeatability Measurement (LACT-20)

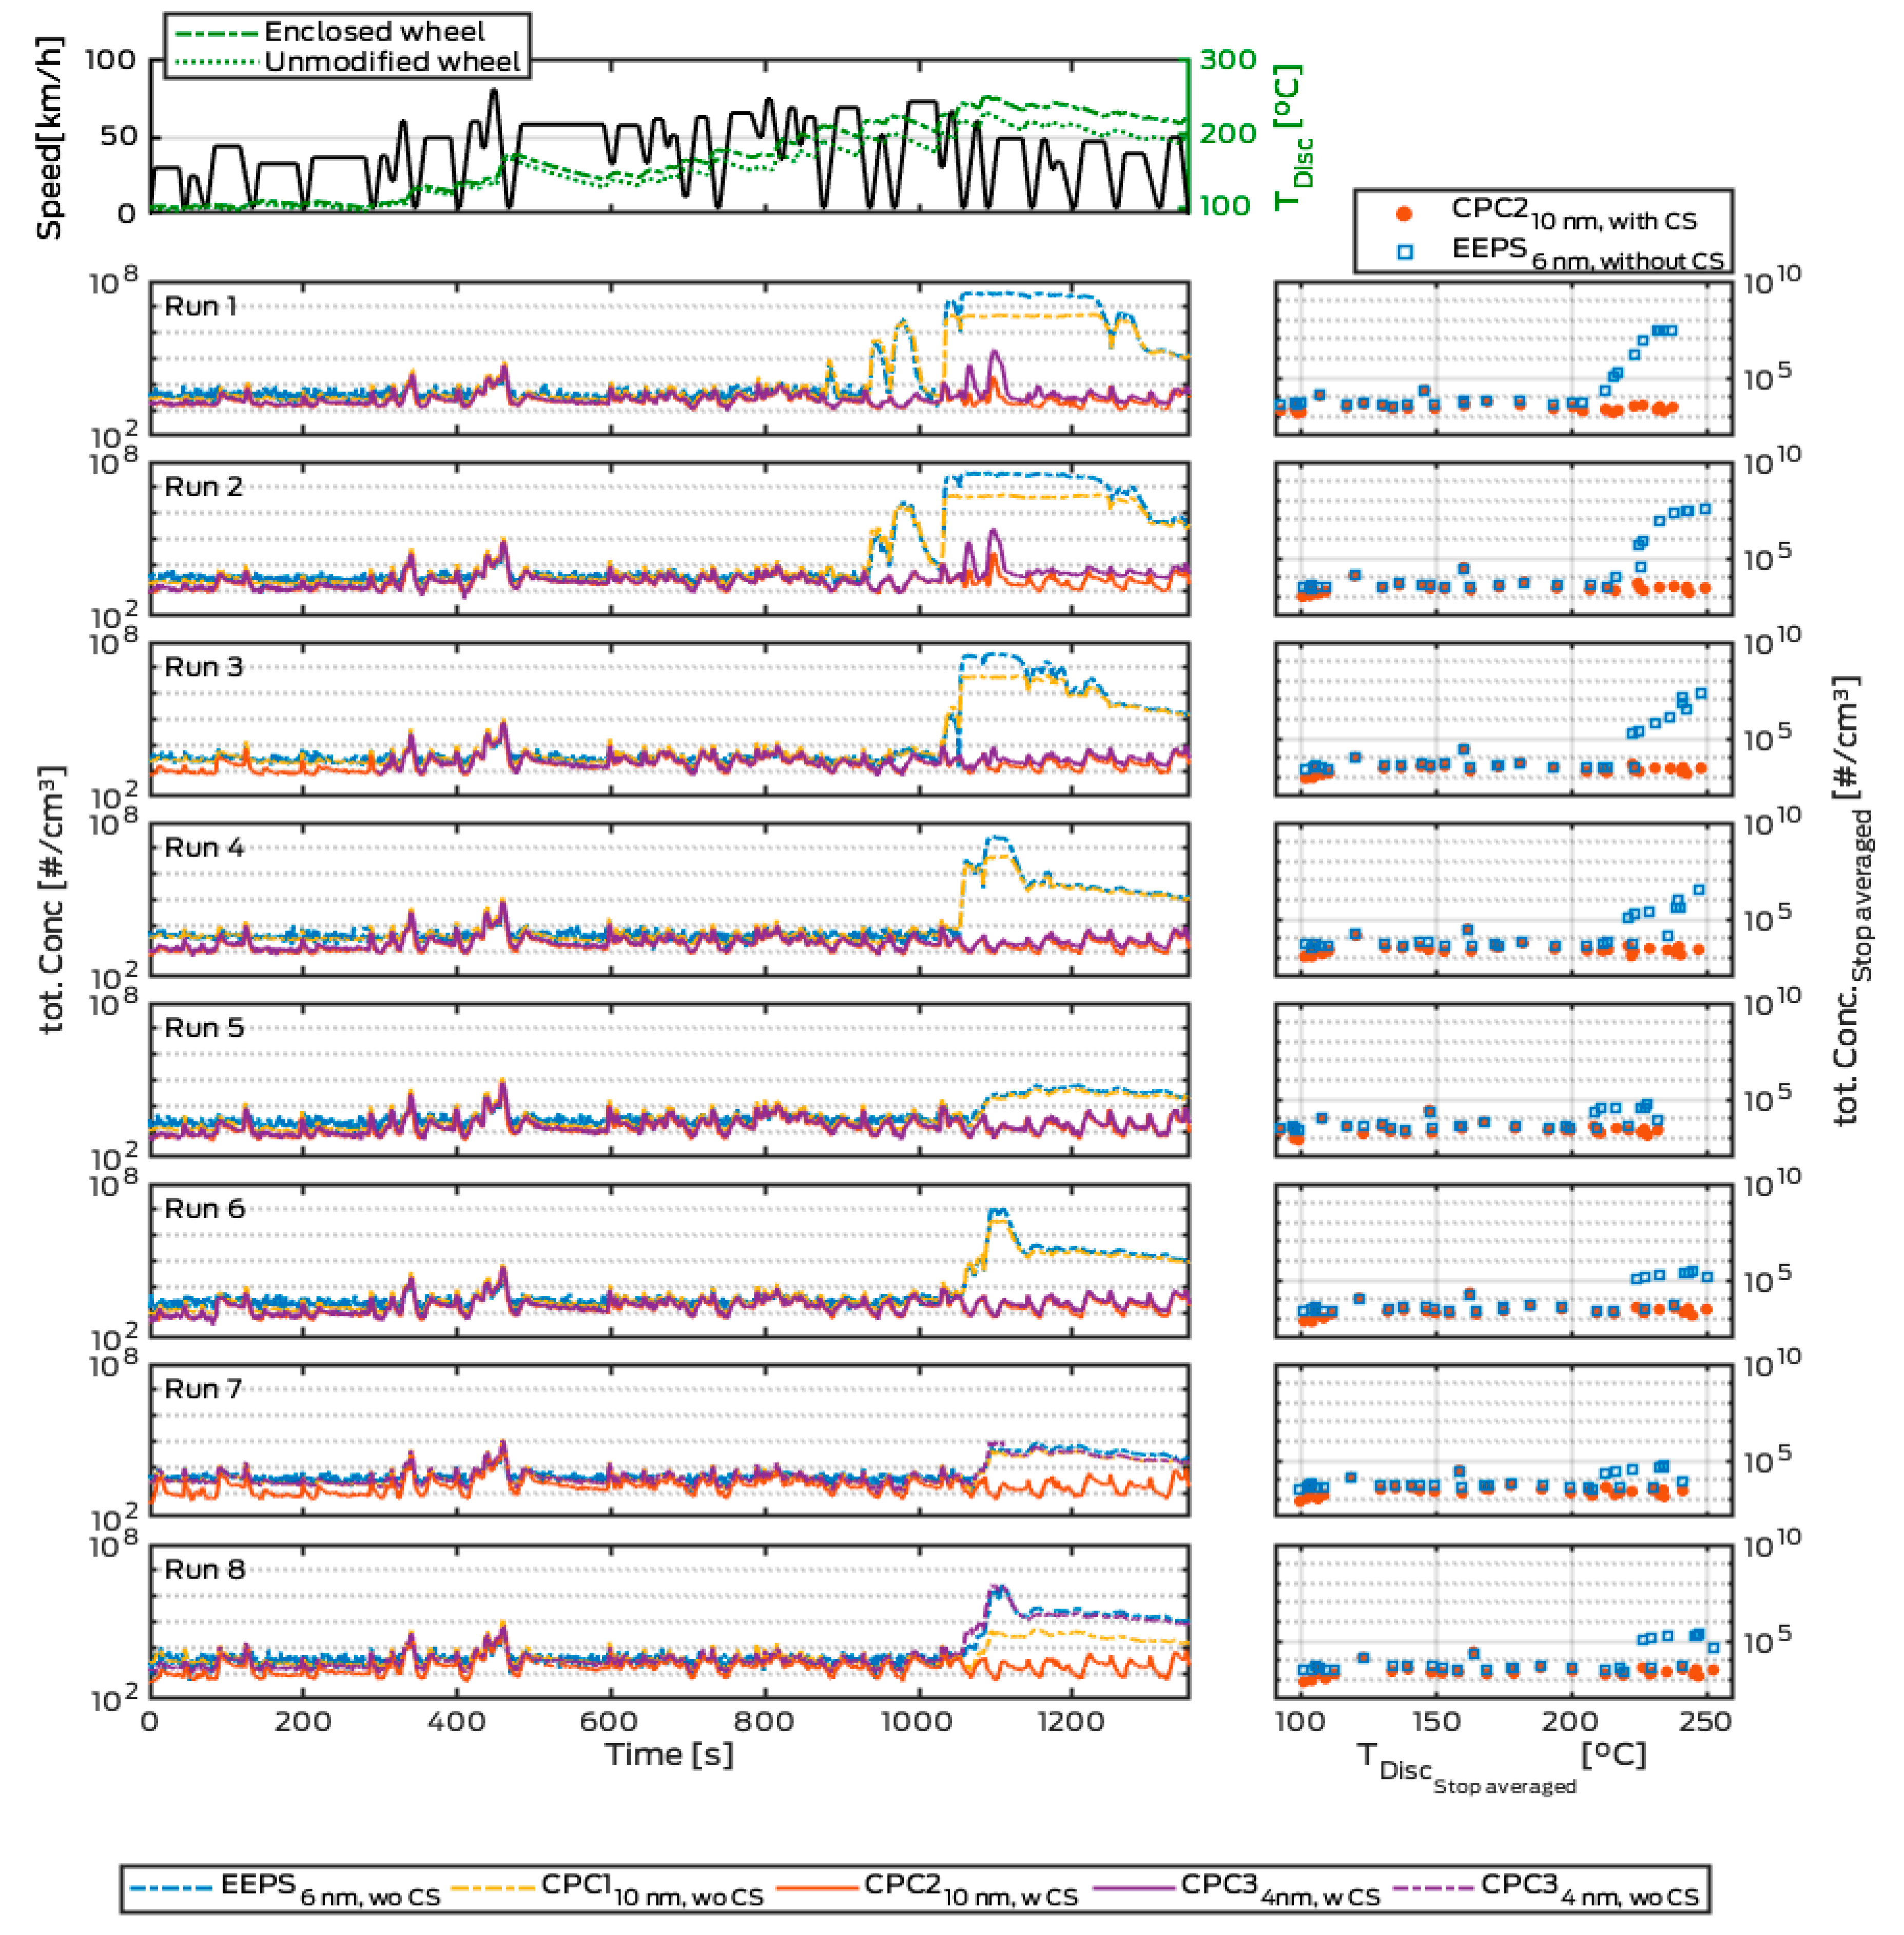
Figure 4 gives an overview of all eight runs of the LACT-20 driven in consecutive order on a single day. The start condition for each run was a disc temperature of 100 °C measured at the enclosed wheel. During runs one to six, CPC34nm measured with CS while in runs seven and eight without CS. All of the shown PN traces are at the same level for the first 800 s of the test cycle for all the repeats and regardless the presence or not of the CS. The slightly higher traces measured with EEPS1 during the first 800 s are attributed to the background noise of the instrument electrometers. Background concentration measured by EEPS with running blower was low with small variations among the 8 runs (3.5·103 #/cm3 ± 0.9·103 #/cm3). Due to its measurement principle, the EEPS is generally less sensitive than a CPC for low particle concentrations [44]. Furthermore, electrical mobility spectrometers are known to under- or over-estimate concentrations depending on particle size, morphology, and presence of agglomerates [45,46]. After approximately 800 s the solid (CS) and total (without CS) particle number traces deviate from each other.
Total particle emissions are in line with solid particle emissions until a critical temperature of the brake disc is reached. Both CPC and EEPS pre-CS signals are saturated during runs one to four for the high temperature stops which may reach up to 260 °C towards the end of the cycle (Figure 4). There are particle emissions which are not found in the post-CS CPC data. These volatile emissions are highly variable in number between the runs thus confirming the assumption of Farwick zum Hagen et al. [15] who expected that the vast majority of reported PN are volatile particles. As can be seen in runs seven and eight, volatile particle emissions for CPC110nm and CPC34nm are at the same level. While this may suggest that there are no sub-10 nm volatile particle emissions, it should be noted, that the sampling lines were not optimized for very small particles. Thus, volatile particle emissions below 10 nm may be affected by diffusional losses. The stop-averaged data presented on the right side in Figure 4 suggest a critical temperature of about 210 °C for runs one to four. Beyond these temperatures, particle generation increases exponentially with temperature as also observed during on-road, dynamometer, and pin-on-disc testing [15,27,30].
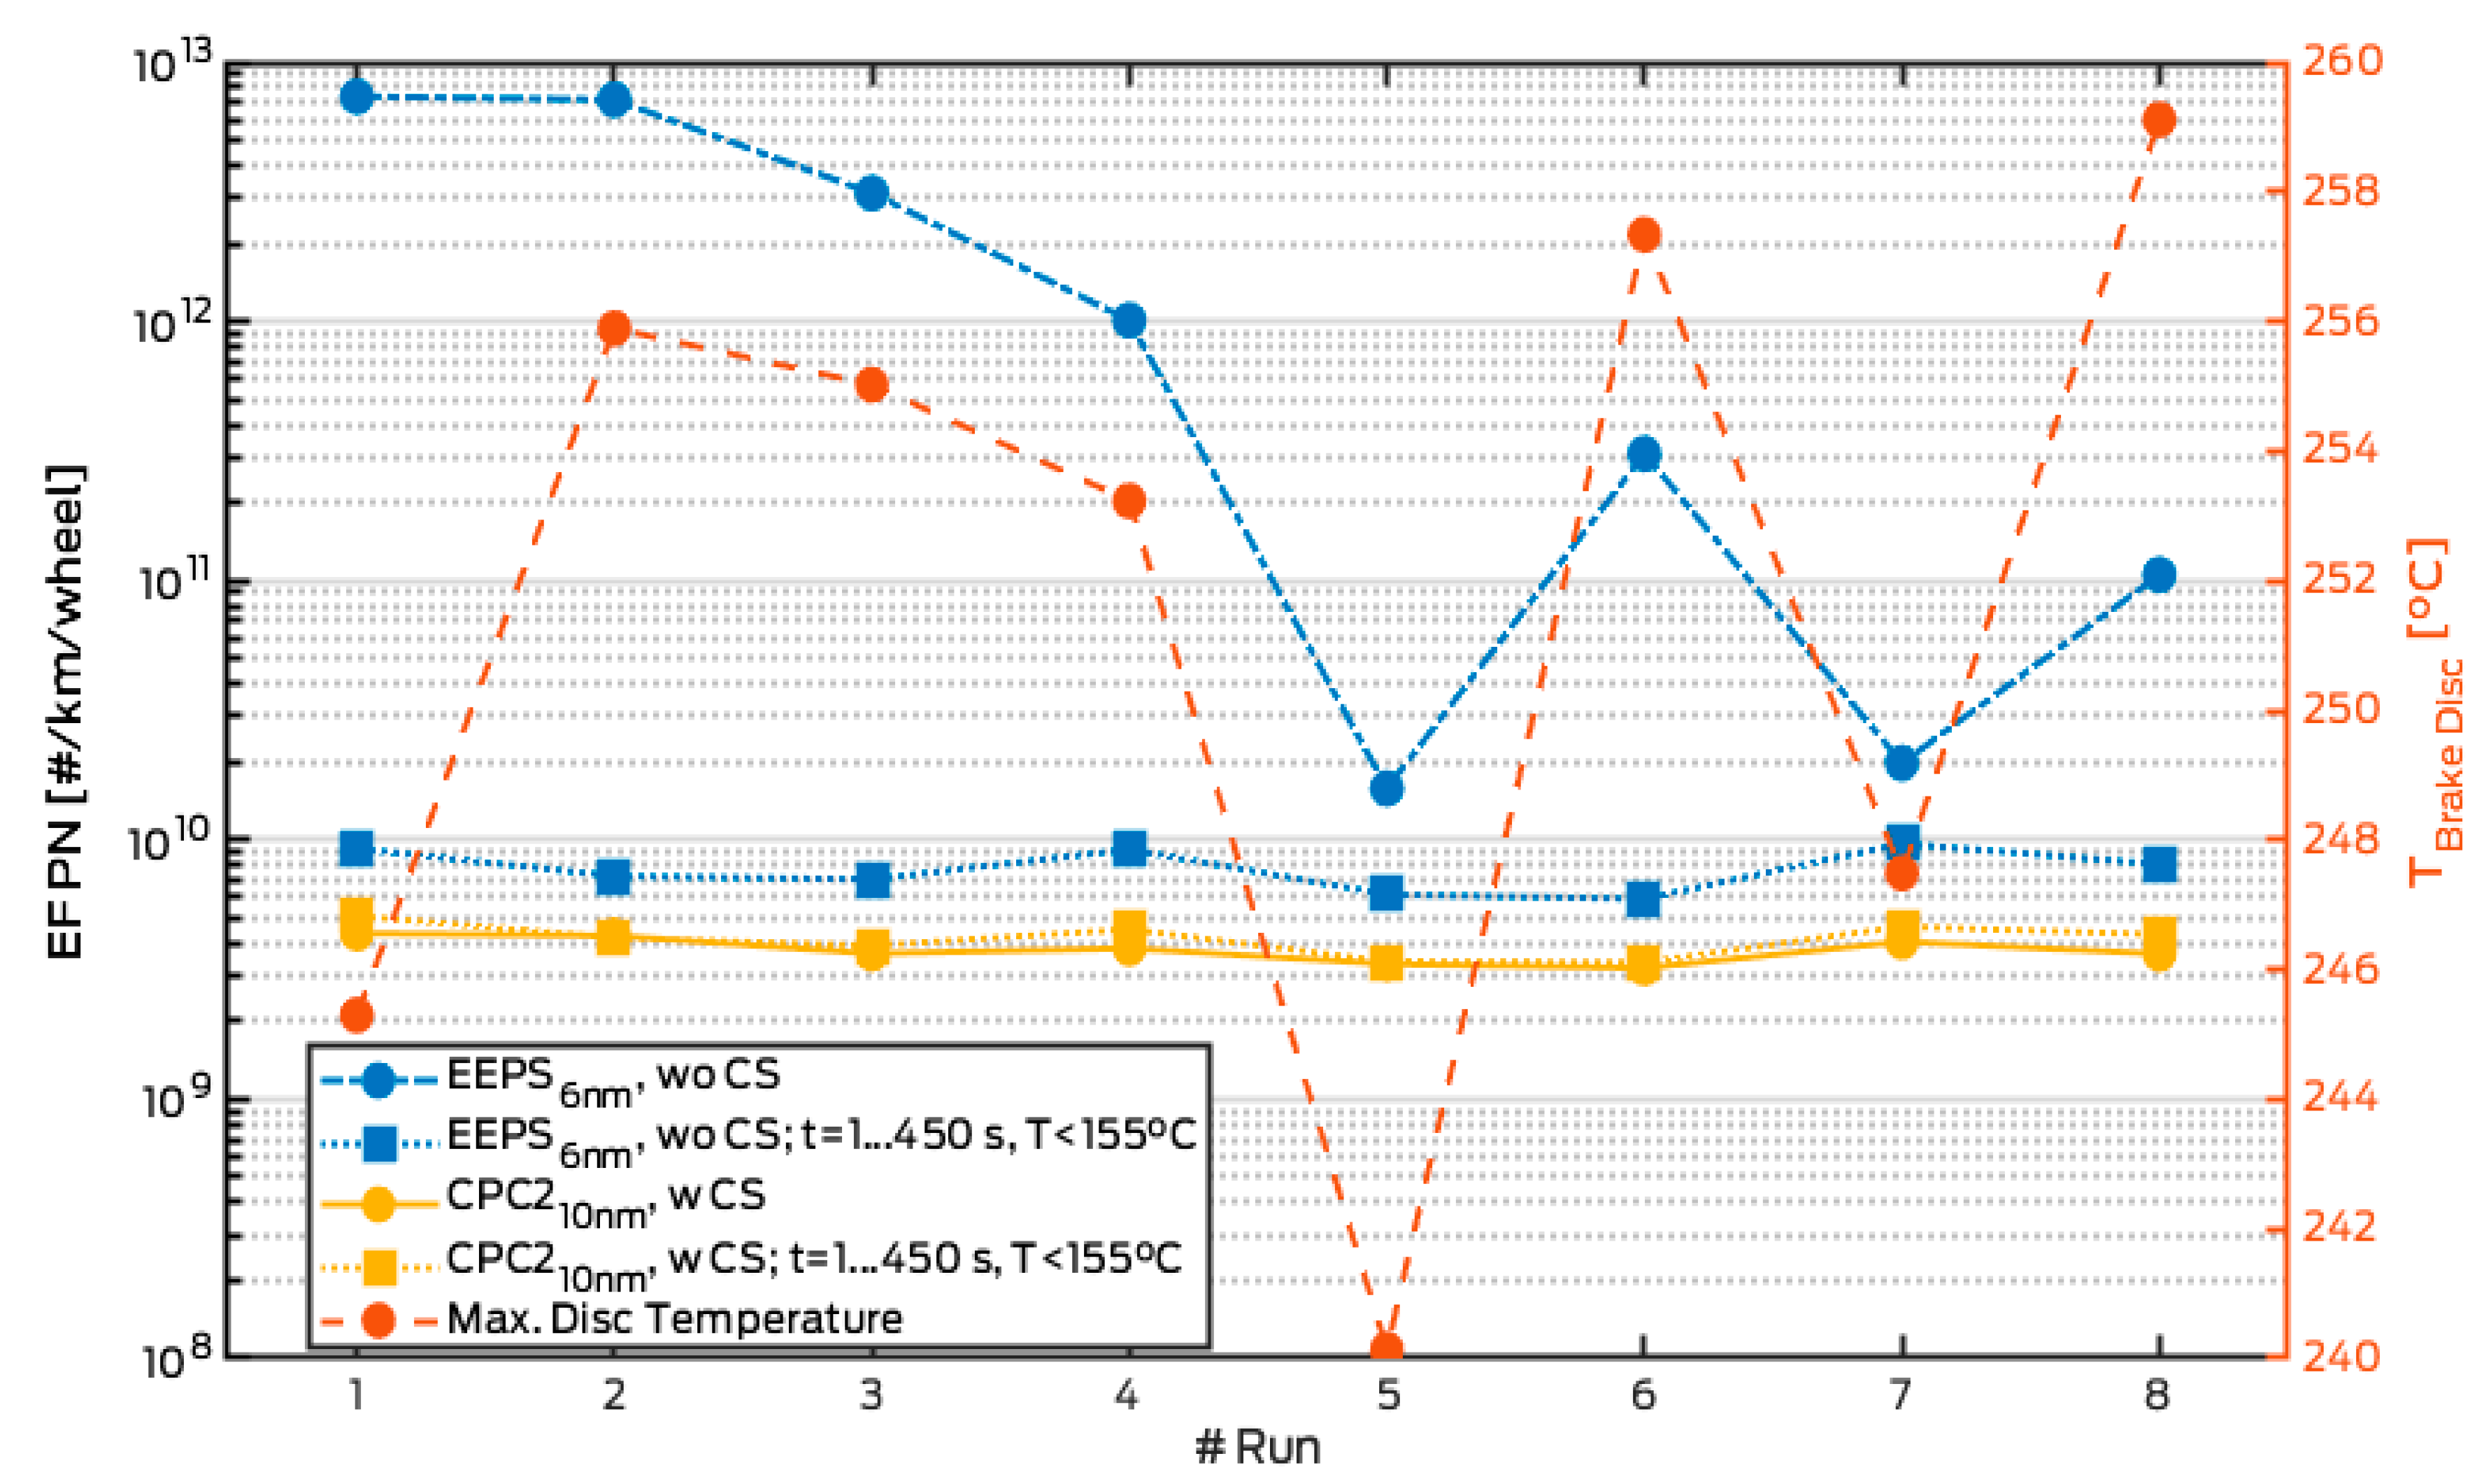
Figure 5 shows the estimated PN EFs for both EEPS (w/o CS) and CPC (with CS) which operated in the same configuration throughout the repeatability runs. Note that all EFs in the current paper are calculated on a wheelbase, i.e., emissions per distance per brake.
The average EF varies by several orders of magnitude between both devices (EFEEPS=2.4∙1012 #/km, EFCPC2=3.8∙109 #/km). The EEPS measurement without CS is very unstable while the measurement of the CPC with CS suggests a steady emission state. This is confirmed by the coefficient of variation (COV) defined as the ratio of the standard deviation to the mean, which is 0.11 for the CPC EF with CS and 1.3 for the EEPS without CS. The COV of PM10 measurements during the LACT-20 repeatability runs is 0.13 which is comparable to the post-CS PN measurement results. The EEPS data without CS suggest a reduction trend for the number of volatile particles for each repetition of the LACT-20. This trend is modulated for runs five to eight and correlates to the maximum brake disc temperature which varied between 240 °C and 259 °C. One should note that disc temperatures as measured by means of sliding or embedded thermocouples are averaged measures across a macroscopic area and may not be directly related to PN emissions. Despite the limitations, still these temperatures are the only observable that give insights into the PN generation mechanism. It is expected that ultrafine particle emissions originate from so-called disc hotspots, which may reach very high local temperatures during braking.

3.3. 3h-LACT

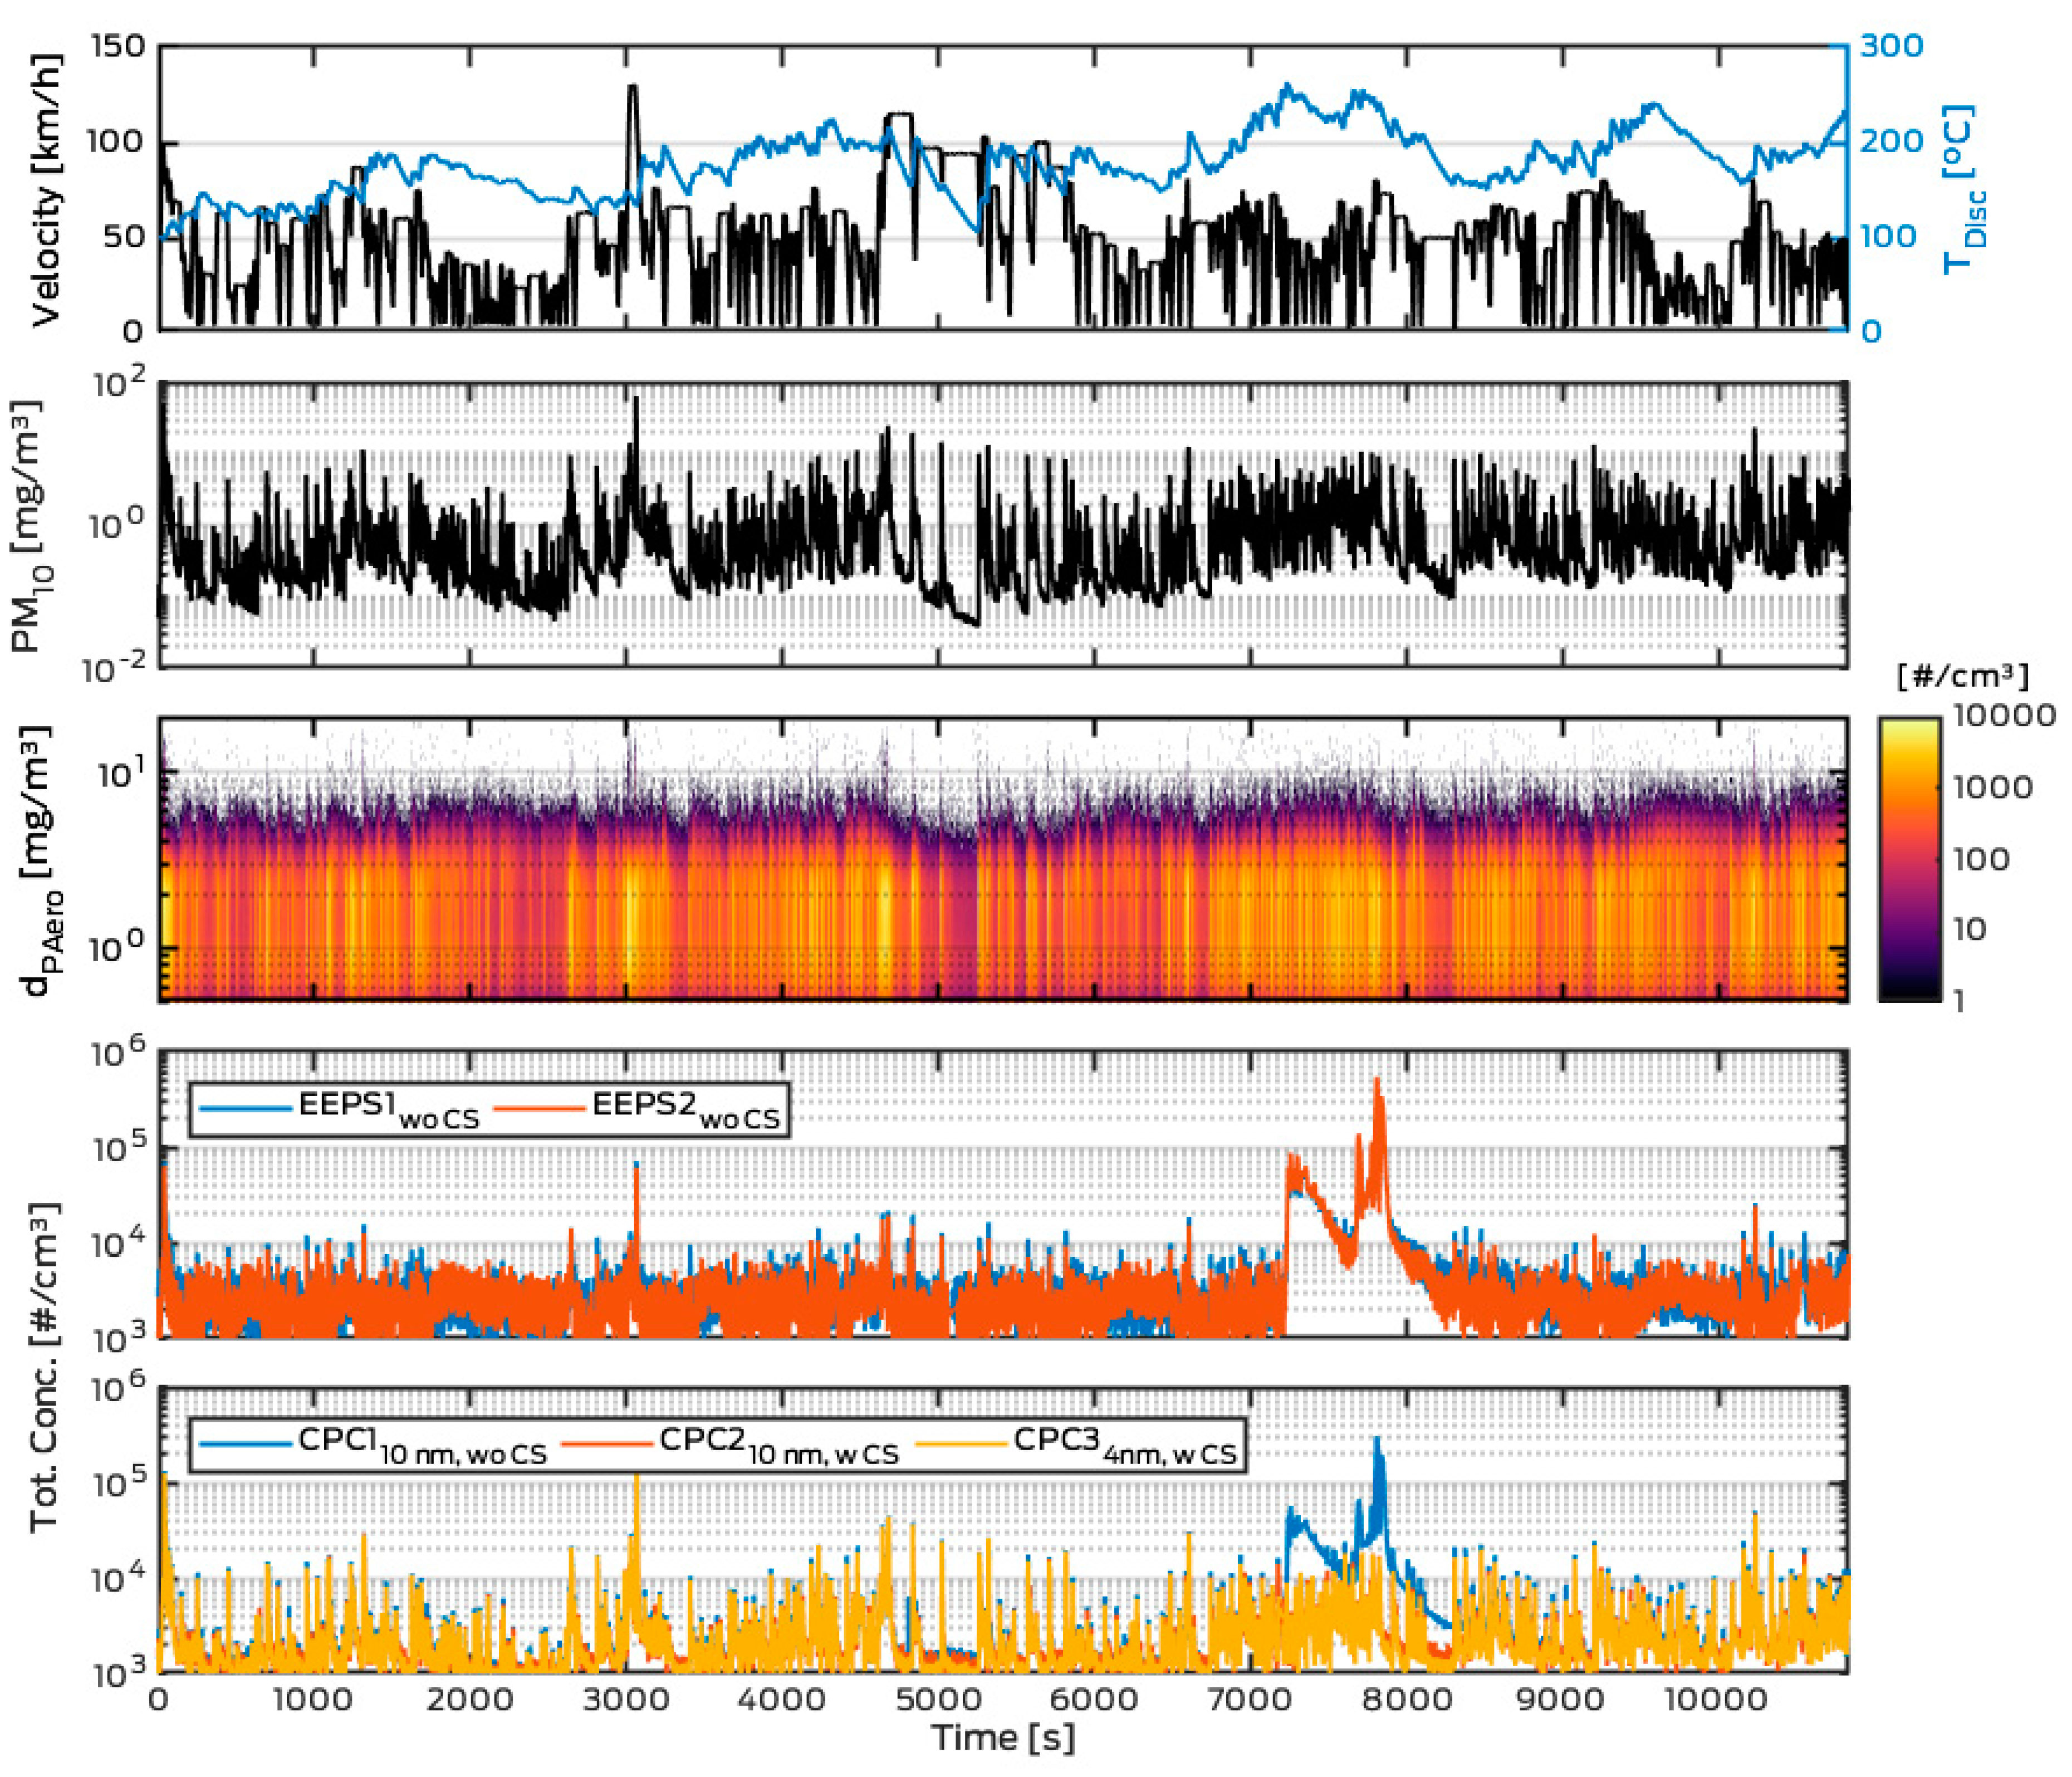
Following the repeatability measurements, two runs of the 3h-LACT were driven on a single day on the chassis dynamometer. In contrast to the setup presented in Figure 1, both EEPS devices were operated without CS. The setup change was made since no signal above background concentration was found for the EEPS post-CS in the preceding tests. Figure 6 shows the time trace of the second 3h-LACT run.
As shown in Figure 6 estimated emission levels from different devices are in good agreement. Emission levels are decreasing between the runs by 53% for devices without CS (EEPS1 = −54%, CPC110nm = −52%) and 25% for devices with CS (CPC210nm = −23%, CPC34nm = −26%). At these low emission levels, the application of a CS reduces the number of particles by approximately 75% (run #1) and 55% (run #2). The estimated PN EF for the second repetition is 7∙109 #/km (EEPS, without CS) and 3∙109 #/km (CPC210nm, with CS). These emission factors are much lower than previously found on the test track with the same brake material (EFEEPS,wo CS=2∙1012 #/km, cf. Farwick zum Hagen et al. [15]) On the other hand, the emissions are comparable to those reported by Perricone et al. [47] for a modified SAE-J 2707-test cycle. The difference between the current paper and that of Farwick zum Hagen et al. [15] might be caused by the high temperatures reached during preceding repeatability tests of up to 260 °C. The vast majority of evaporable ingredients may have been already removed. This shows once more the high influence of brake temperatures and drive history on the volatile particle number emission levels. As evident in Figure 6, particle concentrations pre- and post-CS are on the same level for the majority of events in the cycle. Volatile particle generation is linked to a high temperature section in the cycle. No volatile particles are expected for disc temperatures < 155 °C, which are representative of the highest temperatures observed during on-road testing (Figure 3). PM10 emission factors also decreased between the two runs but to a smaller degree (−5%).

3.4. Pyramid Cycle

Figure 7 shows the time trace of the first run of the pyramid cycle which does not contain a single brake application. However, particle events are measured that are closely correlated to changes in vehicle speed. Each event is characterized by a rise in particle concentration, most pronounced for coarse particles as measured by the APS and Dusttrak. The particle mass concentration, as measured by Dusttrak, rises by up to an order of magnitude during these events. Following such an event, particle concentrations decrease quickly. After about 30–60 s the concentration decreases much slower as an almost constant concentration level is reached. The rise in particle concentration is especially pronounced during accelerations and much lower during decelerations.
We conclude that these particles are actually generated at the brakes. First, it is unlikely that these events are only a measurement artefact since they are observed simultaneously by all particle measurement devices which are each based on different measurement principles. Secondly, as shown by Farwick zum Hagen et al. [15], the enclosed measurement setup shields contamination from other potential sources very effectively, i.e., a background contribution. It is mentioned that particles coming from the tire/road interface comprise less than 8% of total particles. Thirdly, running the pyramid cycle on a brake dynamometer in absence of any tires led to comparable results as shown in Figure 7b [15].
In this paper, these off-braking emissions, also called brake drag related emissions, were estimated to contribute between 26% and 30% to the total PM10 emissions for the first and second run of the 3h-LACT. These figures are slightly lower than the ones previously reported 38–41% for on-road testing with the same material and methodology [15] and much lower than the 50–91% reported by Chasapidis et al. [21] at a chassis-dyno level. In fact, these figures are much closer to the 34% reported previously for dynamometer testing [15].

4. Conclusions

Brake cooling is limited on the chassis dynamometer due to a reduced airflow across the brakes also due to the present enclosed measurement approach. As a result maximum temperatures at the enclosed measurement wheel are up to 109 °C higher than observed at an unmodified wheel in the field. Since PN emissions are strongly temperature dependent this may lead to overestimation of PN emissions. Unrealistic high brake temperatures may occur and need to be ruled out by comparison with on-road temperature measurements when analyzing PN emissions.
Under conditions of such non-representative brake temperatures, PN emission factors of more than 7∙1012 # km−1 brake−1 were found during the LACT-20. The vast majority of PN was found to be volatile, i.e., solid particle emissions were three orders of magnitude lower. Sampling through a catalytic stripper resulted in a PN EF of 4∙109 # km−1 brake−1. During the more representative 3h-LACT the PN EFwithout CS was app. 1∙1010 # km−1 brake−1 of which 55–75% were found to be volatile (PN EFwith CS = 3.5∙109 # km−1 brake−1). No volatile particle emissions below 10 nm were found; however, the sampling system was not optimized for losses in such low sizes. Above a certain critical disc temperature, total brake PN emissions are highly variable compared to the solid particle fraction which shows significantly reduced coefficient of variations.
It was shown that brakes may release particles even if no braking occurs. We believe this observation is especially relevant for researchers investigating other non-exhaust emissions, e.g., tire wear particles. There is the risk of false classification which may lead to biased emission factors for brake wear and tire/road wear.
Chassis dynamometer measurements seem to be a reasonable tool for investigating brake wear particles. They offer the benefit of controlling environmental parameters. Furthermore, they may help to better understand vehicle level effects of brake wear particle emissions including losses at the wheel and vehicle chassis. However, central problems remain. This includes the limited and artificial brake cooling. Furthermore, the ventilation rate in most chassis dynamometers is rather low. This may result in accumulation of particles and elevated background levels in the measurement chamber. There is also a potential contamination from increased tire wear by tire slip on the roller which needs to be monitored. Last but not least, a rather complicated measurement approach is required in order to avoid contamination with particles originating from other sources (i.e., tires and existing dust).

Author Contributions

Conceptualization, M.M. and T.G.; methodology, M.M. and T.L.; validation, M.M., T.L. and R.V.; investigation, M.M.; data curation, M.M., T.L.; writing—original draft preparation, M.M. and T.G.; writing—review and editing, M.M., T.L., T.G., R.V.; supervision, R.V.

Funding

This research was funded by the EU through the Horizon 2020 project, grant number 636592.

Acknowledgments

This work was supported by the EU through the Horizon 2020 project “LowBraSys” [Grant Number 636592, 2015-2019]. We thank all project partners for keen discussions. We acknowledge technical support from the staff at Joint Research Centre, Italy.

Conflicts of Interest

The authors declare no conflict of interest.

References

  1. Padoan, E.; Amato, F. Vehicle Non-Exhaust Emissions: Impact on Air Quality. In Non-Exhaust Emissions—An Urban Air Quality Problem for Public Health—Impact and Mitigation Measures; Elsevier: Amsterdam, The Netherlands, 2018; Chapter 2; pp. 21–57. [Google Scholar]
  2. Denier van der Gon, H.A.C.; Gerlofs-Nijland, M.E.; Gehrig, R.; Gustafsson, M.; Janssen, N.; Harrison, R.M.; Hulskotte, J.; Johansson, C.; Jozwicka, M.; Keuken, M.; et al. The policy relevance of wear emissions from road transport, now and in the future—An international workshop report and consensus statement. Am. J. Air Waste Manag. Assoc. 2013, 63, 136–149. [Google Scholar] [CrossRef] [PubMed]
  3. Amato, F.; Cassee, F.R.; Denier van der Gon, H.A.C.; Gehrig, R.; Gustafsson, M.; Hafner, W.; Harrison, R.M.; Jozwicka, M.; Kelly, F.J.; Moreno, T.; et al. Urban air quality: The Challenge of traffic non-exhaust emissions. J. Hazard. Mater. 2014, 30, 31–36. [Google Scholar] [CrossRef] [PubMed]
  4. Denier van der Gon, H.A.C.; Hulskotte, J.; Jozwicka, M.; Kranenburg, R.; Kuenen, J.; Visschedijk, A. European Emission Inventories and Projections for Road Transport. Non-Exhaust Emissions. In Non-Exhaust Emissions—An Urban Air Quality Problem for Public Health—Impact and Mitigation Measures; Elsevier: Amsterdam, The Netherlands, 2018; Chapter 5; pp. 102–121. [Google Scholar]
  5. Collier, S.; Yoon, S.; Long, J.; Pournazeri, S.; Herner, J.; Stanard, A.; Koupal, J.; Kishan, S.; Agudelo, C.; Vedula, R.; et al. Brake-wear PM Research for California Emission Inventory. In Proceedings of the 50th PMP IWG Meeting, Brussels, Belgium, 3–4 April 2019; Available online: https://wiki.unece.org/display/trans/PMP+50th+Session (accessed on 16 September 2019).
  6. Grigoratos, T.; Martini, G. Brake wear particle emissions, A review. Environ. Sci. Pollut. Res. 2015, 22, 2491–2504. [Google Scholar] [CrossRef] [PubMed]
  7. Mathissen, M.; Grochowicz, J.; Schmidt, C.; Vogt, R.; Farwick zum Hagen, F.; Grabiec, T.; Steven, H.; Grigoratos, T. A novel real-world braking cycle for studying brake wear particle emissions. Wear 2018, 414–415, 219–226. [Google Scholar] [CrossRef]
  8. Garg, B.D.; Cadle, S.H.; Mulawa, P.A.; Groblicki, P.J. Brake wear particulate matter emissions. Environ. Sci. Technol. 2000, 34, 4463–4469. [Google Scholar] [CrossRef]
  9. Iijima, A.; Sato, K.; Yano, K.; Kato, M.; Kozawa, K.; Furuta, N. Emission factor for antimony in brake abrasion dust as one of the major atmospheric antimony sources. Environ. Sci. Technol. 2008, 42, 2937–2942. [Google Scholar] [CrossRef] [PubMed]
  10. Hulskotte, J.; Roskam, G.D.; Denier van der Gon, H. Elemental composition of current automotive braking materials and derived air emission factors. Atmos. Environ. 2014, 99, 436–445. [Google Scholar] [CrossRef]
  11. Hagino, H.; Oyama, M.; Sasaki, S. Laboratory testing of airborne brake wear particle emissions using a dynamometer system under urban city driving cycles. Atmos. Environ. 2016, 131, 269–278. [Google Scholar] [CrossRef] [Green Version]
  12. Lugovyy, D.; Gramstat, S. Novel WLTP cycle—PM and PN results. In Proceedings of the 50th PMP IWG Meeting, Brussels, Belgium, 3–4 April 2019; Available online: https://wiki.unece.org/display/trans/PMP+50th+Session (accessed on 16 September 2019).
  13. Mamakos, A.; Arndt, M.; Augsburg, K.; Hesse, D. Brake Dust PM Results measured on a Dyno running the Novel Test Cycle. In Proceedings of the 50th PMP IWG Meeting, Brussels, Belgium, 3–4 April 2019; Available online: https://wiki.unece.org/display/trans/PMP+50th+Session (accessed on 16 September 2019).
  14. Robere, M. Exploratory Brake Emissions Benchmarking—A Design of Experiments. In Proceedings of the 50th PMP IWG Meeting, Brussels, Belgium, 3–4 April 2019; Available online: https://wiki.unece.org/display/trans/PMP+50th+Session (accessed on 16 September 2019).
  15. zum Hagen, F.H.F.; Mathissen, M.; Grabiec, T.; Hennicke, T.; Rettig, M.; Grochowicz, J.; Vogt, R.; Benter, T. Study of Brake Wear Particle Emissions: Impact of Braking and Cruising Conditions. Environ. Sci. Technol. 2019, 53, 5143–5150. [Google Scholar] [CrossRef]
  16. Mamakos, A.; Arndt, M.; Augsburg, K.; Hesse, D. First insights on brakewear PN over the novel cycle. In Proceedings of the 48th PMP IWG Meeting, Ispra, Italy, 7–8 November 2018; Available online: https://wiki.unece.org/display/trans/PMP+48th+Session (accessed on 16 September 2019).
  17. Baldauf, R.; Devlin, R.; Gehr, P.; Giannelli, R.; Hassett-Sipple, B.; Jung, H.; Martini, G.; McDonald, J.; Sacks, J.; Walker, K. Ultrafine Particle Metrics and Research Considerations: Review of the 2015 UFP Workshop. Int. J. Environ. Res. Public Health 2016, 13, 1054. [Google Scholar] [CrossRef]
  18. Li, Y.; Lane, K.; Corlin, L.; Patton, A.; Durant, J.; Thanikachalam, M.; Woodin, M.; Wang, M.; Brugge, D. Association of long-term near-highway exposure to ultrafine particles with cardiovascular diseases, diabetes and hypertension. Int. J. Environ. Res. Public Health 2017, 14, 461. [Google Scholar] [CrossRef] [PubMed]
  19. Mathissen, M.; Scheer, V.; Vogt, R.; Benter, T. Investigation on the potential generation of ultrafine particles from the tire–road interface. Atmos. Environ. 2011, 45, 6172–6179. [Google Scholar] [CrossRef]
  20. Kwak, J.H.; Kim, H.; Lee, J.; Lee, S. Characterization of non-exhaust coarse and fine particles from on-road driving and laboratory measurements. Sci. Total Environ. 2013, 458–460, 273–282. [Google Scholar] [CrossRef] [PubMed]
  21. Chasapidis, L.; Grigoratos, T.; Zygogianni, A.; Tsakis, A.; Konstandopoulos, A. Study of brake wear particle emissions of a minivan on a chassis dynamometer. Emiss. Control Sci. Technol. 2018, 4, 271–278. [Google Scholar] [CrossRef]
  22. Hagino, H.; Oyama, M.; Sasaki, S. Airborne brake wear particle emission due to braking and accelerating. Wear 2015, 334–335, 44–48. [Google Scholar] [CrossRef]
  23. Agudelo, C.; Deacon, P.; Marschall, M.; Markiewicz, R.; Hortet, A.; Tiwari, A.; Anderson, R. Systematic assessment of brake emissions during dynamometer tests. In Proceedings of the EuroBrake2017 Conference, Dresden, Germany, 2–4 May 2017. EB2017-VDT-026. [Google Scholar]
  24. Gramstat, S.; Cserhati, A.; Lugovyy, D.; Schroder, M. Investigations of brake particle emissions—Testing method, vehicle peculiarities and friction material influence. In Proceedings of the EuroBrake2017 Conference, Dresden, Germany, 2–4 May 2017. EB2017-VDT-016. [Google Scholar]
  25. Matějka, V.; Metinoz, I.; Wahlström, J.; Alemani, M.; Perricone, G. On the running-in of brake pads and discs for dyno bench tests. Tribol. Int. 2017, 115, 424–431. [Google Scholar] [CrossRef]
  26. Perricone, G.; Matějka, V.; Alemani, M.; Valota, G.; Bonfanti, A.; Ciotti, A.; Olofsson, U.; Söderberg, A.; Wahlström, J.; Nosko, O.; et al. A concept for reducing PM10 emissions for car brakes by 50%. Wear 2018, 396–397, 135–145. [Google Scholar] [CrossRef]
  27. zum Hagen, F.H.F.; Mathissen, M.; Grabiec, T.; Hennicke, T.; Rettig, M.; Grochowicz, J.; Vogt, R.; Benter, T. Real-Driving Measurements of Brake Wear Particle Emissions. Atmos. Environ. 2019. submitted. [Google Scholar]
  28. Verma, P.C.; Alemani, M.; Gialanella, S.; Lutterotti, L.; Olofsson, U.; Straffelini, G. Wear debris from brake system materials: A multi-analytical characterization approach. Tribol. Int. 2016, 94, 249–259. [Google Scholar] [CrossRef]
  29. Wahlström, J.; Lyu, Y.; Matějka, V.; Söderberg, A. A pin-on-disc tribometer study of disc brake contact pairs with respect to wear and airborne particle emissions. Wear 2017, 384–385, 124–130. [Google Scholar]
  30. Alemani, M.; Wahlström, J.; Olofsson, U. On the influence of car brake system parameters on particulate matter emissions. Wear 2018, 396–397, 67–74. [Google Scholar] [CrossRef]
  31. Federici, M.; Gialanella, S.; Leonardi, M.; Perricone, G.; Straffelini, G. A preliminary investigation on the use of the pin-on-disc test to simulate offbrake friction and wear characteristics of friction materials. Wear 2018, 410–411, 202–209. [Google Scholar] [CrossRef]
  32. Lyu, Y.; Bergseth, E.; Wahlström, J.; Olofsson, U. A pin-on-disc study on the tribology of cast iron, sinter and composite railway brake blocks at low temperatures. Wear 2019, 424–425, 48–52. [Google Scholar] [CrossRef]
  33. Kukutschová, J.; Filip, P. Review of Brake Wear Emissions a Review of Brake Emission Measurement Studies: Identification of Gaps and Future Needs. Non-Exhaust Emissions. In Non-Exhaust Emissions—An Urban Air Quality Problem for Public Health—Impact and Mitigation Measures; Elsevier: Amsterdam, The Netherlands, 2018; Chapter 5; pp. 102–121. [Google Scholar]
  34. Münchhoff, J. PMP group meeting on non-exhaust emissions—Initial input of Audi to brake particle emissions. In Proceedings of the 35th PMP IWG Meeting, Brussels, Belgium, 4–5 March 2015; Available online: https://wiki.unece.org/display/trans/PMP+35th+Session (accessed on 16 September 2019).
  35. Grigoratos, T.; Martini, G. Brake Wear Particle Emissions—Current Status within the PMP IWG. In Proceedings of the EuroBrake2016 Conference, Milan, Italy, 13–15 June 2016. [Google Scholar]
  36. Mosleh, M.; Blau, P.J.; Dumitrescu, D. Characteristics and morphology of wear particles from laboratory testing of disc brake materials. Wear 2004, 256, 1128–1134. [Google Scholar] [CrossRef]
  37. Wahlström, J.; Söderberg, A.; Olander, L.; Jansson, A.; Olofsson, U. A pin-on-disc simulation of airborne wear particles from disc brakes. Wear 2010, 268, 763–769. [Google Scholar] [CrossRef]
  38. Sanders, P.G.; Xu, N.; Dalka, T.M.; Maricq, M. Airborne brake wear debris: Size distributions, composition, and a comparison of dynamometer and vehicle tests. Environ. Sci. Technol. 2003, 37, 4060–4069. [Google Scholar] [CrossRef]
  39. Iijima, A.; Sato, K.; Yano, K.; Kato, M.; Tago, H.; Kato, M.; Kimura, H.; Furuta, N. Particle size and composition distribution analysis of automotive brake abrasion dusts for the evaluation of antimony sources of airborne particulate matter. Atmos. Environ. 2007, 41, 4908–4919. [Google Scholar] [CrossRef]
  40. Osterle, W.; Bresch, H.; Dorfe, I.; Fink, C.; Giese, A.; Prietzel, C.; Seeger, S.; Walter, J. Examination of airborne brake dust. In Proceedings of the 6th European Conference on Braking JEF 2010, Lille, France, 24–25 November 2010. [Google Scholar]
  41. Kukutschová, J.; Moravec, P.; Tomašek, V.; Matějka, V.; Smolik, J.; Schwarz, J.; Seidlerova, J.; Šafařova, K.; Filip, P. On airborne nano/micro-sized wear particles released from low-metallic automotive brakes. Environ. Pollut. 2011, 159, 998–1006. [Google Scholar] [CrossRef]
  42. Vlcek, J.; Drongova, L.; Topinkova, M.; Matějka, V.; Kukutschova, J.; Vavro, M.; Tomková, V. Identification of phase composition of binders from alkali-activated mixtures of granulated blast furnace slag and fly ash. Ceramics—Silikáty 2014, 58, 79–88. [Google Scholar]
  43. Mathissen, M.; Evans, C. “Lowbrasys Brake Wear Cycle—3h LACT”. Mendeley Data, v1, 2019. Available online: http://dx.doi.org/10.17632/4cgs6myx9d.1 (accessed on 16 September 2019).
  44. Rubino, L.; Philips Paul, R.; Twigg Martyn, V. Measurements of Ultrafine Particle Number Emissions from a Light-Duty Diesel Engine Using SMPS, DMS, ELPI and EEPS; SAE Technical Paper; SAE: Warrendale, PA, USA, 2005; ISSN 0148-7191. [Google Scholar] [CrossRef]
  45. Kaminski, H.; Kuhlbusch, T.A.J.; Rath, S.; Götz, U.; Sprenger, M.; Wels, D.; Polloczek, J.; Bachmann, V.; Dziurowitz, N.; Kiesling, H.-J.; et al. Comparability of mobility particle sizers and diffusion chargers. J. Aerosol. Sci. 2013, 57, 156–178. [Google Scholar] [CrossRef]
  46. Zimmerman, N.; Jeong, C.-H.; Wang, J.M.; James, M.R.; Wallace, J.S.; Evans, G.J. A source-independent empirical correction procedure for the fast mobility and engine exhaust particle sizers. Atmos. Environ. 2015, 100, 178–184. [Google Scholar] [CrossRef]
  47. Perricone, G.; Matĕjka, V.; Alemani, M.; Wahlström, J.; Olofsson, U. A Test Stand Study on the Volatile Emissions of a Passenger Car Brake Assembly. Atmosphere 2019, 10, 263. [Google Scholar] [CrossRef]
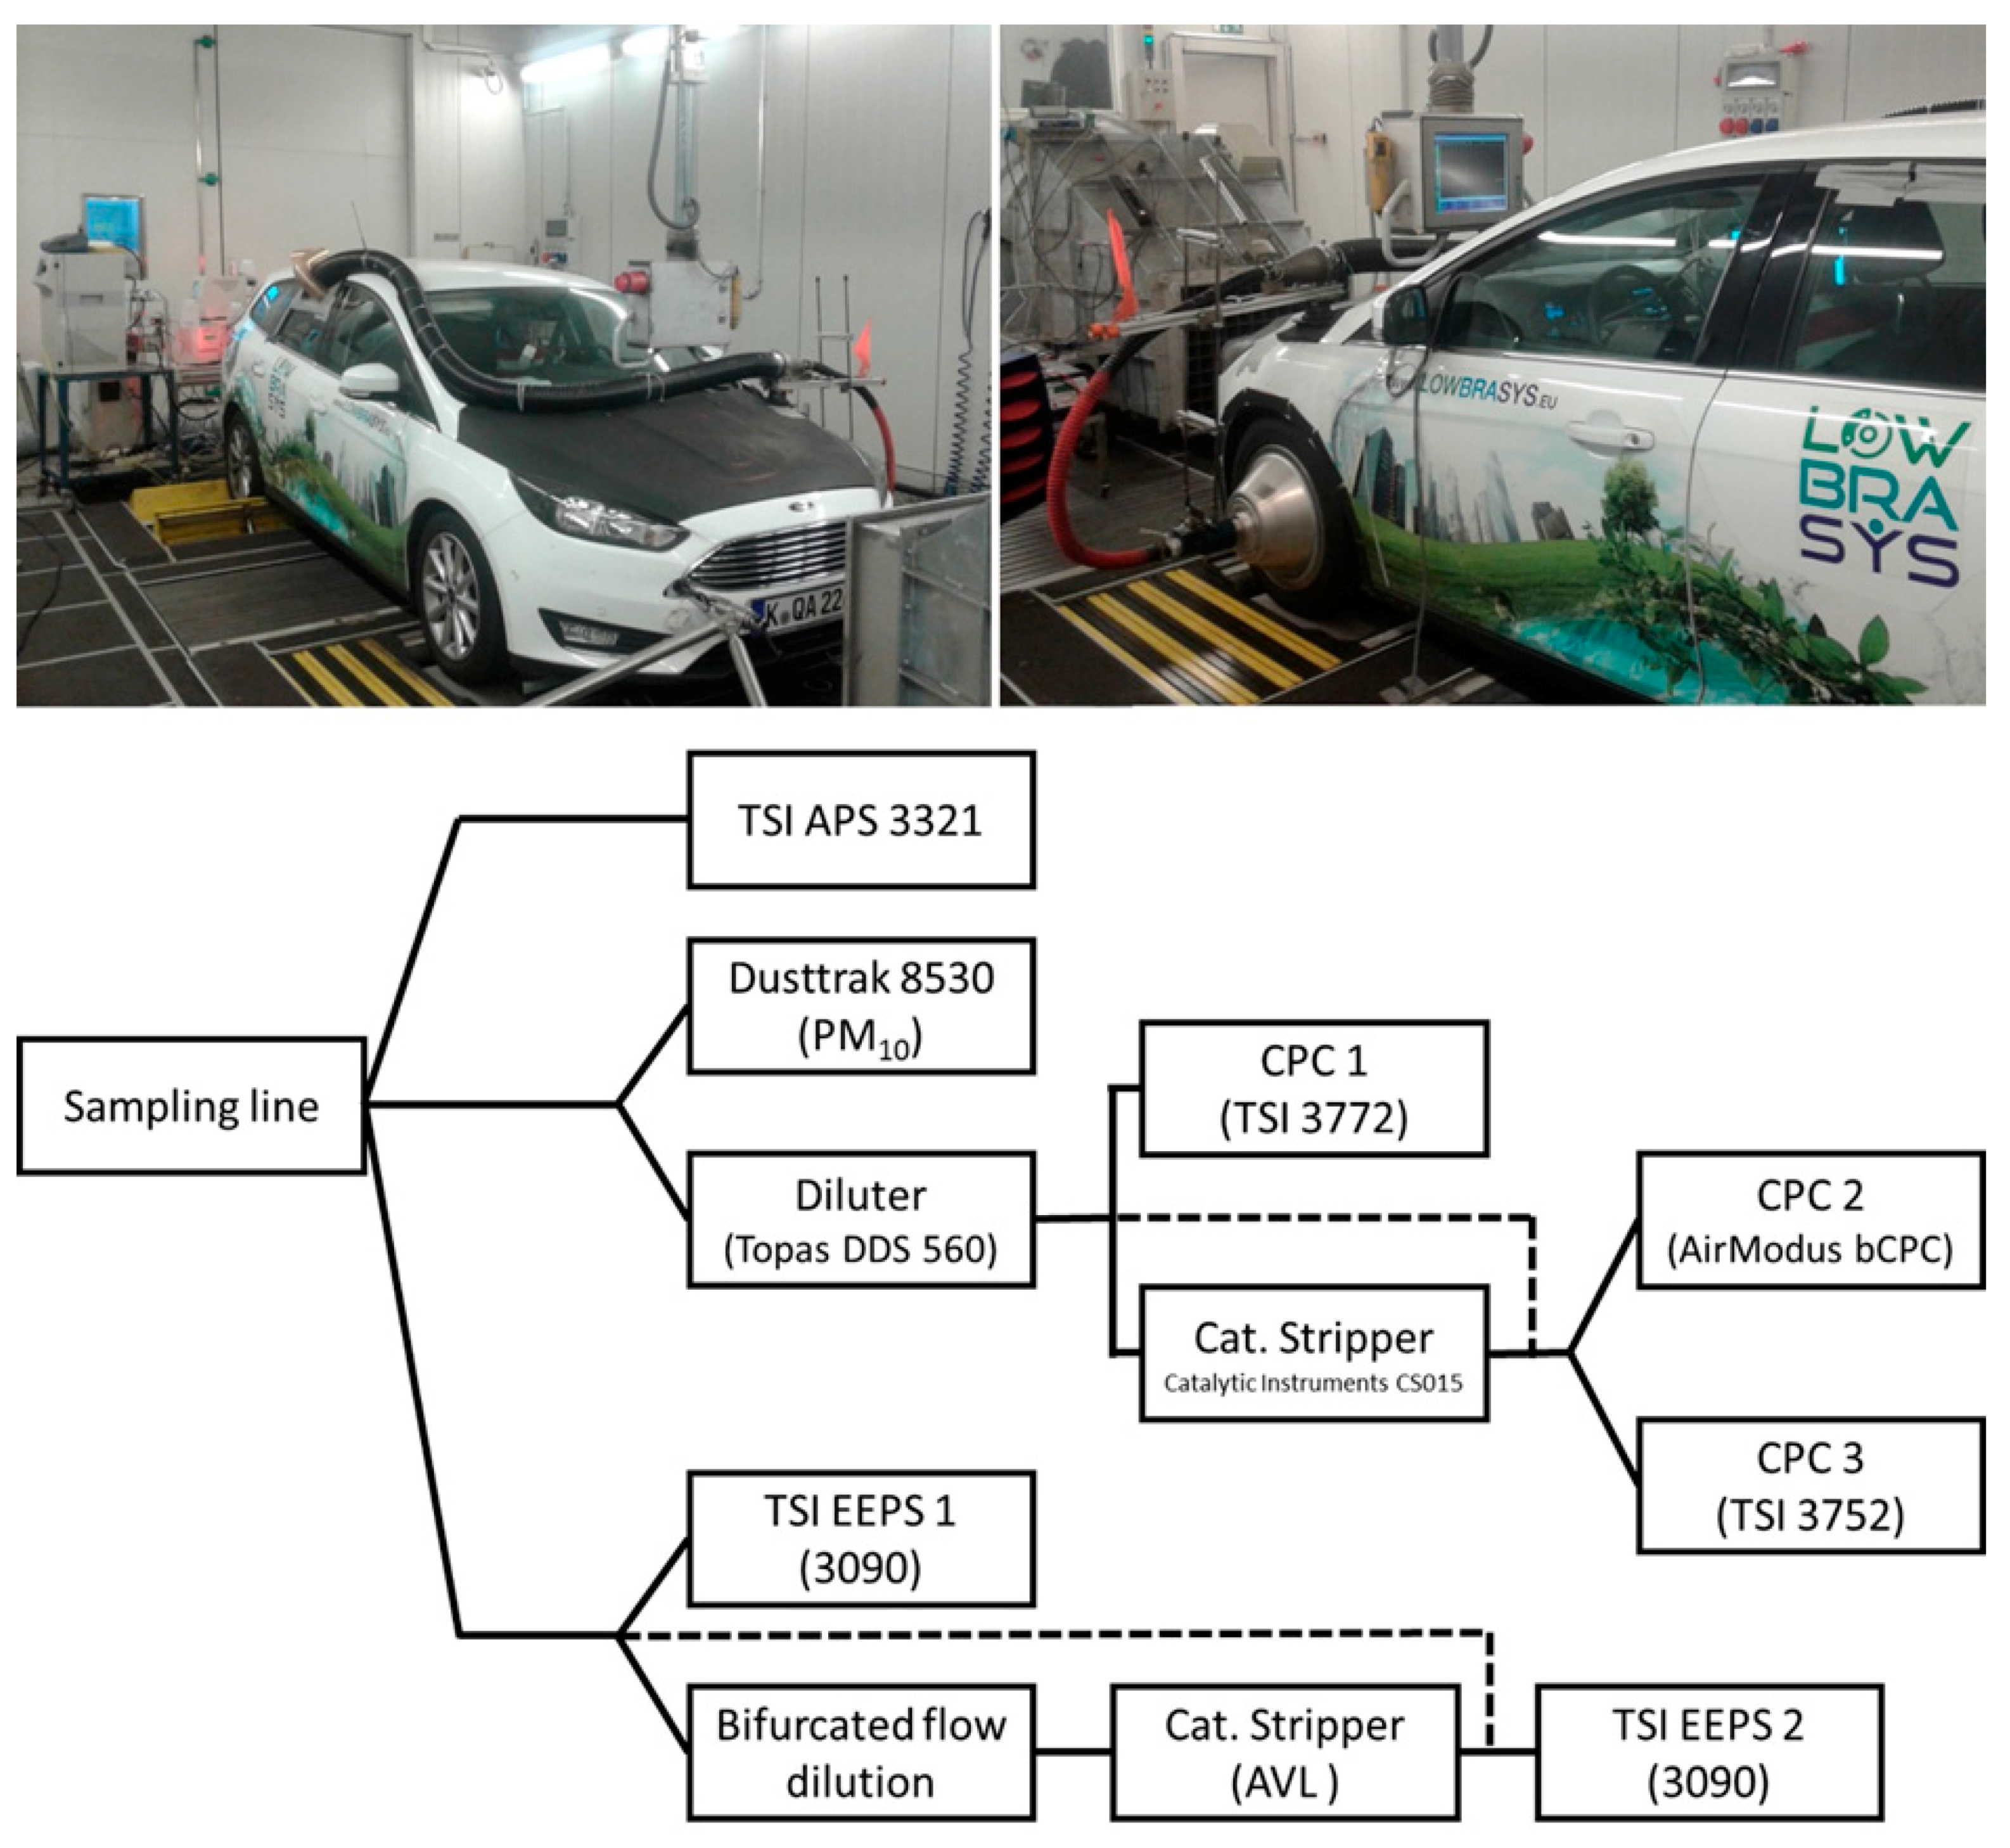
Figure 1. Top-view of the instrumented vehicle on the chassis dynamometer. Brake particles are generated at the front left enclosed wheel (right). Bottom–A schematic overview of all measurement devices. Dashed lines indicate variations of the setup that were used within the measurement campaign.
Atmosphere 10 00556 g001
Figure 2. 3h- Los Angeles City Traffic (LACT) and LACT-20 (Highlighted) speed/time trace (top) and vehicle brake disc temperature as measured by a sliding thermocouple on a test-track and at the chassis dynamometer (Bottom).
Atmosphere 10 00556 g002
Figure 3. Brake disc temperatures recorded by sliding thermocouples at the front right wheel (enclosed) and at the front left wheel (reference/unmodified) during 3h-LACT cycle on the test track and on the chassis dynamometer.
Atmosphere 10 00556 g003
Figure 4. Overview of the PN emissions during chassis dyno LACT-20 repeatability measurement. Top—Velocity trace and brake disc temperatures. Left—Time trace. Solid lines refer to measurements with CS and dashed w/o CS. Right—Stop averaged total PN concentration for each run plotted against mean brake disc temperature per stop with and without CS.
Atmosphere 10 00556 g004
Figure 5. PN EFs estimated for eight runs of the LACT-20 on the chassis dynamometer based on the EEPS (w/o CS) and CPC210nm (CS). The EEPS EFs during runs one to four is the lower EF limit since the particle concentration exceeded the measurement limit. As reference, EF from EEPS and CPC2 are shown during first 450 s where the temperatures are <155 °C.
Atmosphere 10 00556 g005
Figure 6. Time trace of second 3h-LACT run. From top to bottom: Vehicle speed and brake disc temperature measured at enclosed wheel. PM concentration as measured by DustTrak. Particle size distribution as measured by APS. Total PN concentration as measured by both EEPS. Total PN concentration as measured by CPCs.
Atmosphere 10 00556 g006
Figure 7. Timeline of pyramid-cycle without any brake application. Left side (a) refers to chassis dyno measurements. Right side (b) refers to brake dyno testing. Top to bottom: Velocity profile (black, left axis); PM10 concentration (TSI DustTrak); PN size distribution (dN/d log dP) (TSI APS); and PN concentration (CPCs with (CPC34nm, CPC210nm) and without (CPC110nm) CS. In all cases dotted lined indicate speed trace as reference.
Atmosphere 10 00556 g007
Table 1. Overview of different setups employed by different researchers for studying brake particle emissions.
ReferenceMethodType of System
[36]Pin-on-discOpen system
[37]Closed system
[28]Closed system
[29]Closed system
[30]Closed system
[31]Closed system
[32]Closed system
[38]Brake DynoOpen system
[39]Open system
[40]Open system
[8]Closed system
[9]Closed system
[41]Closed system
[22]Closed system
[26]Closed system
[11]Closed system
[24]Closed system
[23]Closed system
[27]Closed system
[21]Chassis dynoOpen system
[19]On-RoadOpen system
[20]Open system