Article

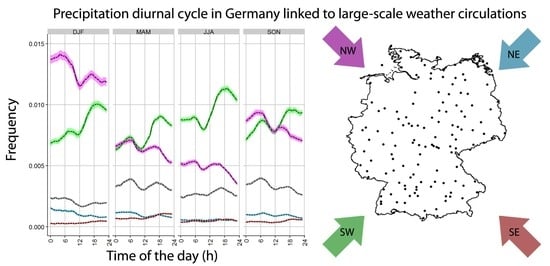
Precipitation Diurnal Cycle in Germany Linked to Large-Scale Weather Circulations

1
Department of Ecology and Ecosystem Management, Technical University of Munich, Hans-Carl-von-Carlowitz-Platz 2, D-85354 Freising, Germany
2
Zentralanstalt für Meteorologie und Geodynamik, Fürstenweg 180, A-6020 Innsbruck, Austria
3
Institute for Advanced Study, Technical University of Munich, Lichtenbergstraße 2a, D-85748 Garching, Germany
*
Author to whom correspondence should be addressed.
Atmosphere 2019, 10(9), 545; https://doi.org/10.3390/atmos10090545
Submission received: 13 August 2019 / Revised: 9 September 2019 / Accepted: 11 September 2019 / Published: 13 September 2019
(This article belongs to the Section Meteorology)

Abstract

:
The precipitation diurnal cycle (PDC) varies with the season and location. Its link to large-scale weather circulations has been studied in different regions. However, comparable information is lacking for Central Europe. Two decades of hourly precipitation data were combined with records of objective weather patterns over Germany, focusing on the general atmospheric wind directions (WD). The PDC is characterized by the frequency and the average amount of hourly precipitation. The precipitation frequency generally has two peaks: one in the morning and the other in the afternoon. The morning peak of the precipitation amount is small compared to that of the afternoon peak. Remarkably, WD has a prominent influence on the PDC. Days with southwesterly WD have a high afternoon peak and a lower morning peak, while days with northwesterly WD have a high morning peak and a lower afternoon peak. Furthermore, the seasonal variations of PDC are dominated by the seasonal frequency of WD classes. This study presents a general overview of the PDC in Germany with regard to its variation with seasonality, geographical location, elevation, and WD.

Graphical Abstract

1. Introduction

Globally, the diurnal amplitude variation of the precipitation frequency exceeds 20% of the mean daily values [1]. The precipitation diurnal cycle (PDC) emerges from fluctuations in global radiation. This is evident, especially in the tropics, where solar forcing is at its maximum. The PDC in mid- and high latitudes is influenced by frontal systems and topography, among other factors [1,2,3]. The PDC and its temporal and spatial variations have been addressed on global and local scales using the vast amount of precipitation records available at high resolution. Studying and understanding the PDC are important because of its applications in atmospheric science and hydrology. It interacts with the changes in surface temperatures, cloud formation processes, and boundary layer development [4,5,6], and affects the trace gas concentrations [7]. PDC influences the risk of floods and must be taken into consideration in hydrological models and designs [8,9]. Furthermore, it aids in the development of numerical weather models, which struggle to improve their representation of the PDC [10,11,12]. Such a challenge has been studied recently [13,14,15,16], particularly because the accuracy of a climate model on a daily scale reflects its quality in properly representing the physical processes or in parameterizing them.
The PDC is reported in many local and regional studies; however, different reasons for the spatial and temporal patterns in PDC have been suggested. In the United States, winter mornings, summer afternoons, and summer evenings are the time periods with a higher precipitation frequency [2]. However, the peak of the summer precipitation in the central US occurs in the early morning because of persistent eastward-moving mesoscale convective systems, which start in the Rocky Mountains [15]. Both the intensity and the frequency of the PDC in the Chinese alpine region are evidently influenced by elevation [17]. The PDC in China also varies with urbanization [18]. Topographic precipitation enhancement processes cause different PDC patterns for warm and cold fronts in Scotland [19]. During the warm season in southern Poland, cold fronts drive the precipitation frequency peak in the afternoon, but in warm fronts, the peak appears in the evening or night [3]. In the southeast of France, precipitation is most frequent in the late afternoon, mostly in summer and spring [20]. The rain rates in the Alps follow a diurnal cycle [21], which is strong during summer on the northern slopes of the Alps, with the maximum precipitation between 16:00 and 17:00 UTC. Equally, extreme precipitation occurs mostly in the late afternoons and evenings because of thunderstorm activity [22]. In Austria, the snow cover in the central Alps shifts the start of the precipitation frequency peak toward the evening [23]. In the Southern Alps near the Mediterranean, the precipitation peaks show up in the afternoon during summer and close to the sea in the early morning during fall and winter [24]. The probability maximum of heavy and extreme precipitation may delay from late afternoon to overnight and the morning period under the influence of climate change for the case of western Germany [25].
Circulation weather patterns or types (hereafter: CTs) can be used as a tool to better understand the processes that link large-scale atmospheric conditions with near-surface climate phenomena [26]. CTs determine the humidity and thermal property of air masses. Consequently, CTs have different rain microstructures, especially in stratiform rain when air masses originate from different locations [27]. CTs resolve the occurrence of low-to-moderate precipitation events better than less-frequent heavy precipitation [28], but they also influence the probability of extreme precipitation [29] and the maximum precipitation amount [30]. Furthermore, the frequency of some CTs is reported to increase, which is linked to the changes in flood occurrence and flood types [31,32].
Many CT classifications (i.e., both subjective and objective) are available for Central Europe. Automatically classified CTs outperform the manual classification in terms of their capability to predict surface climate variations [28]. Investigating the trends of their occurrence has been motivated by the association between CTs and near-surface climate phenomena as well as accelerating climate change. The zonal flows over Europe have increased in winter between the 1960s and the 1990s [33]. The trend is expected to continue, while the meridional flows are expected to decrease [34]. Despite the uncertainties associated with models projections [35], the westerly circulations in winter are specifically projected to strengthen [36,37]. Consequently, understanding the precipitation properties within particular CTs, which are expected to occur more frequently, requires more attention.
A few studies have discussed the link between CTs and the PDC in Central Europe. In the Alps, flat pressure CTs exhibit a strong PDC because of high convective activity, but frontal CTs also show a significant PDC [21]. The combined effect of topography and specific CTs also plays an important role in the precipitation occurrence [38]. The combination of the high humidity of westerly CTs and the orographic lift accelerates rainfall formation processes. However, the Southern and Eastern regions of Germany are shadowed by the Northern and Western Alps in the case of south western CTs. This is similar to the reported effect in the south of Poland, where the Carpathians act as a barrier and affect the PDC during the southern and southwestern CTs [3]. As a result, the precipitation frequency peaks in the late night and early morning. The CTs also influence the diurnal cycle of thunderstorm precipitation. For example, cold fronts in the south of Poland produce thunderstorms with an afternoon peak, while warm fronts produce lower peaks at different times of the day [39].
A comprehensive study of the PDC over Germany and how it is influenced by CTs does not exist so far, which raises the following questions:
  • How do PDC patterns vary with CTs over Germany?
  • How does seasonality and location within Germany influence such a variation?
Thus, we aim for an overview of the PDC across Germany linked to CTs and its dependence on seasonality and location. We also compare our findings with published work on the PDC, especially at nearby locations in Central Europe.

2. Materials and Methods

2.1. Data Sources and Analysis Tools

The data set used in this research consists of daily records of objective weather types and hourly precipitation measurements at 136 stations in Germany.
The classification of the large-scale weather types over Germany is performed on a daily basis by the German Meteorological Service (Deutscher Wetterdienst, DWD). The classification method uses results of the operational numerical weather analysis and forecast system of the DWD. One class out of 40 possible of objective weather classes over Central Europe is assigned to each day. Each class comprises three indices: wind index, cyclonality index, and humidity index. The direction of the air mass advection within each CT has more influence on the PDC than the pressure system type itself [3]; thus, we investigated only the influence of the wind index based on the horizontal wind components at 700 hPa. The daily wind index was assigned to one of the five wind direction classes (hereafter, WD), which are no prevailing direction (XX), northeasterly (NE), southeasterly (SE), southwesterly (SW), and northwesterly (NW). The classification process is explained in detail by DWD [40]. Full records of the objective weather types are available online [41].
The hourly precipitation measurements are provided via the DWD climate data center [42]. A full list of the available German weather stations is provided in the online document [43]. We limited this study to stations with 15 years or more of precipitation records between December 1995 and November 2017. Four types of precipitation measurement devices were used in the selected data set: pluviometers (52% of the total measurement period), NG200 (20%), Hellmann (18%), and Joss-Tognini [44,45] (9%). The hourly sums of precipitation below 0.2 mm might consist of dew aside from other sources of error, and these values were filtered out. The data set contained a total of 2,011,797 h of precipitation at 136 stations.
The stations were grouped by latitude, longitude, and elevation. Each parameter had three classes with ~equal number of stations. Figure 1 shows the location of the 136 selected stations and their three elevation classes. Table 1 presents their number per class. Supplementary file provides their station names, IDs, and geographical coordinates.
We used R [46], RStudio [47], and packages reader [48], stringi [49], ggplot2 [50], lubridate [51], maptools [52], raster [53], reshape2 [54], and dplyr [55] for data filtering, analysis, and production of visual and statistical results.

2.2. Precipitation Diurnal Cycle (PDC) Indicators

The precipitation measurements covered different time spans at different stations (ranging from 15 to 23 years). We calculated the long-term average of the hourly precipitation amount ( P ¯ a ) and that of the hourly precipitation occurrence frequency ( P ¯ f ) to prepare the comparable indicators for the PDC [56]. For each station, P ¯ a and P ¯ f are defined as:
P ¯ a ( h ) = d = 1 N P ( h , d ) N ,
P ¯ f ( h ) = d = 1 N O ( h , d ) N ,
where P(h,d) is the precipitation amount at hour (h) and day (d). O(h,d) is the precipitation occurrence at h and d. It takes the value of 1 if a precipitation equal to or greater than 0.2 mm is recorded; otherwise, it takes the value of 0. N is the number of days over which the measurements are taken at the corresponding station, including the non-precipitation days.

3. Results

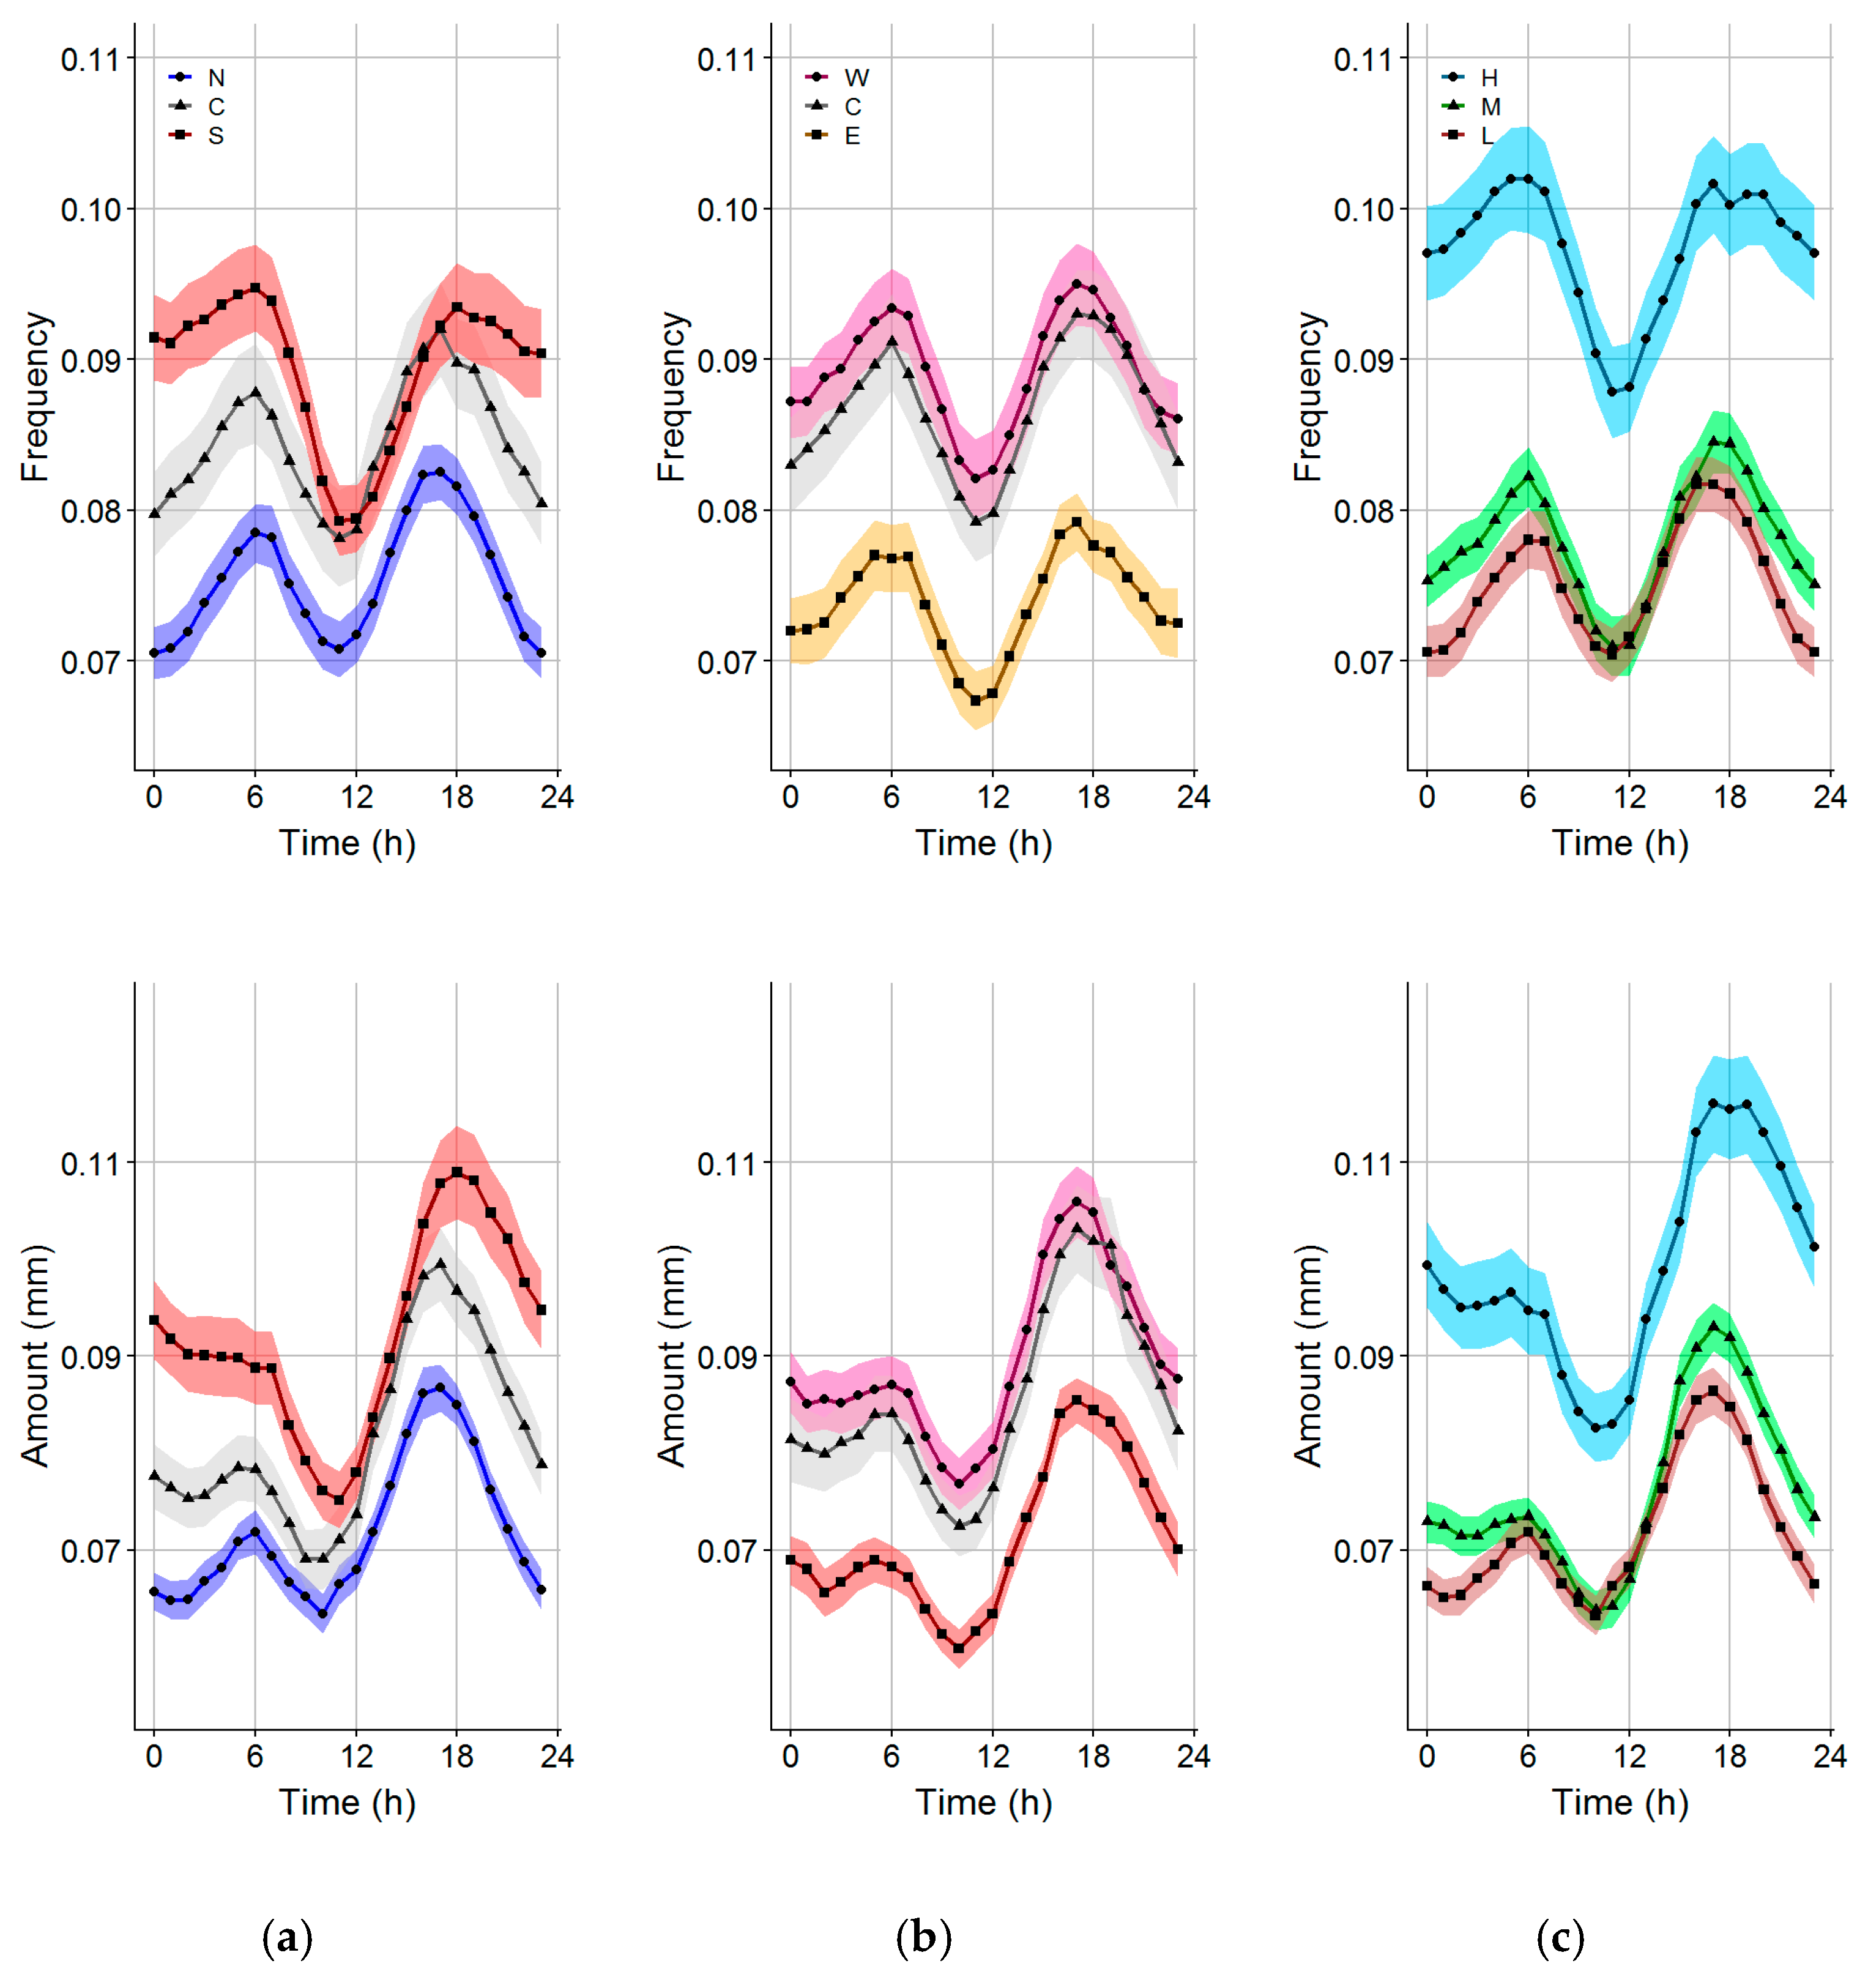
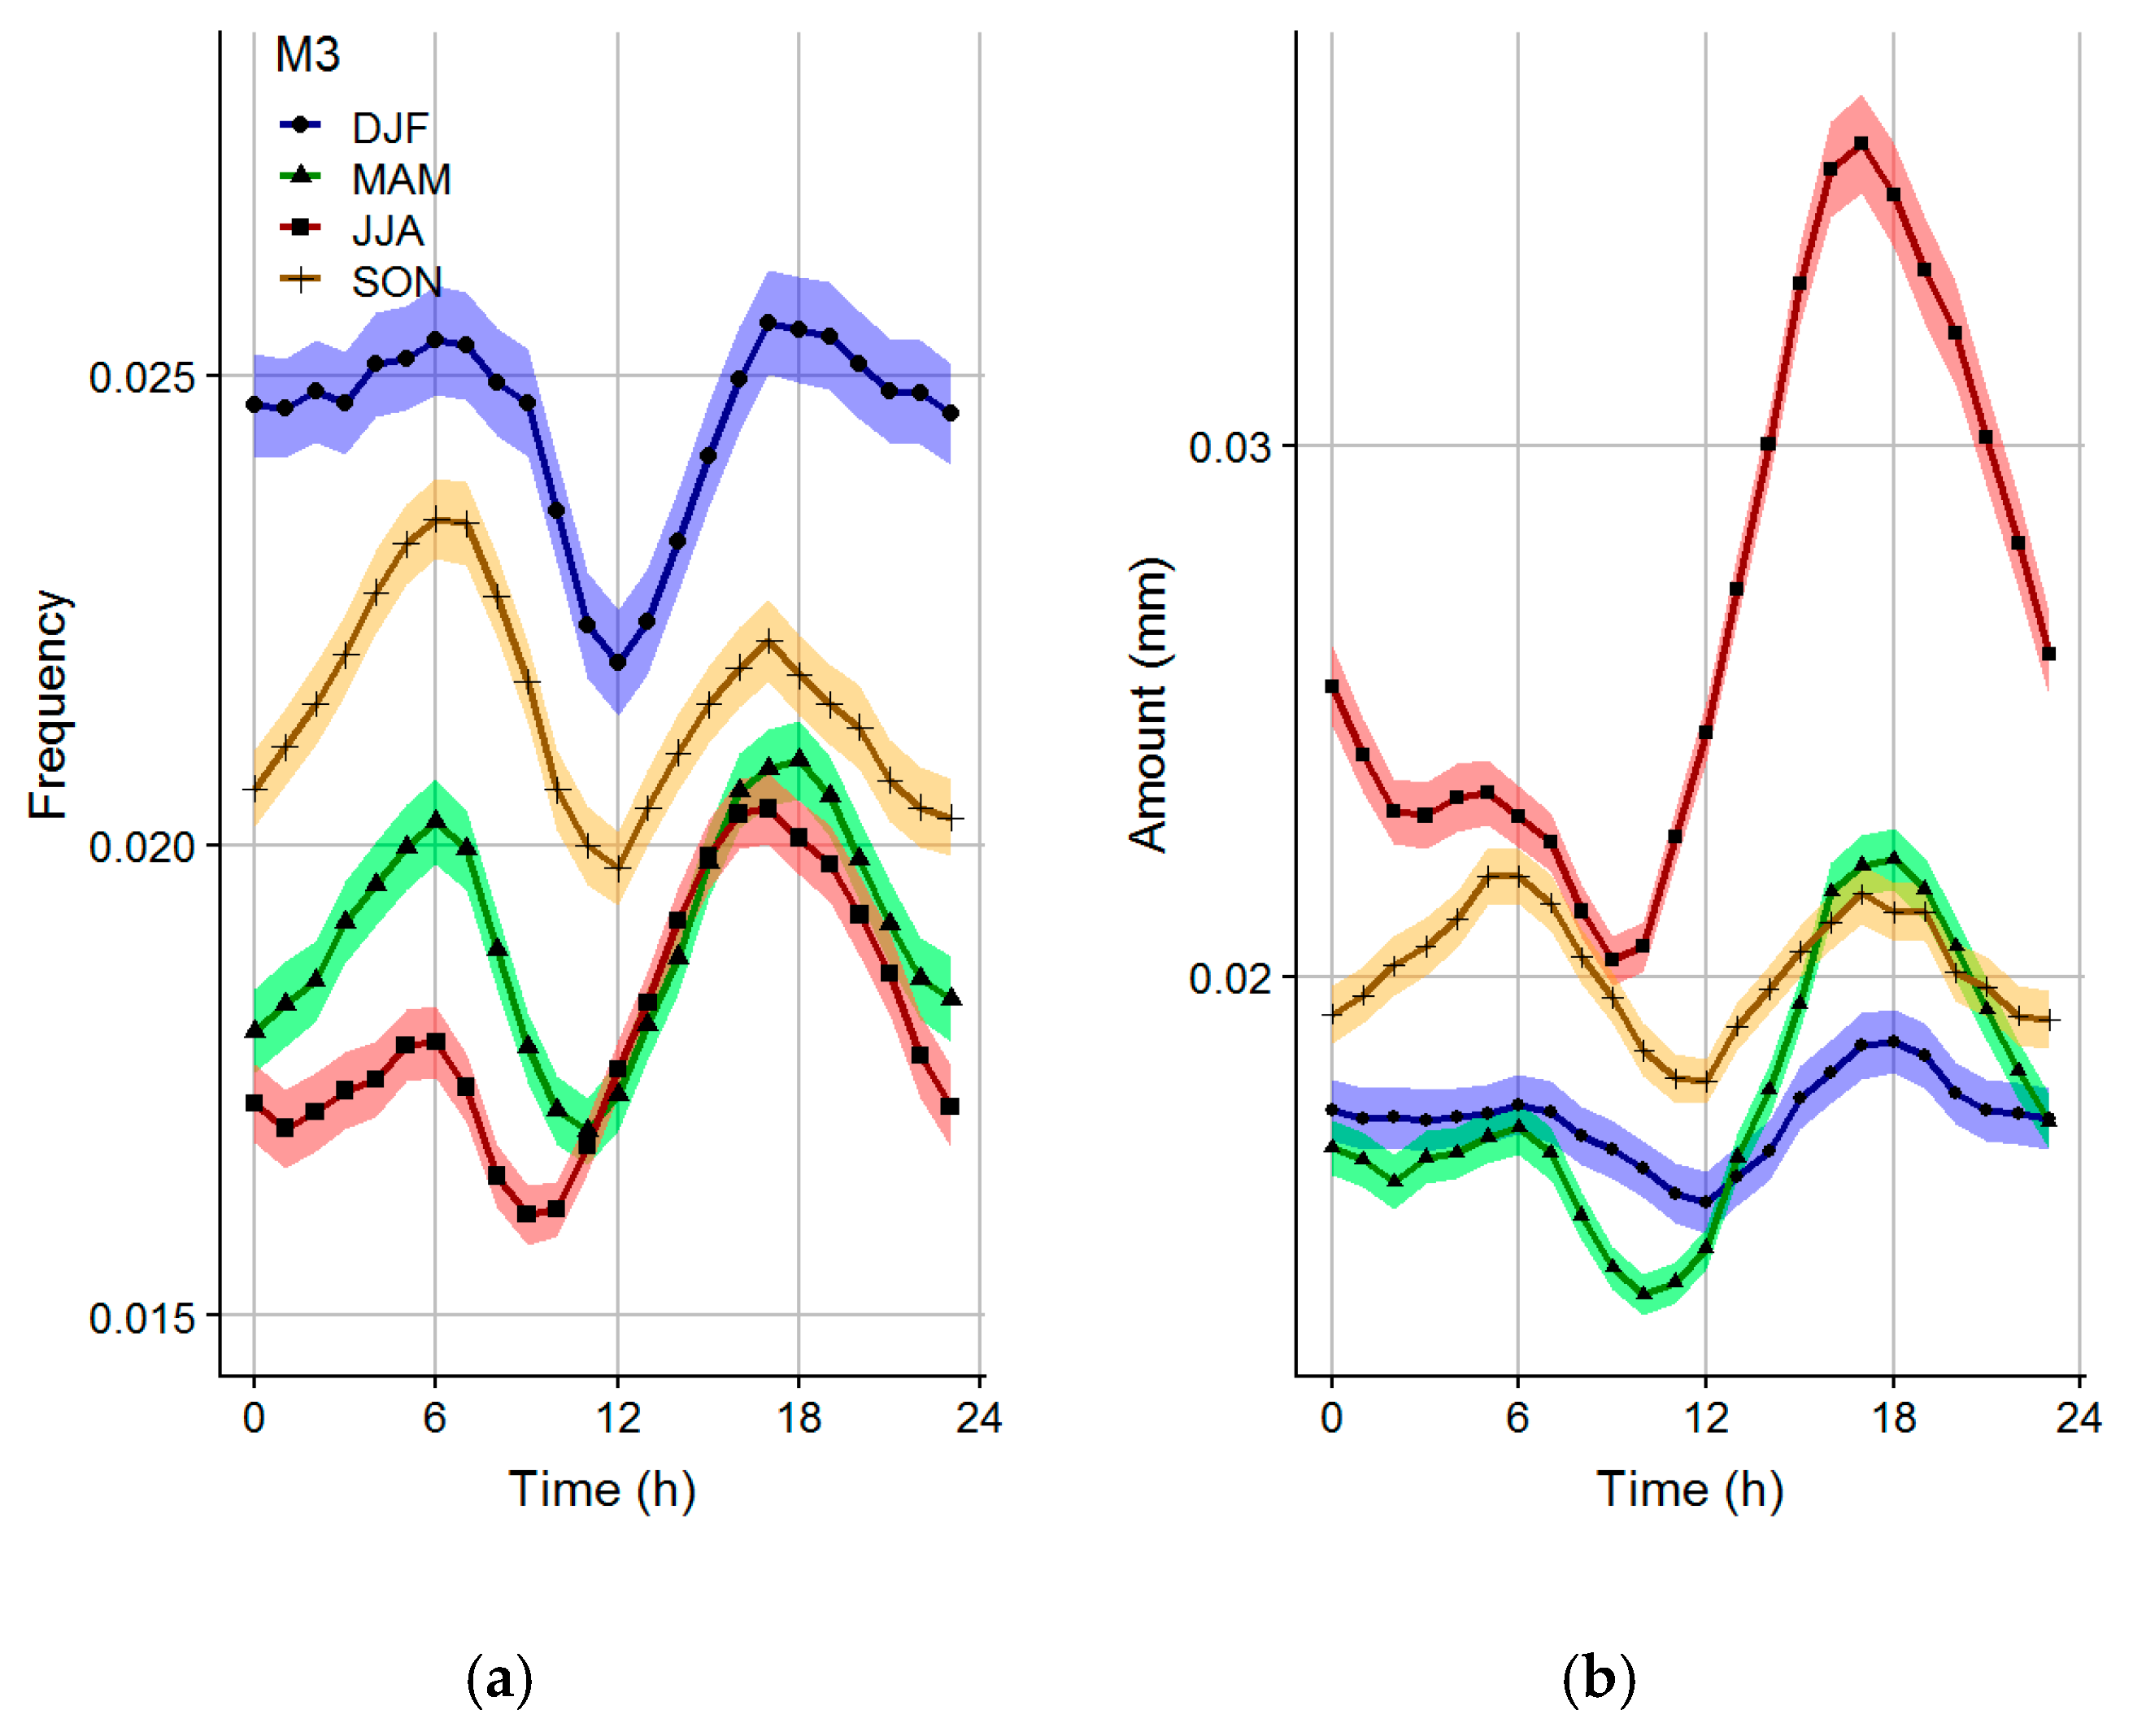
3.1. PDC Variation with Season and Location

The PDC in Germany was characterized by two peaks in P ¯ f with a similar magnitude, one near dawn (hereafter morning peak) and the other in the late afternoon (afternoon peak) (Figure 2, upper panel). This frequency pattern was observed in all elevation classes and at all locations. However, at high elevations, the precipitation frequency after the afternoon peak decreased more slowly than those at medium and low elevations. At the southern stations, the decrease in the frequency after the afternoon peak was equally weaker. The majority of the southern stations is elevated (Figure 1); hence, separating these two effects is challenging.
The PDC was equally characterized by two peaks in P ¯ a ; however, in most of the locations, the afternoon peak was more pronounced than the morning peak (Figure 2, lower panel). The morning peak almost disappeared for the high elevations and southern stations.
The ranking of elevations and locations by hourly precipitation amounts corresponded to the ranking by frequency. More precipitation accumulated at high elevations and less in the northern and eastern stations.
The precipitation frequency was the highest in winter, followed by fall, spring, and summer (Figure 3a). All seasons shared a comparable PDC ( P ¯ f ) with a morning peak and an afternoon peak. Both peaks had similar magnitudes in spring and winter, whereas the morning peak was higher than the afternoon peak in fall, and vice versa in summer.
Summer had the highest precipitation amount, while winter and spring had the lowest (Figure 3b). Each season had a different PDC ( P ¯ a ) : the afternoon peak was the strongest in summer, and had much lower magnitudes in spring, fall, and winter. The morning peak was clear in fall and spring, but weak in winter and summer.

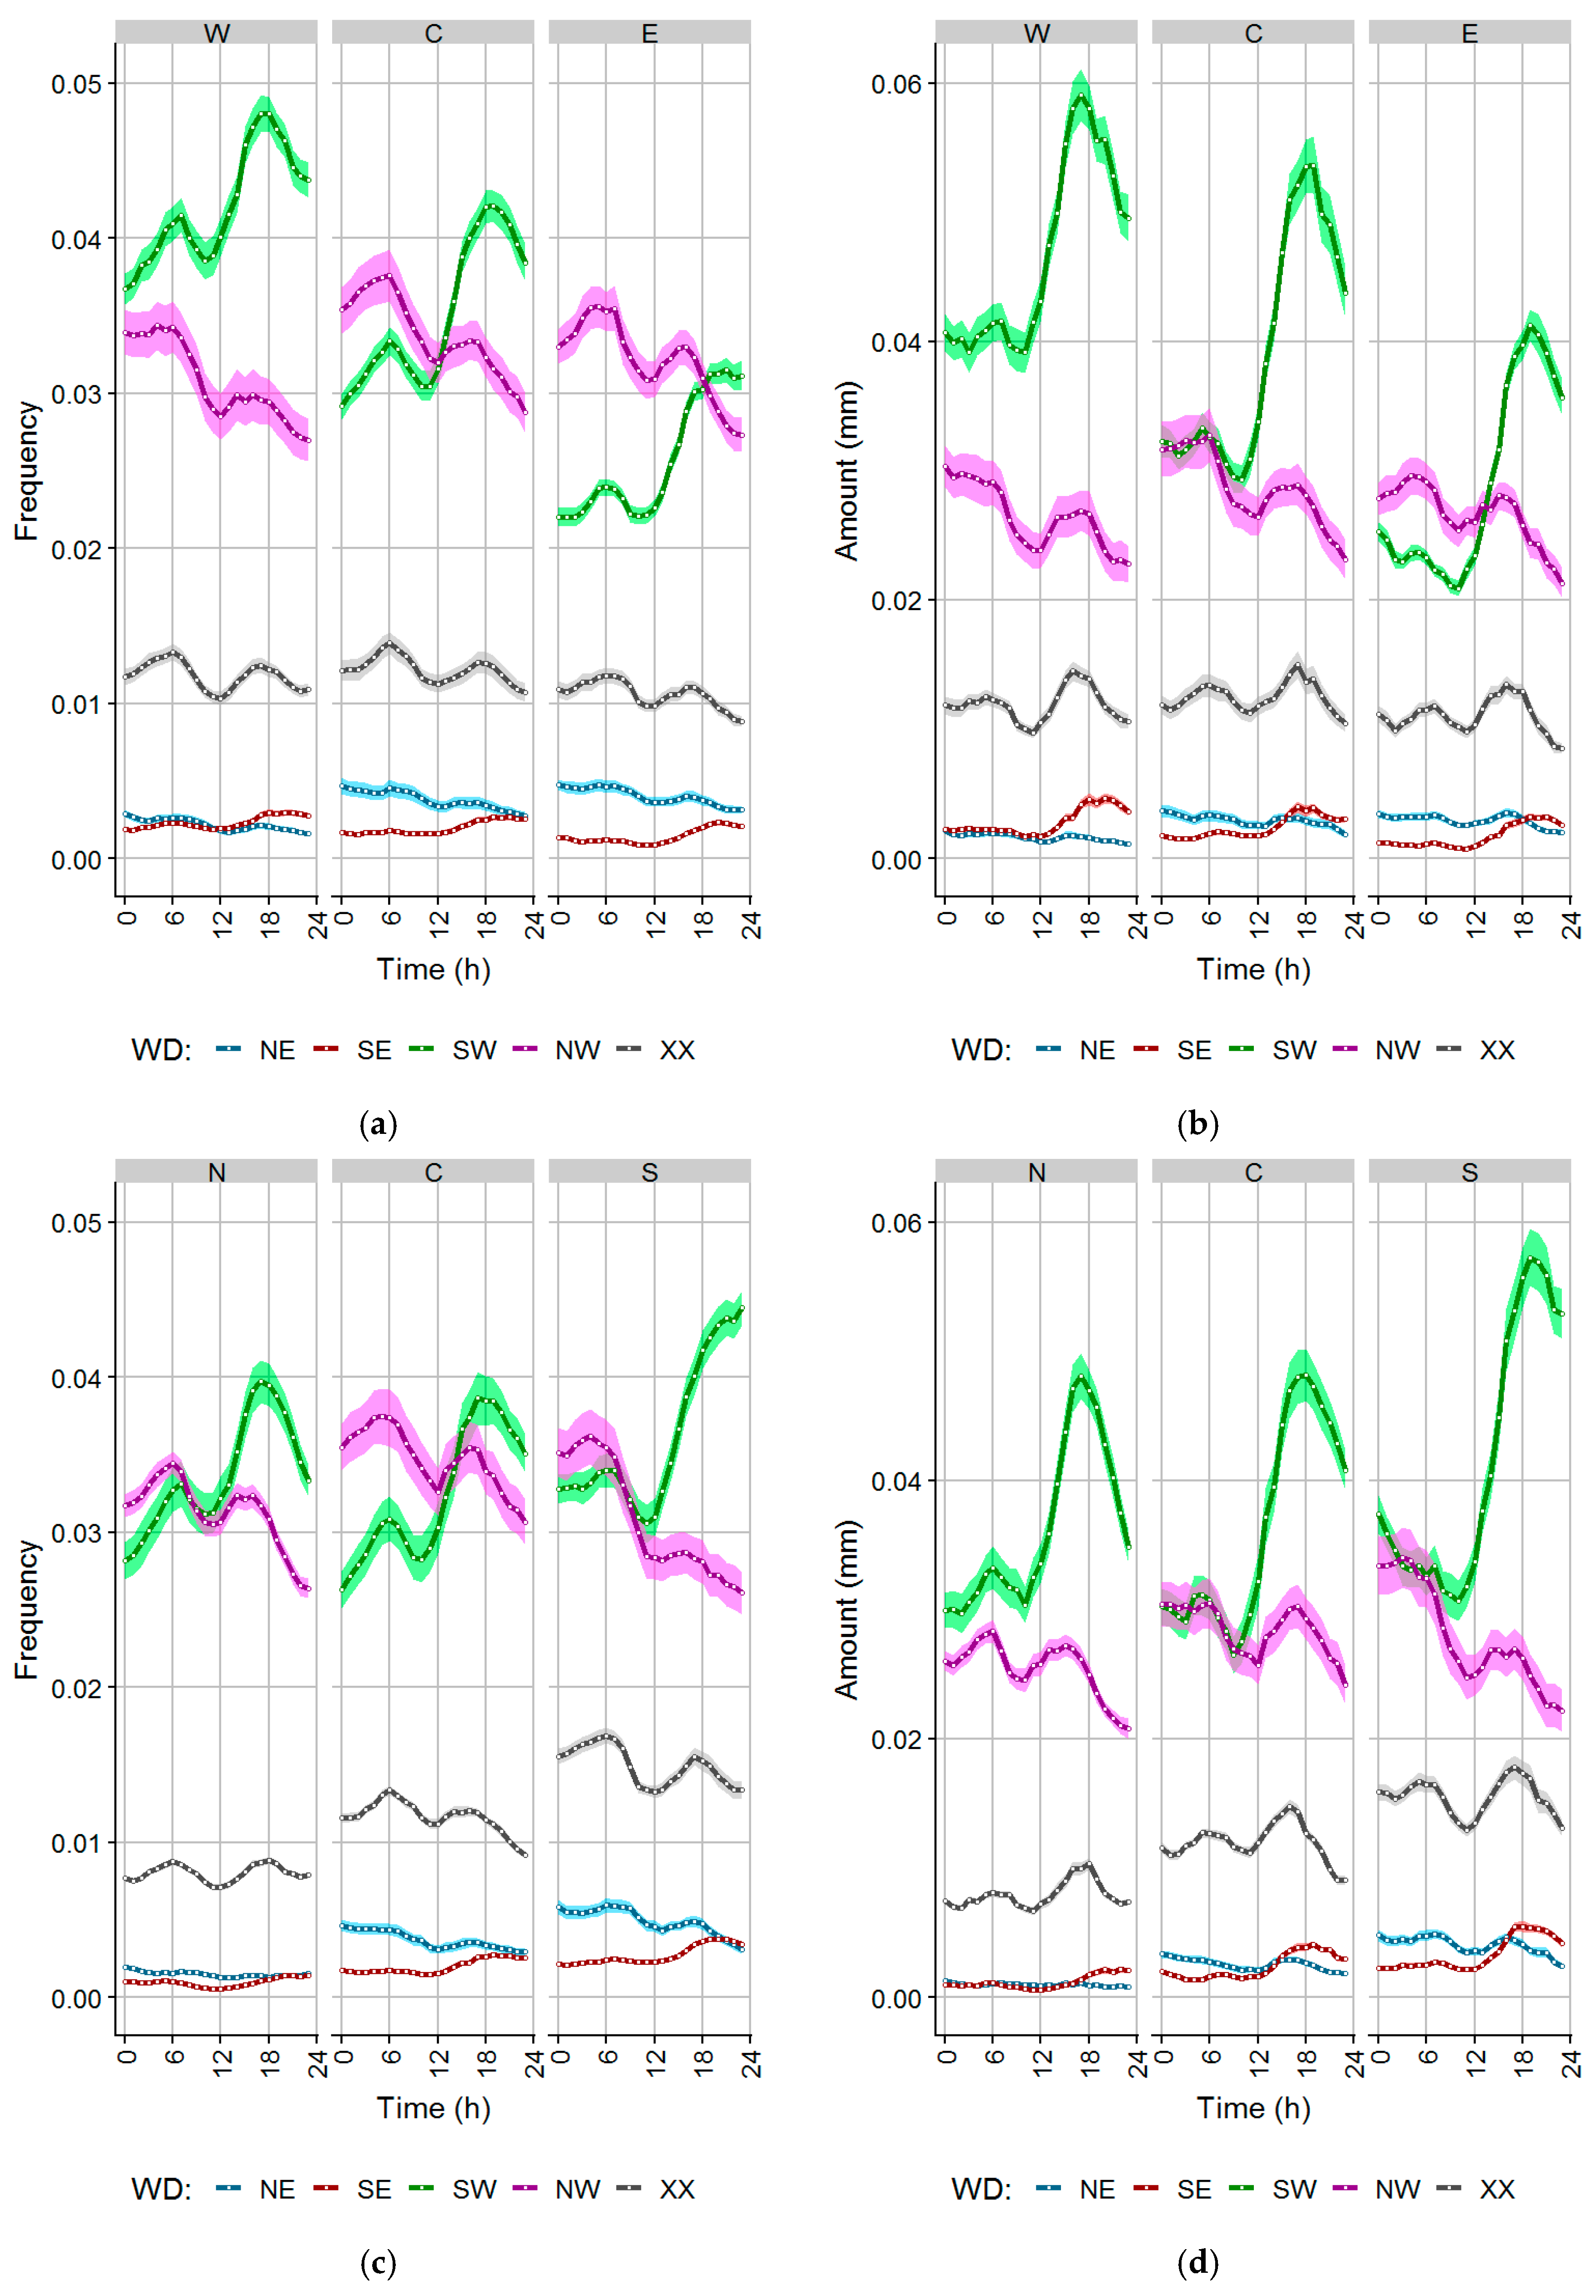
3.2. Precipitation Linked to Wind Direction (WD)

Before addressing the PDC pattern in different WD classes, we must first consider the occurrence of each WD class and the occurrence of precipitation within these classes.
The most common WD class was the SW, followed by the NW (Figure 4). Both comprised a total of 67.1% of the 8036 days between December 1995 and November 2017. The SW prevailed in all seasons, except in winter when the NW occurred more often. The NE and SE covered less than 14% of the total number of days. XX represented less than 20% of the days, with a slightly higher frequency in spring.
The percentage of wet days (days with precipitation equal to or exceeding 0.2 mm) differed among the WD classes and seasons (Figure 5). Half the days in the WD classes NW and SW were wet days (47.6 and 48.0%, respectively). The NW WD class in winter and autumn and the SW WD class in spring and especially in summer had the highest percentages of wet days. The annual mean percentages of the other WD were less than 26% (25.9%, 20.9%, and 17.0% for the XX, NE, and SE, respectively). Interestingly, the WD class SE had the lowest percentage in winter and a much higher percentage in summer.
The comparison of wet hours per wet day revealed that the differences between the WD classes were negligible (Figure 6). XX had the highest annual mean value with 4.9 wet hours per wet day. NE had ~1 h less than the smallest annual mean. The NW and the SW scored higher averages than the remaining classes only in winter.
WD classes had different occurrence frequencies and different percentages of wet days, but no significant differences in wet hours per wet day. The WD classes with a western component (SW and NW) were more frequent (Figure 4) and also had a higher percentage of the precipitation days (Figure 5). This was reflected in the average precipitation amount accumulated within each WD seasonally and throughout the year (Figure 7). On average, and regardless of the season, approximately 576 mm of precipitation per year was recorded for the SW and NW classes. This value corresponds to 77% of the annual amount. XX was linked to 14% of the yearly precipitation amount, while the NE and the SE combined were responsible for less than 10%. The SW recorded higher precipitation amounts in spring, summer, and fall than the remaining WD classes. Meanwhile, the NW led in the winter precipitation amount.
The WD classes occurred in different frequencies across the seasons, and the complex interactions between the WD classes, seasonality, and location within Germany must be considered when addressing the PDC, especially for the most common WDs, because the amount of precipitation associated with these classes also differed between seasons.

3.3. PDC with WD

Regardless of the other variables, the WD classes showed different diurnal precipitation patterns, especially the SW and the NW (Figure 8). The SW circulations were associated with a higher afternoon peak in both frequency and precipitation amount. The exact opposite was observed for the NW circulations, where higher frequencies and larger precipitation amounts were observed in the morning. The SW days generally ended up with higher precipitation frequencies and amounts than the start of the day. Contrariwise, the NW had a generally lower precipitation toward the end of the day. XX showed a slightly higher morning peak in the precipitation frequency, but a higher afternoon peak in the precipitation amount. The remaining WDs did not demonstrate large diurnal variations; however, the SE (NE) showed an increase (decrease) in both frequency and amount by the end of the day.
Some interesting differences in the PDC are associated with the WD across Germany (Figure 9). The frequency peak for the SW at southern stations is delayed until midnight, while the precipitation amount peaks around 19:00. which is considerably later than for the central and northern stations. In contrast, the afternoon peak of frequency for the NW at southern stations is weaker than those for the northern and central stations. The precipitation frequency and amount increase as we move from north to south across Germany in all the WD cases.
A decrease in the hourly precipitation frequency and amount in the SW is observed as we move from west to east, while a slight increase is found in both values for the NE. The remaining WD classes do not show clear differences with latitude and longitude. The general PDC of the SW is observed for the western and central stations. However, the precipitation frequency stabilizes after the afternoon peak only in the case of the eastern stations. The morning peak of P ¯ a in the eastern stations also disappears in the SW cases.
Seasons seem to have more influence on the PDC patterns than geographical location. The frequency and the amount of summer precipitation are the largest for the SW (Figure 10), while in winter, the NW records the highest rain frequency and amount. A higher peak for the SW (NW) in the afternoon (morning) prevails in all seasons. The morning peak in the precipitation frequency occurs at the same time for the SW and NW in all seasons, except for winter, where the SW morning peak appears a few hours later. The morning peaks in the precipitation amount differ by season and WD class. It is clear for spring and fall in SW and NW, has a weak magnitude in summer, and disappears in winter. Only in the case of the NW is the precipitation amount high from the early morning until 06:00, then it starts to drop.
XX generally has less precipitation frequency in winter and summer than in spring and fall. In winter, the peaks of XX disappear, and the morning hours have a generally higher frequency of rain than the evening hours. The PDC for XX is strong for the precipitation amount in the summer, weaker in spring and autumn, and almost disappears in winter.
The PDC is also weak for both the SE and NE, where the NE has a higher frequency than the SE, especially in the morning hours of winter, spring, and fall. The SE has only an increase in the precipitation amount that appears in the late afternoons of spring and summer.

4. Discussion

Westerly circulations are frequent over northern Europe because of the jet stream. These circulations are projected to occur more frequently in the future in most climate models [36,37]. They are of particular interest because they represent the dominant path and direction of humidity transport in this area [58]. Our results show that the NW and the SW are the most common WD classes. The NW is more frequent in winter, while the SW is the dominant WD class in summer. This can be explained by the different influences of the polar and subtropical jet streams. In winter, the polar jet stream lies over Scandinavia and Northern Germany and frequently advects cold air from the NW. In summer, the subtropical jet streams lie over the Mediterranean and bring warm air from the SW to Germany. The precipitation frequency and amount across all seasons and stations are generally the largest for the NW and SW. They have a bimodal PDC with a peak in the precipitation occurrence frequency in the morning and another peak in the afternoon. The morning peak is higher (lower) than the afternoon peak in the case of the NW (SW). Apart from the observed peaks, the NW (SW) ends with lower (higher) precipitation frequency and amount than the beginning of the day.
The precipitation frequency in each hour is determined by convective and stratiform precipitation occurrences. The probability of each type must be considered to explain the PDC patterns of the two most important WDs. Short (long) event durations are reported to be more frequent in the afternoon (morning) in China [59] and the UK [60], which implies that convective (advective) precipitation processes are generally intensified in these periods. In Lausanne, Switzerland, convective rain represents only 11% of the total rain duration, but up to 40% of the total rain amount [27]. Accordingly, we assume herein that the stratiform type dominates the precipitation occurrence in all WD classes, despite the fact that we did not classify rain into convective and stratiform. However, summer season, afternoon hours, and their combination produce conditions that support convective precipitation occurrence, especially in the case of the SW flow. Conversely, the reduced solar energy in winter, cold night hours until the morning, and the existence of snow cover suppress the convection process in this season.
Another important aspect that contributes to the PDC of the NW and the SW is the predominant origin of the air masses. When the SW is dominant over Germany, the air parcels move from the areas of higher solar energy input in the south into areas where less solar energy input is available. The opposite happens in the case of the NW. Cold fronts are reported to have a typical direction toward the south and southeast in the US, while warm fronts typically move toward the north and northeast [61]. A similar pattern might apply to Germany. However, this has not been reported so far.
We attribute the morning peak in stratiform precipitation mainly to the radiative cooling of the earth’s surface and cloud tops when clouds exist. This initiates and intensifies the condensation process at lower levels in the form of fog and low clouds. This process has been reported and explained in the western Washington state [62], Scotland [63], Japan [64], California [65], and China [66], and is especially intense in windless nights in the south of Poland [3]. The morning peak in Sweden is attributed to the cold temperatures of the surface near the sea [56]. The morning radiative cooling is more efficient in producing precipitation in the case of the NW because of the cold air advection compared to the warm air in the case of the SW. The morning peak is observed, despite filtering precipitation records below 0.2 mm. The threshold aims to remove records of dew/frost, which might amplify the observed morning peak frequency.
The contribution of convection to the early morning precipitation has been addressed in several studies, where the early morning peak was attributed at least partially to factors such as the interaction between the accumulated humidity at low levels over the night hours and the complex topography [67] or proximity to water bodies [68,69,70]. However, the morning peak, which is intensified in winter and in northern circulations, suggests that stratiform rain is the dominant type in this peak. A previous study in Austria [23] pointed out that the morning peak cannot be strictly linked to orography because it is observed in both plain regions and mountain areas. Our results support this finding because the morning peak occurs in all areas across Germany. However, the morning peak is most prominent in the case of the NW. In this case, the air parcels are relatively cold compared to the other WD cases, which means that the radiative cooling effect has higher potential and efficiency in initiating the precipitation.
The afternoon peak is mainly caused by the convection mechanism. The warm and moist air coming from the Mediterranean in the case of the SW causes instability and raises the possibility of a convective precipitation in the afternoon. This high peak in the precipitation frequency for the SW appears at all locations and in all seasons and is especially intense in summer. Contrariwise, less convection is expected in the case of the NW because of the cold air advection and the higher stability of the air masses. Additionally, clouds are formed during the night and remain until sunrise by radiative cooling in the case of the NW. They reduce the amount of solar energy that reaches the ground and hinder the afternoon convective process [60], leading to a lower afternoon peak.
The effect of elevation on the PDC is hard to separate from the effect of latitude in Germany because high-elevation stations are concentrated mostly in the Alps, while stations to the north are below 100 m a.s.l. (Figure 1). The southern high-elevation stations receive precipitation with higher frequency and amounts than the lower stations to the north. This applies to all WD classes, except for the NW, where no difference between the northern and southern stations is detected. In the case of the NW flows, a reduction of humidity is supposed when precipitating clouds move from the sea over the whole of Germany.
Lower precipitation frequency and amount were observed in the eastern stations only on the SW days, while the remaining WD classes showed similar observations in the east and west of Germany. The reduced precipitation in the eastern regions in the case of the SW flow can be explained by the fact that precipitation is formed usually over the Alps, and while moving to the northeast, the air is dried out. The foehn effect might also contribute because the area in the southeast of Germany falls within the leeward side of the Alps considering the SW. This is similar to the reported effect of foehn on the area south of the Alps in the case of the northern WDs [38]. The frequency afternoon peak is delayed on the SW days for both eastern and southern stations because precipitation initiates in the afternoon over the central Alps and takes time until midnight on average to peak in the southern and eastern stations. A similar effect is reported for Poland, where the Carpathians delay the precipitation peak to late night and early morning, and the warm fronts witness a delayed afternoon peak [3]. This can be explained by the strength of the frontal system, which makes it intense and resistant to the radiative cooling, pushing the convection process to continue further into the late night and early morning. However, this effect is reported for the NW situations in the south of Poland. In our case, it was observed only in the SW situation. The Alps are reported to have a higher amplitude of the PDC than the regions north and east of the Alps [23]. We were not able to identify the geographical extent to which the Alps influence the amplitude of the PDC. However, at least for the SW situations, the convection cells move toward the regions north and east of the Alps. Consequently, the precipitation frequency increases in the evening hours after the afternoon peak at the southern stations, remains stable at the eastern stations, and decreases at all other locations. This also causes the delay in amount afternoon peak which appears in southern and eastern stations in the case of SW.
Other local factors may play a role in altering the PDC discussed previously. Such factors include urban heat island, land use, availability of nearby water bodies, and availability of condensation nuclei. However, on the scale addressed across the whole of Germany, they should be negligible, and a further analysis is beyond the scope of this paper.

5. Conclusions

The hourly measurements of precipitation were combined with the general WD in the upper atmospheric levels taken from the synoptic weather pattern over Germany for the period 1995–2017. These records were used to study the diurnal variation of the precipitation frequency and amount in Germany. The combined effects of the WD at the upper levels, seasonality, and geographical location were investigated. Our main conclusions regarding the PDC are as follows:
  • Precipitation occurs most frequently in winter and least in summer. However, the precipitation amount is the highest in summer and the lowest in winter and spring.
  • The more continental eastern part of Germany witnesses lower values of precipitation frequency and amount than the rest of Germany. Southern high-elevation stations receive higher precipitation frequencies and amounts than the others.
  • The PDC generally has a bimodal distribution with one morning peak in the precipitation frequency and another afternoon peak. The morning peak in the precipitation amount is small compared to the afternoon peak. The pattern of the PDC shows only small differences with location and elevation.
  • The PDC shows clear differences between the two most frequent WDs. The SW days have a high afternoon peak and a lower morning peak. The NW days have a high morning peak and a lower afternoon peak. This applies to both precipitation frequency and amount.
  • The SW days end with higher levels of both precipitation frequency and amount than the early morning. The opposite applies for the NW.
  • The PDC differences between seasons are dominated by the frequency of each WD per season.
Our findings highlight, for the first time, the importance of weather circulations in controlling the PDC of the precipitation occurrence and amount in Germany. Future research needs to consider the influence of advection and convection preferably over long periods of measurements. The heavy and extreme precipitation occurrence and amount over the hours of the day considering large-scale weather circulations are of special interest for hydrologists and weather forecasters.

Supplementary Materials

A List of precipitation measuring stations with IDs and geographical coordinates is available online at https://www.mdpi.com/2073-4433/10/9/545/s1.

Author Contributions

Conceptualization: W.G., N.E., and A.M.; data processing: W.G. and Y.Y.; writing: W.G.; interpreting: W.G. and C.W.; review and editing: W.G., Y.Y., C.W., N.E., and A.M.; supervision: A.M.

Funding

This work was supported by the Technical University of Munich (TUM) School of Life Sciences Weihenstephan.

Acknowledgments

We thank the Deutscher Wetterdienst (German Meteorological Service [DWD]) for providing the synoptic weather pattern records and the hourly precipitation data. The first author thanks the Deutscher Akademischer Austauschdienst (DAAD) for financial support.

Conflicts of Interest

The authors declare no conflict of interest. The funders had no role in the design of the study; in the collection, analyses, or interpretation of data; in the writing of the manuscript; or in the decision to publish the results.

References

  1. Dai, A. Global Precipitation and Thunderstorm Frequencies. Part II: Diurnal Variations. J. Clim. 2001, 14, 1112–1128. [Google Scholar] [CrossRef]
  2. Dai, A.; Giorgi, F.; Trenberth, K.E. Observed and model-simulated diurnal cycles of precipitation over the contiguous United States. J. Geophys. Res. 1999, 104, 6377–6402. [Google Scholar] [CrossRef]
  3. Twardosz, R. Diurnal variation of precipitation frequency in the warm half of the year according to circulation types in Kraków, South Poland. Theor. Appl. Climatol. 2007, 89, 229–238. [Google Scholar] [CrossRef]
  4. Yang, G.Y.; Slingo, J. The Diurnal Cycle in the Tropics. Mon. Weather Rev. 2001, 129, 784–801. [Google Scholar] [CrossRef]
  5. Wallace, J.M. Diurnal Variations in Precipitation and Thunderstorm Frequency over the Conterminous United States. Mon. Weather Rev. 1975, 103, 406–419. [Google Scholar] [CrossRef] [Green Version]
  6. Dai, A.; Trenberth, K.E. The Diurnal Cycle and Its Depiction in the Community Climate System Model. J. Clim. 2004, 17, 930–951. [Google Scholar] [CrossRef]
  7. Crutzen, P.J.; Lawrence, M.G. The Impact of Precipitation Scavenging on the Transport of Trace Gases: A 3-Dimensional Model Sensitivity Study. J. Atmos. Chem. 2000, 37, 81–112. [Google Scholar] [CrossRef]
  8. Bohn, T.J.; Whitney, K.M.; Mascaro, G.; Vivoni, E.R. A Deterministic Approach for Approximating the Diurnal Cycle of Precipitation for Use in Large-Scale Hydrological Modeling. J. Hydrometeorol. 2019, 20, 297–317. [Google Scholar] [CrossRef]
  9. Arnaud, P.; Lavabre, J. Coupled rainfall model and discharge model for flood frequency estimation. Water Resour. Res. 2002, 38, 11-1–11-11. [Google Scholar] [CrossRef]
  10. Slingo, J.; Inness, P.; Neale, R.; Woolnough, S.; Yang, G. Scale interactions on diurnal toseasonal timescales and their relevanceto model systematic errors. Ann. Geophys. 2003, 46. [Google Scholar] [CrossRef]
  11. Randall, D.A.; Wood, R.A.; Bony, S.; Colman, R.; Fichefet, T.; Fyfe, J.; Kattsov, V.; Pitman, A.; Shukla, J.; Srinivasan, J.; et al. Climate models and their evaluation. In Climate Change 2007: The Physical Science Basis. Contribution of Working Group I to the Fourth Assessment Report of the IPCC (FAR); Cambridge University Press: Cambridge, UK, 2007; p. 608. [Google Scholar]
  12. Love, B.S.; Matthews, A.J.; Lister, G.M.S. The diurnal cycle of precipitation over the Maritime Continent in a high-resolution atmospheric model. Q. J. R. Meteorol. Soc. 2011, 137, 934–947. [Google Scholar] [CrossRef] [Green Version]
  13. Zhang, Y.; Chen, H.; Wang, D. Robust Nocturnal and Early Morning Summer Rainfall Peaks over Continental East Asia in a Global Multiscale Modeling Framework. Atmosphere 2019, 10, 53. [Google Scholar] [CrossRef]
  14. Im, E.S.; Eltahir, E.A.B. Simulation of the diurnal variation of rainfall over the western Maritime Continent using a regional climate model. Clim. Dyn. 2018, 51, 73–88. [Google Scholar] [CrossRef]
  15. Mooney, P.A.; Broderick, C.; Bruyère, C.L.; Mulligan, F.J.; Prein, A.F. Clustering of Observed Diurnal Cycles of Precipitation over the United States for Evaluation of a WRF Multiphysics Regional Climate Ensemble. J. Clim. 2017, 30, 9267–9286. [Google Scholar] [CrossRef]
  16. Xie, S.; Wang, Y.C.; Lin, W.; Ma, H.Y.; Tang, Q.; Tang, S.; Zheng, X.; Golaz, J.C.; Zhang, G.J.; Zhang, M. Improved Diurnal Cycle of Precipitation in E3SM with a Revised Convective Triggering Function. J. Adv. Model. Earth Syst. 2019, 11, 2290–2310. [Google Scholar] [CrossRef]
  17. Li, Q.; Yang, G. Temporal Distribution Characteristics of Alpine Precipitation and Their Vertical Differentiation: A Case Study from the Upper Shule River. Water 2017, 9, 284. [Google Scholar] [CrossRef]
  18. Zhu, X.; Zhang, Q.; Sun, P.; Singh, V.P.; Shi, P.; Song, C. Impact of urbanization on hourly precipitation in Beijing, China: Spatiotemporal patterns and causes. Glob. Planet. Chang. 2019, 172, 307–324. [Google Scholar] [CrossRef]
  19. Svensson, C.; Jakob, D.; Reed, D.W. Diurnal characteristics of heavy precipitation according to weather type at an upland site in Scotland. Int. J. Climatol. 2002, 22, 569–585. [Google Scholar] [CrossRef]
  20. Froidurot, S.; Molinié, G.; Diedhiou, A. Climatology of observed rainfall in Southeast France at the Regional Climate Model scales. Clim. Dyn. 2018, 51, 779–797. [Google Scholar] [CrossRef]
  21. Mandapaka, P.V.; Germann, U.; Panziera, L. Diurnal cycle of precipitation over complex Alpine orography: Inferences from high-resolution radar observations. Q. J. R. Meteorol. Soc. 2013, 139, 1025–1046. [Google Scholar] [CrossRef]
  22. Panziera, L.; Gabella, M.; Germann, U.; Martius, O. A 12-year radar-based climatology of daily and sub-daily extreme precipitation over the Swiss Alps. Int. J. Climatol. 2018, 38, 3749–3769. [Google Scholar] [CrossRef]
  23. Yaqub, A.; Seibert, P.; Formayer, H. Diurnal precipitation cycle in Austria. Theor. Appl. Climatol. 2011, 103, 109–118. [Google Scholar] [CrossRef]
  24. Rysman, J.F.; Lemaître, Y.; Moreau, E. Spatial and Temporal Variability of Rainfall in the Alps–Mediterranean Euroregion. J. Appl. Meteorol. Climatol. 2016, 55, 655–671. [Google Scholar] [CrossRef]
  25. Meredith, E.P.; Ulbrich, U.; Rust, H.W. The Diurnal Nature of Future Extreme Precipitation Intensification. Geophys. Res. Lett. 2019, 46, 7680–7689. [Google Scholar] [CrossRef] [Green Version]
  26. Ramos, A.M.; Barriopedro, D.; Dutra, E. Circulation weather types as a tool in atmospheric, climate, and environmental research. Front. Environ. Sci. 2015, 3. [Google Scholar] [CrossRef] [Green Version]
  27. Ghada, W.; Buras, A.; Lüpke, M.; Schunk, C.; Menzel, A. Rain Microstructure Parameters Vary with Large-Scale Weather Conditions in Lausanne, Switzerland. Remote Sens. 2018, 10, 811. [Google Scholar] [CrossRef]
  28. Schiemann, R.; Frei, C. How to quantify the resolution of surface climate by circulation types: An example for Alpine precipitation. Phys. Chem. Earth Parts A B C 2010, 35, 403–410. [Google Scholar] [CrossRef]
  29. Åström, H.L.A.; Sunyer, M.; Madsen, H.; Rosbjerg, D.; Arnbjerg-Nielsen, K. Explanatory analysis of the relationship between atmospheric circulation and occurrence of flood-generating events in a coastal city. Hydrol. Process. 2016, 30, 2773–2788. [Google Scholar] [CrossRef]
  30. Twardosz, R. Analysis of hourly precipitation characteristics in Kraków, southern Poland, using a classification of circulation types. Hydrol. Res. 2009, 40, 553–563. [Google Scholar] [CrossRef]
  31. Prudhomme, C.; Genevier, M. Can atmospheric circulation be linked to flooding in Europe? Hydrol. Process. 2011, 25, 1180–1190. [Google Scholar] [CrossRef]
  32. Nied, M.; Pardowitz, T.; Nissen, K.; Ulbrich, U.; Hundecha, Y.; Merz, B. On the relationship between hydro-meteorological patterns and flood types. J. Hydrol. 2014, 519, 3249–3262. [Google Scholar] [CrossRef] [Green Version]
  33. Kyselý, J.; Huth, R. Changes in atmospheric circulation over Europe detected by objective and subjective methods. Theor. Appl. Climatol. 2006, 85, 19–36. [Google Scholar] [CrossRef]
  34. Kučerová, M.; Beck, C.; Philipp, A.; Huth, R. Trends in frequency and persistence of atmospheric circulation types over Europe derived from a multitude of classifications. Int. J. Climatol. 2017, 37, 2502–2521. [Google Scholar] [CrossRef]
  35. Shepherd, T.G. Atmospheric circulation as a source of uncertainty in climate change projections. Nat. Geosci. 2014, 7, 703–708. [Google Scholar] [CrossRef]
  36. Plavcová, E.; Kyselý, J. Projected evolution of circulation types and their temperatures over Central Europe in climate models. Theor. Appl. Climatol. 2013, 114, 625–634. [Google Scholar] [CrossRef]
  37. Stryhal, J.; Huth, R. Trends in winter circulation over the British Isles and central Europe in twenty-first century projections by 25 CMIP5 GCMs. Clim. Dyn. 2019, 52, 1063–1075. [Google Scholar] [CrossRef]
  38. Panziera, L.; Giovannini, L.; Laiti, L.; Zardi, D. The relation between circulation types and regional Alpine climate. Part I: Synoptic climatology of Trentino. Int. J. Climatol. 2015, 35, 4655–4672. [Google Scholar] [CrossRef]
  39. Twardosz, R. A synoptic analysis of the diurnal cycle of thunderstorm precipitation in Kraków (Southern Poland). Int. J. Climatol. 2009, 30, 1008–1013. [Google Scholar] [CrossRef]
  40. Deutscher Wetterdienst. Description of the Method and the Weather Types. Available online: https://www.dwd.de/EN/ourservices/wetterlagenklassifikation/beschreibung.html?nn=495490&lsbId=520444 (accessed on 9 September 2019).
  41. Deutscher Wetterdienst. Weather Type Classification Data. Available online: https://www.dwd.de/EN/ourservices/wetterlagenklassifikation/online_wlkdaten.txt?view=nasPublication&nn=495490 (accessed on 9 September 2019).
  42. Deutscher Wetterdienst. Historical Hourly Station Observations of Precipitation for Germany. Available online: ftp://opendata.dwd.de/climate_environment/CDC/observations_germany/climate/hourly/precipitation/historical/ (accessed on 9 September 2019).
  43. Deutscher Wetterdienst. List of Precipitation Observation Stations in Germany. Available online: ftp://opendata.dwd.de/climate_environment/CDC/observations_germany/climate/hourly/precipitation/historical/RR_Stundenwerte_Beschreibung_Stationen.txt (accessed on 9 September 2019).
  44. Joss, J.; Tognini, E. Ein automatisch arbeitender Ombrograph mit grossem Auflsungsvermgen und mit fernbertragung der Messwerte. PAGEOPH 1967, 68, 229–239. [Google Scholar] [CrossRef]
  45. Deutscher Wetterdienst. Vorschriften und Betriebsunterlagen Nr. 3 (VuB 3): Technikhandbuch (THB) Für Wettermeldestellen des Synoptisch-Klimatologischen Mess- und Beobachtungsnetzes. Available online: https://www.dwd.de/DE/leistungen/pbfb_verlag_vub/pdf_einzelbaende/vub_3_thb_gesamt_pdf.pdf?__blob=publicationFile&v=5 (accessed on 9 September 2019).
  46. R Core Team. R: A Language and Environment for Statistical Computing; The R Foundation: Vienna, Austria, 2018; Available online: https://www.R-project.org/ (accessed on 12 September 2019).
  47. R Studio Team. R Studio: Integrated Development Environment for R.; R Studio Team: Boston, MA, USA, 2016; Available online: http://www.rstudio.com/ (accessed on 12 September 2019).
  48. Cooper, N. Reader: Suite of Functions to Flexibly Read Data from Files. 2017. Available online: https://CRAN.R-project.org/package=reader (accessed on 12 September 2019).
  49. Marek Gagolewski. R Package Stringi: Character String Processing Facilities. 2018. Available online: http://www.gagolewski.com/software/stringi/ (accessed on 12 September 2019).
  50. Wickham, H. Ggplot2: Elegant Graphics for Data Analysis; Springer: New York, NY, USA, 2016; ISBN 978-3-319-24277-4. [Google Scholar]
  51. Grolemund, G.; Wickham, H. Dates and Times Made Easy with lubridate. J. Stat. Softw. 2011, 40, 1–25. [Google Scholar] [CrossRef]
  52. Bivand, R.; Lewin-Koh, N. Maptools: Tools for Handling Spatial Objects. 2018. Available online: https://CRAN.R-project.org/package=maptools (accessed on 12 September 2019).
  53. Hijmans, R.J. Raster: Geographic Data Analysis and Modeling. 2017. Available online: https://CRAN.R-project.org/package=raster (accessed on 12 September 2019).
  54. Wickham, H. Reshaping Data with the reshape Package. J. Stat. Softw. 2007, 21, 1–20. [Google Scholar] [CrossRef]
  55. Wickham, H.; François, R.; Henry, L.; Müller, K. Dplyr: A Grammar of Data Manipulation. 2018. Available online: https://CRAN.R-project.org/package=dplyr (accessed on 12 September 2019).
  56. Jeong, J.H.; Walther, A.; Nikulin, G.; Chen, D.; Jones, C. Diurnal cycle of precipitation amount and frequency in Sweden: Observation versus model simulation. Tellus A Dyn. Meteorol. Oceanogr. 2011, 63, 664–674. [Google Scholar] [CrossRef]
  57. Wickham, H. Ggplot2. Elegrant Graphics for Data Analysis, 2nd ed.; Sievert, C., Ed.; Springer: Basel, Switzerland, 2016; ISBN 9783319242750. [Google Scholar]
  58. van der Ent, R.J.; Savenije, H.H.G.; Schaefli, B.; Steele-Dunne, S.C. Origin and fate of atmospheric moisture over continents. Water Resour. Res. 2010, 46, 61. [Google Scholar] [CrossRef]
  59. Yu, R.; Xu, Y.; Zhou, T.; Li, J. Relation between rainfall duration and diurnal variation in the warm season precipitation over central eastern China. Geophys. Res. Lett. 2007, 34, L13703. [Google Scholar] [CrossRef]
  60. Xiao, C.; Yuan, W.; Yu, R. Diurnal cycle of rainfall in amount, frequency, intensity, duration, and the seasonality over the UK. Int. J. Climatol. 2018, 38, 4967–4978. [Google Scholar] [CrossRef]
  61. Ahrens, C.D. Essentials of Meteorology. An Invitation to the Atmosphere, 5th ed.; Thomson Brooks/Cole: Belmont, CA, USA, 2008; ISBN 0495119040. [Google Scholar]
  62. Mass, C. The Topographically Forced Diurnal Circulations of Western Washington State and Their Influence on Precipitation. Mon. Weather Rev. 1982, 110, 170–183. [Google Scholar] [CrossRef]
  63. Svensson, C.; Jakob, D. Diurnal and seasonal characteristics of precipitation at an upland site in Scotland. Int. J. Climatol. 2002, 22, 587–598. [Google Scholar] [CrossRef] [Green Version]
  64. Oki, T.; Musiake, K. Seasonal Change of the Diurnal Cycle of Precipitation over Japan and Malaysia. J. Appl. Meteorol. 1994, 33, 1445–1463. [Google Scholar] [CrossRef] [Green Version]
  65. Landin, M.G.; Bosart, L.F. The Diurnal Variation of Precipitation in California and Nevada. Mon. Weather Rev. 1989, 117, 1801–1816. [Google Scholar] [CrossRef] [Green Version]
  66. Li, J.; Yu, R.; Zhou, T. Seasonal Variation of the Diurnal Cycle of Rainfall in Southern Contiguous China. J. Clim. 2008, 21, 6036–6043. [Google Scholar] [CrossRef]
  67. Kubota, H.; Nitta, T. Diurnal Variations of Tropical Convection Observed during the TOGA-COARE. JMSJ 2001, 79, 815–830. [Google Scholar] [CrossRef]
  68. Mori, S.; Jun-Ichi, H.; Tauhid, Y.I.; Yamanaka, M.D.; Okamoto, N.; Murata, F.; Sakurai, N.; Hashiguchi, H.; Sribimawati, T. Diurnal Land–Sea Rainfall Peak Migration over Sumatera Island, Indonesian Maritime Continent, Observed by TRMM Satellite and Intensive Rawinsonde Soundings. Mon. Weather Rev. 2004, 132, 2021–2039. [Google Scholar] [CrossRef]
  69. Chen, X.; Zhang, F.; Zhao, K. Diurnal Variations of the Land–Sea Breeze and Its Related Precipitation over South China. J. Atmos. Sci. 2016, 73, 4793–4815. [Google Scholar] [CrossRef]
  70. Zheng, Y.; Gong, Y.; Chen, J.; Tian, F. Warm-Season Diurnal Variations of Total, Stratiform, Convective, and Extreme Hourly Precipitation over Central and Eastern China. Adv. Atmos. Sci. 2019, 36, 143–159. [Google Scholar] [CrossRef]
Figure 1. Geographical distribution of the meteorological stations with the corresponding elevation classes. The two horizontal lines divide the stations into northern, central, and southern stations. The vertical lines divide the stations into western, central, and eastern stations.
Atmosphere 10 00545 g001
Figure 2. Precipitation diurnal cycles (PDC) represented by the long-term averages of the hourly precipitation occurrence frequency (upper panel) and the long-term averages of the hourly precipitation amount (lower panel) with shaded 95% confidence intervals in different (a) latitudes, (b) longitudes, and (c) elevations (see Table 1 for the definitions of the classes; N—north, C—central, and S—south (a); W—west, C—central, and E—east (b); and H—high, M—medium, and L—low (c)).
Atmosphere 10 00545 g002
Figure 3. Precipitation diurnal cycles (PDC) for each season represented by the long-term averages of (a) the hourly precipitation occurrence frequency and (b) the hourly precipitation amount with the shaded 95% confidence intervals.
Atmosphere 10 00545 g003
Figure 4. Total number of days per wind direction (WD) class in each season. The numbers in the legend indicate the percentage of days for each WD class for the whole study period, regardless of season. The WD classes are XX: no prevailing direction, NE: northeasterly, SE: southeasterly, SW: southwesterly, and NW: northwesterly. See Section 2.1.
Atmosphere 10 00545 g004
Figure 5. Percentage of wet days per wind direction (WD) in different seasons. The boxplots represent the distribution of this percentage across all stations. The horizontal colored lines and associated numbers in the legend represent the mean percentage across all years and stations, regardless of season. For the WD classes, see Section 2.1. In each boxplot, outliers are represented by black dots, the median is represented by the horizontal thick line, and the lower and upper hinges represent the first and third quartiles, while the upper (lower) whisker extends from the upper (lower) hinge to the largest (smallest) value no further than 1.5 times the interquartile range from the hinge [57].
Atmosphere 10 00545 g005
Figure 6. Average number of hours per wet day per wind direction (WD) in each season. The boxplots represent the distribution of the number of wet hours across all stations colored by the WD class. The horizontal colored lines and the associated numbers in the legend represent the mean number of wet hours per wet day across all years and stations for each WD class, regardless of the season. For the WD classes, see Section 2.1. The representation of the boxplot is same as explained in Figure 5.
Atmosphere 10 00545 g006
Figure 7. Boxplot of precipitation sums per wind direction (WD) in each season averaged over the measurement years for all stations. The numbers in the legend are the mean precipitation sums per year for each WD averaged over all stations in mm. For the WD classes, see Section 2.1. The representation of the boxplot is same as explained in Figure 5.
Atmosphere 10 00545 g007
Figure 8. Precipitation diurnal cycle in different wind direction (WD) classes represented by the long-term averages of the hourly precipitation occurrence frequency (a) and the hourly precipitation amount (b) with the shaded 95% confidence intervals.
Atmosphere 10 00545 g008
Figure 9. Precipitation diurnal cycle variation in different wind direction (WD) classes and geographical locations represented by the long-term averages of the hourly precipitation occurrence frequency (a,c) and the hourly precipitation amount (b,d) with the shaded 95% confidence intervals. The colors represent the four WD classes, while the panels represent the station class by latitude (a,b) and longitude (c,d).
Atmosphere 10 00545 g009
Figure 10. Precipitation diurnal cycle variation in different wind direction (WD) classes and seasons represented by the long-term averages of the hourly precipitation occurrence frequency (a) and the hourly precipitation amount (b) with the shaded 95% confidence intervals. The colors represent the four WD classes, while the panels represent the four seasons.
Atmosphere 10 00545 g010
Table 1. Stations by geographical location and elevation.
ThresholdClassNumber of Stations
Longitude (° E)>11.5Eastern (E)46
9.4–11.5Central (C)48
<9.4Western (W)42
Latitude (° N)>52Northern (N)45
50–52Central (C)46
<50Southern (S)45
Elevation (m a.s.l.)>400High (H)43
100–400Medium (M)46
<100Low (L)47

