1. Introduction
Odor is an important component of air pollution that can cause people annoyance by irritating the nose and lead to a negative quality of life [
1,
2]. Although the ambient air quality has significantly improved in the last few decades, the tolerance of residents to odor impacts appears to be reduced [
3]. It is difficult to quantitatively analysis the odor substances because of their low olfactory threshold concentration and high chemical activity [
4]. In addition, odor pollution is based on the psychological impact of people as the main features [
5], for example: Vanillin with a fragrant scent will make people feel pleasant, while Ammonia with a pungent smell will make people feel disgusted, but the gas composition concentration analyzed by the instrument cannot truly reflect the sensory impact on the human organ [
6]. Therefore, odor is a sensation measurable through the subjective responses of individuals. The extent of the annoyance caused by odorous air depends on a number of parameters, collectively known as FIDOL, namely the frequency (F), intensity (I), duration (D), offensiveness (O), and location (L) [
7,
8,
9]. The offensiveness of an odor perception is often measured in terms of the “hedonic tone”, a category judgment of the relative like (pleasantness) or dislike (unpleasantness) of the odor [
10]. Furthermore, experience has shown that the hedonic tone can reflect injury and the psychological influence better than the most widely used regulatory parameter—odor concentration, OC [
11].
The odors emitted by various industrial sources differ by their nuisance potential because the hedonic tone of the odor apparently affects the degree of the nuisance [
12,
13]. Winneke and Kastka [
14] reported the importance of the hedonic tone on human beings’ psychological feelings. They surveyed residents near a candy factory, an insulation plant, a tar refinery and a winery, and found that the annoyance caused by different industrial sources was not the same. The chocolate factory is rated as being less unpleasant and harassing than the tar refinery. A similar test was conducted by Hangartner and Wüst, and the results showed that the odors from grass-drying plants and food-processing plants caused less annoyance than those in the chemical industry and in tar processing [
15]. In a research about odor annoyance evaluation, the prediction of the percentage of those being “highly annoyed” (HA%) would be much closer to the actual situation if the hedonic tone was taken into account. The HA% at a certain exposure level will be lower than the more unpleasant odor [
16]. A related site investigation was conducted around six odor emitting sources; two were pleasant, two were neutral, and two were unpleasant odor emissions, the results showing that the hedonic tone is a powerful predictor of annoyance, and that the exposure-annoyance as well as exposure-symptom associations are strongly affected by the hedonic tone [
17]. In addition, the hedonic tone is an important dimension for the odor classification by humans with diverse cultural backgrounds [
18]. The same conclusion was obtained by Wang et al. [
19], in her research about 60 odor words that were classified by ninety college students based on the individual perceptual similarity; the results showed that the hedonic tone can be the standard of odor words classification.
Currently, the control and regulation of odor pollution is mostly based on the OC parameter [
20]. The OC is defined as being the dilution factor required to reach the sensory threshold. From the definition, we can see that the OC is independent of the odor character itself, and therefore cannot truly reflect the personal perception of diverse odors [
21]. For example, the smell of perfume and sewage may have the same OC, but their psychological feelings are completely different, and the acceptable concentration levels are inevitably different. Practical experience has shown that the OC is not an adequate criterion for the evaluation of a variety of odors. Additional factors, such as their hedonic tone, must also be taken into account [
22,
23]. In some countries (e.g., Germany, Ireland, and Belgium), the odor impact criteria can be adapted according to the hedonic tone of an odor by using a weighting factor [
24].
For a certain odorant or odorous sample, its hedonic tone is not fixed but varies with the concentration. Understanding the relation between the hedonic tone and OC is helpful for the determination of acceptable concentration levels as well as for setting odor impact criteria. Nimmermark [
25] conducted research to study the influence of the odor concentration on the hedonic tone of odor from livestock and poultry farm. The results showed that at the same hedonic level of −1, which means slightly unpleasant, the corresponding odor concentration is 14–16 OUE·m
−3 from livestock, while it is 37 OUE·m
−3 from a cow shed. Huang and Guo [
26] conducted research in a commercial daily barn, layer barn, and broiler barn; a reference table of OC limits was generated with 3 set values for the hedonic tone (0, −1, and −2) for all three odor sources, which may provide references in establishing appropriate odor impact criteria to meet different land use purposes.
As yet, there have been few studies about the hedonic tone in China. The main purpose of this article is to present the hedonic characteristics of three typical odorous substances: dimethyl disulfide, limonene and butyl acetate, which are widely distributed in the environment. Additionally, the purpose of this article is improve the odor evaluation criterion in China by studying the relationship between the hedonic tone and OC. The achievements can lay the foundation for a more scientific odor pollution characterization method.
2. Experimental Section
2.1. Standard Substances
In the research, more than 20 odorants were tested. Furthermore, three of them, dimethyl disulfide, butyl acetate and limonene, were chosen as the representative odorants with different hedonic characteristics. Dimethyl disulfide is a flammable liquid with an unpleasant, garlic-like odor. Limonene is a colorless liquid hydrocarbon that possesses a pleasant smell of oranges. Butyl acetate is found in many types of fruit; however, there is a divergence about the smell: some people feel that it is pleasant, like a sweet smell of banana or apple, but for others it is unpleasant. In this research, 50 ppm of dimethyl disulfide and limonene gas and 500 ppm of butyl acetate gas were selected as the original samples.
2.2. Sample Preparation
The standard gas was diluted to 6 concentration gradients that differ by a factor of approximately 3. The lower limit must correspond to the panel threshold. The higher limit must be checked for toxicity, and all possible health risk of the panelists must be totally excluded. The dilutions were filled into the 8 L polyester odorless sampling bags respectively as the testing sample, and inserted into two bags of nitrogen as the blank samples. The process was done with the help of a dynamic dilution apparatus (4600, Entsch, USA).
2.3. Testing Method
The OC of a sample is measured by diluting the sample with odorless air until it cannot be discriminated from odorless air by a test group of persons. The OC of the original standard gaseous samples were determined following the guideline “Air Quality-Determination of Odor-Triangle Odor Bag Method” [
27] The determination of the hedonic tone refers to a 9 point scale with values ranging from “−4-extremely unpleasant” to “+4-extremely pleasant”, via “0-neither pleasant nor unpleasant” (“neutral”) (See
Table 1).
In order to prevent the interference factors, it should be ensured that the experiment room is odorless and has good ventilation. The temperature of all samples is 26~28 °C, which is comfortable for the human body.
The presentation of the odor samples with different concentrations was done at random, but the series of measurements must start neither with a blank sample nor with a maximum concentration. In order to avoid panelists’ possible guessing tendencies, the presentations were interspersed with blank ones.
The following instructions were given to the assessors before the test: The hedonic tone of an odor must not be confused with its quality (fragrant, pungent, stale or smelling like…). There is no “right” or “wrong” answer. The results are just on behalf of the personal feeling. The panel hedonic tone is the average value of all the panelists.
2.4. Panel of Assessors
In order to avoid the differences between individuals that may occur when determining the hedonic odor tone, the panel consisted of 16 qualified members who have passed the Sniffer Certification Test according to the Air Quality-Determination of Odor-Triangle Odor Bag Method. Seven of them were female and nine were male. Their ages varied from 22 up to 45, with a mean of 35 years. All the panelists came from different cities from the south to the north of China, with different living habits.
The panelist needs to be normalized by a 5-day routine course to make sure that the data are standard, accurate and stabilized. Each day, they were all trained with two reference materials: vanillin (5 g/L, dipropylene glycol) and guaiacol (5 µL/L, distilled water). The assessors rated the hedonic tone according to the 9-point hedonic scale. Before the test, they were instructed that “extremely unpleasant” should represent the most unpleasant odor they had experienced and that “extremely pleasant” should represent the most pleasant odor they had experienced. Their results were recorded every day. According to the requirements of Verein Deutscher Ingenieure, VDI 3882, the mean value of the results obtained from the entire panel must lie within a given range as follows:
All the study participants gave written informed consent. The study was approved by the local research ethics committee.
2.5. Data Processing Method
The data fitting module of Origin was used to analyse the relationship between the hedonic tone and OC. Based on the human psychological response to odors, the OCs were logarithm transformed, which is referred to as the odor index:
where C’ is the odor index, and C is the OC.
3. Results
3.1. The Hedonic Tone of Dimethyl Disulfide
Dimethyl disulfide is a typical odorant. According to the “Air Quality-Determination of Odor-Triangle Odor Bag Method”, the original OCs of the sample were measured as the result of 7413 OU
E·m
−3. The original sample was diluted to 10, 30, 100, 300, 1000 and 3000 times, which were represented by Z
1~Z
6. The hedonic tones at different OCs were determined by the panel members, and the results are shown in
Table 2.
Generally, the dimethyl disulfide hedonic tones were all negative, which means that they belong to the range of unpleasant substances. For the concentration level of Z1, about 56% of panelists gave the answer “extremely unpleasant”, and 38% “moderately unpleasant”. As the dilution factor increases, the degree of aversion gradually mitigates. Until the concentration was diluted to Z6, the majority was “neither pleasant nor unpleasant”, and others were “slightly unpleasant”. The average values of the hedonic tone from Z1 to Z6 are: −3.50, −2.75, −1.69, −1.56, −0.81, and −0.38.
In addition, hydrogen sulfide, ammonia, methyl mercaptan and some other odorants are similar to dimethyl disulfide. The odors at each dilution factor are all unpleasant, and the aversion gradually diminishes as the dilution multiples increase. The substances with such hedonic characteristics are all called unpleasant odorants.
3.2. The Hedonic Tone of Limonene
Limonene is an odorant with the scent of citrus. The original OC is 7413 OU
E·m
−3. Although the concentration was the same as dimethyl disulfide, the odor characteristics were completely different. The smell of limonene was not as strong as dimethyl disulfide, and was less unbearable. The concentration gradients include: the original gas, 10, 30, 100, 300 and 1000 dilution steps. The determination results are shown in
Table 3.
The smell of limonene varied with its OC. For the undiluted standard gas, the average value of the hedonic tone was −1.81, which was close to “moderately unpleasant.” When diluted 10 times, there were nine panelists who thought the smell was pleasant, seven felt it was unpleasant, and the average hedonic tone was 0.56, which was between “slightly pleasant” and “neither pleasant nor unpleasant.” When diluted 30 times, there were 12 panelists who thought that it was pleasant, and the average hedonic tone was 0.80, which was close to “slightly pleasant.” When diluted 100 times, 14 panelists thought it was pleasant, and the average hedonic tone almost reached 1, meaning “slightly pleasant.” When diluted 300 times, the odor became very weak, about 94% of the panelists thought it was “neither pleasant nor unpleasant,” and the average value of the hedonic tone was near 0. When diluted 1000 times, none of the panelists could perceive anything. This indicated that the smell of limonene usually provides a pleasant feeling, but that the odor decays relatively fast.
Besides, ethyl acetate, vanillin and some other scented substances have the similar hedonic characteristics to limonene. The odors are pleasant at lower concentration gradients, while they are unpleasant at higher concentration gradients. The substances with such hedonic characteristics are called pleasant odorants.
3.3. The Hedonic Tone of Butyl Acetate
The OC of butyl acetate is 17,378 OU
E·m
−3, and the serial samples of the test include: the original gas, 10, 30, 100, 300 and 1000 dilution steps. The results of the evaluation from the test group are shown in
Table 4.
In general, the smells of butyl acetate at different OC steps were all unpleasant, and the average values from Z1 to Z6 were respectively −3.12, −2.00, −1.50, −0.63, −0.50, and −0.19. The hedonic tone of butyl acetate decreases as its concentration decreases. However, different from disulfide, there were significant distinctions among the individuals for butyl acetate, insofar as when it was diluted 10 times, 2 panelists thought that it was pleasant. The number of pleased panelists increased with the dilution multiples, and when the odor concentration was diluted 300 times, about 5 people thought it was pleasant.
Methylisobutanone and propionaldehyde are similar to butyl acetate. At a same odor concentration, some people find this pleasant and some people find this unpleasant. Substances with such hedonic characteristics are called divergent odorants.
4. Discussion
4.1. The Relationship Between the Hedonic Tone and OC
The behavior curves of each odorant were plotted in the study with the odor index as the abscissa and the hedonic tone as the ordinate. The regression equations of the hedonic tone and the odor index were fitted through the data analysis software of Origin. According to these characteristic curves, the hedonic tone at different OCs can be obtained.
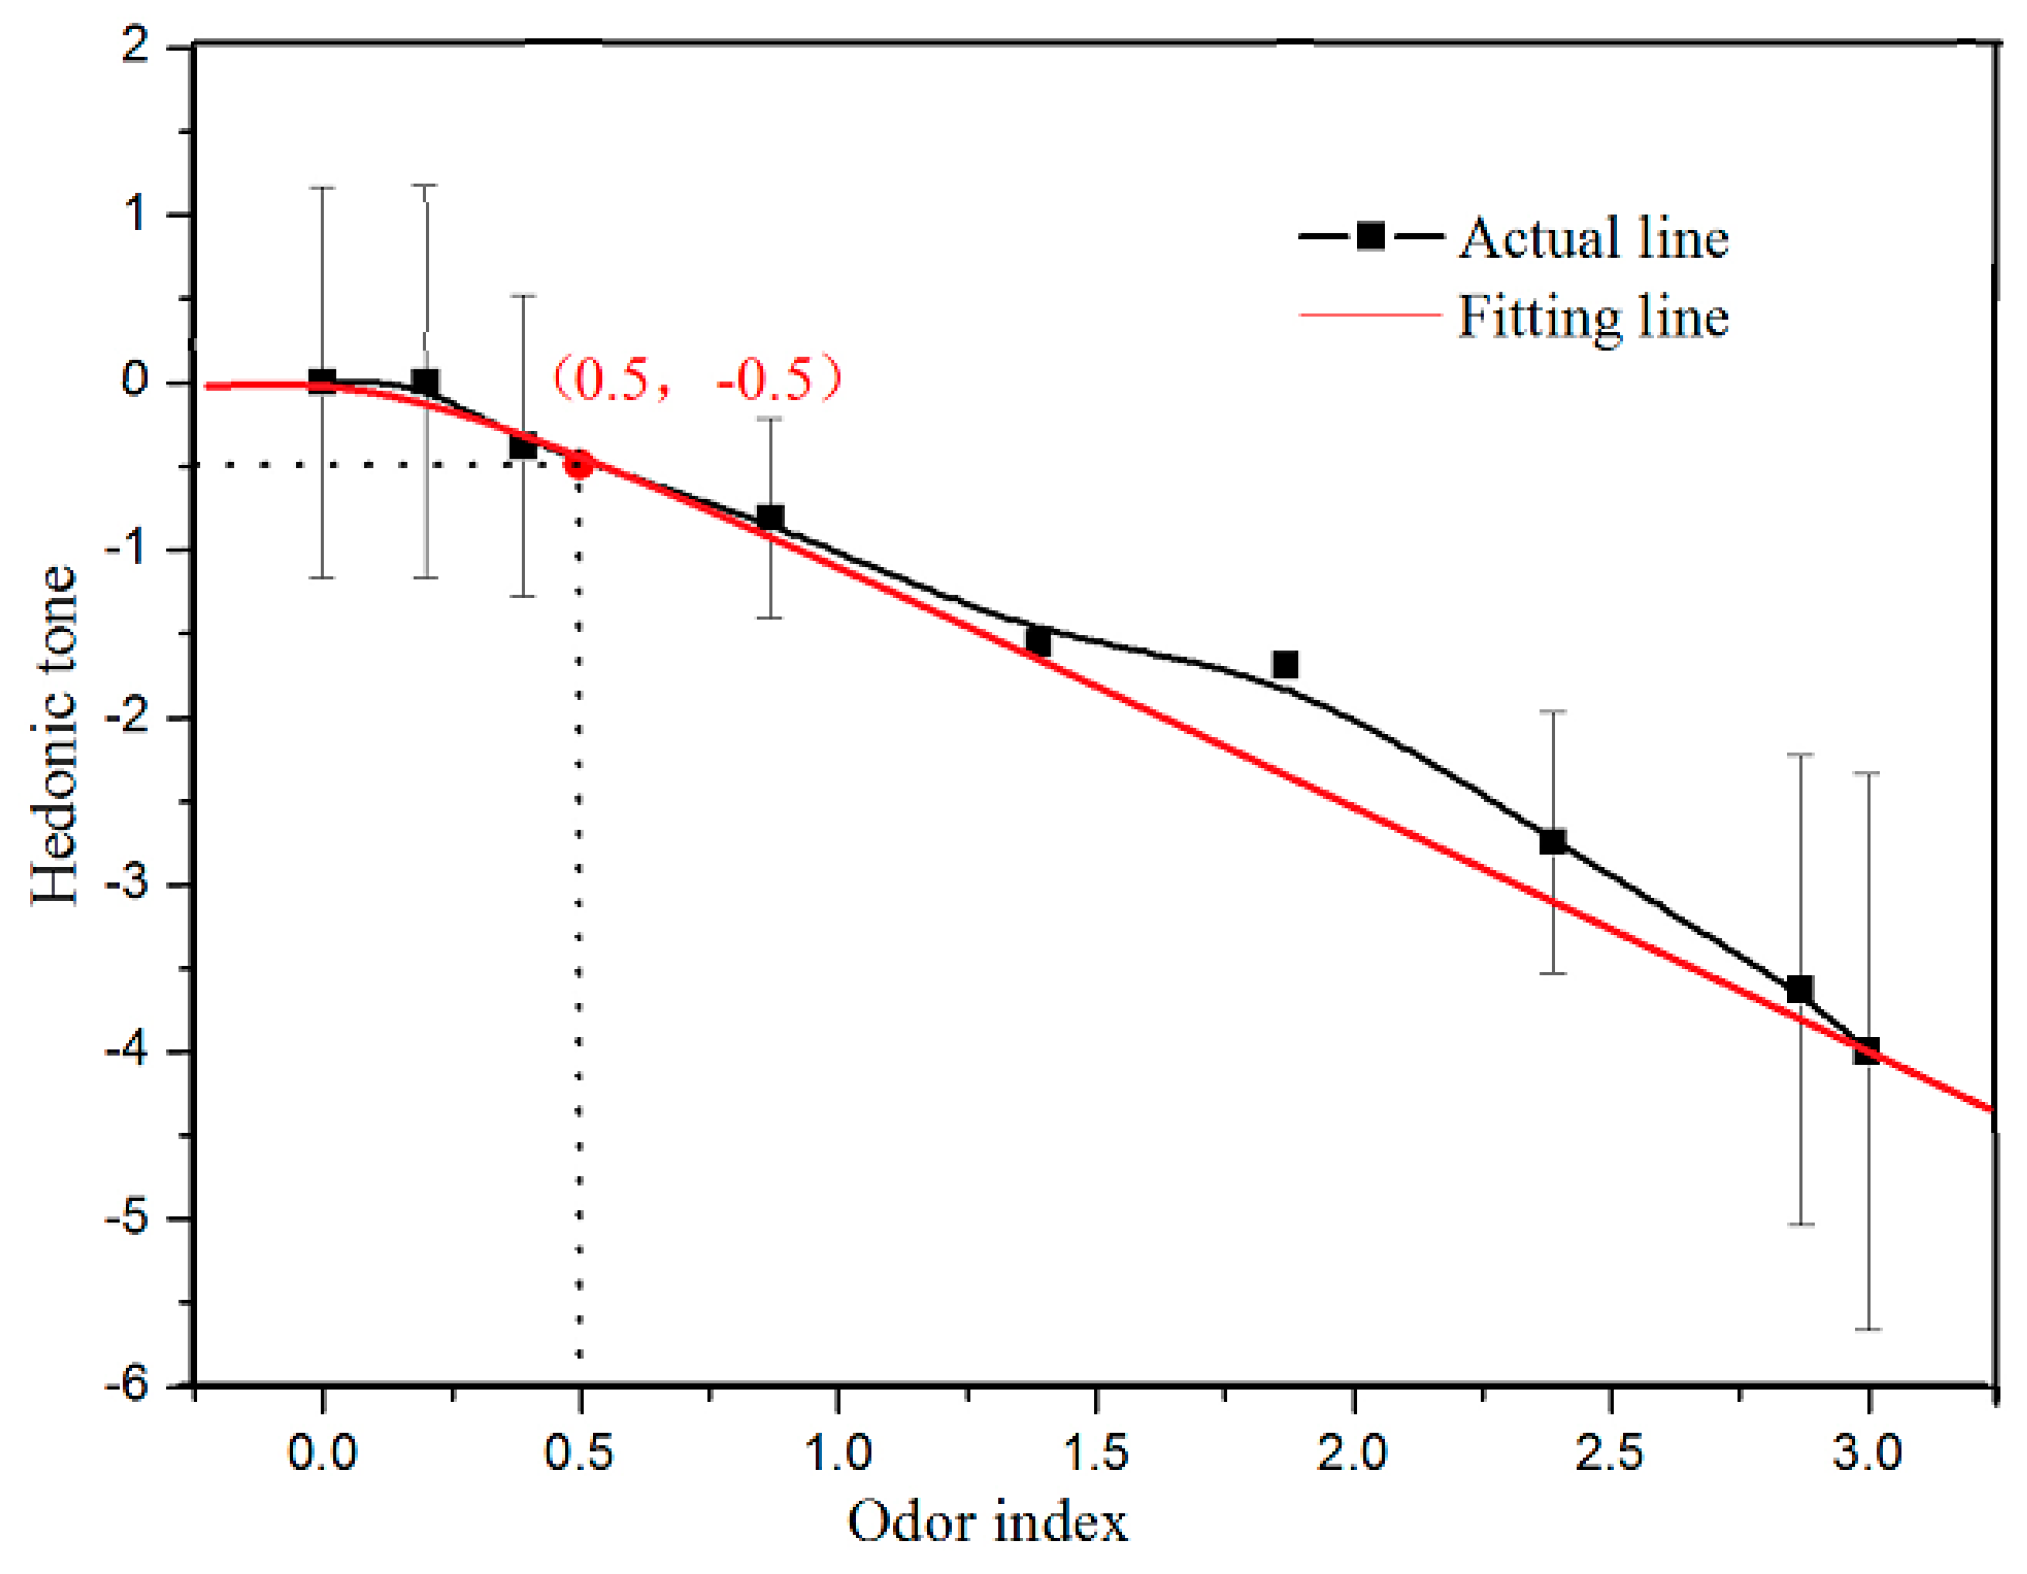
Figure 1 shows the relationship between the hedonic tone of dimethyl disulfide and the odor index. When the odor index < 0.5 (OC = 3 OU
E·m
−3), the average value of the hedonic tone is similar to 0, indicating that panel members feel neither pleasure nor displeasure. Therefore, the OC 3 OU
E·m
−3 can be used as the environmental impact reference value for dimethyl disulfide. Although the odor becomes more and more repulsive with the increase of the odor index, the relationship between them is not linear. There is a non-linear binomial relationship between the hedonic tone and the odor index; the correlation coefficient is 0.97, and the fitting model is:
However, the hedonic tone is not only related to the OC but also to various complex factors, such as the odor intensity, odor properties, and personal life experience [
28]. Therefore, the formula can only be used to reflect the incremental relationship between the OC and hedonic tone, but not for an accurate prediction of the hedonic tone.
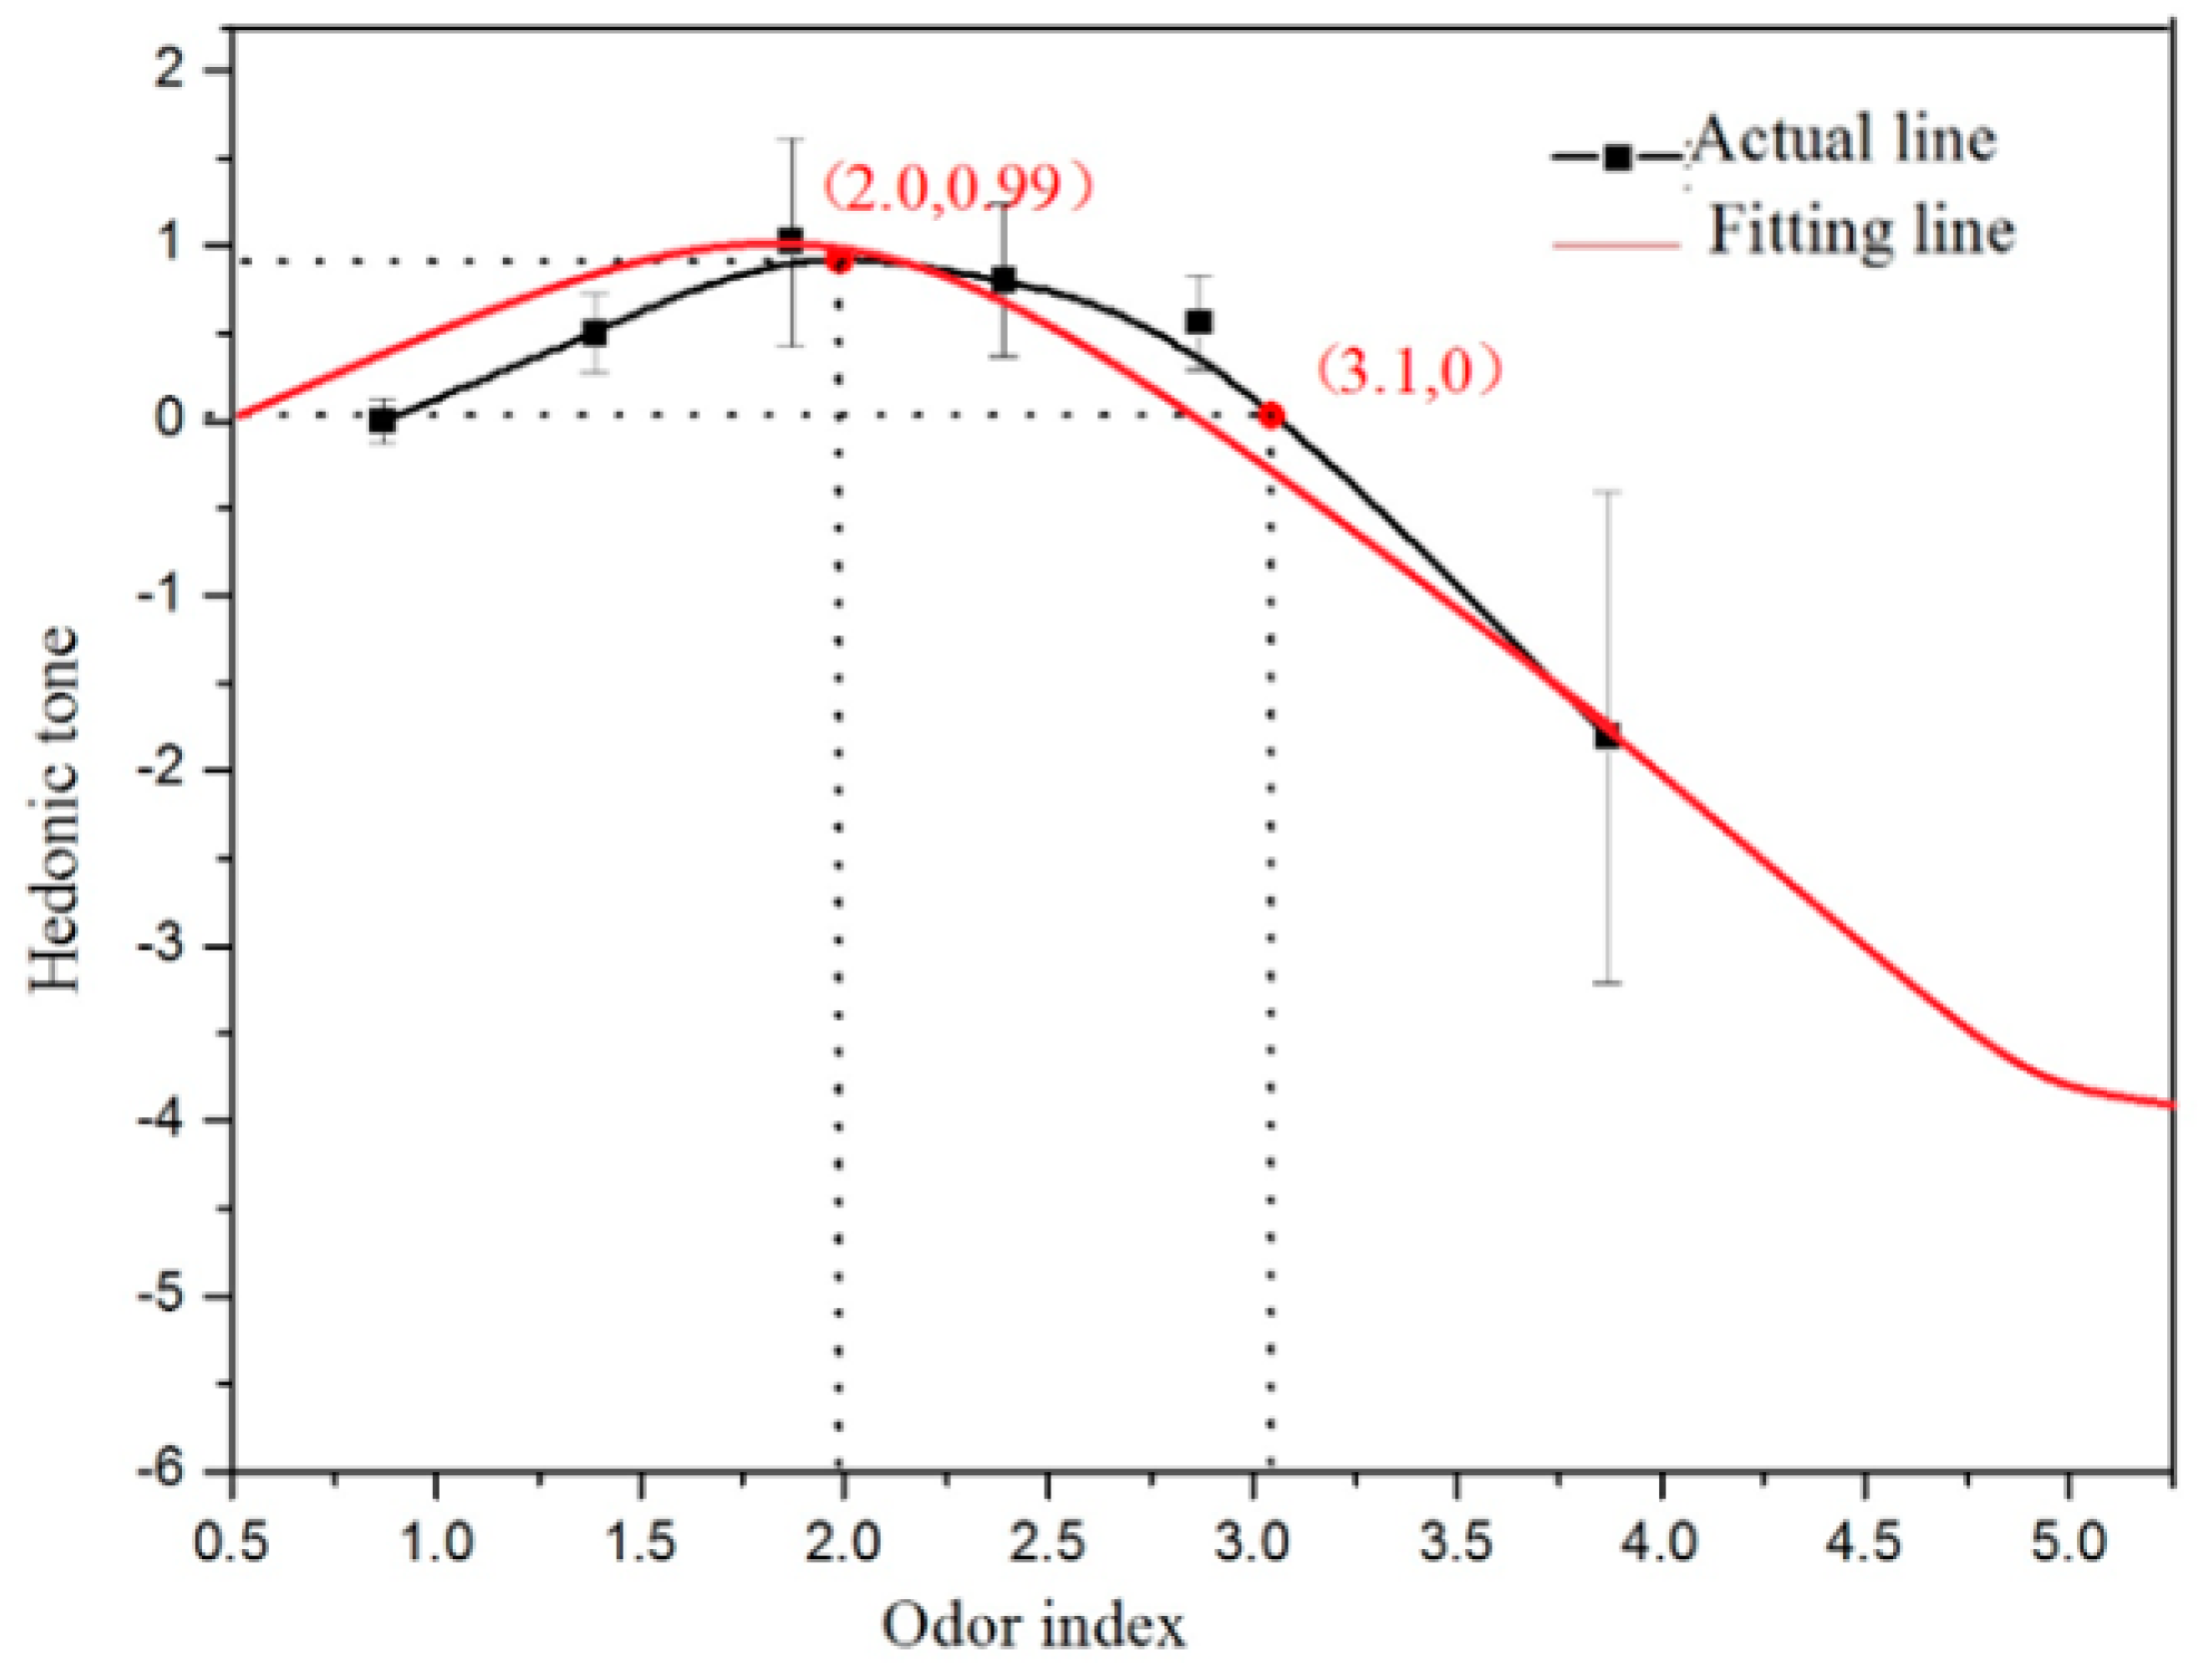
Figure 2 shows the relationship between the hedonic tone of limonene and the odor index. One can see the change process of the hedonic tone from pleasant to repulsive as the concentration increases. The panel members feel pleasure when the odor index is between 1.4 and 3.3 (OC = 25~1995 OU
E·m
−3). Additionally, the hedonic value reaches the maximum as the concentration index reaches 2.0 (OC = 100 OU
E·m
−3), after which point it starts to decline. If the odor index exceeds 3.3 (OC = 1995 OU
E·m
−3), the smell will change to unpleasant. 1995 OU
E·m
−3 can be used as a reference value for the environmental impact of limonene. The hedonic curve of limonene clearly shows that when the concentration of an odorant exceeds a certain value, its smell becomes repulsive, even if it smells pleasant at low or general concentration levels. Through data fitting, a binomial relationship between the hedonic tone and odor index is obtained with a correlation coefficient of 0.99, and the relationship model is:
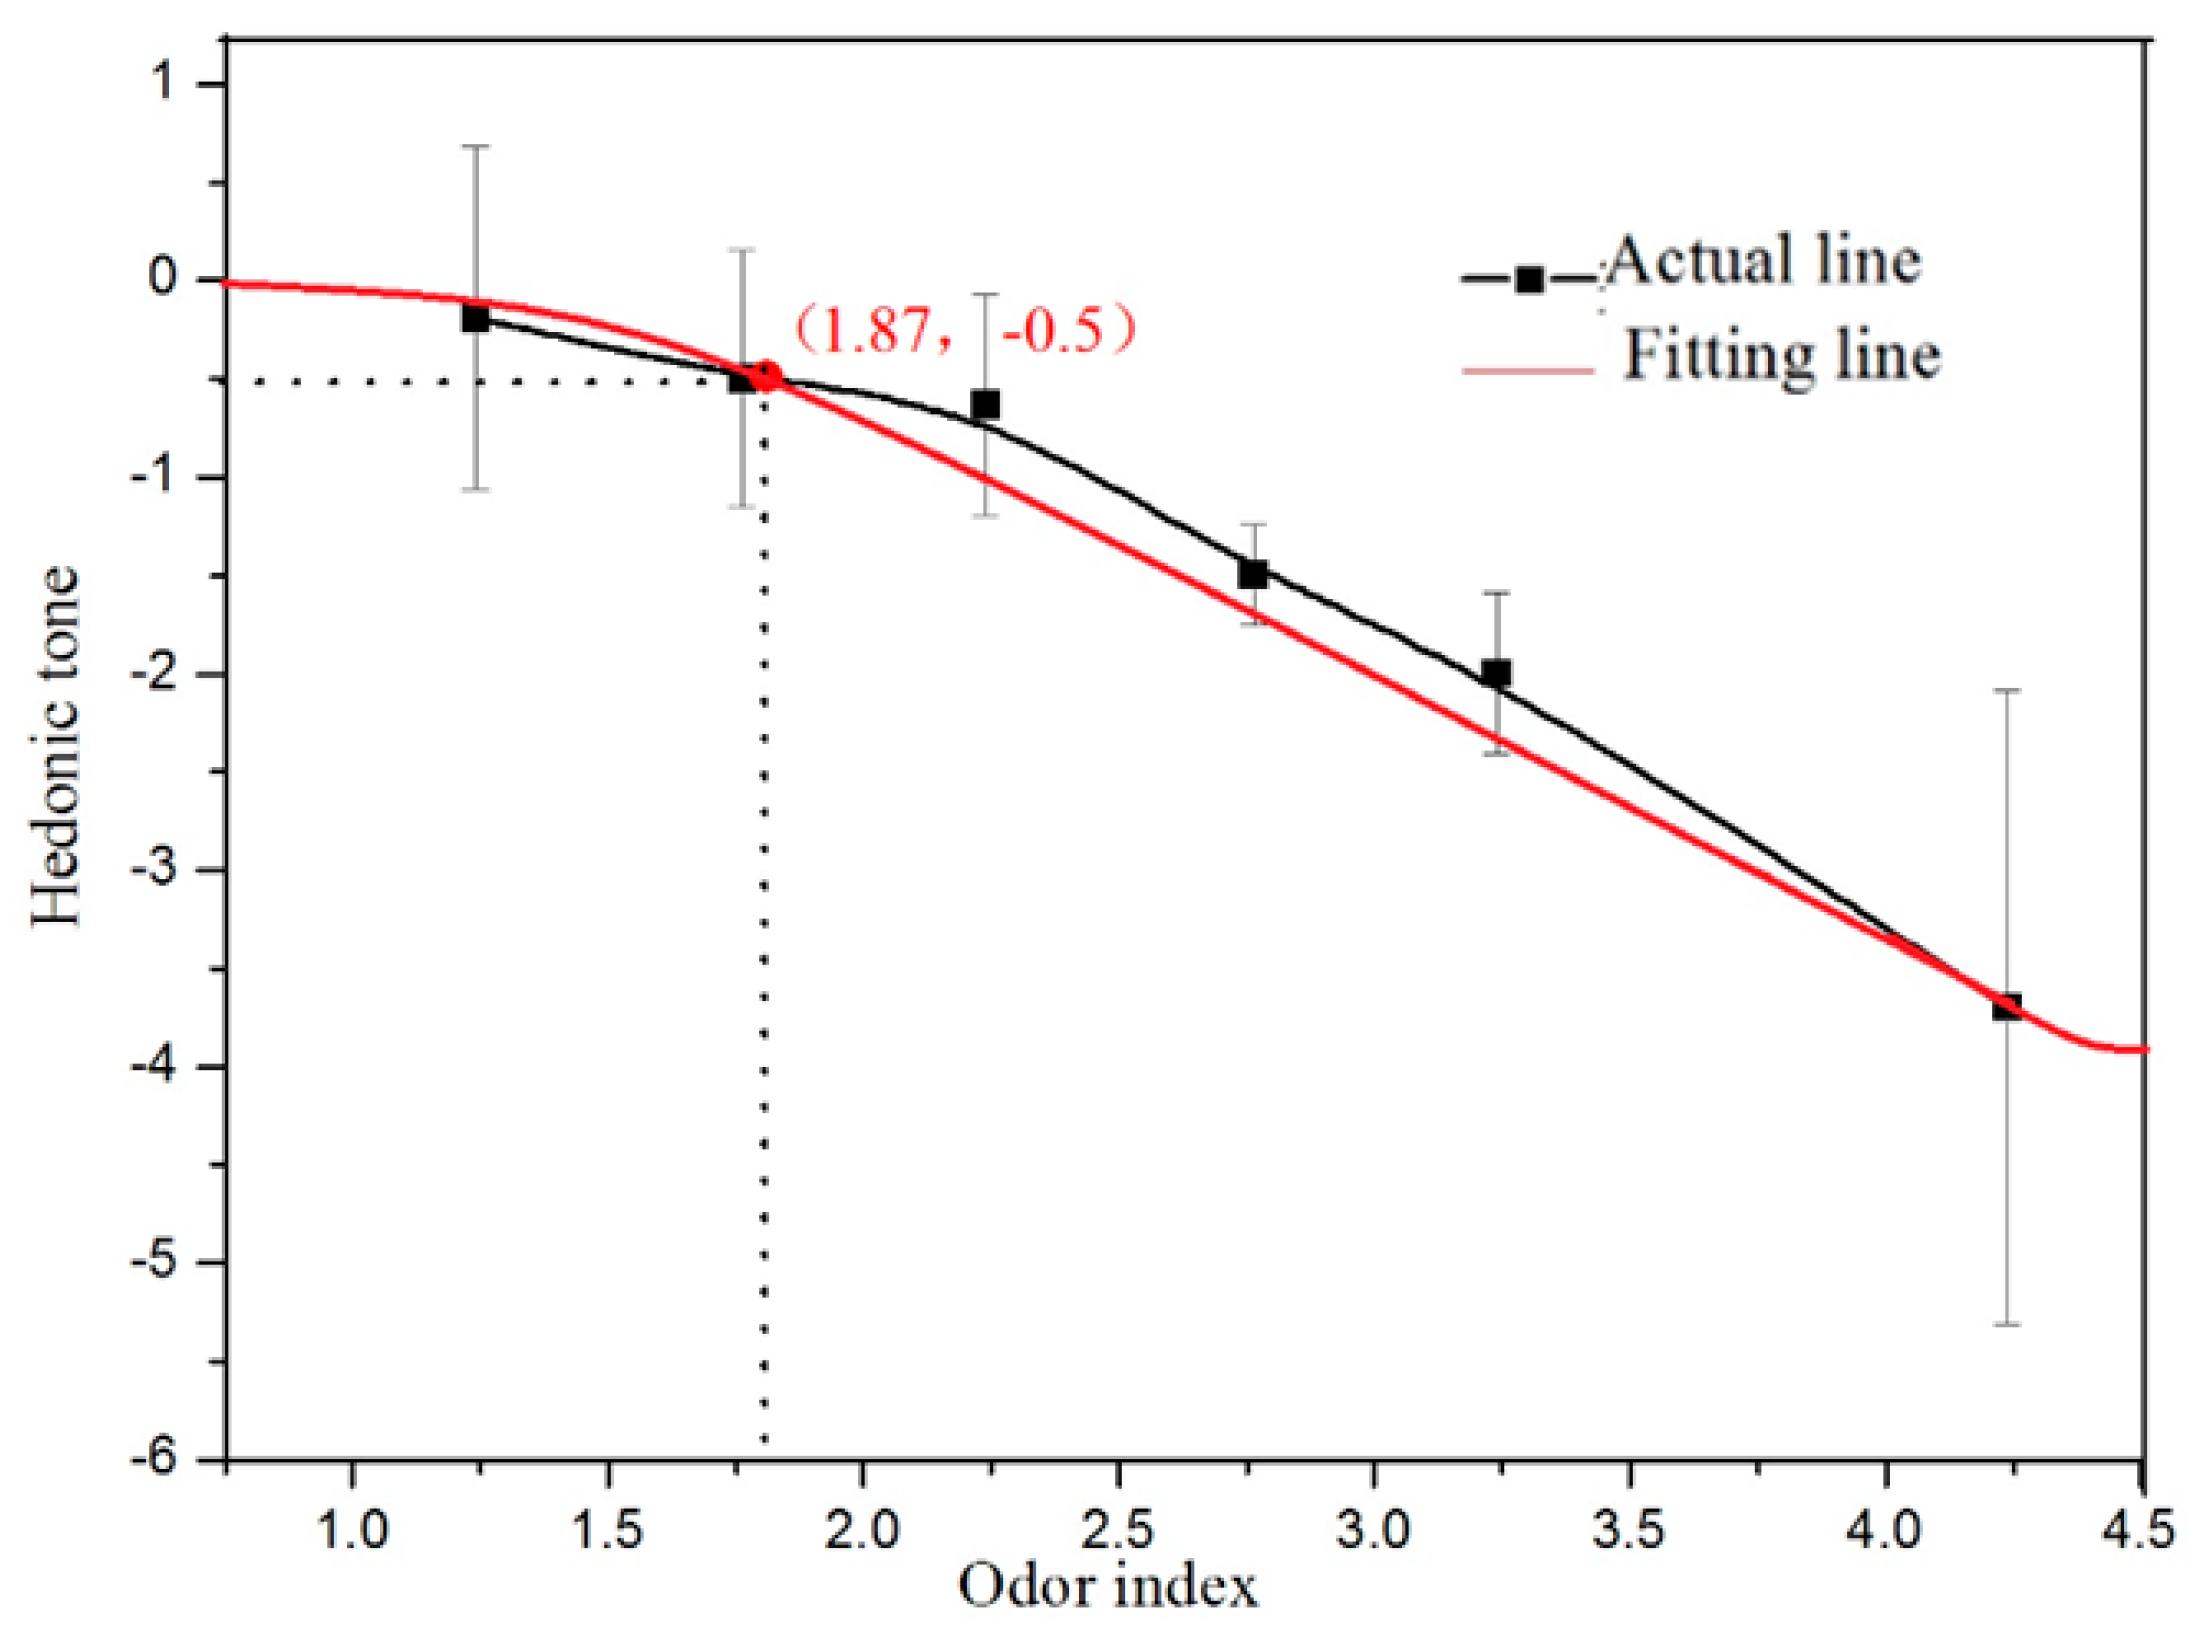
Figure 3 shows the behavior curve of butyl acetate. Similar to dimethyl disulfide, the hedonic tones of butyl acetate are all negative values in the testing concentration range, and the degree of unpleasantness is enhanced with the increase of the odor index. When the odor index < 1.87 (OC = 74 OU
E·m
−3), the hedonic tone is approximately 0, and the smell of butyl acetate is neutral, which will not make people get annoyed. Thus, 74 OU
E·m
−3 can be used as the environmental impact reference value for butyl acetate. There was a binomial relationship between the hedonic tone and the odor index, and the correlation coefficient was 0.99. The relationship model is:
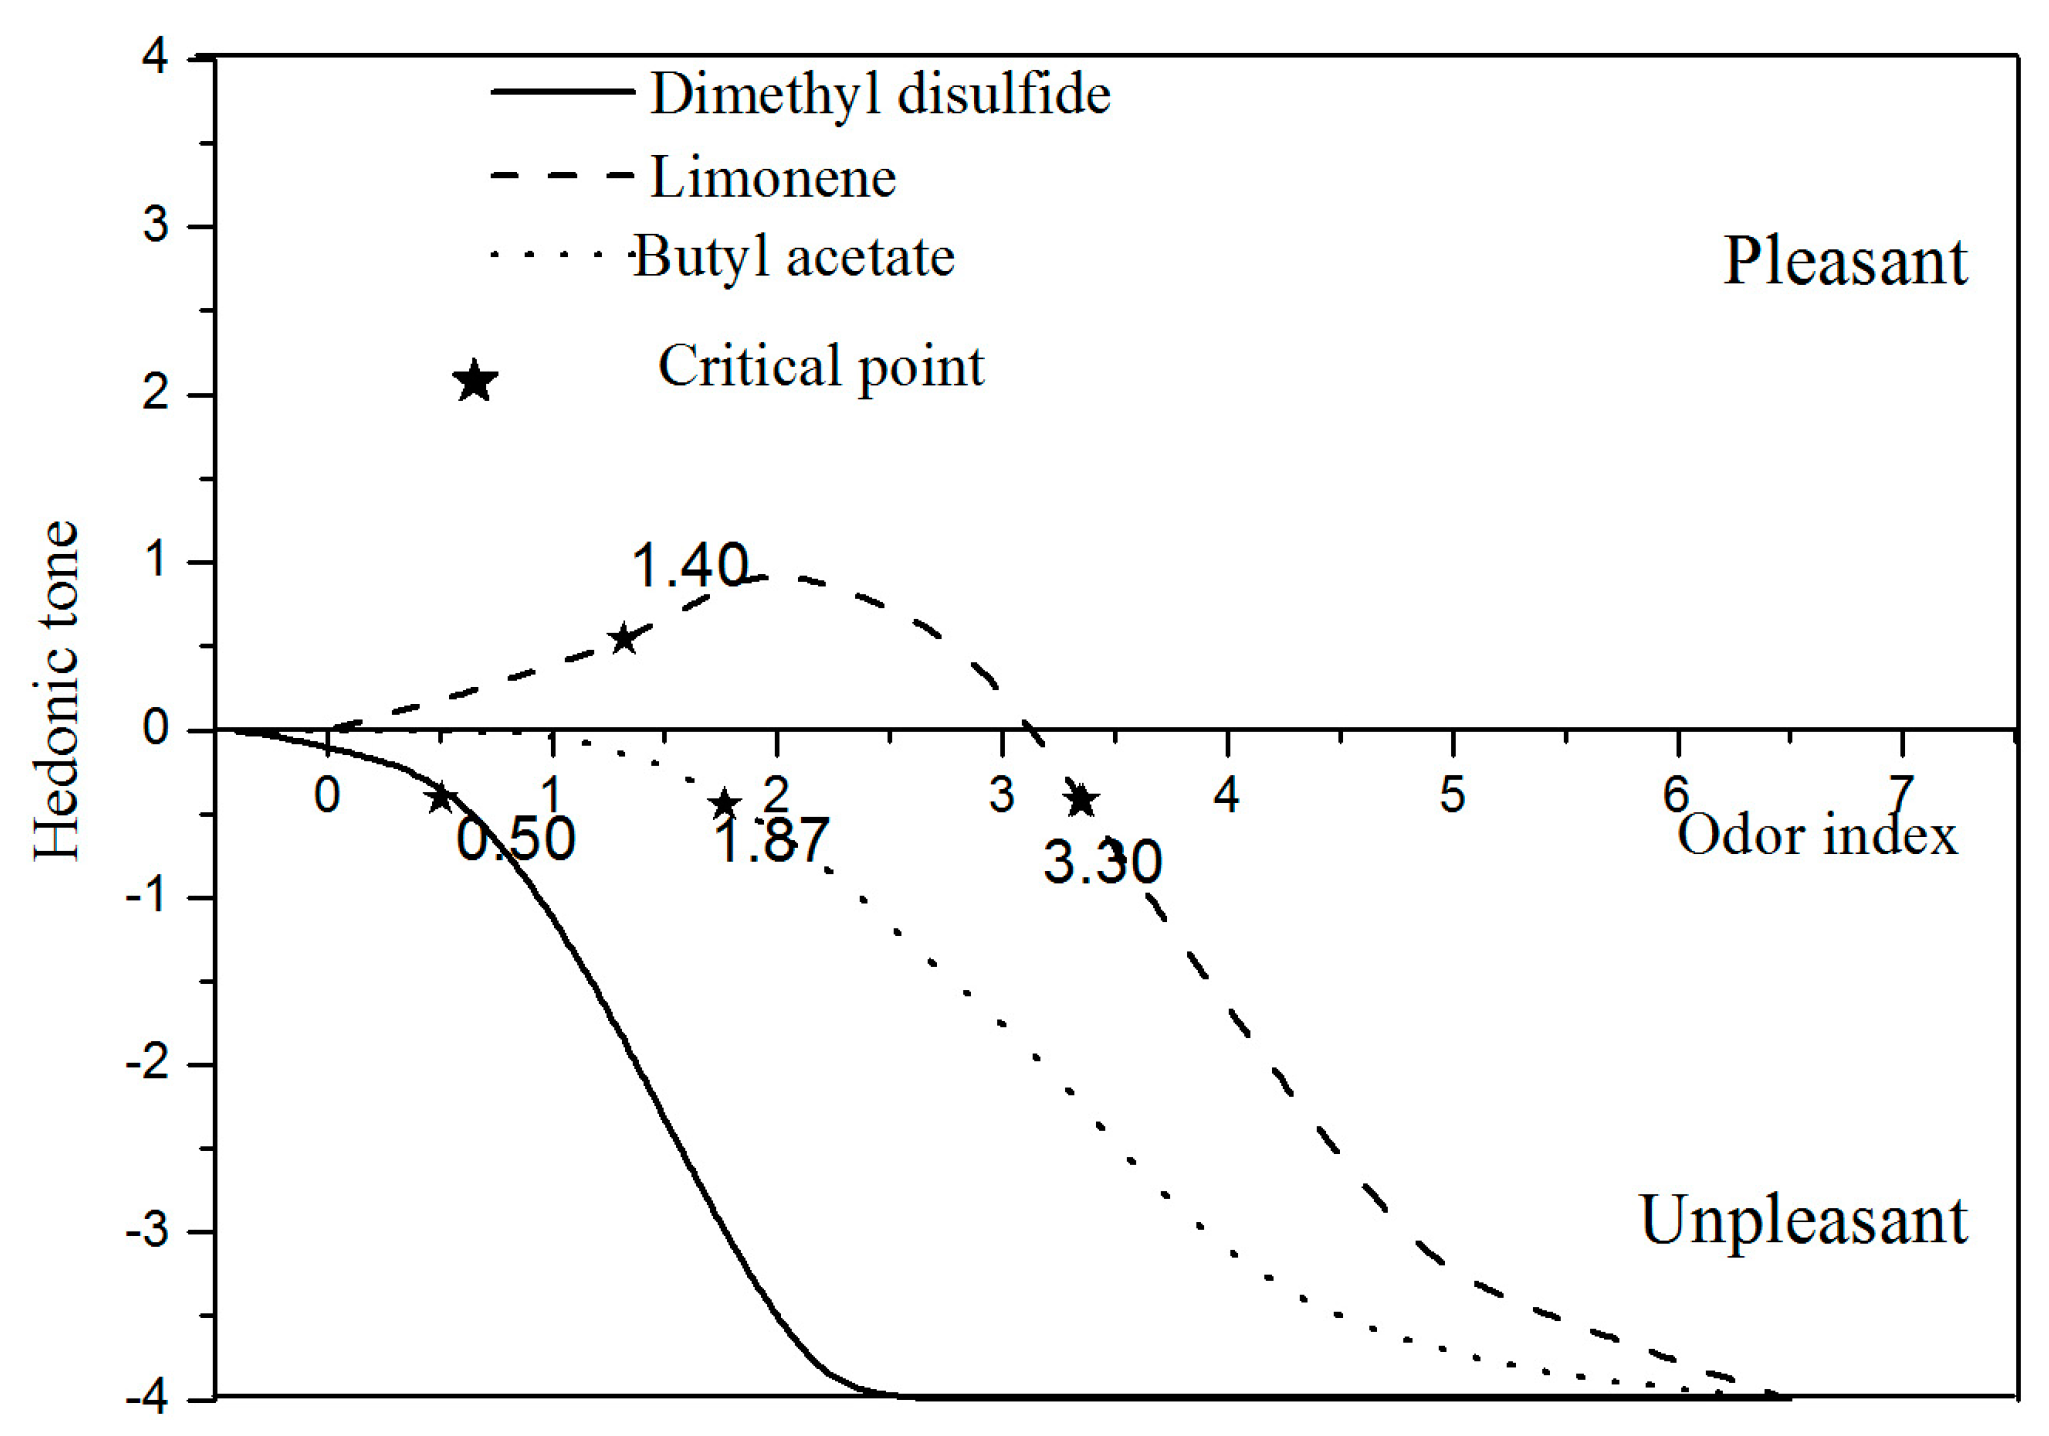
4.2. Comparison of the Hedonic Curves of the Three Odorants
The hedonic curves of dimethyl disulfide, limonene and butyl acetate are plotted in a graph (see
Figure 4), which clearly shows the characteristics and differences. The curves of dimethyl disulfide and butyl acetate all fell in the “unpleasant” region, but the degree of unpleasantness of dimethyl disulfide was higher than that of butyl acetate for the same odor index. For example, when the odor index is 2 (OC = 100 OU
E·m
−3), the hedonic tone of butyl acetate is −0.6, while the value of dimethyl disulfide is −2.0. The change rate of the hedonic tone with the odor index is different for the three substances, in the order of dimethyl disulfide > butyl acetate > limonene. The smell of dimethyl disulfide has a greater impact on the population.
The perceived smell is pleasant when the hedonic tone exceed +0.5, while it is unpleasant when the value is less than −0.5. The OC for the hedonic tones of +0.5 and −0.5 is defined as the critical point at which the smell of an odorant will change to pleasant or unpleasant. For dimethyl disulfide and butyl acetate, the unpleasant critical point is 3 OUE·m−3 and 74 OUE·m−3. What is different with them is that limonene has two critical points: 25 OUE·m−3 is the pleasant point and 1995 OUE·m−3 is the unpleasant point. The facts show that the OC above the unpleasant critical points will more likely cause an environment interference, which may cause adverse effects on humans, like annoyance, nuisance and complaint.
The emission standard of odor pollution in China is mainly in relation to the OC. However, odor is a sensory pollution, with a strong subjectivity, and different odorants may have different critical points for causing unpleasant feelings. The practices at home and abroad have confirmed that the OC limits, without considering the hedonic tone, may be excessive and inadequate. It is therefore important for environmental management to develop different odorants’ unpleasant critical points to improve the existing standards. The hedonic curves provide a scientific basis for the determination of the limit.
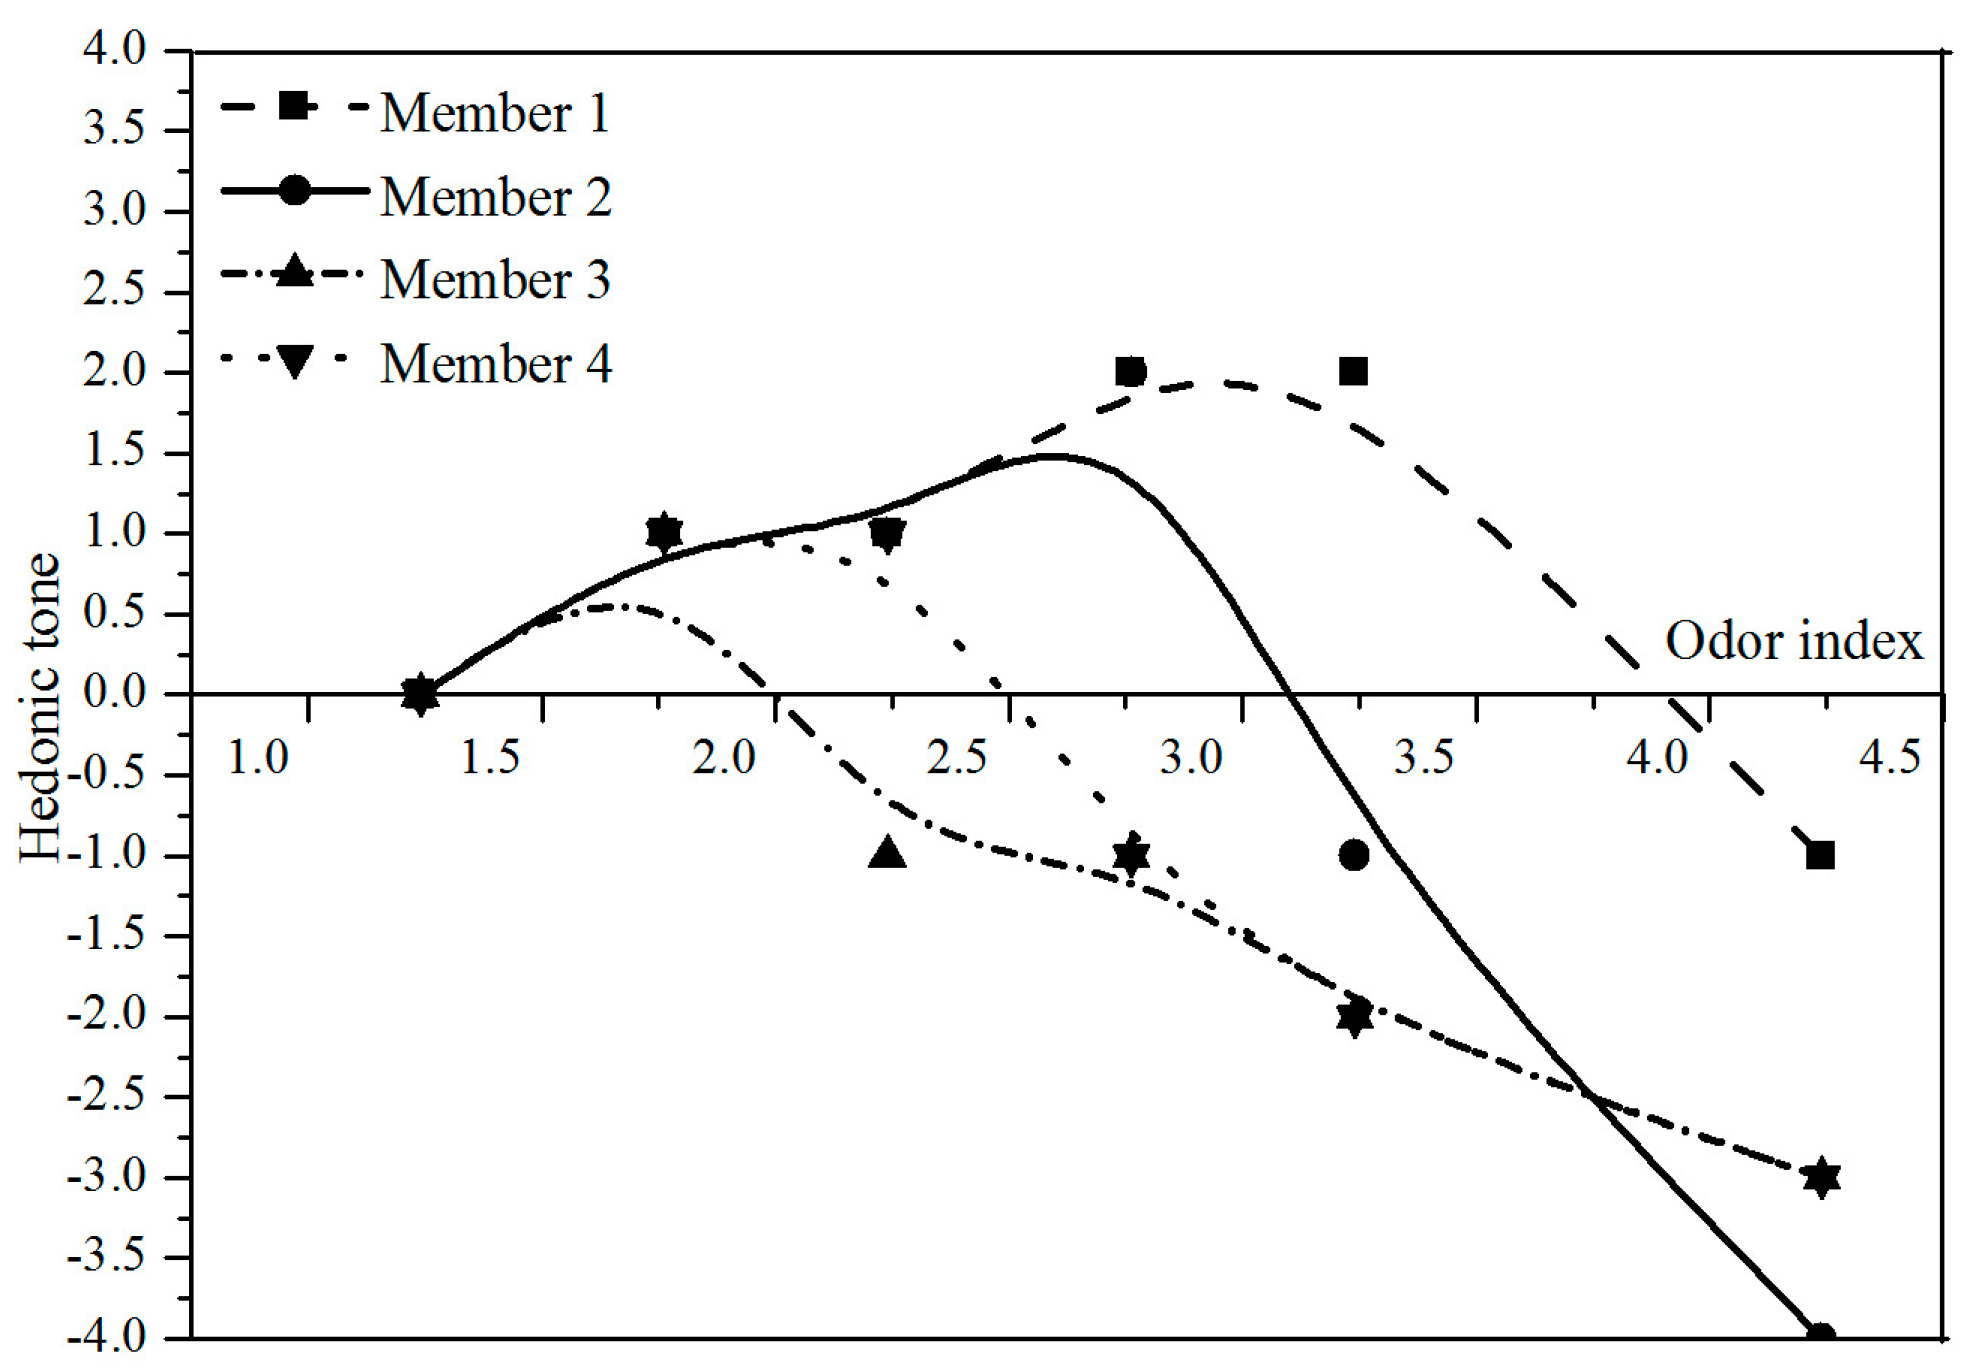
4.3. The Panelist Response Curves
The hedonic curve is plotted according to the average value of the whole panel, and it can reflect the characteristics of the overall change. The personal response curve can be drawn through the result of each panelist. The data showed that the panelist response curves of butyl acetate are in the “unpleasant” region but that there is a significant difference between the individuals. 4 members’ individual results for butyl acetate are shown in
Figure 5. One can see a process from pleasant to unpleasant as the OC increases. Furthermore, the maximum and the turning point of the hedonic tone are different for different members.
There are many reasons for individual differences, i.e., age, gender, living environment, and so on.
Table 5 shows the unpleasant critical points of different ages and genders. For dimethyl disulfide, the panelists with different human factors have similar results of 3 OU
E·m
−3. This is because the odor threshold of dimethyl disulfide is very low, and people feel unpleasant once receiving it. For limonene and butyl acetate, the unpleasant critical points for females are lower than those for males. This suggests that females can be aware of odors in the environment when concentrations are low. In a number of studies regarding odor detection, women have performed better than men [
29], and it has therefore also been suggested that women might complain more about unpleasant odors in the environment than men [
30].
Furthermore, the age of the panelists can influence the results. In this research, the unpleasant critical points of the panelists aged 22 to 35 are generally lower than those aged 35 to 45. This is because young people’s noses are more sensitive than those of the elder. At the same odor concentration, the persons with sensitive noses are likely to find more unpleasantness than those with insensitive noses.
In addition to the factors of age and gender, some extra characteristics may also influence the results, like the living habit, place of residence (countryside or village), profession, and so on. This is the reason why the determination of the hedonic tone should consist of at least 15 persons.
5. Conclusions
The characteristics of the hedonic tone vary for different odor types. Dimethyl disulfide is an unpleasant odorant, and the degree of disgust gradually increases with the OC. Limonene belongs to the category of pleasantness for a certain OC, and it will change to disgust if the OC is beyond that range. Butyl acetate is unpleasant in general, but there divergences exist among individuals. The mathematical equations developed using the multivariate regression analysis show a quadratic nonlinear relationship between the hedonic tone and OC. The annoyance potential that was sorted according to the hedonic curves is: dimethyl disulfide > butyl acetate > limonene. In general, there is only one critical point for odorants with an unpleasant smell, while odorants with a pleasant smell usually present two critical points: a pleasant one and an unpleasant one.
However, the critical points are theoretical values obtained through the hedonic curves. Research has shown that age and gender factors may influence the results. In our future work, the results will be verified in practical application. Furthermore, studies about the hedonic characteristics of odor pollution sources, i.e., wastewater treatment plants, landfills, and livestock farms, will be carried out in the next step.


