Article

Possible Impacts of Snow Darkening Effects on the Hydrological Cycle over Western Eurasia and East Asia

1
Department of Atmospheric Science, Kongju National University, Gongju 32588, Korea
2
Earth System Science Interdisciplinary Center, University of Maryland, College Park, MD 20742, USA
3
Earth Sciences Division, NASA Goddard Space Flight Center, Greenbelt, MD 20771, USA
*
Author to whom correspondence should be addressed.
Atmosphere 2019, 10(9), 500; https://doi.org/10.3390/atmos10090500
Submission received: 29 July 2019 / Revised: 13 August 2019 / Accepted: 20 August 2019 / Published: 27 August 2019
(This article belongs to the Special Issue Analysis of Oceanic and Terrestrial Atmospheric Moisture Sources)

Abstract

:
In this paper, we investigated the possible impact of snow darkening effect (SDE) by light-absorbing aerosols on the regional changes of the hydrological cycle over Eurasia using the NASA GEOS-5 Model with aerosol tracers and a state-of-the-art snow darkening module, the Goddard SnoW Impurity Module (GOSWIM) for the land surface. Two sets of ten-member ensemble experiments for 10 years were carried out forced by prescribed sea surface temperature (2002–2011) with different atmospheric initial conditions, with and without SDE, respectively. Results show that SDE can exert a significant regional influence in partitioning the contributions of evaporative and advective processes on the hydrological cycle, during spring and summer season. Over western Eurasia, SDE-induced rainfall increase during early spring can be largely explained by the increased evaporation from snowmelt. Rainfall, however, decreases in early summer due to the reduced evaporation as well as moisture divergence and atmospheric subsidence associated with the development of an anomalous mid- to upper-tropospheric anticyclonic circulation. On the other hand, in the East Asian monsoon region, moisture advection from the adjacent ocean is a main contributor to rainfall increase in the melting season. A warmer land-surface caused by earlier snowmelt and subsequent drying further increases moisture transport and convergence significantly enhancing rainfall over the region. Our findings suggest that the SDE may play an important role in leading to hotter and drier summers over western Eurasia, through coupled land-atmosphere interaction, while enhancing East Asian summer monsoonal precipitation via enhanced land-ocean thermal contrast and moisture transport due to the SDE-induced warmer Eurasian continent.

1. Introduction

Light absorbing aerosols (LAAs, e.g., dust, Black Carbon, and Organic Carbon) can affect the energy budgets and hydrological cycle of the atmosphere and land in a variety of ways. As presented in previous studies, LAAs absorb and scatter solar radiation in the atmosphere, altering the climate system [1,2,3,4,5,6,7,8]. In addition, LAAs deposited on snow reduce snow albedo by snow darkening effect (hereafter SDE) and accelerate snowmelt during spring in mid-latitudes [9,10,11,12,13,14,15,16,17,18,19]. As well known, snow in Eurasia continent also plays an important role in regional and global climate system change. Snowfall and snow cover are closely linked to local changes in air temperature and atmospheric circulation [20,21]. The snowpack over Eurasia has an inverse relation with subsequent Asian summer monsoon precipitation. Heavy snowfall and widespread snow cover in the winter and spring will cool and delay the heating over Eurasia in summer due to the high albedo of snow and consumption of heat for snow melting. As a result, summer monsoon in Asia is weakening and the start of monsoon is delayed [16,22,23,24,25]. These effects are closely related to changes of surface energy and water budgets. Changes in snowmelt affect the infiltration and outflow processes, resulting in changes of soil moisture content [26].
Soil moisture can affect not only the local climate, but also other regions through land-atmosphere coupling and teleconnection. Changes in soil moisture induce variations in latent heat and the sensible heat fluxes, thereby changing the temperature near the surface. Studies have shown that positive soil moisture anomalies enhance evaporation, affecting heat and moisture exchange between near surface and atmosphere [27,28]. Thus, the feedback between land and atmosphere plays an important role not only in energy balance but also in the water balance of the hydrologic cycle [29,30,31]. Previous studies have demonstrated that this feedback affects regional climate change in various regions such as United States [32,33], Europe [34,35,36,37], and East Asia [38,39,40]. Several studies have analyzed land-atmosphere interactions using precipitation recycling ratio [41,42,43,44,45,46]. The water vapor of total precipitation consists of local evaporation and externally moisture transportation. The recycling ratio is defined as the fraction of precipitation over a specified area that originated as surface evapotranspiration from same area [47]. The water recycling ratio is different depending on regional and seasonal characteristics of the land surface. Notably, Dominguez and Kumar [26] and Li et al. [29] demonstrated that water recycling is a key component in total precipitation over arid regions which are far from ocean. Trenberth et al. [48] and Zhang et al. [49] suggested that precipitation recycling ratio is a good indicator to measure interactions between land surface and atmosphere.
This study aims to explore impacts of SDE by LAAs on hydrological cycle focused on possible connection between Western Eurasia (WE) and East Asia (EA), and to analyze the precipitation recycling compare features in two regions to understand precipitation change properties. In particular, the land-atmosphere system of the selected two regions responded very differently to SDE. One of the regions became drier and the other region got wetter [13]. For this reason, the local responses of hydrological cycle by SDE were analyzed by comparing changes in WE and EA region. Previous work have found atmospheric circulation pattern linking Europe to Asia during the boreal warm season [50,51]. However, the connection mechanism induced by SDE is still not well understood. Therefore, this study investigated the changes in atmospheric circulation patterns by SDE and the changes in hydrological cycle. This paper is organized as follows. Section 2 presents the data and methods used in this study. In Section 3.1, describes the forcing and responses by SDE. Section 3.2 and Section 3.3 provide description of precipitation and SDE-induced changes over western Eurasia and East Asian, respectively. The results of the land-atmosphere interactions are discussed in Section 3.4 with conclusions in Section 4.

2. Materials and Methods

We use the NASA Goddard Earth Observing System Model Version 5 (GEOS-5) [52] to carry out ensemble experiments to obtain the SDE impacts on the hydrological cycle over Eurasia, with prescribed sea surface temperatures (SSTs) and sea ice. The land surface model in this GCM is the catchment model [53,54]. The GEOS-5 uses the GOddard SnoW Impurity Module (GOSWIM) which includes radiative transfer calculations of snow albedo and tracks through the snow the mass distributions of deposited constituent aerosols of dust, BC, and OC [12,19]. The emission, transport and radiative processes of aerosols are provided by the Goddard Chemistry Aerosol Radiation and Transport (GOCART) module [55]. The version of GEOS-5 used in this study does not consider aerosol indirect effects [56].
In this study, two sets of 10-member ensemble experiments were carried out. All the experiments are integrated for 10 years (from 2002 to 2011). In these experiments, the horizontal resolution of GEOS-5 is set at 2° × 2.5° in latitude and longitude, with 72 vertical layers [13]. The process of land surface and snow interactions (GOSWIM) is turned on in the control experiment (SDE). The second set of experiments is identical to the SDE except for No-SDE (NSDE) by disabling of the GOSWIM radiative transfer calculations in snow. Both SDE and NSDE included atmospheric heating by LAAs. The bias and evaluation of the experiments were provided by Lau et al. [15] and Yasunari et al. [13]. The SDE is defined as the difference between two sets of ensemble experiments (SDE minus NSDE). The statistical significance of the results was evaluated using the Welch’s t-test. To quantify solar absorption by light-absorbing impurities, such as dust, BC, and OC, in snow, we used a total Snow Impurity Absorption Coefficient (total SIAC) as defined in Lau et al. [15]. The SIAC is the product of the impurity mass concentration and the mass absorption coefficients (MACs) in snow. The MAC values of each aerosol are based on the result of Yasunari et al. [12]. Total SIAC is expressed as the sum of the SIAC for each type of impurity.
We have applied the approach of Brubaker et al. [47] to compute a precipitation recycling ratio. Considering a domain traversed by a length scale L , average horizontal moisture flux F, average precipitation P , and average evapotranspiration E , the total precipitation P is the sum of an advective ( P a ) and a local evaporative ( P l ) components of water vapor, i.e.,
P =   P a +   P l
If F =   1 2 ( F in + F out ) , where F in is the flux of moisture into the region and F out is the out flux, then, the horizontal flux of advected moisture over the region is
Q a = F in P a L 2
and the horizontal flux of evaporated moisture is
Q l =   ( E P l ) L 2
Assuming that the atmosphere is well mixed, the ratio of precipitation from advection vs. evaporation is equal to the ratio of average advected to evaporated moisture in the air. Thus,
P a P l =   Q a Q l = F in P a L 2 ( E P l ) L 2
so that the fraction of precipitation due to evaporative origin can be written
β 1 P l P = EL EL + 2 F in
and the fraction of precipitation due to advective origin is
β 2 P a P = 2 F in EL + 2 F in
In this study, the above equations were used to analyze the regional precipitation changes. A more detailed description of the recycling model can be found in Brubaker et al. [47].

3. Results and Discussion

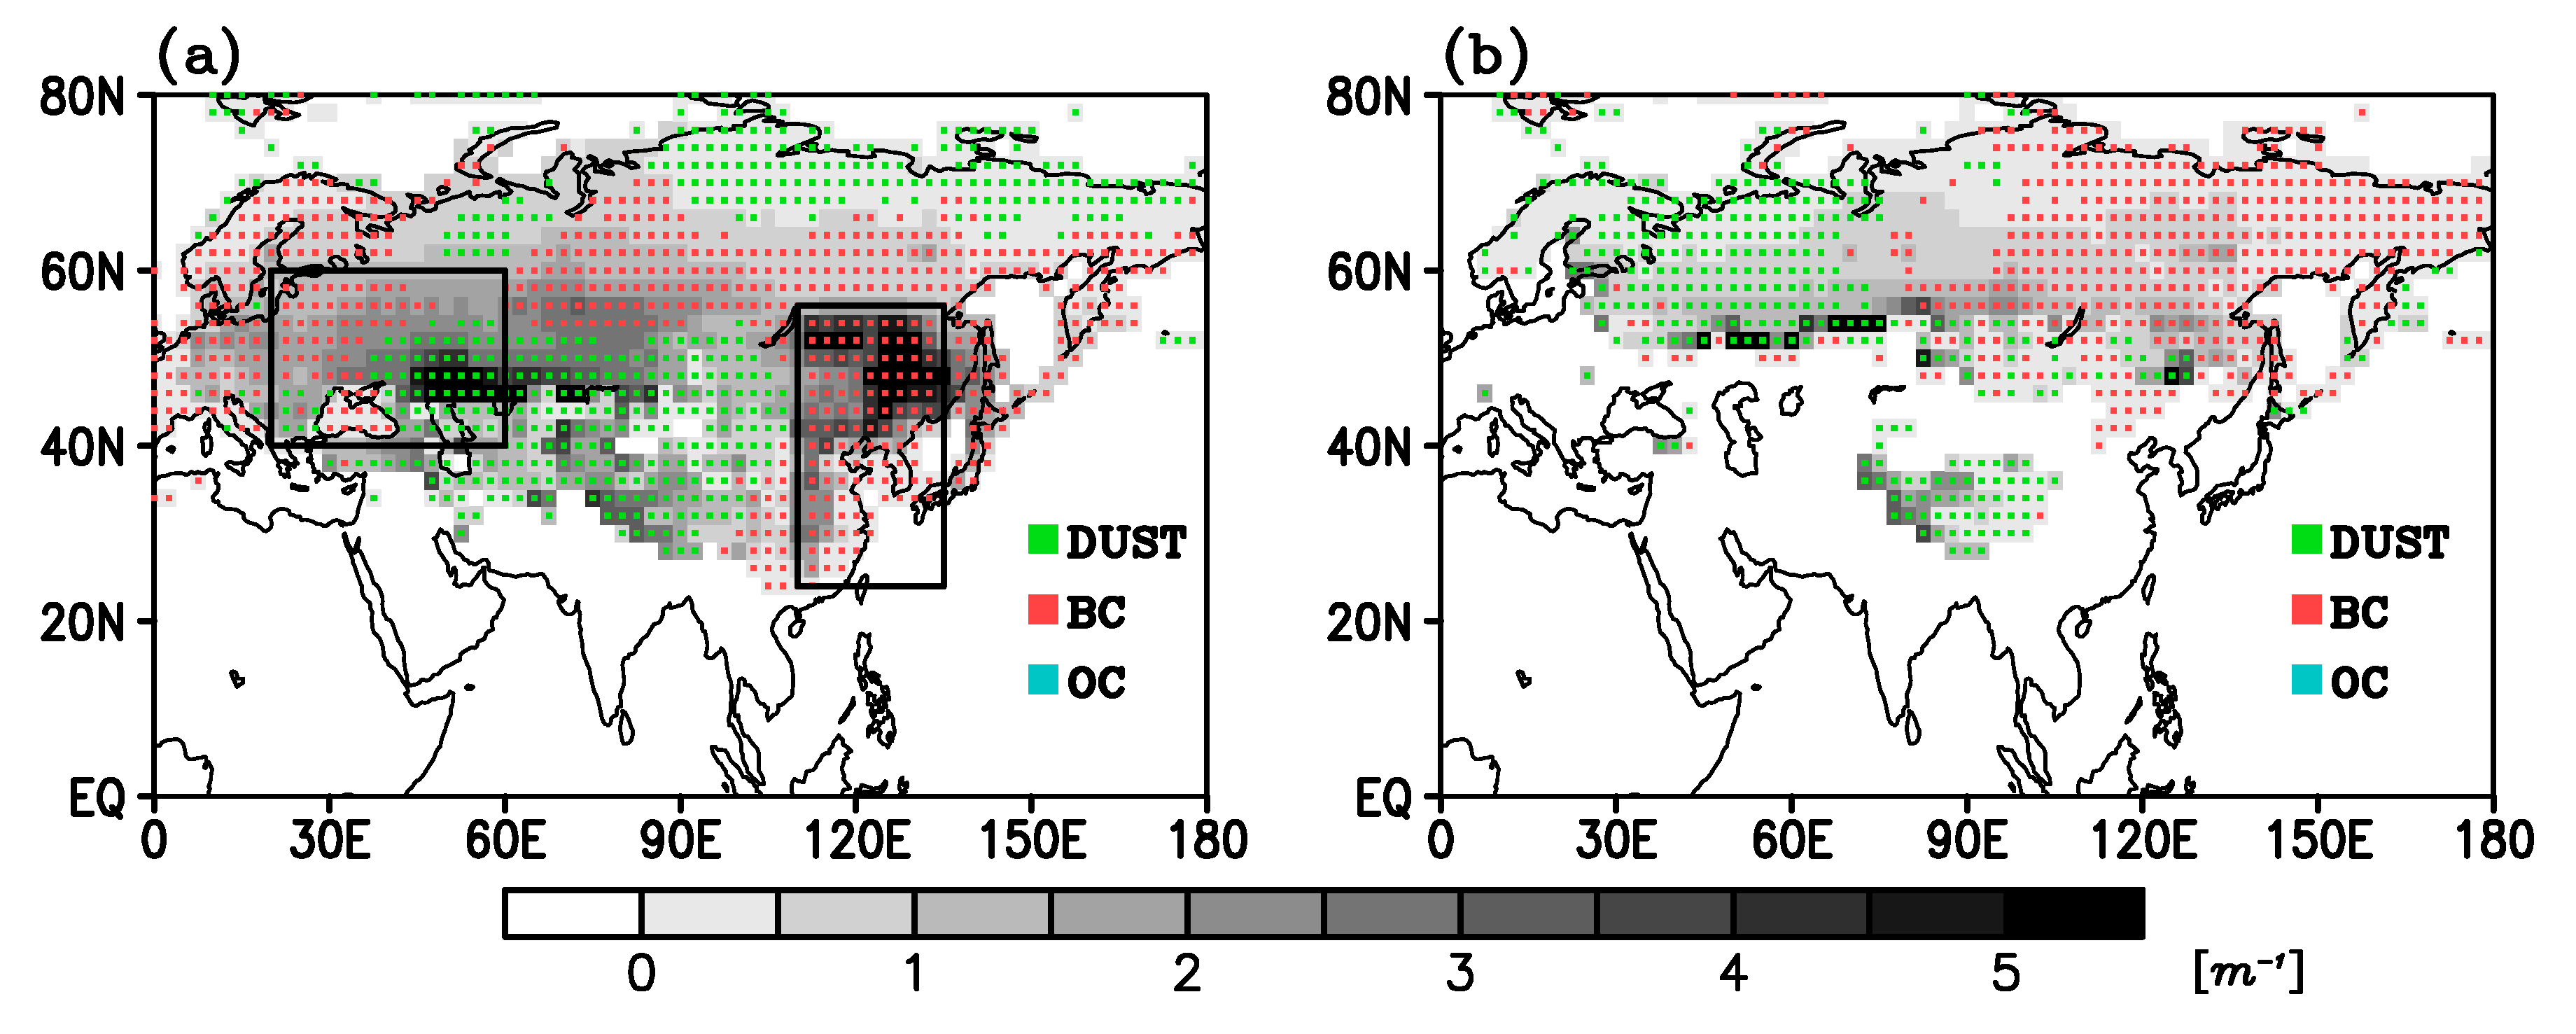
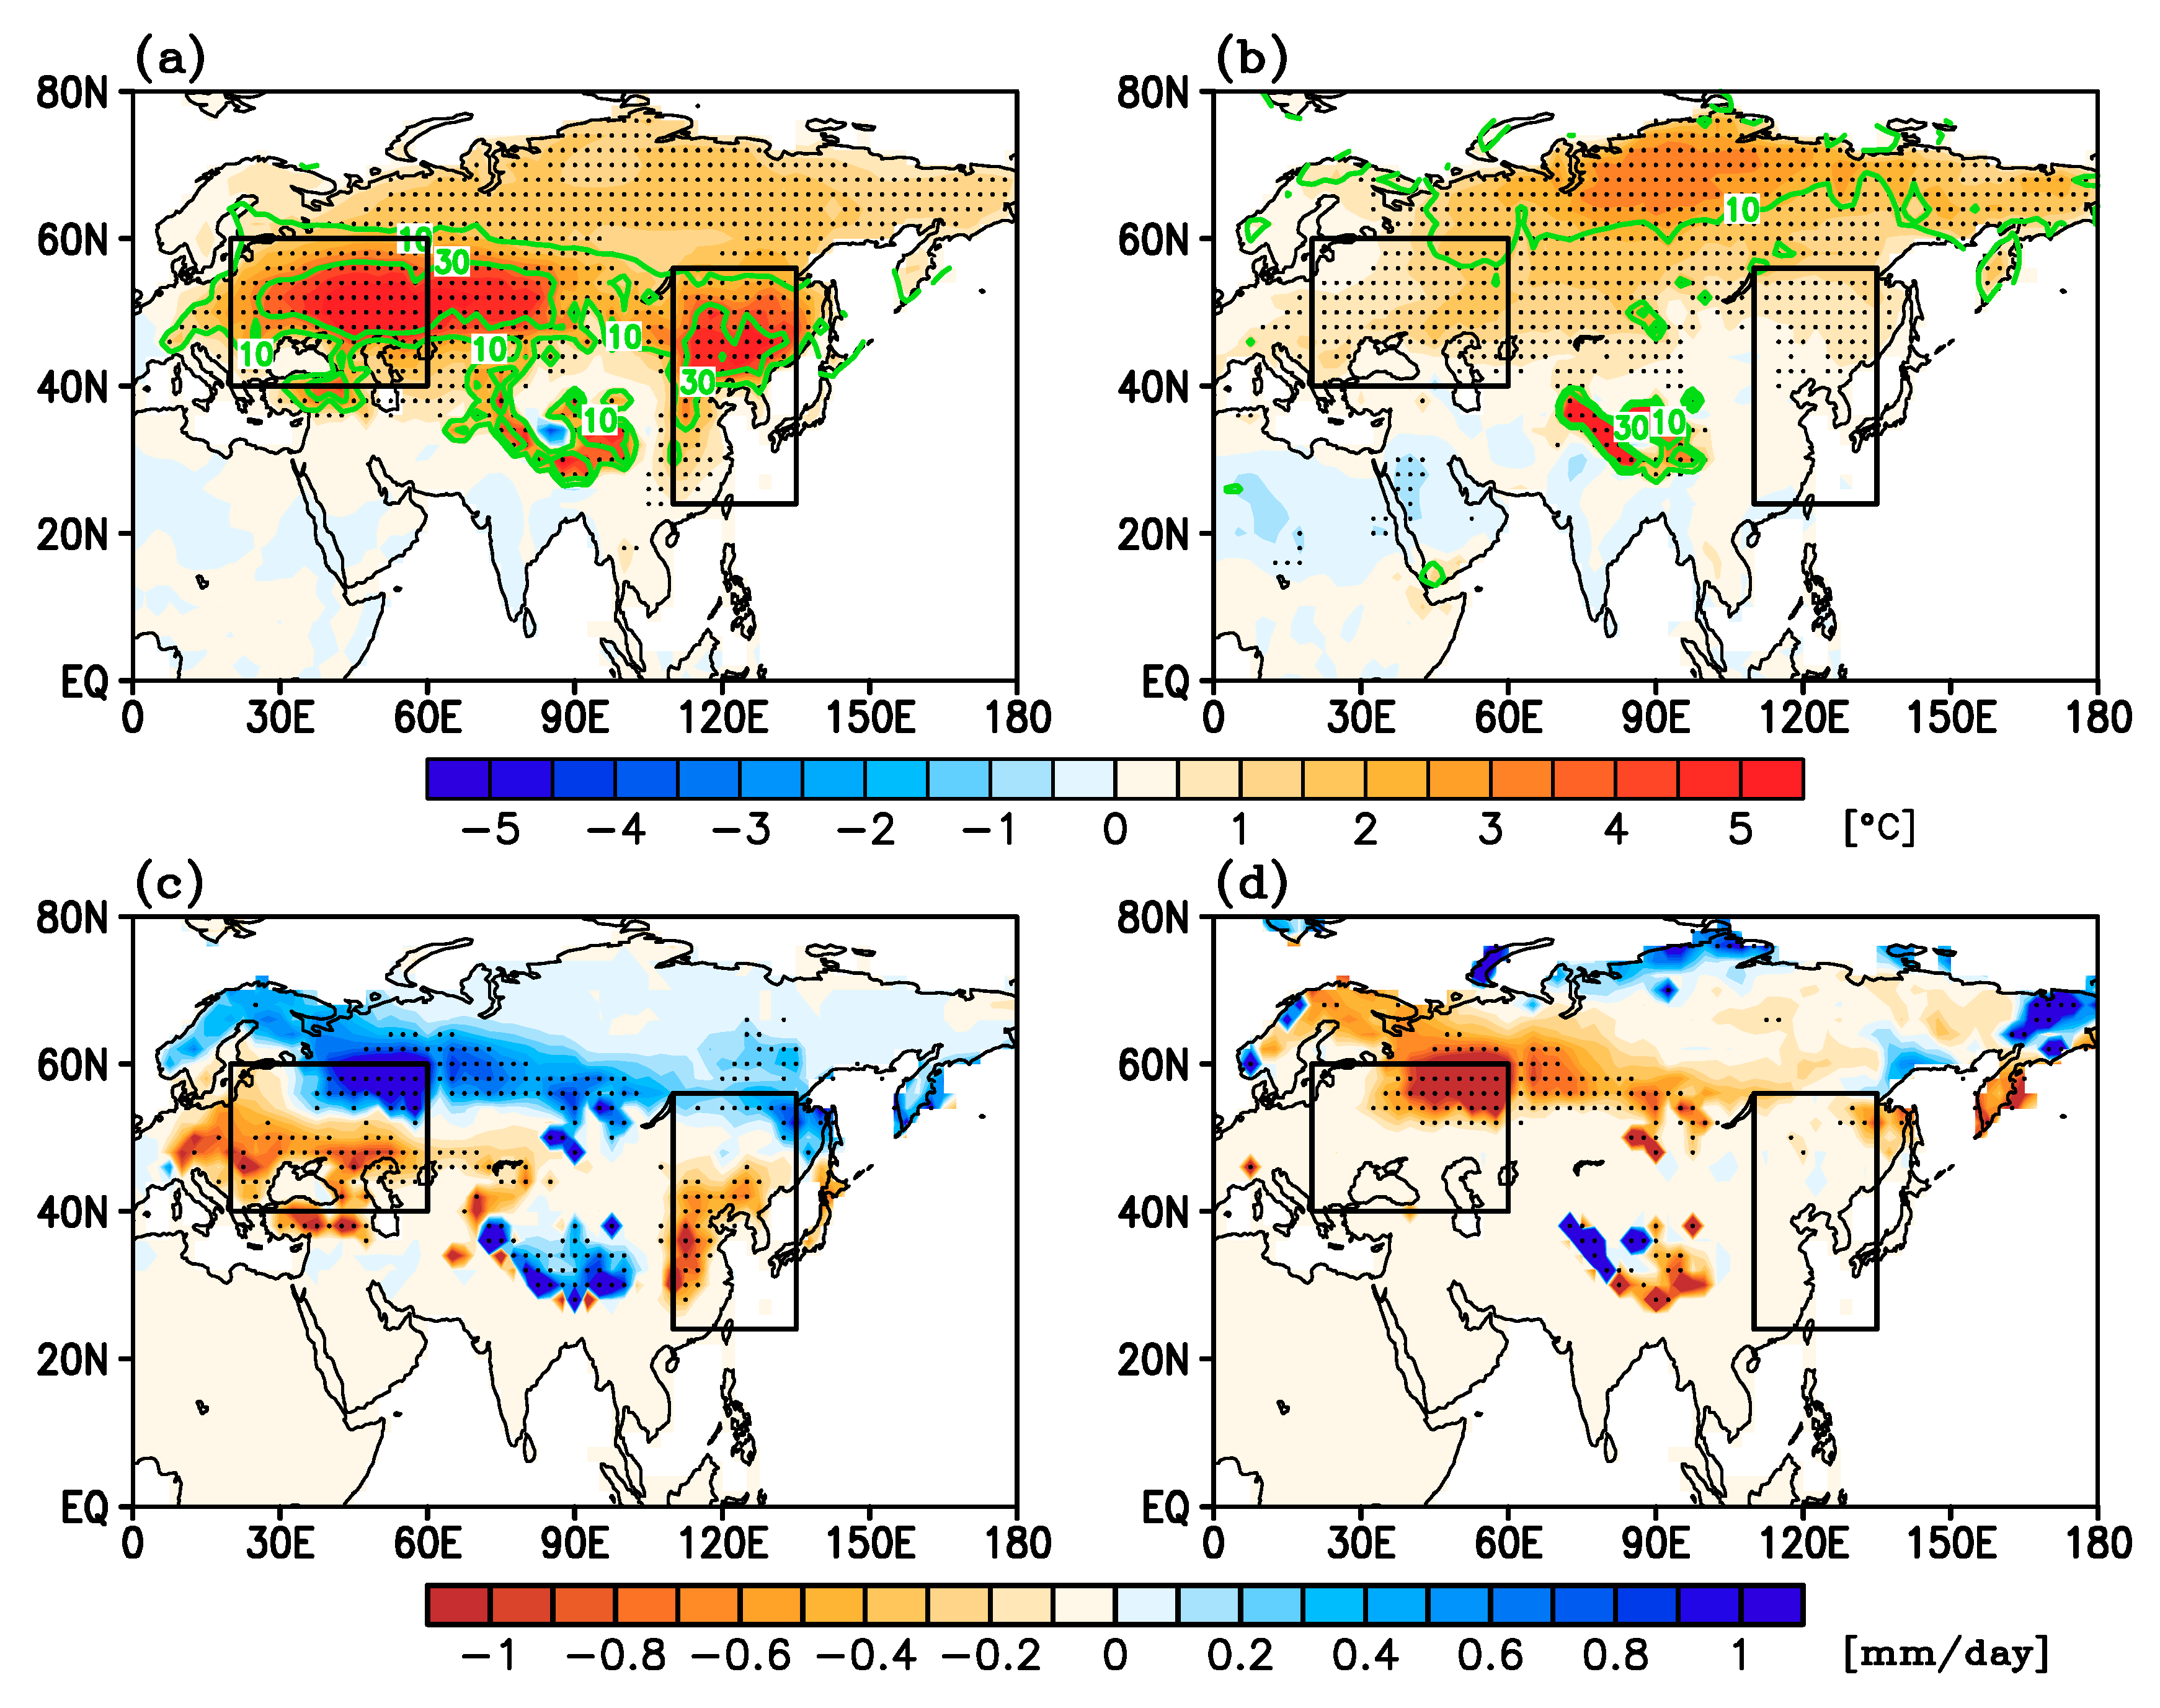
3.1. Forcing and Responses by SDE

The spatial distributions of total SIAC during April–May (AM) and June–July (JJ) are shown in Figure 1. The large values of AM mean total SIAC are found over the north of Caspian by mineral dusts from adjacent deserts. The strong signals of light-absorbing by BC deposited on the snow are over Western Europe and East Asia, near highly industrialized cities. On the other hand, in all regions, the contribution of OC to total SIAC is generally less than 20% [13,15]. As a result, of SDE, increased shortwave radiation over the snow induces rapid snowmelt and surface warming. The most distinctive warming is found over Western Eurasia, East Asia, and Tibetan plateau where the total SIAC is stronger than other place, which means that the SDE is important at these regions. The onset of snowmelt was earlier due to the increased in incoming energy on the surface by SDE. Changes in snowmelt are related to increase in short wave radiation and surface temperature. During April to May, snowmelt increases in the north region of maximum change of shortwave radiation and decreases in the south region resulting from earlier and rapid snowmelt in March (Figure 1a, Figure 2a,c). The spatial distribution of precipitation during April to May shows that the precipitation is increased by the SDE over most of Eurasian continent, except for around 40 °N. The precipitation anomaly is the largest over China inland and the rainfall increases in India, Japan, and the western part of Eurasia continent (e.g., Europe and Russia) are also significant. On the other hand, precipitation decreased in some areas, particularly in the Southeast Asia and the Korean Peninsula (Figure 3c). Increase in soil moisture is evident in regions of increased precipitation and snowmelt. However, spatial distribution of soil moisture is more complicated than that of precipitation and snowmelt because it relates to evaporation and runoff as well as precipitation and snowmelt variation (Figure 3e).
In JJ, the strong signal of total SIAC does not appear below 40 °N, except for the Himalayas-Tibetan plateau because snow line moves northward with season (Figure 1b). The strong response of shortwave radiation over the Himalayas-Tibetan plateau and polar region is directly linked to changes in the snow cover and surface albedo. The decreased snow cover by SDE leads to a reduced surface albedo, which cause land surface warming over that region, with the amplitude of greater than 3 °C. At the same time, the surface warming in the mid-latitude regions persists, but weaker than in AM (Figure 2b). The reductions in snowmelt were noticeable in western Russia and the eastern part of the Tibetan plateau. These regions coincide with the areas where snowmelt increased significantly during April and May (Figure 2d). The changes in daily precipitation by SDE show that there is a large difference depending on the region. As a result of increased moisture transport, precipitation is remarkably increased from the Bay of Bengal to East Asia, including China and Korea. On the other hand, the reduction in precipitation is prominent in Western Eurasia and west part of India subcontinent and Arabian Sea. Correspondingly, the soil moisture changes in eastern and western Eurasia have shown opposite sign (Figure 3d,f).
In particular, in Western Eurasia (WE, 20–60 °E, 40–60 °N) and East Asia (EA, 110–135°E, 24–56 °N), the increase in temperature and rainfall are noticeable during AM, but the change in precipitation is quite different during JJ. This is the reason we choose the two regions. The differences between the WE and EA will be discussed in more detail in Section 3.2 and Section 3.3.

3.2. Changes in Western Eurasia ( 40 ~ 60   ° N , 20 ~ 60   ° E )

To further examine the changes in precipitation over the WE, we analyzed the regional-average daily variation. The total precipitation increased gradually from April, with the maximum value 2.3 mm/day in July and then steadily decreasing until the early October (Figure 4a). As mentioned earlier, total precipitation is the sum of advective and evaporative precipitation. Based on this, we separated into the two types of precipitation by source and examined their contribution. The advective precipitation in this region is 1.2mm/day of annual mean, accounting for more than 76.8% of total amount however its seasonal variability is not large. In contrast, there is a distinct seasonality in the contribution of advective vs. evaporative precipitation types to the total precipitation. In winter, the contribution of evaporative precipitation ( β 1) to total amount is less than 10%, while it is increasing up to 40.6% in summer, suggesting that summer precipitation in WE is more sensitive to soil moisture than in wintertime, even though moisture transport is the dominant component for both winter and summer (Figure 4b). These results are consistent with the findings of Schär et al. [36] that European precipitation in summer is sensitive to the soil moisture using the regional climate model. Furthermore, in Bisselink and Dolman [57], the results of precipitation recycling ratio for central Europe presented using ERA-40 data are agreement with the results of this study.
The SDE-induced change in total precipitation increases from April to May but decreases during peak period (Figure 4a). Noteworthy is that 92.7% of the increase in precipitation is attributable to the Pl (Table 1) due to evaporative moisture change over the region, which corresponds well with the upward motion in the same period (Figure 4c). Notably, during April and May, the anomalous rising motions are found most pronounced in the troposphere. In addition, the surface warming due to SDE during AM can induce earlier and more snowmelt, and the snow-melted water lead to more soil wetting [15]. These changes provide favorable conditions for evaporation from surface to atmosphere. Hence the precipitation change due to SDE is closely related to the soil moisture change, which means that the interaction between land and atmosphere is important. The change in water content on a daily scale is described in Lau et al. [15] in more detail. During June and July, the reduction in precipitation is also found consistent with the enhanced descent movement (Figure 4c). At the same period, the low-level moisture flux at 850 hPa is divergence horizontally in associated with increased subsidence and the development of large-scale, mid- to upper-level anomalous anticyclonic circulation (see discussion in Section 3.4). Overall, for western Eurasia, the contributions of advection and evaporation to total precipitation changes are 47.2% and 52.8%, respectively (Table 1). The above results show that the reduction in precipitation is found to be similarly affected by two factors, evaporation and advection, in early summer.

3.3. Changes in East Asia ( 24 ~ 56   ° N , 110 ~ 135   ° E )

East Asia is well-known as a representative seasonal monsoon region. Over the East Asian domain annual mean precipitation is about 3.1mm/day, the lowest in winter and the highest in summer, with the summer precipitation accounting for more than 46.2% of annual total precipitation amount. The total precipitation increases rapidly following the onset of the summer monsoon, and peaks in June-July in this region due almost entirely to moisture advection. In other words, advective precipitation (Pa) is far more dominant than evaporative precipitation, with maximum contribution of 83.1% in May. On the other hand, recycled precipitation (P1) is minimal, from 0.36 mm/day to 1.6 mm/day. The ratio of P1 to total precipitation ( β 1, not shown) decreases from January to April. This ratio ( β 1) does not exceed 25% in June and July. In wintertime, the local evaporative precipitation is relatively more important than the other seasons (up to 40%). However, because of scarce wintertime precipitation, the absolute amount of precipitation from local evaporative process is small (Figure 5a,b).
During April and May, the change in precipitation is 0.274 mm/day, which is statistically significant within 1%. P1 and Pa contributed 20.4% and 79.6% to this change, respectively. During June and July, increase in precipitation is less than that of AM period, but the contribution of change in precipitation by moisture advection increases to 97.2% (Table 2). These results are due to increased large-scale thermal contrast associated with a warmer land over northern Eurasia and the Himalayas-Tibetan region caused by the SDE (cf., Figure 2b, and Lau and Kim 2018). SDE-induced vertical motion is strongest in April–June and lasts through July–August in conjunction with the increased rainfall (Figure 5c).

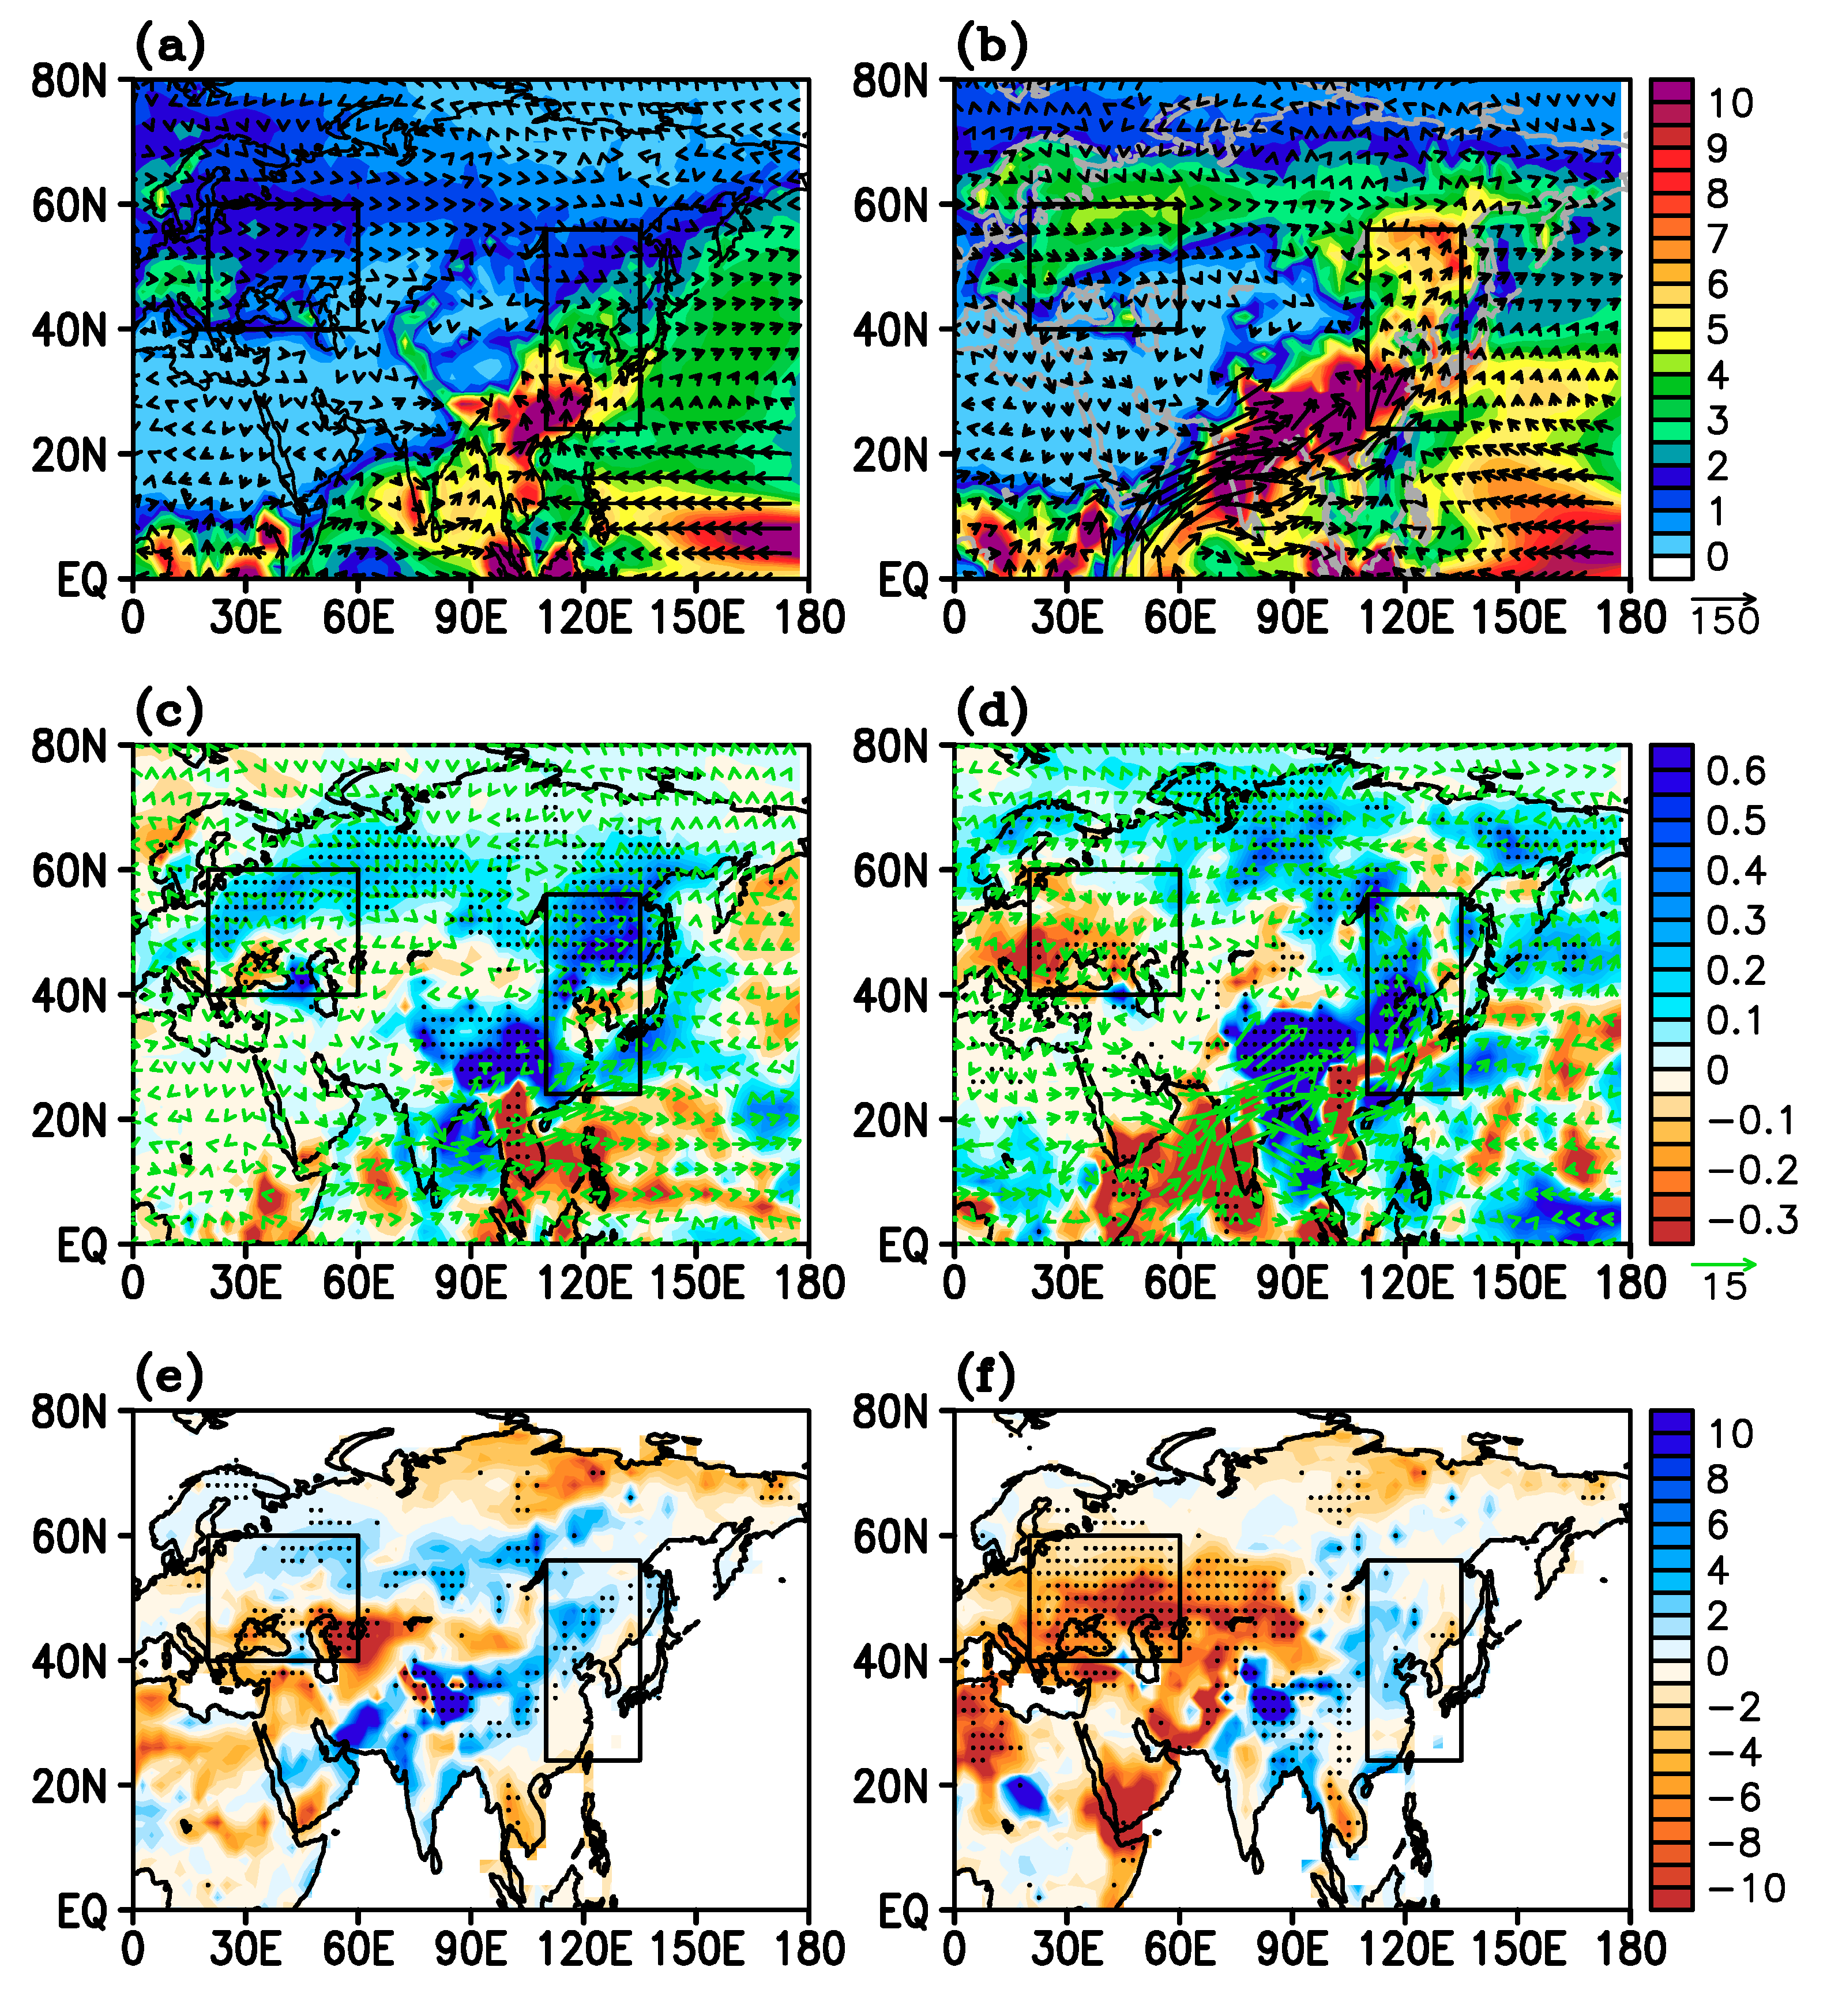
3.4. Changes in Atmospheric Circulations

In this section, we examine changes in atmospheric conditions during spring and summer, associated with changes in precipitation in the two regions by SDE. For WE region, during April and May, the land surface is warmed by increased incoming solar energy due to LAAs deposited on snow. The soil moisture is increased by accelerated snowmelt. In conjunction with air temperature, moisture is increased in the lower troposphere. These changes are in agreements with the increased in evaporative precipitation over the WE. Because, increases in energy and water at the surface, and atmospheric heating near the surface can lead to more evaporation. As mentioned in Section 3.2, the role of local recycled precipitation becomes important, from spring to summer, for total precipitation in WE. For this reason, increasing water content on the surface increases precipitation, but as the surface dries, precipitation decreases. As a result, precipitation from evaporation and locally recycled moisture is statistically significantly reduced after the surface has dried due to reduced snowmelt. This mechanism, Wet-First-Dry-Later (WFDL), was demonstrated by Lau et al. [10] as a key component of atmosphere-land-snow-aerosol interaction in the WE.
The atmospheric warming is accompanied by an anomalous anticyclone in the upper troposphere, centered over Middle East and southern Europe, with increased upper level easterlies over tropical African/Middle-East/Asian monsoon domain, and enhanced westerlies over WE (Figure 6a). The high-pressure anomalies are associated with large-scale downward motion, leading to reduced relative humidity and clouds in troposphere. The enhanced subsidence in the atmosphere not only warms the atmosphere adiabatically, but also dries the atmosphere by bringing drier air from above, reducing cloudiness, allowing more solar radiation absorption by the land surface (Figure 6). Therefore, atmospheric conditions in the low-level are changed favorable for increased evaporation, and drying and warming of the land surface, and the atmosphere. Consequentially, most of precipitation changes in WE during April and May are dominated by changes in locally recycled precipitation. These atmospheric conditions continue until the summer and are further strengthened with dry land surface.
On the other hand, over EA, precipitation continues to increase from early spring to summer. As a result, the Asian summer monsoon rainy season occurs earlier, and is strengthened due to SDE. The surface warming of continental scale by SDE can lead to an increase in land-sea contrast, resulting in increase of moisture transport from adjacent ocean to inland. As a result, increased moistening of the lower and mid-troposphere by anomalous low-level southerlies and south-westerlies and strengthened rising motions over the EA. The moisture flux associated with these circulation features have been argued as being essential for sustaining the large-scale monsoon [58]. In addition, warming of the Himalayas and Tibetan Plateau (HTP) can play an important role in changing precipitation over EA. During JJ, the strongest warming is located in the HTP. Unlike other areas of similar latitude, the SDE in these regions is still prominent due to impact of the high terrain effects [16]. The atmospheric warming also occurred in the middle and upper levels over the HTP region. The anomalous east-wind at upper level are showed from the Sea of Okhotsk to East Asia region. This result is related to the weakening of subtropical East Asian jet. Lau and Kim [16] showed that these changes are related to the formation of the Rossby wave train, which alternates between anti-cyclone and cyclone in northern Eurasia, with an enhanced anomalous Tibetan plateau anticyclone. Due to changes in temperature and jet stream induced by SDE, the precipitation zone is shifted northward and resulting in a significant increase in precipitation in East Asia and a decrease in precipitation in Indochina Peninsula and southern China.
Moreover, the aforementioned changes are accompanied by a downward motion in the western part of Eurasia (0–40 °E) and upward motion in the eastern part (70–140 °E), with the strongest motion over the HTP. Figure 6b shows SDE-induced changes in relative humidity and anomalous anti-clockwise circulation in the zonal and vertical directions. This result indicates that precipitation can be suppressed by drier land surface conditions and anomalous subsidence in the Western Eurasia region where local evaporative precipitation is important. Over EA, moisture flux transport is a principal factor for the change in precipitation. The result of strengthening in moisture flux transport and upward motion lead to more humid atmospheric conditions in the most of vertical layers. Consequently, the changes in precipitation caused by SDE is distinct, depending on regional characteristics, dry Western Eurasia become drier and wet East Asia become wetter, due to surface and atmospheric changes associated with SDE.

4. Conclusions

Based on the global climate model simulation using the NASA GEOS-5, we have examined the possible impact of snow darkening effect (SDE) by light-absorbing aerosols (LAAs) on the regional dependency of the hydrological cycle over Eurasia. In particular, this study analyzed the characteristics of precipitation and its changes in two regions (west of Eurasia and East Asia) during spring and summer. The recycling ratio was used to determine the characteristics of precipitation by region. This method was described in previous studies as a good indicator of the interaction between the surface and the atmosphere.
Over Western Eurasia, the local origin precipitation becomes increasingly important as the transition from spring to summer progresses, with the maximum ratio of 40.6%. This regional precipitation characteristic implies that the role of evaporation from the soil moisture to the precipitation is important, i.e., the interaction of the land and the atmosphere is closely related to changes in regional precipitation. In spring, snow contaminated by absorbing aerosols has lower surface albedo and thereby absorbs more SW radiation. As a result, the excessive energy over the surface induces surface warming and early snowmelt, increasing soil moisture. As mentioned earlier, increased soil moisture and warmer temperature during the period facilitate more evaporation, and more water vapor is supplied from the surface to the atmosphere, resulting in increased precipitation. The local-origin precipitation accounts for about 92.7% of total precipitation changes during April and May. On the other hand, the decrease in summer total precipitation was affected the changes in evaporative ( Δ β 1 ) and advective ( Δ β 2 ) precipitation by 47.2% and 52.8%, respectively. In other word, the changes in total precipitation during summer are related to the reduction of soil moisture due to early snowmelt as well as the moisture divergence associated with the development of anticyclonic circulation from the lower to the upper atmosphere.
East Asia is well-known as a representative seasonal monsoon region. Therefore, the precipitation in this region is influenced by the monsoon flow, and its characteristics are apparent. In particular, the total amount of precipitation in the region is concentrated in the summer. This result is caused by the transport of large amounts of water from the oceans adjacent to this area in the same period. Namely, since East Asia is located on the eastern coast of Eurasia continent, changes in precipitation are highly affected by the surrounding ocean. During April and May, P1 and Pa contributed 20.4% ( Δ β 1 ) and 79.6% ( Δ β a ) to the total precipitation change (+0.27 mm/day) respectively. Although increase in precipitation (+0.21mm/day) is less than that of AM period, the contribution of change in precipitation by moisture advection increases to 97.2% (Table 2). Warmer land-surface over northern Eurasia and the Himalayas-Tibetan region due to SDE further increases moisture convergence and significantly increases precipitation over the East Asia region.
In summary, the atmospheric warming and drying accompanied by anomalous anticyclone in the upper troposphere, centered over Middle East and southern Europe is strongly coupled with moisture advection from adjacent ocean and moistening in the East Asian monsoon region with an enhanced anomalous Tibetan plateau anticyclone, resulting in anomalous anti-clockwise circulation in the zonal-vertical direction over Eurasian continent. This finding suggests that the SDE may play an important role in advancing and strengthening monsoonal circulation in East Asia, while it may lead to dry and hot summers by intensifying and maintaining anomalous anticyclone over the mid-western Eurasia.

Author Contributions

Conceptualization, J.S., M.-K.K.; formal analysis, J.S.; investigation, J.S., M.-K.K., W.K.M.L., and K.-M.K.; writing—original draft preparation, J.S.; writing—review and editing, W.K.M.L., K.-M.K., and M.-K.K.; visualization, J.S.

Funding

This research was funded by the Korea Meteorological Administration, grant number KMI2018-03410. W.K.M.L. and K.-M.K. was supported by the Modeling Analysis and Prediction Program, NASA Headquarters.

Acknowledgments

Results of work were based on ensemble experiments conducted using the GEOS-5 model, in collaboration with T. Yasunari and R. Koster, which laid the fundamental work for this study. The authors thank three reviewers for their useful comments on the manuscript.

Conflicts of Interest

The authors declare no conflict of interest.

References

  1. Lau, K.M.; Kim, M.K.; Kim, K.M. Asian summer monsoon anomalies induced by aerosol direct forcing: The role of the Tibetan Plateau. Clim. Dyn. 2006, 26, 855–864. [Google Scholar] [CrossRef]
  2. Kim, M.K.; Lau, W.K.M.; Kim, K.M.; Sang, J.; Kim, Y.H.; Lee, W.S. Amplification of ENSO effects on Indian summer monsoon by absorbing aerosols. Clim. Dyn. 2016, 46, 2657–2671. [Google Scholar] [CrossRef]
  3. Flanner, M.G.; Zender, C.S.; Hess, P.G.; Mahowald, N.M.; Painter, T.H.; Ramanathan, V.; Rasch, P.J. Springtime warming and reduced snow cover from carbonaceous particles. Atmos. Chem. Phys. Discuss. 2009, 8, 19819–19859. [Google Scholar] [CrossRef]
  4. Vinoj, V.; Rasch, P.J.; Wang, H.; Yoon, J.; Ma, P.; Landu, K.; Singh, B. Short-term modulation of Indian summer monsoon rainfall by West Asian dust. Nat. Geosci. 2014, 7, 308–313. [Google Scholar] [CrossRef]
  5. Sanap, S.D.; Pandithurai, G. The effect of absorbing aerosols on Indian monsoon circulation and rainfall: A review. Atmos. Res. 2015, 164–165, 318–327. [Google Scholar] [CrossRef]
  6. Tegen, I.; Heinold, B. Large-scale modeling of absorbing aerosols and their semi-direct effects. Atmosphere (Basel) 2018, 9, 380. [Google Scholar] [CrossRef]
  7. Kim, M.K.; Lau, W.K.M.; Chin, M.; Kim, K.M.; Sud, Y.C.; Walker, G.K. Atmospheric teleconnection over Eurasia induced by aerosol radiative forcing during boreal spring. J. Clim. 2006, 19, 4700–4718. [Google Scholar] [CrossRef]
  8. Lee, W.S.; Kim, M.K. Effects of radiative forcing by black carbon aerosol on spring rainfall decrease over Southeast Asia. Atmos. Environ. 2010, 44, 3739–3744. [Google Scholar] [CrossRef]
  9. Flanner, M.G.; Zender, C.S.; Randerson, J.T.; Rasch, P.J. Present-day climate forcing and response from black carbon in snow. J. Geophys. Res. 2007, 112, D11202. [Google Scholar] [CrossRef]
  10. Wiscombe, W.J.; Warren, S.G. A model for the spectral albedo of snow. I: Pure snow. J. Atmos. Sci. 1980, 37, 2712–2733. [Google Scholar] [CrossRef]
  11. Lin, G.; Penner, J.E.; Flanner, M.G.; Sillman, S.; Xu, L.; Zhou, C. Radiative forcing of organic aerosol in the atmosphere and on snow: Effects of SOA and brown carbon. J. Geophys. Res. Atmos. 2014, 119, 7453–7476. [Google Scholar] [CrossRef] [Green Version]
  12. Yasunari, T.J.; Lau, K.-M.; Mahanama, S.P.P.; Colarco, P.R.; Da Silva, A.M.; Aoki, T.; Aoki, K.; Murao, N.; Yamagata, S.; Kodama, Y. The GOddard SnoW Impurity Module (GOSWIM) for the NASA GEOS-5 Earth System Model: Preliminary Comparisons with Observations in Sapporo, Japan. Sola 2014, 10, 50–56. [Google Scholar] [CrossRef] [Green Version]
  13. Yasunari, T.J.; Koster, R.D.; Lau, W.K.M.; Kim, K.-M. Impact of snow darkening via dust, black carbon, and organic carbon on boreal spring climate in the Earth system. J. Geophys. Res. Atmos. 2015, 120, 5485–5503. [Google Scholar] [CrossRef]
  14. Lee, W.S.; Bhawar, R.L.; Kim, M.K.; Sang, J. Study of aerosol effect on accelerated snow melting over the Tibetan Plateau during boreal spring. Atmos. Environ. 2013, 75, 113–122. [Google Scholar] [CrossRef]
  15. Lau, W.K.M.; Sang, J.; Kim, M.K.; Kim, K.M.; Koster, R.D.; Yasunari, T.J. Impacts of Snow Darkening by Deposition of Light-Absorbing Aerosols on Hydroclimate of Eurasia During Boreal Spring and Summer. J. Geophys. Res. Atmos. 2018, 123, 8441–8461. [Google Scholar] [CrossRef] [Green Version]
  16. Lau, W.K.M.; Kim, K.-M. Impact of Snow Darkening by Deposition of Light-Absorbing Aerosols on Snow Cover in the Himalayas – Tibetan Plateau and Influence on the Asian Summer Monsoon: A Possible Mechanism for the Blanford Hypothesis. Atmosphere (Basel) 2018, 9, 438. [Google Scholar] [CrossRef]
  17. Aoki, T.; Kuchiki, K.; Niwano, M.; Kodama, Y.; Hosaka, M.; Tanaka, T. Physically based snow albedo model for calculating broadband albedos and the solar heating profile in snowpack for general circulation models. J. Geophys. Res. Atmos. 2011, 116, 1–22. [Google Scholar] [CrossRef]
  18. Painter, T.H.; Deems, J.S.; Belnap, J.; Hamlet, A.F.; Landry, C.C.; Udall, B. Response of Colorado River runoff to dust radiative forcing in snow. Proc. Natl. Acad. Sci. 2010, 107, 17125–17130. [Google Scholar] [CrossRef] [Green Version]
  19. Yasunari, T.J.; Koster, R.D.; Lau, K.-M.; Aoki, T.; Sud, Y.C.; Yamazaki, T.; Motoyoshi, H.; Kodama, Y. Influence of dust and black carbon on the snow albedo in the NASA Goddard Earth Observing System version 5 land surface model. J. Geophys. Res. 2011, 116, D02210. [Google Scholar] [CrossRef]
  20. Cohen, J.; David, R. The Effect of Snow Cover on the Climate. J. Clim. 1991, 4, 689–706. [Google Scholar] [CrossRef]
  21. Ye, K.; Wu, R.; Liu, Y. Interdecadal change of Eurasian snow, surface temperature, and atmospheric circulation in the late 1980s. J. Geophys. Res. Atmos. 2015, 120, 2738–2753. [Google Scholar] [CrossRef]
  22. Blanford, H.F. On the Connexion of the Himalaya Snowfall with Dry Winds and Seasons of Drought in India. Proc. R. Soc. London 1884, 37, 3–22. [Google Scholar]
  23. Hahn, D.G.; Shukla, J. An apparent relationship between Eurasian snow cover and Indian monsoon rainfall. J. Atmos. Sci. 1976, 33, 2461–2462. [Google Scholar] [CrossRef]
  24. Barnett, T.P.; Dümenil, L.; Schlese, U.; Roekner, E.; Latif, M. The Effect of Eurasian Snow Cover on Regional and Global Climate Variations. J. Atmos. Sci. 1989, 46, 661–685. [Google Scholar] [CrossRef]
  25. Sankar-Rao, M.M.; Lau, K.M.; Yang, S. On the Relationship Between Eurasian Snow Cover and the Asian Summer Monsoon. Int. J. Climatol. 1996, 16, 605–616. [Google Scholar] [CrossRef]
  26. Barnett, T.P.; Adam, J.C.; Lettenmaier, D.P. Potential impacts of a warming climate on water availability in snow-dominated regions. Nature 2005, 438, 303–309. [Google Scholar] [CrossRef] [PubMed]
  27. Pal, J.S.; Eltahir, E.A.B. Pathways relating soil moisture conditions to future summer rainfall within a model of the land-atmosphere system. J. Clim. 2001, 14, 1227–1242. [Google Scholar] [CrossRef]
  28. Hohenegger, C.; Brockhaus, P.; Bretherton, C.S.; Schär, C. The soil moisture-precipitation feedback in simulations with explicit and parameterized convection. J. Clim. 2009, 22, 5003–5020. [Google Scholar] [CrossRef]
  29. Sellers, P.J.; Heiser, M.D.; Hall, F.G. Relations between surface conductance and spectral vegetation indexes at intermediate (100m2 to 15km2) length scales. J. Geophys. Res. 1992, 97, 19033–19059. [Google Scholar] [CrossRef]
  30. Betts, A.K.; Ball, J.H.; Viterbo, A.C.M.B.; Miller, M.J.; Pedro, A. Viterbo The land surface-atmosphere interaction: A review based on observational and global modeling perspectives. J. Geophys. Res. 1996, 101, 7209–7225. [Google Scholar] [CrossRef]
  31. Koster, R.D.; Dirmeyer, P.A.; Guo, Z.; Bonan, G.; Chan, E.; Cox, P.; Gordon, C.T.; Kanae, S.; Kowalczyk, E.; Lawrence, D.; et al. Regions of Strong Coupling Between Soil Moisture and Precipitation. Science 2004, 305, 1138–1141. [Google Scholar] [CrossRef]
  32. Meng, L.; Quiring, S.M. Examining the influence of spring soil moisture anomalies on summer precipitation in the U.S. Great Plains using the Community Atmosphere Model version 3. J. Geophys. Res. Atmos. 2010, 115, 1–16. [Google Scholar] [CrossRef]
  33. Ford, T.W.; Rapp, A.D.; Quiring, S.M.; Blake, J. Soil moisture-precipitation coupling: Observations from the Oklahoma Mesonet and underlying physical mechanisms. Hydrol. Earth Syst. Sci. 2015, 19, 3617–3631. [Google Scholar] [CrossRef]
  34. Fischer, E.M.; Seneviratne, S.I.; Vidale, P.L.; Lüthi, D.; Schär, C. Soil moisture-atmosphere interactions during the 2003 European summer heat wave. J. Clim. 2007, 20, 5081–5099. [Google Scholar] [CrossRef]
  35. Stéfanon, M.; Drobinski, P.; D’Andrea, F.; Lebeaupin-Brossier, C.; Bastin, S. Soil moisture-temperature feedbacks at meso-scale during summer heat waves over Western Europe. Clim. Dyn. 2014, 42, 1309–1324. [Google Scholar] [CrossRef]
  36. Schär, C.; Lüthi, D.; Beyerle, U.; Heise, E. The soil-precipitation feedback: A process study with a regional climate model. J. Clim. 1999, 12, 722–741. [Google Scholar] [CrossRef]
  37. Boé, J. Modulation of the summer hydrological cycle evolution over western Europe by anthropogenic aerosols and soil-atmosphere interactions. Geophys. Res. Lett. 2016, 43, 7678–7685. [Google Scholar]
  38. Zhang, J.; Wu, L.; Dong, W. Land-atmosphere coupling and summer climate variability over East Asia. J. Geophys. Res. Atmos. 2011, 116, 1–14. [Google Scholar] [CrossRef]
  39. Zeng, D.; Yuan, X. Multiscale Land–Atmosphere Coupling and Its Application in Assessing Subseasonal Forecasts over East Asia. J. Hydrometeorol. 2018, 19, 745–760. [Google Scholar] [CrossRef]
  40. Kim, J.-E.; Hong, S.-Y. Impact of Soil Moisture Anomalies on Summer Rainfall over East Asia: A Regional Climate Model Study. J. Clim. 2007, 20, 5732–5743. [Google Scholar] [CrossRef]
  41. Eltahir, E.A.B.; Bras, R.L. Precipitation recycling in the Amazon basin. Q. J. R. Meteorol. Soc. 1994, 120, 861–880. [Google Scholar] [CrossRef]
  42. Eltahir, E.A.B.; Bras, R.L. Precipitation recycling. Rev. Geophys. 1996, 34, 367–378. [Google Scholar] [CrossRef]
  43. Dominguez, F.; Kumar, P. Precipitation recycling variability and ecoclimatological stability—A study using NARR Data. Part I: Central U.S. plains ecoregion. J. Clim. 2008, 21, 5165–5186. [Google Scholar] [CrossRef]
  44. Koster, R.D.; Guo, Z.; Dirmeyer, P.a.; Bonan, G.B.; Chan, E.; Cox, P.M.; Gordon, C.T.; Kanae, S.; Kowalczyk, E.; Lawrence, D.M.; et al. GLACE: The Global Land – Atmosphere Coupling Experiment. Part I: Overview. J. Hydrometeorol. 2006, 7, 611–625. [Google Scholar] [CrossRef]
  45. Dirmeyer, P.A.; Schlosser, C.A.; Brubaker, K.L. Precipitation, Recycling, and Land Memory: An Integrated Analysis. J. Hydrometeorol. 2009, 10, 278–288. [Google Scholar] [CrossRef]
  46. Li, R.; Wang, C.; Wu, D. Changes in precipitation recycling over arid regions in the Northern Hemisphere. Theor. Appl. Climatol. 2018, 131, 489–502. [Google Scholar] [CrossRef]
  47. Brubaker, K.L.; Entekhabi, D.; Eagleson, P.S. Estimation of continental precipitation recycling. J. Clim. 1993, 6, 1077–1089. [Google Scholar] [CrossRef]
  48. Trenberth, K.E.; Dai, A.; Rasmussen, R.M.; Parsons, D.B. The Changing Character of Precipitation. Bull. Am. Meteorol. Soc. 2003, 84, 1205–1218. [Google Scholar] [CrossRef]
  49. Zhang, Z.; Xu, C.-Y.; Yong, B.; Hu, J.; Sun, Z. Understanding the Changing Characteristics of Droughts in Sudan and the Corresponding Components of the Hydrologic Cycle. J. Hydrometeorol. 2012, 13, 1520–1535. [Google Scholar] [CrossRef]
  50. Ding, Q.; Wang, B. Circumglobal teleconnection in the Northern Hemisphere summer. J. Clim. 2005, 18, 3483–3505. [Google Scholar] [CrossRef]
  51. Linderholm, H.W.; Ou, T.; Jeong, J.H.; Folland, C.K.; Gong, D.; Liu, H.; Liu, Y.; Chen, D. Interannual teleconnections between the summer North Atlantic Oscillation and the East Asian summer monsoon. J. Geophys. Res. Atmos. 2011, 116, 1–13. [Google Scholar] [CrossRef]
  52. Rienecker, M.M.; Suarez, M.J.; Todling, R.; Bacmeister, J.; Takacs, L.; Liu, H.-C.; Gu, W.; Sienkiewicz, M.; Koster, R.D.; Gelaro, R.; et al. The GEOS-5 Data Assimilation System— Documentation of Versions 5.0.1, 5.1.0, and 5.2.0; NASA: Washington, DC, USA, 2008; Volume 27, pp. 1–81.
  53. Ducharne, A.; Koster, R.D.; Suarez, M.J.; Stieglitz, M.; Kumar, P. A catchment-based approach to modeling land surface processes in a general circulation model: 2. Parameter estimation and model demonstration. J. Geophys. Res. 2000, 105, 823–824. [Google Scholar] [CrossRef]
  54. Koster, R.D.; Suarez, M.J.; Ducharne, A.; Stieglitz, M.; Kumar, P. A catchment-based approach to modeling land surface processes in a general circulation model 1. Model structure. J. Geophys. Res. 2000, 105, 24809–24822. [Google Scholar] [CrossRef]
  55. Chin, M.; Rood, R.B.; Lin, S.-J.; Müller, J.-F.; Thompson, A.M. Atmospheric sulfur cycle simulated in the global model GOCART: Model description and global properties. J. Geophys. Res. 2000, 105, 24671–24687. [Google Scholar] [CrossRef]
  56. Randles, C.A.; Colarco, P.R.; Silva, A. Da Direct and semi-direct aerosol effects in the NASA GEOS-5 AGCM: aerosol-climate interactions due to prognostic versus prescribed aerosols. J. Geophys. Res. Atmos. 2013, 118, 149–169. [Google Scholar] [CrossRef]
  57. Bisselink, B.; Dolman, A.J. Precipitation Recycling: Moisture Sources over Europe using ERA-40 Data. J. Hydrometeorol. 2008, 9, 1073–1083. [Google Scholar] [CrossRef]
  58. Kishtawal, C.M.; Gautam, G.; Jaggi, S.; Pandey, P.C. Surface-level moisture transport over the Indian Ocean during southwest monsoon months using NOAA/HIRS data. Boundary-Layer Meteorol. 1994, 69, 159–171. [Google Scholar] [CrossRef]
Figure 1. Spatial distribution of total Snow Impurities Absorption Coefficient (total SIAC) in (a) April–May and (b) June–July. Colors of dots indicate dominant component (more than 50% contribution). Two boxes in (a) indicate Western Eurasia (20–60 °E, 40–60 °N) and the East Asia (110–135 °E, 24–56 °N) domain, respectively.
Atmosphere 10 00500 g001
Figure 2. Spatial distributions of SDE-induced anomalies of (a) surface skin temperature(shaded) and shortwave radiation(contour), and (c) snowmelt during April–May. (b,d) are same as (a,c), except for June–July. Dots represent statistical significance at 99%.
Atmosphere 10 00500 g002
Figure 3. Spatial distributions of (a) mean precipitation (shaded, mm/day) with 850 hPa moisture transport (vector, gk g 1 m s 1 ), SDE induced anomalies of (c) precipitation and 850 hPa moisture transports, and (e) soil wetness (%) during April–May. (b,d,f) are the same as (a,c,e), respectively, except for June–July. Dots represent statistical significance at 95%.
Atmosphere 10 00500 g003
Figure 4. Seasonal variations of daily changes in (a) precipitation ( mm / day ) , (b) β 1 , and (c) pressure velocity ( 100 × P a s 1 ) for WE. Black, purple, and green lines in (a) are P 1 (local-induced precipitation), Pa (advection-induced precipitation), and P (total precipitation), respectively. Red (blue) shadings represent increased (reduced) anomalies by SDE. Positive (negative) values in (c) indicate rising (sinking) motion. See text for definition of β 1 .
Atmosphere 10 00500 g004
Figure 5. Seasonal variations of daily changes in (a) precipitation ( mm / day ) , (b) β 1 , and (c) pressure velocity ( 100 × P a s 1 ) for EA. Black, purple, and green lines in (a) are P 1 (local-induced precipitation), Pa (advection-induced precipitation), and P (total precipitation), respectively. Red (blue) shadings represent increased (reduced) anomalies by SDE. Positive (negative) values in (c) indicate rising (sinking) motion. See text for definition of β 2 .
Atmosphere 10 00500 g005
Figure 6. The changes in (a) streamlines of horizontal wind at 200hPa and total cloud fraction (%), (b) the meridional-averaged (10–140 °E) vertical profiles of relative humidity (shaded, %) and streamlines of east-west circulation (streamlines) by SDE in Jun. Green and red rectangular box in (a,b) indicate Western Eurasia (20–60 °E, 40–60 °N) and the East Asia (110–135 °E, 24–56 °N) domain, respectively.
Atmosphere 10 00500 g006
Table 1. Changes in components of precipitation during AM and JJ for WE. (a) Local-induced precipitation ( mm / day ), (b) advection-induced precipitation ( mm / day ) , (c) total precipitation ( mm / day ) , (d) the fraction of Local-induced precipitation (%), and (e) the fraction of advection-induced precipitation (%). **, and * in (c) represent statistical significance at 99%, 95% and 90%, respectively.
( a )   P 1 ( b )   P a ( c )   P ( d )   Δ β 1 ( e )   Δ β 2
AM0.0890.0070.096 **92.77.3
JJ0.0340.0380.072 *47.252.8
Table 2. Changes in components of precipitation during AM and JJ for EA. (a) Local-induced precipitation ( mm / day ), (b) advection-induced precipitation ( mm / day ) , (c) total precipitation, (d) the fraction of Local-induced precipitation (%), and (e) the fraction of advection-induced precipitation (%). *** and * in (c) represent statistical significance at 99%, 95% and 90%, respectively.
( a )   P 1 ( b )   P a ( c )   P ( d )   Δ β 1 ( e )   Δ β 2
AM0.0560.2180.274 ***20.479.6
JJ0.0060.2080.214 *2.897.2

