Article

Response of Urban Heat Stress to Heat Waves in Athens (1960–2017)

Institute for Environmental Research & Sustainable Development (IERSD), National Observatory of Athens, GR-15236 Athens, Greece
*
Author to whom correspondence should be addressed.
Atmosphere 2019, 10(9), 483; https://doi.org/10.3390/atmos10090483
Submission received: 8 July 2019 / Revised: 11 August 2019 / Accepted: 20 August 2019 / Published: 22 August 2019
(This article belongs to the Special Issue Urban Thermal Risk)

Abstract

:
The increasing frequency, intensity and duration of heat waves seem to follow the observed global warming in recent decades. Vulnerability to heat waves is expected to increase in urban environments mainly due to population density and the effect of the urban heat island that make cities hotter than surrounding non-urban areas. The present study focuses on a vulnerable area of the eastern Mediterranean, already characterized as a ‘hot spot’ with respect to heat-related risk and investigates the change in heat stress levels during heat wave compared to non-heat wave conditions as well as the way that heat stress levels respond to heat waves in urban, compared to non-urban, environments. The adoption of a metric accounting for both the intensity and duration of the hot event yielded a total of 46 heat wave episodes over a nearly 60-year period, but with very rare occurrence until the late 1990s and a profound increased frequency thereafter. The results reveal a difference of at least one thermal stress category between heat wave and non-heat wave periods, which is apparent across the entire range of the thermal stress distribution. The analysis demonstrates a robust intensification of nighttime heat stress conditions in urban, compared to non-urban, sites during severe heat waves. Nevertheless, severe heat waves almost equalize heat stress conditions between urban and non-urban sites during midday.

1. Introduction

Unlike other climate hazards, heat waves (hereafter HWs) have only lately been acknowledged as a major threat to environment and society [1], although they are related to more deaths than other extreme events [2]. The increasing frequency, intensity and duration of HWs in different world regions seem to follow the observed global warming in recent decades [3,4]. The impact of HWs on human health has been investigated in terms of mortality, morbidity and hospital admissions as well as in terms of heat stress and human body’s energy balance [5,6,7,8,9,10,11,12]. The populations in low and middle income countries are more affected from HWs as compared to high income countries and as global warming progresses, they will still be more affected [13].
A period of consecutive days with exceptionally hot weather which deviates from the local climatic conditions is usually considered as a HW. Nevertheless, there is no standard and universal definition for HWs. Several metric systems (indices) and approaches have been proposed in order to detect and investigate these abnormal heat events based on either absolute or relative (percentile) thresholds. Most of the approaches try to portray the frequency, the amplitude and the persistence of HWs mainly based on expressions of air temperature, such as the maximum, the minimum and the daily mean (e.g., [4,14,15]). Despite the fact that HWs are meteorological events associated with large scale atmospheric anomalies and persistent anticyclonic conditions, they should also be assessed in terms of human impacts [16]. When the analysis of HWs is focused on human well-being, the approaches are based on bioclimatic indices (e.g., [17,18,19]). To date, a plethora of bioclimatic indices have been developed worldwide aiming to assess the human thermal environment [20,21,22]. The type, quality and formulation of all developed indices vary considerably. Their differences refer to the number or type of variables taken into consideration, the mechanisms of heat exchange between the human body and the atmosphere as well as the rationale of the thermo-physiological processes on the human body, but are not limited to these [20,21,22]. Most of the existing indices are simple two-parameter indices, neglecting significant energy fluxes between the human body and the thermal environment. Only a few indices are formulated on rational and physiological basis taking into account the minimum dataset of input variables for a reliable appraisal [20,21,22].
Vulnerability to HWs is expected to increase in urban environments mainly due to population density and the effect of the urban heat island (UHI) that make cities hotter than surrounding non-urban areas [23]. Moreover, recent studies point to synergies between HWs and UHIs leading to exacerbation of the UHI magnitude during HW episodes [24,25,26,27,28]. Bigger cities seem to experience an amplification of UHI during HW episodes compared to smaller cities, even though cities with similar size seem to interact differently with HWs [29]. In addition, external factors such as the demographic structure and the percentage of old housing seem to modulate the impact of HWs in urban areas [30].
The coastal city of Athens, as the area of interest in this research, is located in the Mediterranean, which is highlighted as one of the regions with prominent increase in the frequency, intensity and length of HWs in the present and future climate [3,31,32]. Several studies have focused on the study region for the assessment of HWs trends, adopting metrics based either on absolute air temperature thresholds (e.g., [33,34]) or on thresholds with biometeorological background (e.g., [17,35]). Recently, Tolika [15] assessed the HWs in several Greek cities using a relatively new index, the so called excess heat factor. Long-term trends in heat stress in Athens based on bioclimatic indices have been recently reported by Katavoutas and Founda [36].
The aim of this study is to assess and quantify the amplification in heat stress levels experienced by urban population during HWs compared to non-HW (normal summer conditions) periods. Moreover, the study explores the different response of heat stress to HWs between urban and non-urban sites. Although the studies on HWs or heat stress metrics are numerous worldwide, only limited studies focus on the different response of urban and non-urban sites to HWs. However, even these studies are focused on the interaction between HWs and the magnitude of UHI [24,25,26,27,28,29] while, to our knowledge, the different response of urban and non-urban sites to severe HWs based on heat stress metrics (and not UHI intensity) has not been analyzed so far.
A long record of meteorological observations spanning almost six decades (1960–2017) and a set of bioclimatic indices accounting for human thermal comfort were used. For the detection of HW episodes, this research adopts a metric accounting for the intensity and duration of the events, while it performs a ranking of HW severity by applying the cumulative exceedance of daily maximum temperature above a threshold value for the whole duration of the event.

2. Materials and Methods

2.1. Data and Area under Consideration

The identification of HWs is focused on a large urban area of the eastern Mediterranean, the city of Athens in Greece. The city stretches over an area of 412 km2 and is one of the top eight most populated functional urban areas in the European Union, containing about 3.1 million inhabitants [37]. According to the updated world map of the Köppen–Geiger climate classification, Athens’ climate is classified as ‘Csa’, suggesting an interior Mediterranean climate: mild, with dry and hot summers [38]. During the warm period of the year, the city is affected by strong north-northeasterly winds known as ‘Etesians’, diminishing the levels of air temperature and thus, inducing relief from heat stress.
Given the fact that the present study aimed to identify HWs in a large urban agglomeration and assess the heat stress risk on its population during these periods, an appropriate station with long, continuous and high quality records was required. National Observatory of Athens (NOA) met these preconditions and the station has received a formal recognition by the World Meteorological Organization (WMO) for its centennial operation. NOA is located on a hill (107 m a.s.l.) at the Athens urban core. The air temperature time series have been quality controlled for their homogeneity [39] whilst the long-term surface solar radiation time series have been quality controlled for their accuracy [40].
The daily maximum air temperature (Tmax) time series were employed for a long 58-year period from 1960 to 2017. Moreover, the hourly time series of air temperature, relative humidity, wind speed and global solar radiation were also used for the aforementioned time period. The identification of abnormal heat events was focused on the warm period of the year and hence, the used data were restricted to the summer months of June, July and August. No missing values were found for the Tmax time series, whereas less than 0.6% in total were detected for the hourly time series of air temperature, relative humidity, wind speed and global solar radiation.
In order to investigate the spatial differences of heat stress conditions between an urban and a suburban area during exceptional abnormal heat events, the suburban station of Tatoi was also employed. Tatoi station (237 m a.s.l.) is located at the north boundaries of the Athens urban complex between the mountains of Parnitha and Hymettus and is 16 km distant from the NOA station. The 3-hourly time series of air temperature, relative humidity, wind speed and cloud cover were also employed for the 1985–2010 period.

2.2. Heat Wave Identification Process

The identification of HWs was attained employing a day-count indicator based on percentile thresholds in a span of at least three consecutive days. In particular, the period where the daily Tmax exceeded the 95th percentile of the reference period of 30 years (1971–2000) for more than three consecutive days was characterized as a ‘heat wave’ period (HW period). It is known that literature lacks a universal definition of HWs (e.g., [16]). The use of upper percentiles in Tmax and the choice of the least duration of three consecutive days in the adopted definition is consistent (or more strict) with definitions used in other relevant studies [41,42,43,44].
The 95th percentile of the reference period was computed from five-day windows centered on each calendar day. The selection of a five-day window approach produced a sample size of 150 values (30 years × 5 days) on each calendar day. Such an approach expressed the anomalies relative to the local climatic conditions and created a relatively smooth cycle of percentiles thresholds for each calendar day of summer based on the reference period (1971–2000) [14]. According to the WMO [14], the selection of another reference period had only a small impact on the results over time. This procedure could be applied to all seasons creating an annual cycle of percentile thresholds but other periods could also be selected. As already mentioned, the analysis was seasonally restricted and hence, the results were focused on the summer season where the impact of HWs on thermal comfort of urban population was maximized. In order for the method to be applicable to the first days of June and the last days of August, the Tmax time series of the last days of May and the first days of September were also employed.
In order to assess the intensity and severity of HWs, two additional metrics were used. ‘Cumulative exceedance’ (CumExc) was defined as the sum of the differences between the Tmax and the 95th Tmax percentile for all days of the HW episode. ‘Absolute exceedance’ (AbsExc) was defined as the maximum daily Tmax exceedance above the 95th Tmax percentile during the HW episode.
C u m E x c = i = 1 N Δ ( T m a x , i T m a x , P 95 , i ) ,
A b s E x c = max ( Δ ( T m a x , i T m a x , P 95 , i ) ) ,
where i indicates a calendar day of the HW and Tmax,P95 denotes the 95th Tmax percentile of the day.

2.3. Heat Stress Assessment

The assessment of heat stress was performed by employing one simple ‘heat–humidity’ index, the so-called Humidex (HD), and one thermo-physiologically based energy balance index, the so-called Universal Thermal Climate Index (UTCI). HD is an empirical index based on an algebraic/statistical model, omitting significant energy fluxes, while UTCI is an energy balance stress index [20,21,22].
HD follows a simplistic approach to assess the degree of comfort taking into consideration the combined effect of air temperature and humidity on physical distress [45]. However, HD index does not take into account the parameters of radiation and wind speed, omitting also behavioral factors such as the metabolic rate and the clothing insulation as well as the energy balance equation between the human body and the thermal environment [22]. This index has been exclusively designed for warm weather conditions and thus, its result is valid when the ambient temperature is higher than 21.0 °C (Table 1). The HD calculations were performed following the formula:
H D = T + 5 9 ( e 10 ) ,
where T is the air temperature (°C) and e is the vapor pressure (hPa). According to the guide for summer weather hazards released by the Environment Canada Service, an HD value higher than 40 can be considered as an extremely high HD reading, where people should curtail all unnecessary outdoor activities [46]. In addition, certain types of activity should be reduced when the HD value is in the mid to high 30s. It is also worth noting that the assessment scale of HD has been calibrated for people living in temperate regions of Canada.
The UTCI is derived from an energy balance model that takes into account both the mechanisms of heat exchange and the thermo-physiological processes on the human body. Specifically, UTCI is based on an advanced multi-node model of thermoregulation [47] which is coupled with an adaptive clothing model [48]. UTCI is expressed as equivalent temperature of a reference environment and its applicability covers a wide range of environmental conditions. Table 2 presents the thermal stress categories according to UTCI [49].
Unlike the HD index, whose input variables are only the air temperature and humidity, the meteorological input variables of UTCI include air temperature, air humidity, wind speed and mean radiant temperature. The adaptive clothing model [48] integrated in UTCI-Fiala model [47] determines the clothing insulation, while the metabolic rate is set at 135 W·m−2 (2.3 met) and the walking speed at 1.1 m·s−1 [50]. Hence, UTCI describes the thermal environment of human beings in a more comprehensive way and thus, is a more robust and advanced index compared to HD [20,21]. According to Alfano et al. [22], the HD index shows significant shortcomings and thus, it is not suitable for assessing heat stress both outdoors and indoors. Nevertheless, the HD index is still used by researchers or National Weather Services for communication purposes regarding heat-related hazards, overlooking its shortcomings due to its simplicity of calculations.
The UTCI calculations were performed based on a Fortran subroutine retrieved from the official site of UTCI project (http://www.utci.org/). The simulations of radiant temperature, which is one of the input variables of UTCI, were carried out employing the RayMan model that simulates long-wave and short-wave radiation fluxes [51,52].
Following the definition of ‘Urban Heat Island Intensity’ (UHII) which is quantified by the difference of air temperature between urban and non-urban areas [23], we further proposed the indicator of ‘Urban Heat Stress Intensity’ (UHSI) which was quantified as the difference of heat stress between the urban station of NOA and the suburban station of Tatoi. Hence, the UHSI is given by the following equation:
U H S M e t r i c I = Δ ( M e t r i c N O A M e t r i c T a t o i ) ,
where the ‘Metric’ indicates the bioclimatic index (HD or UTCI) used for the assessment of heat stress intensity between urban and suburban areas.

3. Results

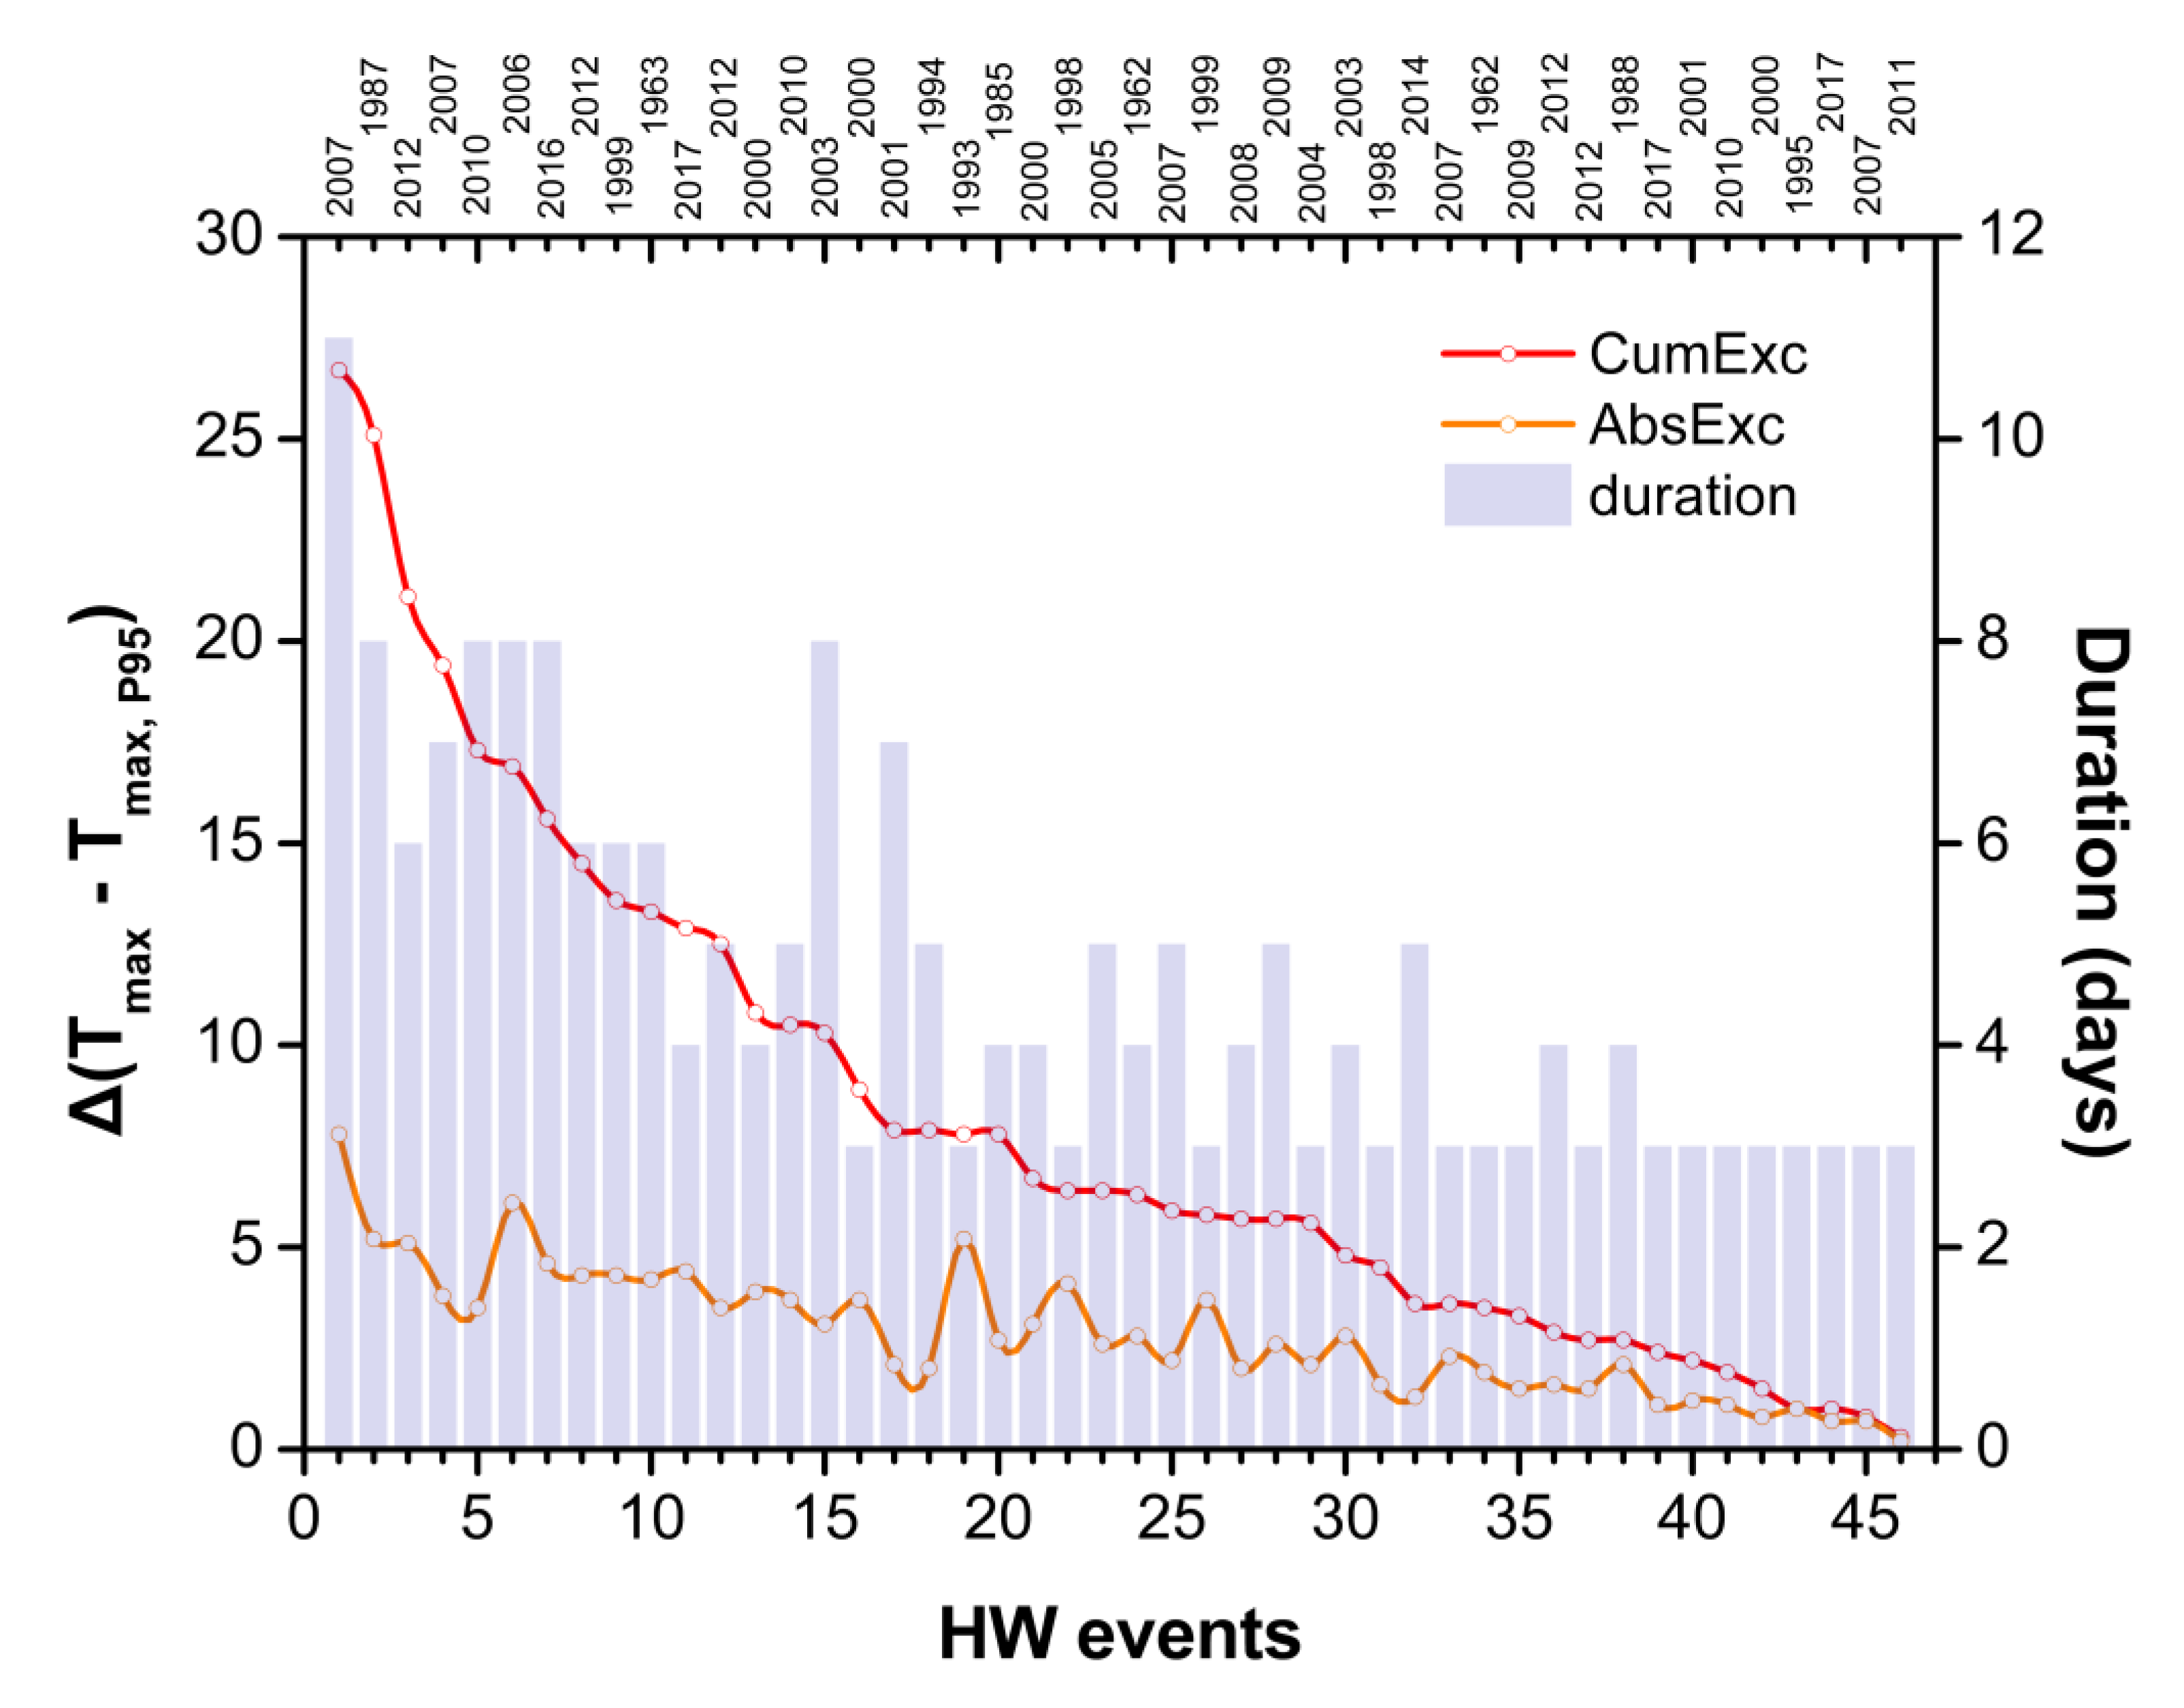
3.1. Heat Wave Identification

In order to identify the HWs, the 95th Tmax percentile-based thresholds on each calendar day of summer were produced for the reference period (1971–2000) (Figure 1). The percentile thresholds varied during summer, with the values ranging between 31.8 °C and 39.0 °C. The lowest values of thresholds were observed in early June and the highest values were noted during July as they were associated with the local climatic conditions.
Figure 2 shows the frequency of HWs per year for the study period 1960–2017. The methodological approach used identified 46 HWs in total, during the long 58-year period. Only three HWs were detected until the mid-1980s, while the HWs frequency increased markedly afterwards. The results revealed an average number of 0.8 HWs y−1 for the entire study period. However, the average number of HWs was noticeably larger in the 2000s and 2010s, at the level of 1.9 HWs y−1 and 1.4 HWs y−1, respectively. The highest number of HWs was observed in 2007 and 2012, both with five episodes, and the year 2000 followed with four episodes. The frequency of HWs per month indicated that 21.7% (10 events) occurred in June, 28.3% (13 events) occurred in July and 43.5% (20 events) occurred in August. In addition, 6.5% of HWs (three events) took place between two months (June/July and July/August).
Figure 3 depicts the CumExc and AbsExc per HW as well as the duration and the year of appearance for each HW, organized in descending order of CumExc. The duration of the 46 HWs ranged between 3 to 11 days while 18 HW events spanned a period of 3 days. Only one HW was detected with an 11 day duration followed by five HWs with an 8 day duration. The CumExc ranged from 0.3 °C to 26.7 °C and the AbsExc varied between 0.2 °C and 7.8 °C. The HW with the highest CumExc displayed both the longest duration and the highest AbsExc. The second ranked HW based on CumExc was also second in terms of duration and third in terms of AbsExc. Nevertheless, a visual inspection of the results revealed significant differences in CumExc and AbsExc even in HWs with the same duration. It is also noteworthy that the first 15 HWs according to the ranking based on CumExc all originated after 1999, with the exception of 2 HW events.
The first two ranked HWs based on CumExc are two exceptional, and at the same time representative, abnormal heat events of Greece. The first one took place in June 2007 and the second in July 1987 with significant implications for the population, especially for the inhabitants of densely urban areas like Athens [34,53,54,55,56,57,58].

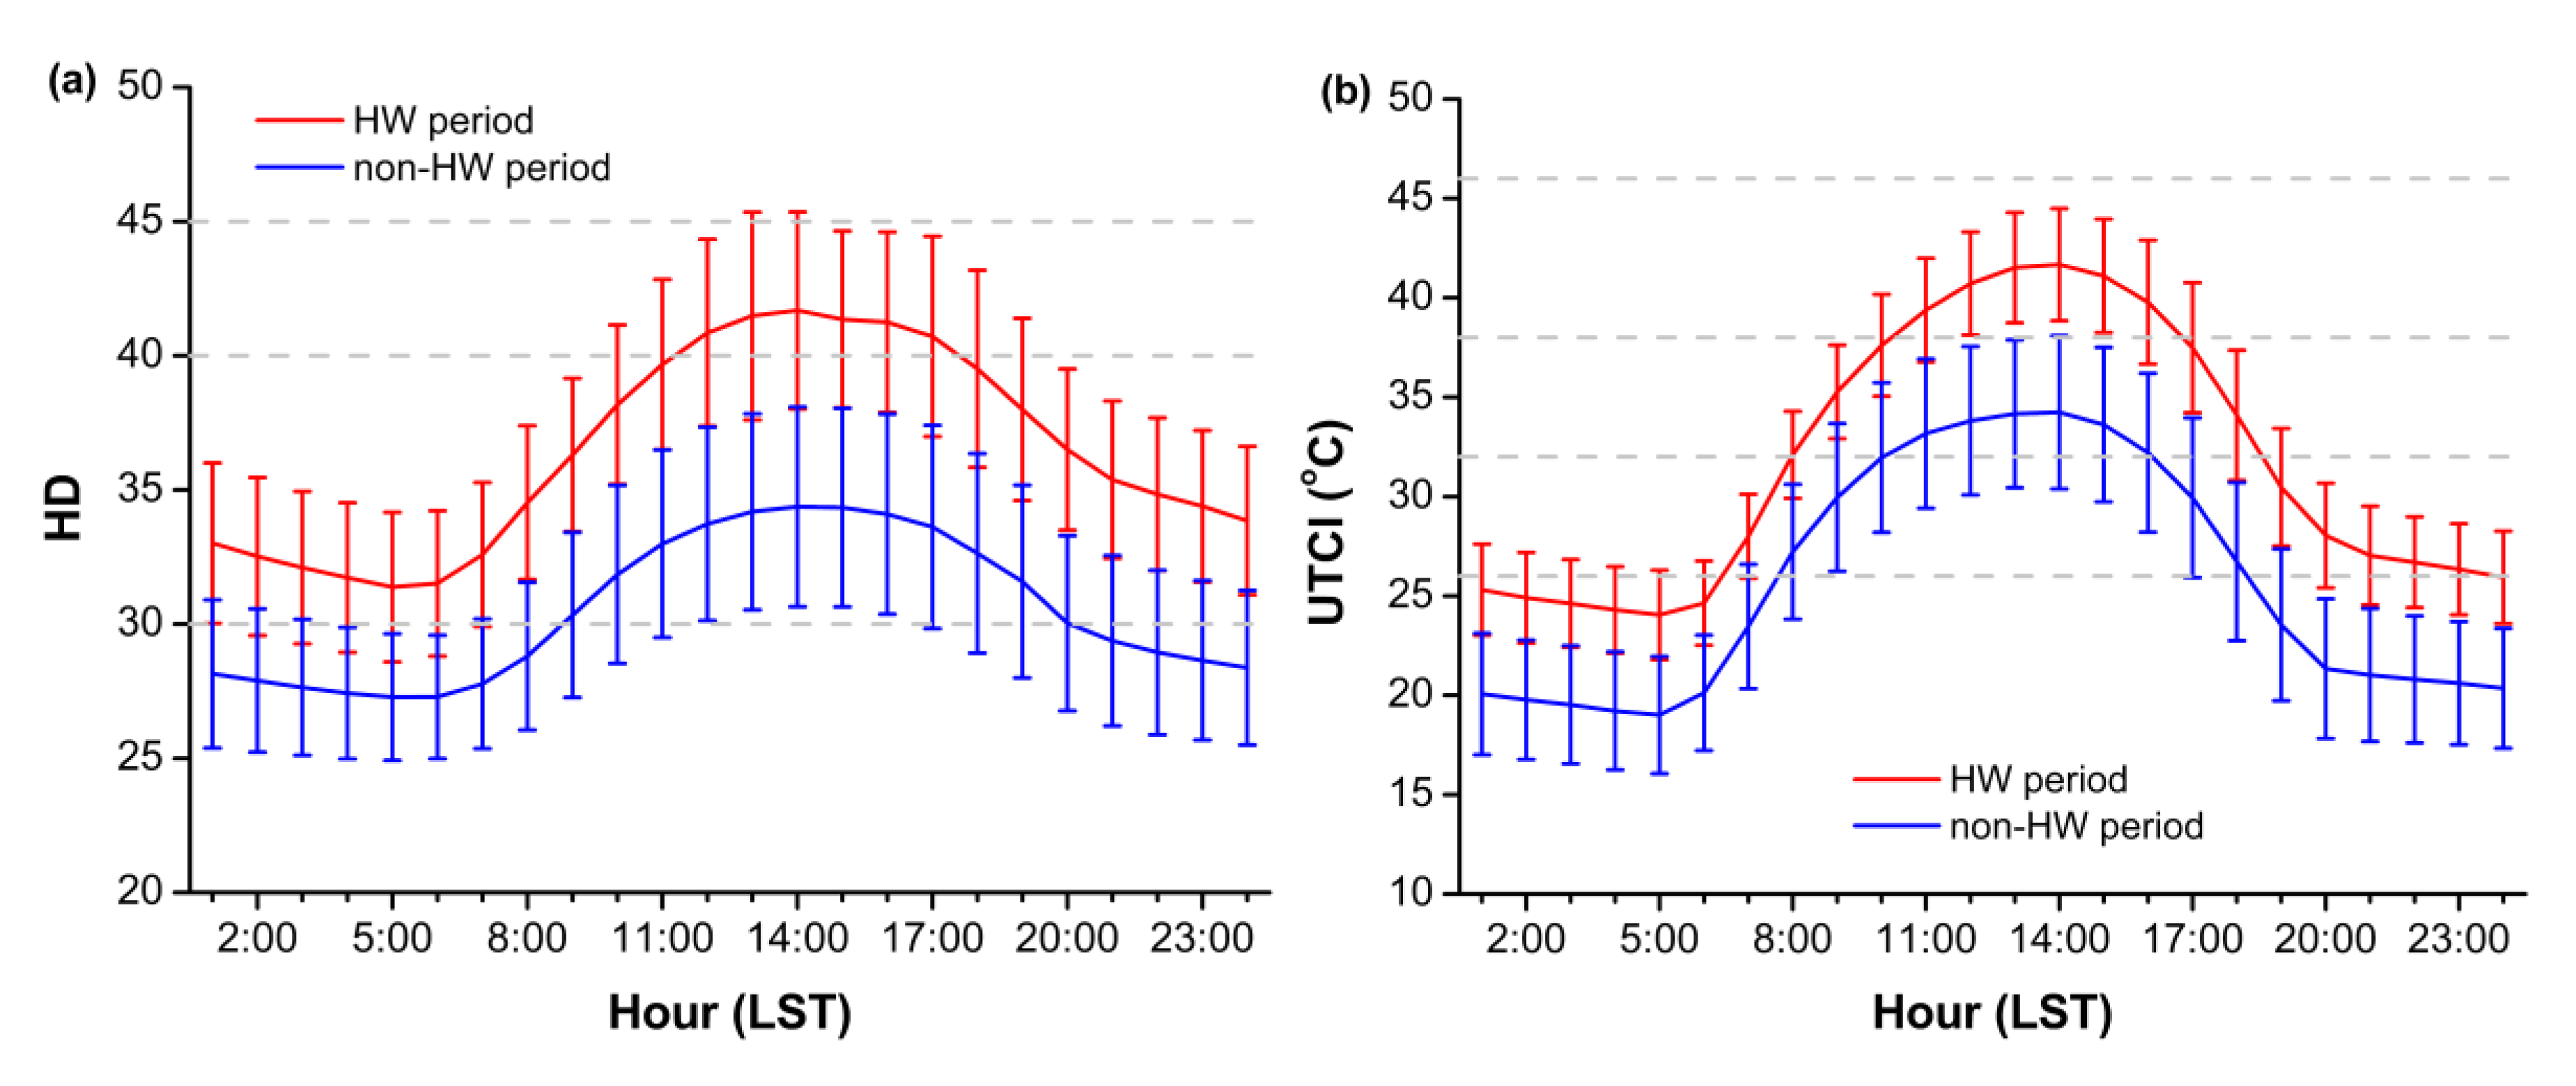
3.2. Changes in Heat Stress between HW and Non-HW Periods

It is interesting to assess and quantify the magnitude of the heat stress change between HW and non-HW periods. To this end, the cumulative distribution function (CDF) curves of the bioclimatic indices (HD and UTCI) were produced during HW and non-HW periods (Figure 4). CDF curves are useful to find probabilities above or below a certain value of the index. The period of HWs refers exclusively to the 46 events of the 1960–2017 period, while the non-HW period refers to the reference period (1971–2000) excluding the detected HWs of that period. The results were based on the hourly time series of the selected indices over these periods. Hence, the CDF curves were the result of applying a number of bins across the range of HD and UTCI hourly time series and estimating the corresponding frequencies.
According to Figure 4, the CDF curves of both indices are shifted noticeably towards higher values of the index during the HW period. This shift is observed not only in the upper but also in the lower levels of the index, which indicates that the heat stress conditions during HWs are significantly worse at nighttime as well, when lower values of the index were observed. The difference between HW and non-HW periods was one or even two stress categories of the index scale, with the exception of percentile ranks at the ends of the distribution. Therefore, significant percentile changes between non-HW and HW periods could be observed across a wide range of UTCI and HD values. In particular, the HD values from 25.5 to 42.5 showed changes of at least 10.0 percentage points between non-HW and HW periods, and this difference reached up to 47.4 percentage points at the 32.5 scale point (some discomfort) (Figure 4a). The results also reveal that the frequency of cases with HD ≥ 40, which indicates at least ‘great discomfort—avoid exertion’ (Table 1), rose up to 23.0% during HWs compared to the frequency of 1.4% which corresponded to non-HW conditions. Regarding the ‘dangerous—heat stroke possible’ category (HD > 45), the frequency reached up to 3.6% in HWs, while it was negligible (0.03%) in non-HW conditions.
For the UTCI, a wider range of values was observed with significant percentile changes between non-HW and HW periods compared to the corresponding range of HD values (Figure 4b). Therefore, UTCI differed by at least 10.0 percentage points in the value range between 17.7 °C and 41.4 °C and the difference reached up to 37.1 percentage points at the first observed peak (23.7 °C) and up to 25.2 percentage points at the second observed peak (35.7 °C). The frequency of cases with UTCI > 38 °C, which indicates at least very strong heat stress (Table 2), reached up to 25.2% in HW period, while the corresponding frequency under non-HW conditions was only 2.6%, indicating a tenfold increase during HWs. In addition, the frequency of cases with UTCI < 26 °C, which suggests no thermal stress, rose up to 57.3% under non-HW conditions compared to the frequency of 27.3% corresponding to the HW period.
Figure 5 presents the mean diurnal variation of thermal stress levels as reflected in UTCI and HD indices during the HW and non-HW periods. The HD results show that ‘great discomfort—avoid exertion’ (HD ≥ 40) was observed between 11:00 and 17:30 local standard time (LST) during the HW period (Figure 5a). On the contrary, there was an absence of ‘great discomfort—avoid exertion’ under non-HW conditions and ‘some discomfort’ (30 ≤ HD < 40) was noted only from 09:00 to 20:00 LST. Although ‘some discomfort’ was observed during daytime under non-HW conditions, the nighttime thermal conditions always indicated ‘no discomfort’. This is particularly important as it suggests that during nighttime the human body can recover from daytime heat stress. As far as the UTCI results are concerned, very strong heat stress was observed between 10:00 and 17:00 LST while strong heat stress was noted from 08:00 to 11:00 LST and from 17:00 to 19:00 LST during the HWs period (Figure 5b). On the contrary, the very strong heat stress category was not recorded under non-HW conditions and only the category of strong heat stress was noted between 10:00 and 16:00 LST.
The diurnal range of both UTCI and HD was higher during the HW period than under non-HW conditions (Figure 5). Thus, the diurnal range of UTCI (HD) was 17.6 °C (10.3) and 15.2 °C (7.1) during the HW and non-HW periods, respectively. It is also noted that the maximum value of mean heat stress (observed during midday hours) was about 7.4 °C and 7.3 scale points higher during HW periods than during non-HW periods for the UTCI and HD, respectively. The corresponding absolute increase for the minimum value of mean thermal stress (observed during nighttime) was approximately 5.0 °C for the UTCI and 4.1 scale points for the HD in HW periods compared to non-HW periods.
Figure 6 presents the total exposure time in hours per HW when people experience heat stress, organized in descending order of CumExc. As already presented in Figure 3, the CumExc refers to the sum of differences between the Tmax and the 95th Tmax percentile threshold for all days of each HW. Based on HD results, the total exposure time when the population experienced at least ‘some discomfort’ (HD ≥ 30) ranged between 40 and 260 h for the detected HWs (Figure 6a). In addition, there were five HWs with no exceedance of the next upper threshold of HD which indicates at least ‘great discomfort—avoid exertion’ (HD ≥ 40) and thus, the exposure time for this threshold ranged from 0 to 98 h. The UTCI results show that the exposure time with at least strong and very strong heat stress varied from 22 to 128 hours and from 1 to 77 h, respectively (Figure 6b).
The general fluctuating pattern of exposure time under heat stress followed to some extent the pattern of CumExc. As the CumExc decreased, the exposure time under heat stress declined as well, however, this was observed for almost the top half of the ranked HWs. Subsequently, the exposure time showed no clear downward trend. The CumExc depended to some extent on the duration of the HW which in turn affected the potential exposure time under heat stress, however, this was not always the case even in HWs with the same duration. Hence, there were HW events with the same duration and significant difference in CumExc but with similar number of hours under heat stress. For example, the HW event that ranked 13th based on CumExc (10.8 °C) had a duration of 4 days and commenced at the end of July 2000 (Figure 6b). During this HW, the number of hours exceeding the analyzed thresholds was 47 h for UTCI > 32 °C and 33 h for UTCI > 38 °C. On the contrary, the HW event that ranked 32nd and took place in early August 2014, showed considerably lower CumExc (3.6 °C) although it lasted longer (5 days), while the number of hours exceeding the analyzed thresholds was similar compared to the number of hours of the HW event that ranked 13th. This is attributed to the fact that the ranking of HWs was based on Tmax exceedances, however, heat stress does not only depend on air temperature as other atmospheric parameters (i.e., relative humidity, wind speed, radiation) play critical roles as well. This implies that even less severe HWs (in terms of intensity and duration) may pose severe heat stress to the population.

3.3. Urban Heat Stress Intensity between HW and Non-HW Conditions

Figure 7 presents the diurnal variation of UHSI as defined in Section 2.3 based on HD and UTCI indices for an exceptional HW and a non-HW period. The HW of June 2007 was selected as the exceptional HW, since it showed the greatest intensity and severity based on both the Tmax (Figure 3) and the frequency of hours under heat stress among the detected HWs (Figure 6). The non-HW period was represented from the same calendar days that correspond to the HW of June 2007, covering the 1985–2010 period (following the data availability of the suburban station) and excluding any HWs that fall in these days. Such an approach expresses the local climatic conditions for the period when the exceptional HW of 2007 took place, excluding the abnormal heat events of this period. A positive UHSI indicates higher heat stress at the urban area compared to the suburban one.
Striking differences of UHSI features between strong HW and non-HW conditions were observed depending on the time of the day (Figure 7). Based on HD results, the magnitude of UHSI held a positive sign of the order of 2.0 scale points with weak diurnal variation during non-HW conditions, suggesting higher heat stress conditions at the urban station throughout the 24-h period (Figure 7a). On the contrary, the diurnal variation of UHSI was markedly modified during the HW episode, showing a strong amplification during nighttime compared to non-HW conditions. The magnitude of UHSI exceeded 7.0 scale points during nighttime, being up to 5.0 scale points greater compared to non-HW conditions. However, UHSI declined significantly during the midday hours (11:00–16:00 LST) and at 14:00 LST, it marginally held a negative sign. This pattern indicates that intense HWs exacerbated urban heat stress during nighttime, while during midday both urban and suburban sites experienced comparable heat stress conditions. It is also worth mentioning that the diurnal pattern of UHSI during HWs resembled to some extent the typical UHII pattern with maxima during nighttime and minima during daytime.
According to UTCI, the magnitude of UHSI revealed strong diurnal variation in non-HW conditions, with positive and higher values up to 4.2 °C occurring during late evening and nighttime hours, suggesting in general higher heat stress at the urban site (Figure 7b). UHSI responded to strong HWs by amplification during nighttime, when its magnitude reached 6.4 °C (being higher by at least 2.0 °C compared to non-HW conditions) and decreased during midday (11:00–16:00 LST). The mean diurnal pattern of the UHSI during the strong HW presented a kind of U-shaped curve, though more flattened than the corresponding steeper curve based on HD. This difference is probably attributed to the impact of insolation and wind on thermal stress, since these variables were incorporated in the UTCI calculations but they were omitted in the HD calculations.
It is noticeable that the diurnal pattern of the UHSI difference between HW and non-HW periods was very similar for the two bioclimatic indices (Figure 7a,b), demonstrating a robust intensification of nighttime heat stress conditions in urban, compared to non-urban, sites during severe HWs. Nevertheless, strong HW conditions attenuated the amplitude of UHSI during midday, almost equalizing the heat stress conditions between urban and non-urban sites. This is not surprising given the fact that severe HWs are commonly associated with large scale atmospheric anomalies and persistent anticyclonic conditions that predominate over more local or mesoscale phenomena like UHIs, and this was particularly the case for the extreme HW of 2007 in Greece [34,59]. Although bioclimatic indices involve additional atmospheric variables apart from the air temperature, the observed findings are in qualitative agreement with relevant studies based on the standard metric of UHI intensity. For example, exceptionally hot conditions in Athens have been found to exacerbate significantly the nocturnal UHI intensity (based on the daily minimum air temperature) in contrast to the daytime UHI intensity (based on the daily maximum air temperature) which remained almost constant or even declined with respect to normal summer conditions [59]. Other relevant studies also report stronger synergistic interactions between UHIs and HWs during nighttime, possibly related to increased heat storage and anthropogenic heat release (use of cooling systems) at the urban versus non-urban areas [24,25,27]. Other key contributors for the interaction between UHIs and HWs concern different evaporating rates and unsymmetrical changes in latent and sensible heat fluxes between urban and non-urban sites [24,25,26]. Advective phenomena and local circulations like sea breezes along with increased evaporation rates at coastal non-urban stations have been also found to cause exacerbation of UHI magnitude during HWs, which is more pronounced in daytime hours [26].

4. Discussion and Conclusions

Heat waves (HWs) represent one of the deadliest natural hazards worldwide, with amplified impacts in urban environments, related to increased population density and the UHI effect. Specific characteristics of HWs such as intensity, duration or seasonal timing combined with population vulnerability have been found to control devastating impacts on human health [2].
The present study focuses on a vulnerable area of the eastern Mediterranean, already characterized as a ‘hot spot’ with respect to heat-related risk [3,31,32,60] and investigates the change in heat stress levels during HW compared to non-HW (normal summer) conditions as well as the way that heat stress levels respond to HWs in an urban, compared to non-urban, environment.
The adoption of a HW metric accounting for both the intensity and duration of the hot event yielded a total of 46 HW episodes over a nearly 60-year period, but with very rare occurrence until the late 1990s and a profound increased frequency thereafter, reaching up to 5 HWs per year. The duration of the detected HWs ranges between 3 to 11 days while the absolute (AbsExc) and cumulative (CumExc) exceedance of Tmax reach up to 7.8 °C and 26.7 °C, respectively. These findings for Athens are similar with the results reported in other Mediterranean or eastern Europe cities. For instance, a significant increase in both the number of HW days and the number of long HWs have been recently reported in Madrid, Palma, Nicosia, Rome, Sofia, Zagreb and Ljubljana [19,61,62].
The UTCI and HD indices were used in the study for the assessment of heat stress levels. The CDF curves under HWs and non-HWs conditions reveal a difference of at least one thermal stress category of the index scale based on both indices. In addition, the shift towards higher thermal risk during HWs is apparent across the entire range of the thermal stress distribution. According to HD, the cumulative probability for dangerous conditions that potentially could lead to heat stroke is negligible during non-HW periods, while the corresponding probability during HW periods is 3.6%. Concurrently, the cumulative probability for at least very strong heat stress according to UTCI is extremely low (2.6%) in non-HW periods, while it represents a significant proportion (25.2%) for HW periods. An important issue concerning humans’ well-being, especially those living and working in densely urban areas, is the time length in the day when the human body attempts to cool down and recover from heat stress [5,63,64]. The analysis reveals that the cumulative probability for no thermal stress (or slight cold stress) shares a significant proportion (57.3%) of the distribution in non-HW periods, while the percentage is significantly reduced to nearly half (27.3%) during HW periods. The latter implies a considerable shrinkage of the time under no thermal stress during HWs compared to non-HW periods.
Another important finding of the analysis concerns the diurnal variation of thermal stress levels during HWs and non-HWs periods. In particular, the analysis revealed higher diurnal range in the index values during the HWs compared to the non-HW periods. The maximum values of heat stress are observed in midday hours with the value during HWs being 7.4 °C for the UTCI and 7.3 scale points for the HD higher compared to the non-HW periods. Both indices suggest very strong heat stress in the midday hours during HWs, but also discomfort conditions even during nighttime hours.
It is also important to stress, that, even HWs considered to be less severe according to the ranking based on CumExc, may pose strong heat stress to population.
Finally, the study explored the possible interactions or synergies between HWs and heat stress difference between urban and non-urban sites, in accordance to recent research concerning interactions between HWs and UHIs. According to recent literature, there is evidence of synergistic interactions between UHIs and HWs, resulting in the exacerbation of UHI intensity during extreme heat events [24,25,26,27,28]. According to other studies, bigger or smaller cities respond differently during HWs in regards to UHI modification [29]. Other studies have found positive response of heat stress to normal summer conditions between urban and non-urban sites especially during midday hours [65]. The question that arises is, how possible UHI amplification during HWs affects thermal comfort in urban and non-urban sites. In this respect, the indicator of ‘Urban Heat Stress Intensity’ (UHSI) was applied, defined as the difference between urban and non-urban thermal stress levels as the latter are reflected by the UTCI and HD indices.
Our analysis indicated a strong synergy between HWs and UHSI resulting in marked amplification of UHSI during nighttime hours. The diurnal pattern of the UHSI difference between HW and non-HW periods is very similar for the two bioclimatic indices, demonstrating a robust intensification of nighttime heat stress conditions in urban compared to non-urban sites during severe HWs. Nevertheless, strong HW conditions attenuate the amplitude of UHSI during midday, almost equalizing heat stress conditions between urban and non-urban sites. The magnitude of UHSI based on UTCI (HD) exceeds 6.0 °C (7.0 scale points) during nighttime, being up to at least 2.0 °C (5.0 scale points) larger compared to non-HW conditions.
A crucial question that arises when bioclimatic indices are applied is if these metrics can efficiently capture and imprint the thermal stress in different thermal conditions compared to the actual human thermal responses. Indices have been designed aiming to achieve this, from the simpler to the more comprehensive indices, regardless of whether they achieve it and to what extent. In addition, even the rational indices which take into consideration the mechanisms of heat exchange and the thermo-physiological process on the human body, as well as behavioral factors, do not take into account psychological and expectation factors. The latter factors seem to affect actual thermal responses of people, playing an important role in thermal comfort [66,67]. Nevertheless, recent studies have shown that UTCI satisfactorily predicts the outdoor thermal comfort, based on questionnaires in China [68], in Hong Kong [69] and in Brazil [70]. In the city of Athens, as the area of interest in this research, the surveys of Pantavou et al. [71,72] have shown a strong association between the predicted classes of UTCI and the thermal sensation votes, while UTCI presents the best applicability in terms of predictions and thermal sensation votes among 54 indices. In addition, the thermal sensation votes are predicted fairly well by the UTCI in the heat stress categories of its assessment scale and the UTCI is the index which best simulates the thermal sensation votes among the studied indices [71,72]. Surprisingly, the simple HD index, which is also employed in our study, predicts relatively well the actual human thermal responses and it is ranked first among indices designed for warm weather conditions [71]. Nevertheless, the shortcomings in HD formulation are mainly related to the inability to account for convective and radiative phenomena and the fact that it was initially designed for temperate climates [22]. It is also worthy to add at this point, that adaptation factor is also important in the perception of the thermal environment and thus, the impact of the same weather conditions in a different temperate climate could possibly be more severe [66,73,74,75].
Our results highlighted the ongoing increasing urban thermal risk, through the increasing frequency of HWs, increasing probabilities for heat stress under HW periods and a positive feedback between HWs and urban heat stress, posing an additional, severe thermal risk to urban population, especially during nighttime.

Author Contributions

Conceptualization, G.K. and D.F.; Methodology, G.K. and D.F.; formal analysis, G.K.; writing—original draft preparation, G.K.; writing—review and editing, D.F.; visualization, G.K.

Funding

This research was funded by the project “THESPIA II—Foundations of synergistic and integrated management methodologies and tools for monitoring and forecasting of environmental issues and pressures” (MIS 5002517) which is implemented under the action “Reinforcement of the Research and Innovation Infrastructure”, funded by the Operational Programme “Competitiveness, Entrepreneurship and Innovation” (NSRF 2014–2020) and co-financed by Greece and the European Union (European Regional Development Fund).

Acknowledgments

The authors would like to thank the Hellenic National Meteorological Service (HNMS) for providing meteorological data for Tatoi station.

Conflicts of Interest

The authors declare no conflict of interest.

References

  1. World Meteorological Organization and World Health Organization. Heatwaves and Health: Guidance on Warning-System Development; McGregor, G.R., Bessemoulin, P., Ebi, K., Menne, B., Eds.; WMO: Geneva, Switzerland, 2015; p. 96. [Google Scholar]
  2. Kalkstein, L.S.; Greene, J.S.; Mills, D.; Perrin, A.; Samenow, J.; Cohen, J.C. Analog European heat waves for U.S. cities to analyze impacts on heat-related mortality. Bull. Am. Meteorol. Soc. 2008, 89, 75–86. [Google Scholar] [CrossRef]
  3. Kuglitsch, F.G.; Toreti, A.; Xoplaki, E.; Della-Marta, P.M.; Zerefos, C.S.; Türkeş, M.; Luterbacher, J. Heat wave changes in the eastern Mediterranean since 1960. Geophys. Res. Lett. 2010, 37, L04802. [Google Scholar] [CrossRef]
  4. Zampieri, M.; Russo, S.; di Sabatino, S.; Michetti, M.; Scoccimarro, E.; Gualdi, S. Global assessment of heat wave magnitudes from 1901 to 2010 and implications for the river discharge of the Alps. Sci. Total Environ. 2016, 571, 1330–1339. [Google Scholar] [CrossRef] [PubMed]
  5. Kjellstrom, T.; Briggs, D.; Freyberg, C.; Lemke, B.; Otto, M.; Hyatt, O. Heat, human performance, and occupational health: A key issue for the assessment of global climate change impacts. Annu. Rev. Public Health 2016, 37, 97–112. [Google Scholar] [CrossRef] [PubMed]
  6. Zhang, Y.; Nitschke, M.; Krackowizer, A.; Dear, K.; Pisaniello, D.; Weinstein, P.; Tucker, G.; Shakib, S.; Bi, P. Risk factors for deaths during the 2009 heat wave in Adelaide, Australia: A matched case-control study. Int. J. Biometeorol. 2017, 61, 35–47. [Google Scholar] [CrossRef]
  7. Lee, D.G.; Kim, K.R.; Kim, J.; Kim, B.J.; Cho, C.H.; Sheridan, S.C.; Kalkstein, L.S.; Kim, H.; Yi, S.M. Effects of heat waves on daily excess mortality in 14 Korean cities during the past 20 years (1991–2010): An application of the spatial synoptic classification approach. Int. J. Biometeorol. 2018, 62, 575–583. [Google Scholar] [CrossRef] [PubMed]
  8. Williams, S.; Venugopal, K.; Nitschke, M.; Nairn, J.; Fawcett, R.; Beattie, C.; Wynwood, G.; Bi, P. Regional morbidity and mortality during heatwaves in South Australia. Int. J. Biometeorol. 2018, 62, 1911–1926. [Google Scholar] [CrossRef]
  9. Borg, M.; Nitschke, M.; Williams, S.; McDonald, S.; Nairn, J.; Bi, P. Using the excess heat factor to indicate heatwave-related urinary disease: A case study in Adelaide, South Australia. Int. J. Biometeorol. 2019, 63, 435–447. [Google Scholar] [CrossRef]
  10. Aboubakri, O.; Khanjani, N.; Jahani, Y.; Bakhtiari, B. The impact of heat waves on mortality and years of life lost in a dry region of Iran (Kerman) during 2005–2017. Int. J. Biometeorol. 2019, in press. [Google Scholar] [CrossRef]
  11. Hwang, M.K.; Bang, J.H.; Kim, S.; Kim, Y.K.; Oh, I. Estimation of thermal comfort felt by human exposed to extreme heat wave in a complex urban area using a WRF-MENEX model. Int. J. Biometeorol. 2019, in press. [Google Scholar] [CrossRef]
  12. Katavoutas, G.; Theoharatos, G.; Flocas, H.A.; Asimakopoulos, D.N. Measuring the effects of heat wave episodes on the human body’s thermal balance. Int. J. Biometeorol. 2009, 53, 177–187. [Google Scholar] [CrossRef] [PubMed]
  13. Green, H.; Bailey, J.; Schwarz, L.; Vanos, J.; Ebi, K.; Benmarhnia, T. Impact of heat on mortality and morbidity in low and middle income countries: A review of the epidemiological evidence and considerations for future research. Environ. Res. 2019, 171, 80–91. [Google Scholar] [CrossRef] [PubMed]
  14. World Meteorological Organization. Guidelines on Analysis of Extremes in a Changing Climate in Support of Informed Decisions for Adaptation; WMO: Geneva, Switzerland, 2009; p. 52. [Google Scholar]
  15. Tolika, K. Assessing Heat Waves over Greece Using the Excess Heat Factor (EHF). Climate 2019, 7, 9. [Google Scholar] [CrossRef]
  16. Robinson, P.J. On the definition of a heat wave. J. Appl. Meteorol. 2001, 40, 762–775. [Google Scholar] [CrossRef]
  17. Matzarakis, A.; Nastos, P.T. Human-biometeorological assessment of heat waves in Athens. Theor. Appl. Climatol. 2011, 105, 99–106. [Google Scholar] [CrossRef]
  18. Smith, T.T.; Zaitchik, B.F.; Gohlke, J.M. Heat waves in the United States: Definitions, patterns and trends. Clim. Chang. 2013, 118, 811–825. [Google Scholar] [CrossRef] [PubMed]
  19. Rasilla, D.; Allende, F.; Martilli, A.; Fernández, F. Heat waves and human well-being in Madrid (Spain). Atmosphere 2019, 10, 288. [Google Scholar] [CrossRef]
  20. De Freitas, C.R.; Grigorieva, E.A. A comprehensive catalogue and classification of human thermal climate indices. Int. J. Biometeorol. 2015, 59, 109–120. [Google Scholar] [CrossRef]
  21. De Freitas, C.R.; Grigorieva, E.A. A comparison and appraisal of a comprehensive range of human thermal climate indices. Int. J. Biometeorol. 2017, 61, 487–512. [Google Scholar] [CrossRef]
  22. Alfano, F.R.D.A.; Palella, B.I.; Riccio, G. Thermal environment assessment reliability using temperature—Humidity indices. Ind. Health 2011, 49, 95–106. [Google Scholar] [CrossRef]
  23. Oke, T.R. The energetic basis of the urban heat island. Q. J. Royal Meteorol. Soc. 1982, 108, 1–24. [Google Scholar] [CrossRef]
  24. Li, D.; Bou-Zeid, E. Synergistic interactions between urban heat islands and heat waves: The impact in cities is larger than the sum of its parts. J. Appl. Meteorol. Climatol. 2013, 52, 2051–2064. [Google Scholar] [CrossRef]
  25. Li, D.; Sun, T.; Liu, M.; Yang, L.; Wang, L.; Gao, Z. Contrasting responses of urban and rural surface energy budgets to heat waves explain synergies between urban heat islands and heat waves. Environ. Res. Lett. 2015, 10, 054009. [Google Scholar] [CrossRef]
  26. Founda, D.; Santamouris, M. Synergies between urban heat island and heat waves in Athens (Greece), during an extremely hot summer (2012). Sci. Rep. 2017, 7, 10973. [Google Scholar] [CrossRef] [PubMed]
  27. Zhao, L.; Oppenheimer, M.; Zhu, Q.; Baldwin, J.W.; Ebi, K.L.; Bou-Zeid, E.; Guan, K.; Liu, X. Interactions between urban heat islands and heat waves. Environ. Res. Lett. 2018, 13, 034003. [Google Scholar] [CrossRef]
  28. Gao, Z.; Hou, Y.; Chen, W. Enhanced sensitivity of the urban heat island effect to summer temperatures induced by urban expansion. Environ. Res. Lett. 2019, in press. [Google Scholar] [CrossRef]
  29. Ramamurthy, P.; Bou-Zeid, E. Heatwaves and urban heat islands: A comparative analysis of multiple cities. J. Geophys. Res. Atmos. 2017, 122, 168–178. [Google Scholar] [CrossRef]
  30. López-Bueno, J.A.; Díaz, J.; Linares, C. Differences in the impact of heat waves according to urban and peri-urban factors in Madrid. Int. J. Biometeorol. 2019, 63, 371–380. [Google Scholar] [CrossRef]
  31. Diffenbaugh, N.S.; Pal, J.S.; Giorgi, F.; Gao, X. Heat stress intensification in the Mediterranean climate change hotspot. Geophys. Res. Lett. 2007, 34, L11706. [Google Scholar] [CrossRef]
  32. Ouzeau, G.; Soubeyroux, J.M.; Schneider, M.; Vautard, R.; Planton, S. Heat waves analysis over France in present and future climate: Application of a new method on the EURO-CORDEX ensemble. Clim. Serv. 2016, 4, 1–12. [Google Scholar] [CrossRef] [Green Version]
  33. Founda, D. Evolution of the air temperature in Athens and evidence of climatic change: A review. Adv. Build. Energy Res. 2011, 5, 7–41. [Google Scholar] [CrossRef]
  34. Founda, D.; Giannakopoulos, C. The exceptionally hot summer of 2007 in Athens, Greece—A typical summer in the future climate? Glob. Planet. Chang. 2009, 67, 227–236. [Google Scholar] [CrossRef]
  35. Nastos, P.T.; Matzarakis, A. The effect of air temperature and human thermal indices on mortality in Athens, Greece. Theor. Appl. Climatol. 2012, 108, 591–599. [Google Scholar] [CrossRef]
  36. Katavoutas, G.; Founda, D. Intensification of thermal risk in Mediterranean climates: Evidence from the comparison of rational and simple indices. Int. J. Biometeorol. 2019, in press. [Google Scholar] [CrossRef] [PubMed]
  37. Hellenic Statistical Authority. Population and Housing Census of 2011. Available online: http://www.statistics.gr/en/2011-census-pop-hous (accessed on 9 April 2018).
  38. Peel, M.C.; Finlayson, B.L.; McMahon, T.A. Updated world map of the Köppen-Geiger climate classification. Hydrol. Earth Syst. Sci. 2007, 11, 1633–1644. [Google Scholar] [CrossRef]
  39. Founda, D.; Kambezidis, H.D.; Petrakis, M.; Zanis, P.; Zerefos, C. A correction of the recent air-temperature record at the historical meteorological station of the National Observatory of Athens (NOA) due to instrument change. Theor. Appl. Climatol. 2009, 97, 385–389. [Google Scholar] [CrossRef]
  40. Kazadzis, S.; Founda, D.; Psiloglou, B.E.; Kambezidis, H.; Mihalopoulos, N.; Sanchez-Lorenzo, A.; Meleti, C.; Raptis, P.I.; Pierros, F.; Nabat, P. Long-term series and trends in surface solar radiation in Athens, Greece. Atmos. Chem. Phys. 2018, 18, 2395–2411. [Google Scholar] [CrossRef] [Green Version]
  41. Russo, S.; Sillmann, J.; Fischer, E.M. Top ten European heat waves since 1950 and their occurrence in the coming decades. Environ. Res. Lett. 2015, 10, 124003. [Google Scholar] [CrossRef]
  42. Kim, S.; Sinclair, V.A.; Räisänen, J.; Ruuhela, R. Heat waves in Finland: Present and projected summertime extreme temperatures and their associated circulation patterns. Int. J. Climatol. 2018, 38, 1393–1408. [Google Scholar] [CrossRef]
  43. Smid, M.; Russo, S.; Costa, A.C.; Granell, C.; Pebesma, E. Ranking European capitals by exposure to heat waves and cold waves. Urban Clim. 2019, 27, 388–402. [Google Scholar] [CrossRef]
  44. Feron, S.; Cordero, R.R.; Damiani, A.; Llanillo, P.J.; Jorquera, J.; Sepulveda, E.; Asencio, V.; Laroze, D.; Labbe, F.; Carrasco, J.; et al. Observations and projections of heat waves in south America. Sci. Rep. 2019, 9, 8173. [Google Scholar] [CrossRef] [PubMed]
  45. Masterson, J.; Richardson, F.A. Humidex, a Method of Quantifying Human Discomfort Due to Excessive Heat and Humidity; Environment Canada: Downsview, ON, Canada, 1979. [Google Scholar]
  46. Environment Canada. Spring and Summer Weather Hazards! Available online: https://ec.gc.ca/meteo-weather/default.asp?lang=En&n=04A1BF3B-1&wbdisable=true (accessed on 17 April 2019).
  47. Fiala, D.; Havenith, G.; Bröde, P.; Kampmann, B.; Jendritzky, G. UTCI-Fiala multi-node model of human heat transfer and temperature regulation. Int. J. Biometeorol. 2012, 56, 429–441. [Google Scholar] [CrossRef] [PubMed]
  48. Havenith, G.; Fiala, D.; Błażejczyk, K.; Richards, M.; Bröde, P.; Holmér, I.; Rintamaki, H.; Benshabat, Y.; Jendritzky, G. The UTCI-clothing model. Int. J. Biometeorol. 2012, 56, 461–470. [Google Scholar] [CrossRef] [PubMed]
  49. Bröde, P.; Fiala, D.; Błażejczyk, K.; Holmér, I.; Jendritzky, G.; Kampmann, B.; Tinz, B.; Havenith, G. Deriving the operational procedure for the Universal Thermal Climate Index (UTCI). Int. J. Biometeorol. 2012, 56, 481–494. [Google Scholar] [CrossRef] [PubMed]
  50. Blazejczyk, K.; Epstein, Y.; Jendritzky, G.; Staiger, H.; Tinz, B. Comparison of UTCI to selected thermal indices. Int. J. Biometeorol. 2012, 56, 515–535. [Google Scholar] [CrossRef] [PubMed]
  51. Matzarakis, A.; Rutz, F.; Mayer, H. Modelling radiation fluxes in simple and complex environments—Application of the RayMan model. Int. J. Biometeorol. 2007, 51, 323–334. [Google Scholar] [CrossRef] [PubMed]
  52. Matzarakis, A.; Rutz, F.; Mayer, H. Modelling radiation fluxes in simple and complex environments: Basics of the RayMan model. Int. J. Biometeorol. 2010, 54, 131–139. [Google Scholar] [CrossRef]
  53. Katsouyanni, K.; Trichopoulos, D.; Zavitsanos, X.; Touloumi, G. The 1987 Athens heatwave. Lancet 1988, 32, 573. [Google Scholar] [CrossRef]
  54. Prezerakos, N.G. A contribution to the study of the extreme heatwave over the south Balkans in July 1987. Meteorol. Atmos. Phys. 1989, 41, 261–271. [Google Scholar] [CrossRef]
  55. Matzarakis, A.; Mayer, H. The extreme heat wave in Athens in July 1987 from the point of view of human biometeorology. Atmos. Environ. 1991, 25, 203–211. [Google Scholar] [CrossRef]
  56. Tolika, K.; Maheras, P.; Tegoulias, I. Extreme temperatures in Greece during 2007: Could this be a “return to the future”? Geophys. Res. Lett. 2009, 36, L10813. [Google Scholar] [CrossRef]
  57. Theoharatos, G.; Pantavou, K.; Mavrakis, A.; Spanou, A.; Katavoutas, G.; Efstathiou, P.; Mpekas, P.; Asimakopoulos, D. Heat waves observed in 2007 in Athens, Greece: Synoptic conditions, bioclimatological assessment, air quality levels and health effects. Environ. Res. 2010, 110, 152–161. [Google Scholar] [CrossRef] [PubMed]
  58. Pantavou, K.; Theoharatos, G.; Mavrakis, A.; Santamouris, M. Evaluating thermal comfort conditions and health responses during an extremely hot summer in Athens. Build. Environ. 2011, 46, 339–344. [Google Scholar] [CrossRef]
  59. Founda, D.; Pierros, F.; Petrakis, M.; Zerefos, C. Interdecadal variations and trends of the urban heat island in Athens (Greece) and its response to heat waves. Atmos. Res. 2015, 161, 1–13. [Google Scholar] [CrossRef]
  60. Guerreiro, S.B.; Dawson, R.J.; Kilsby, C.; Lewis, E.; Ford, A. Future heat-waves, droughts and floods in 571 European cities. Environ. Res. Lett. 2018, 13, 034009. [Google Scholar] [CrossRef]
  61. Morabito, M.; Crisci, A.; Messeri, A.; Messeri, G.; Betti, G.; Orlandini, S.; Raschi, A.; Maracchi, G. Increasing heatwave hazards in the southeastern European Union capitals. Atmosphere 2017, 8, 115. [Google Scholar] [CrossRef]
  62. Founda, D.; Pierros, F.; Katavoutas, G.; Keramitsoglou, I. Observed trends in thermal stress at European cities with different background climates. Atmosphere 2019, 10, 436. [Google Scholar] [CrossRef]
  63. Gabriel, K.M.A.; Endlicher, W.R. Urban and rural mortality rates during heat waves in Berlin and Brandenburg, Germany. Environ. Pollut. 2011, 159, 2044–2050. [Google Scholar] [CrossRef]
  64. Tan, J.; Zheng, Y.; Tang, X.; Guo, C.; Li, L.; Song, G.; Zhen, X.; Yuan, D.; Kalkstein, A.J.; Li, F.; et al. The urban heat island and its impact on heat waves and human health in Shanghai. Int. J. Biometeorol. 2010, 54, 75–84. [Google Scholar] [CrossRef]
  65. Katavoutas, G.; Georgiou, G.K.; Asimakopoulos, D.N. Studying the urban thermal environment under a human-biometeorological point of view: The case of a large coastal metropolitan city, Athens. Atmos. Res. 2015, 152, 82–92. [Google Scholar] [CrossRef]
  66. Nikolopoulou, M.; Steemers, K. Thermal comfort and psychological adaptation as a guide for designing urban spaces. Energy Build. 2003, 35, 95–101. [Google Scholar] [CrossRef]
  67. Lam, C.K.C.; Gallant, A.J.; Tapper, N.J. Perceptions of thermal comfort in heatwave and non-heatwave conditions in Melbourne, Australia. Urban Clim. 2018, 23, 204–218. [Google Scholar] [CrossRef]
  68. Lai, D.; Guo, D.; Hou, Y.; Lin, C.; Chen, Q. Studies of outdoor thermal comfort in northern China. Build. Environ. 2014, 77, 110–118. [Google Scholar] [CrossRef]
  69. Huang, T.; Li, J.; Xie, Y.; Niu, J.; Mak, C.M. Simultaneous environmental parameter monitoring and human subject survey regarding outdoor thermal comfort and its modelling. Build. Environ. 2017, 125, 502–514. [Google Scholar] [CrossRef]
  70. Bröde, P.; Krüger, E.L.; Rossi, F.A.; Fiala, D. Predicting urban outdoor thermal comfort by the Universal Thermal Climate Index UTCI—A case study in Southern Brazil. Int. J. Biometeorol. 2012, 56, 471–480. [Google Scholar] [CrossRef] [PubMed]
  71. Pantavou, K.; Santamouris, M.; Asimakopoulos, D.; Theoharatos, G. Evaluating the performance of bioclimatic indices on quantifying thermal sensation for pedestrians. Adv. Build. Energy Res. 2013, 7, 170–185. [Google Scholar] [CrossRef]
  72. Pantavou, K.; Theoharatos, G.; Santamouris, M.; Asimakopoulos, D. Outdoor thermal sensation of pedestrians in a Mediterranean climate and a comparison with UTCI. Build. Environ. 2013, 66, 82–95. [Google Scholar] [CrossRef]
  73. Keatinge, W.R.; Donaldson, G.C.; Cordioli, E.; Martinelli, M.; Kunst, A.E.; Mackenbach, J.P.; Nayha, S.; Vuori, I. Heat related mortality in warm and cold regions of Europe: Observational study. Br. Med. J. 2000, 321, 670–673. [Google Scholar] [CrossRef]
  74. Baccini, M.; Biggeri, A.; Accetta, G.; Kosatsky, T.; Katsouyanni, K.; Analitis, A.; Anderson, H.R.; Bisanti, L.; D’Ippoliti, D.; Danova, J.; et al. Heat effects on mortality in 15 European cities. Epidemiology 2008, 19, 711–719. [Google Scholar] [CrossRef]
  75. Guo, Y.; Li, S.; Zhang, Y.; Armstrong, B.; Jaakkola, J.J.; Tong, S.; Pan, X. Extremely cold and hot temperatures increase the risk of ischaemic heart disease mortality: Epidemiological evidence from China. Heart 2013, 99, 195–203. [Google Scholar] [CrossRef]
Figure 1. The 95th Tmax percentile-based thresholds on each calendar day of summer over the reference period (1971–2000). The 95th percentile of the reference period was computed from five-day windows producing a sample size of 150 values (30 years × 5 days) centered on each calendar day.
Atmosphere 10 00483 g001
Figure 2. Number of heat waves (HWs) per year over the 1960–2017 period.
Atmosphere 10 00483 g002
Figure 3. Difference between the Tmax and the 95th Tmax percentile threshold expressed as cumulative exceedance (CumExc), defined as the sum of the differences for all days of the HW episode, and as absolute exceedance (AbsExc), defined as the maximum daily difference during the HW episode, organized in descending order of Tmax cumulative exceedance. The duration and the year of appearance are also depicted for each of the 46 HW events of the 1960–2017 period, organized in descending order of Tmax cumulative exceedance (CumExc).
Atmosphere 10 00483 g003
Figure 4. Cumulative frequency of (a) HD; (b) UTCI over the HW period and the non-HW period. The period of HWs refers exclusively to the 46 events of the 1960–2017 period, while the non-HW period refers to the reference period (1971–2000) without the detected HWs of that period. The percentile change between the two considered periods is also illustrated. The vertical dashed lines indicate the thresholds of each index as presented in Table 1 and Table 2.
Atmosphere 10 00483 g004
Figure 5. Averaged diurnal variation of (a) HD; (b) UTCI over the HW period and the non-HW period. The period of HWs refers exclusively to the 46 events of the 1960–2017 period, while the non-HW period refers to the reference period (1971–2000) without the detected HWs of that period. The horizontal dashed lines indicate the thresholds of each index as presented in Table 1 and Table 2.
Atmosphere 10 00483 g005
Figure 6. Time in hours when people are exposed to (a) HD ≥ 30, HD ≥ 40; and (b) UTCI > 32 °C, UTCI > 38 °C for each of the 46 HW events of the 1960–2017 period, organized in descending order of Tmax cumulative exceedance (CumExc).
Atmosphere 10 00483 g006
Figure 7. Diurnal variation of ‘Urban Heat Stress Intensity’ (UHSI) based on (a) HD; (b) UTCI for the exceptional HW of June 2007 and for a non-HW period which is represented from the calendar dates of June 2007 HW covering the 1985–2010 period excluding any HWs that falls in these days. The UHSI is quantified by the difference of heat stress between the urban station of NOA and the suburban station of Tatoi.
Atmosphere 10 00483 g007
Table 1. Degree of comfort according to Humidex (HD) [46].
HDDegree of Comfort
>45Dangerous—heat stroke possible
40–45Great discomfort—avoid exertion
30–39Some discomfort
≤29No discomfort
Table 2. Thermal stress categories according to Universal Thermal Climate Index (UTCI) [49].
UTCI (°C)Stress Category
>46Extreme heat stress
38–46Very strong heat stress
32–38Strong heat stress
26–32Moderate heat stress
9–26No thermal stress
0–9Slight cold stress
−13–0Moderate cold stress
−27–−13 Strong cold stress
−40–−27 Very strong cold stress
<−40Extreme cold stress

