Article

Objective Center-Finding Algorithm for Tropical Cyclones in Numerical Models

College of Meteorology and Oceanography, National University of Defense Technology, Changsha 410073, China
*
Author to whom correspondence should be addressed.
Atmosphere 2019, 10(7), 376; https://doi.org/10.3390/atmos10070376
Submission received: 5 June 2019 / Revised: 2 July 2019 / Accepted: 3 July 2019 / Published: 5 July 2019
(This article belongs to the Section Meteorology)

Abstract

:
Precise center-detection of tropical cyclones (TCs) is critical for dynamic analysis in high resolution model data. The existence of both smaller scale perturbations and larger scale circulations could reduce the accuracy of center positioning. In this study, an objective center-finding algorithm is developed based on a two-dimensional Fourier filter and a vorticity centroid algorithm. This proposed algorithm is able to automatically adjust its parameters according to the scale of the target vortex instead of using artificially prescribed parameters in previous research. What’s more, this new algorithm has been optimized and validated by a hundred idealized vortexes with different sizes and small-scale perturbations. A high-resolution simulation of Typhoon Soudelor (2015) was used to evaluate the performance of the new algorithm, and the proposed objective center-finding algorithm was found able to detect a precise and reliable center.

1. Introduction

Detecting and tracking the rotational center of tropical cyclones (TC) are critical for objective TC-intensity estimation [1,2], the detection of rapid intensification [3], dynamic diagnosis [4,5,6] and TC climatological descriptions [7,8,9,10,11]. Studies have shown that the overall conclusions could be heavily sensitive to the accuracy of the center [12,13], because positioning the center is the initial step in most of the applications. Thus, the need has arisen for the improvement and sophistication of the center-finding algorithm.
At present, most algorithms used for detecting TC center are based on Doppler radar [14], visible and infrared imageries [13,15,16,17], microwave radiometers and synthetic aperture radar (SAR) [18,19,20]. For instance, Wood [21] estimated the rotational center by fitting the Doppler velocity field to an idealized Rankine vortex. Similarly, by fitting multiple-Doppler radar or model data to a simple analytical model, Potvin et al. [22,23] presented an objective algorithm to detect mesoscale convective vortices. Lee et al. proposed the velocity track display (VTD) technique to extract real-time tropical cyclone circulations using a single Doppler radar and retrieved the kinematic structure of Typhoon Alex (1987) with an improved VTD-simplex algorithm [24,25]. Detecting methods applied to satellite images were designed based on the structure and organization of cloud features. Wimmers and Velden constructed an automated rotational center hurricane eye retrieval (ARCHER) method using a combination of the brightness temperature gradients in the TC banding patterns and the ring-shaped edge of a possible eye [18]. Recently, they improved the ARCHER algorithm by considering a larger set of satellite based imageries [13]. Zheng et al. proposed two newly developed algorithms by using different image operators to extract eyes from SAR images and found that the TC centers from best track (BT) data were closer to the locations extracted from SAR images than those from infrared (IR) images [26]. However, there are potential uncertainties in the center position calculated by algorithms of the VTD family when asymmetric convections embedded in the primary TC circulation. A larger inconsistency exists among algorithms based on the spiral feature of cloud and ring-like eyewall when the TC is weak or the eyewall is not closed.
Simulations in both high-resolution numerical weather models and climate models are commonly used for studying the evolution and thermal-dynamics of TCs [4,5]. The centers can be directly determined by analyzing the model outputs. Ryglicki and Hart classified the commonly used algorithms into three groups: local extreme (LE), weighted grid point (WGP), and minimization of azimuthal variance (MAV) [27]. For example, Jones defined the TC center as the position of the lowest sea level pressure (SLP), which was regarded as an LE algorithm [28]. Hsiao et al. used the maximum vorticity at low levels [29]. Meanwhile, many scholars preferred to use a WGP algorithm such as a vorticity centroid method [30,31]. Braun detected the center position of a TC using a MAV algorithm where the center was defined as the position minimizing the azimuthal pressure variance [32]. Center positions calculated by the different algorithms were found to be not identical, especially under finer resolutions [33]. A small displacement in the center position could bring significant differences in the structure of asymmetries and the contributions of wave-mean interactions [34,35]. Therefore, it is necessary to identify the advantages and disadvantages of the existing algorithms.
The LE algorithms were found to be unstable in high-resolution where serious convective systems were embedded in TCs [36]. Meanwhile, the size of weight area for a WGP algorithm has not reached an agreement yet [27]. Zou et al. pointed out that the centroid method was affected by small-scale perturbation when applied to detect the center of a landed TC [37]. A larger weighted area (domain) was chosen when the influence from the outer area of a TC was taken into consideration [38]. Meanwhile, the MAV algorithms could be inaccurate in situations such as strong convective vortices located in and around the eyewall, double eyewall with comparable tangential wind speed, and weak radial gradient of azimuthal mean tangential wind. After evaluating several algorithms with simulated TCs, Nguyen et al. recommended using a pressure centroid algorithm in high-resolution models because of its benefits in producing a smooth track and a smoothly varied vertical tilting [33]. Ryglicki et al. also concluded that algorithms calculated with mass fields exhibited the smallest vertical tilts for hurricane-strength TCs, while potential vorticity centroids with large weighted area produced the largest tilts [27]. Besides, it should be remembered that evaluating the accuracy of a center-finding algorithm in a real TC is impossible, as there was no standard definition of a TC’s center and the best track datas from different operational agencies were found to be inconsistent with an averaged difference of 20 km [12]. Therefore, how to evaluate the performance of a center-finding algorithm remains to be discussed.
Luckily, an agreement has been reached that the performance of center-finding algorithms become less accurate in the presence of small-scale perturbations. To eliminate the local extremes, Stern and Zhang smoothed the pressure field before finding the point with minimum pressure value [39]. Zou et al. used a Barnes filter to remove small-scale perturbations [37]. By taking operations such as smoothing and filtering before applying a LE algorithm, algorithms could be certainly classified into a WGP algorithm. Meanwhile, the basic issue for a WGP algorithm is how to determine the weight area. A wider weight area was considered by Reasor et al. when using a centroid method to eliminate the influence of small-scale perturbaitions [38]. Davis et al. applied different weight areas based on the size of target TC [40]. Besides, the dispersion of center locations calculated by a various of algorithms was found to be larger at a higher level where large-scale circulation may exist [33]. In other words, the accuracy of the center-finding algorithm could be affected by large scale circulations as well. This leads to a couple of questions–How to eliminate the influences of both smaller and larger scale circulations to improve the accuracy of a center-finding algorithm? How to select parameters such as the weight area objectively and automatically?
Aiming to explore the two speculations, this paper introduces an objective center-finding algorithm. A two-dimensional Fourier filter is applied to eliminate small-scale perturbations, and retrieve the primary symmetric circulation of a TC. After that, a vorticity centroid algorithm is used to detect the precise center position. The control parameters include the domain size of the Fourier filter, truncated wave size and searching radius of the centroid algorithm. This algorithm is designed to automatically adjust these parameters according to the scale of a target vortex, rather than using prescribed settings.
The rest of this paper is organized as follows. Section 2 introduces the components of the new algorithm. The construction of idealized vortexes regarded as benchmarks for optimizing and validating the algorithm is described in Section 3. The new algorithm is optimized and validated using constructed benchmarks in Section 4. The new algorithm is then applied to a high-resolution model simulation of Typhoon Soudelor (2015) in Section 5. Conclusions are given at last in Section 6.

2. Description of the Objective Center-Finding Algorithm

The new algorithm aims to find the center of a symmetric vortex in complicated situations such as asymmetric convections at different small scales, large scale circulations and other cyclonic vortex in a comparable scale. According to the low-order model of Potvin et al., the wind fields are decomposed into a modified combined Rankine vortex and a background flow [22,23]. The latter is considered as the sum of a spatially constant flow, linearly sheared flow, and linearly divergent flow in the low-order model. Considering that vorticity induced by a spatially constant flow equals to zeros, and that by a linearly sheared flow is constant, the low-order model could be simplified by a low-order vorticity model. Therefore, this new algorithm prefers to vorticity field instead of wind fields to detect center.
The vorticity field containing at least a cyclonic vortex could be decomposed into three parts, a modified Rankine vortex (symmetric vortex), asymmetric perturbations and vorticity from large scale circulations. Vorticity from large scale circulation is supposed constant within a ‘small’ area. In other words, it could be eliminated by removing the domain mean. Meanwhile, the asymmetric vorticity perturbations in a TC vortex are supposed to be at smaller scale than the corresponding symmetric part. Therefore, retrieving the major vorticity field of the symmetric vortex by eliminating asymmetric perturbations is the goal of the objective center-finding algorithm. Besides, this new algorithm is also designed to be able to detect multiple TCs even when they are close to each other. The procedure is as follows.
  • Step 1. Detection potential cyclonic vortex
    Detecting potential vortex is the fundamental step towards finding the location of centers in the existence of multiple cyclonic vortexes. Similar to the criteria used in previous research, the grid point whose smoothed pressure or geopotential height is lower than its eight surroundings is determined as a candidate for a potential cyclonic vortex center [41,42]. For simplicity, the field is smoothed by a nine-point averaged operator. Meanwhile, the radius of maximum azimuthal mean tangential wind (RMMTW) and maximum azimuthal tangential wind (MMTW) are calculated for each candidate. A candidate will be disqualified once if its MMTW is found lower than a prescribed value (for instance, category 1 vortex defined by the Saffir-Simpson hurricane wind scale was used in this manuscript). The precise center position of potential vortex will be detected by the following two steps, individually.
  • Step 2. Removing small scale perturbations
    Vorticity in a square area centered at each candidate is selected, and it is on this area where a two-dimensional Fourier transformation is carried on. The domain size varies among different candidates as it is supposed to be relative to the estimated RMW of the target vortex. The Fourier coefficients are computed as follows:
    F ( u , v ) = 1 / ( M · N ) x = 0 M 1 y = 0 N 1 f ( x , y ) e i 2 π v y / N e i 2 π u x / M , u = 0 , , M 1 ; v = 0 , , N 1
    where F is the Fourier coefficients. M and N are domain sizes in direction x and y, respectively. As the domain is chosen as a square area, M equals to N. The wavenumber in x and y direction is represented by u and v. Besides, the space resolution is supposed to be equal in both directions. To remove smaller-scale perturbations, Fourier coefficients are set to be 0 where its wave length ( λ u , v ) is shorter than a prescribed scale ( λ 0 ), where λ u , v is defined as ( M · d x u ) 2 + ( N · d y v ) 2 ) . The filtered coefficients are defined in Equation (2).
    F ( u , v ) ¯ = 0 i f λ u , v < λ 0 F ( u , v ) ¯ = F ( u , v ) i f λ u , v > = λ 0
    The filtered vorticity field is obtained by applying an inverting Fourier transformation with the modified Fourier coefficients. The inverted Fourier transformation is described in Equation (3).
    f ( x , y ) = u = 0 M 1 v = 0 N 1 F ( u , v ) ¯ e i 2 π v y / N e i 2 π u x / M , u = 0 , , M 1 ; v = 0 , , N 1 .
  • Step 3. Determining the vortex center
    A centroid algorithm is applied to the filtered vorticity filed to determine the final center of the vortex. The centroid algorithm is briefly illustrated in Equation (4),
    x ¯ = r = 0 r = R x i ξ i r = 0 r = R ξ i and y ¯ = r = 0 r = R y i ξ i r = 0 r = R ξ i ,
    where x ¯ and y ¯ represent the location of center in x and y direction, respectively. R represents the searching radius, and ξ with a subscript i represents vorticity at each grid within the searching radius. There are only two parameters (an initial guess center and a searching radius R) involved in a centroid algorithm. The guess center is chosen as the position of the candidate calculated in step 1. Meanwhile, the searching radius is objectively defined according to the scale of target vortex which will be illustrate in the Section 4.
This objective center-finding algorithm applies pressure field, wind fields and vorticity field together to determine centers of cyclonic vortexes. By involving the first step, the algorithm is able to detect multiple cyclones even when they are close. A two-dimensional Fourier filter based on automatically adjusted wave-length is applied to eliminate small-scale perturbations, and retrieve the primary symmetric circulation of each target vortex in step 2. Finally, the center is detected by applying a vorticity centroid algorithm in step 3. It should be noted that parameters involved in the new algorithm are automatically adjusted according to the scale of a target vortex rather than artificially defined as constant values.

3. Construction of Idealized Vortexes

The center of a tropical cyclone is usually defined by the location of minimum wind or minimum pressure. Meanwhile, the local maxima of relative vorticity could also be used to identify the center. As there is no standard definition of a TC’s center, and centers defined by a variety of center-finding algorithms are not identical, defining a center under idealized vortexes offer an option to evaluate the performance of center detecting algorithm. Idealized cyclonic circulations were supposed to be constructed by four individual parts in a cylindrical coordinate—the symmetric tangential wind, the symmetric radial wind, environment flow, and the isolated nondivergent asymmetric perturbations. The center of a cyclonic vortex is defined as the center of its symmetric vortex.
The environment flow is supposed to be a summary of a linear sheared flow and a uniform flow which introduces a constant vorticity at each point. It is also supposed that the symmetric radial wind is represented by a lognormal function profile, which has no influence on vorticity. Besides, according to previous research, adding the symmetric radial wind does not affect the computation of RMMTW and MMTW [34]. Therefore, neither the symmetric radial wind or the environment flow is initialized when an idealized vortex is constructed, as they have no influence on the performance of a vorticity based center-finding algorithm. The initialization of the idealized vortex is illustrated as follows.
Firstly, the symmetric vortexes are constructed by vorticity-based profiles. The profile that was used to generate a Rankine-like vortex in previous studies smoothly connects radial intervals of constant vorticity with relatively low values at the eye, and the highest value at the eyewall annulus [43,44]. The formula is described in Equation (5),
ζ ¯ ( r ) = ζ 1 0 r r 1 d 1 ζ 1 S ( ( r r 1 + d 1 ) / 2 d 1 ) + ζ 2 S ( ( r 1 + d 1 r ) / 2 d 1 ) r 1 d 1 r r 1 + d 1 ζ 2 r 1 + d 1 r r 2 d 2 ζ 2 S ( ( r r 2 + d 2 ) / 2 d 2 ) + ζ 3 S ( ( r 2 + d 2 r ) / 2 d 2 ) r 2 d 2 r r 2 + d 2 ζ 3 r 2 + d 2 r r 3 d 3 ζ 3 S ( ( r r 3 + d 3 ) / 2 d 3 ) r 3 d 3 r r 3 + d 3 0 r 3 + d 3 r
where S ( x ) = 1 3 x 2 + 2 x 3 is the cubic Hermitian polynomial. Values for each of the ζ i , r i , d i , r i and d i can be changed to represent a hurricane-like vortex with a variety of strengths and various distributions. It is the radial distribution of vorticity rather than its amplitude that needs to be paid attention in validating the center finding algorithm. Therefore, ζ 1 , ζ 2 and ζ 3 are set to 5 × 10 4 s 1 , 2.5 × 10 3 s 1 and 1.0 × 10 4 s 1 , respectively.
The symmetric tangential winds were initialized on a high-resolution cylindrical grid, which was 0.5 km in radius and π / 360 in radians. Once initialized, the fields on the cylindrical grid were interpolated onto a Cartesian grid using a bi-cubic interpolation. The Cartesian grid was set as 1 km in space to emulate the finer structure of tropical cyclones. The tangential winds were also transformed into Cartesian winds. It was on this Cartesian grid that the center was detected by center-finding algorithms.
Secondly, to simulate the asymmetric structure of a cyclonic vortex, idealized vortexes are constructed by adding isolated asymmetries to symmetric vortexes. Asymmetries are defined as Gaussian-type perturbations in the streamfunction given as follows:
ψ ( r , λ ) = A exp ( ( r b ) 2 2 c 2 ) cos ( n ( λ φ ) ) ,
where A is the wave amplitude and b is the radial location of asymmetries relative to the vortex center. c, n, λ , and φ represent the radial width, azimuthal wavenumber, azimuth angle, and wave phase, respectively.
To initialize the nondivergent asymmetries, the symmetric vortex was first converted into the streamfunction by inverting the relationship, ζ ¯ ( r ) = ψ ¯ ( r ) . The distribution of ψ ¯ in the prescribed high-resolution cylindrical grid was numerically computed by supposing the streamfunction at the outer boundary to be 0. Then, the full wind and vorticity were calculated from the total streamfunction filed, including both ψ ¯ and ψ , by solving a Laplace equation. Once initialized, the fields on the cylindrical grid were interpolated onto the Cartesian grid.
To generate a variety of different vortexes, parameters controlling the radial location and the range and strength of Gaussian-type asymmetries were ‘randomly’ chosen under certain restrictions. So does the number of asymmetries. Meanwhile, parameter r 2 of the symmetric vortex is also ‘randomly’ chosen to generate symmetric vortexes at different scales. The restrictions for each of these parameters are listed in Table 1.
A hundred different vortexes were constructed as benchmarks to optimize and validate the performance of the objective center-finding algorithm. The RMWs of these vortexes varied between 30 km to 45 km. Meanwhile, large differences were found in the amplitude and radial structure of asymmetric perturbations. The first 50 vortexes (hereafter, training group) were used for optimization, and the last vortexes (hereafter, testing group) were used for validation in Section 4.
For instance, the wind structures of one in the hundred vortexes were displayed in Figure 1. A polygon vorticity field was found around the real center. The maximum vorticity was 2.64 × 10 3 s 1 , and the maximum wind speed was 33.4 m s 1 . Negative perturbations in vorticity were located just outside the RMW. This vortex could represent a category 1 tropical cyclone with small scale convections at RMW.
It should be noted that a pressure or geo-potential height field was needed to detect the candidates of potential cyclonic vortexes. However, neither of them was provided by the initialization procedure. Therefore, the streamfunction was used instead of a pressure field.

4. Algorithm Optimization and Validation

There are three parameters involved in the proposed algorithm: (1) the domain size where two-dimensional Fourier transformation is carried on, (2) the truncated scale used to filter perturbations, and (3) the searching radius for a vorticity centroid algorithm. The object of this section is to find the optimum values of the three parameters with fifty realistic vortexes in the training group. Then, the optimized algorithm is validated and compared with a centroid algorithm with the testing group.

4.1. Method

Centers are calculated by a variety of new algorithms with different settings of the three parameters. Table 2 shows the range of each parameter, and a total number of 252 testing algorithms are generated accordingly. It should be noted that the ranges of each parameter could be set larger and finer, the main conclusions remain unchanged.
The center position of each vortex in the training group is detected by the 252 testing algorithms, simultaneously. Considering the size of the vortexes in the training group varies, the three parameters are normalized by the RMW of the target vortex to eliminate difference in the scale of the target vortex. Statistics of the position error are carried on according to the three normalized parameters rather than their physical values. The medium, 25 % and 75 % percentiles of the position error are used to evaluate the accuracy, in addition to the group mean and standard deviation.

4.2. Algorithm Optimization

4.2.1. The Domain Size

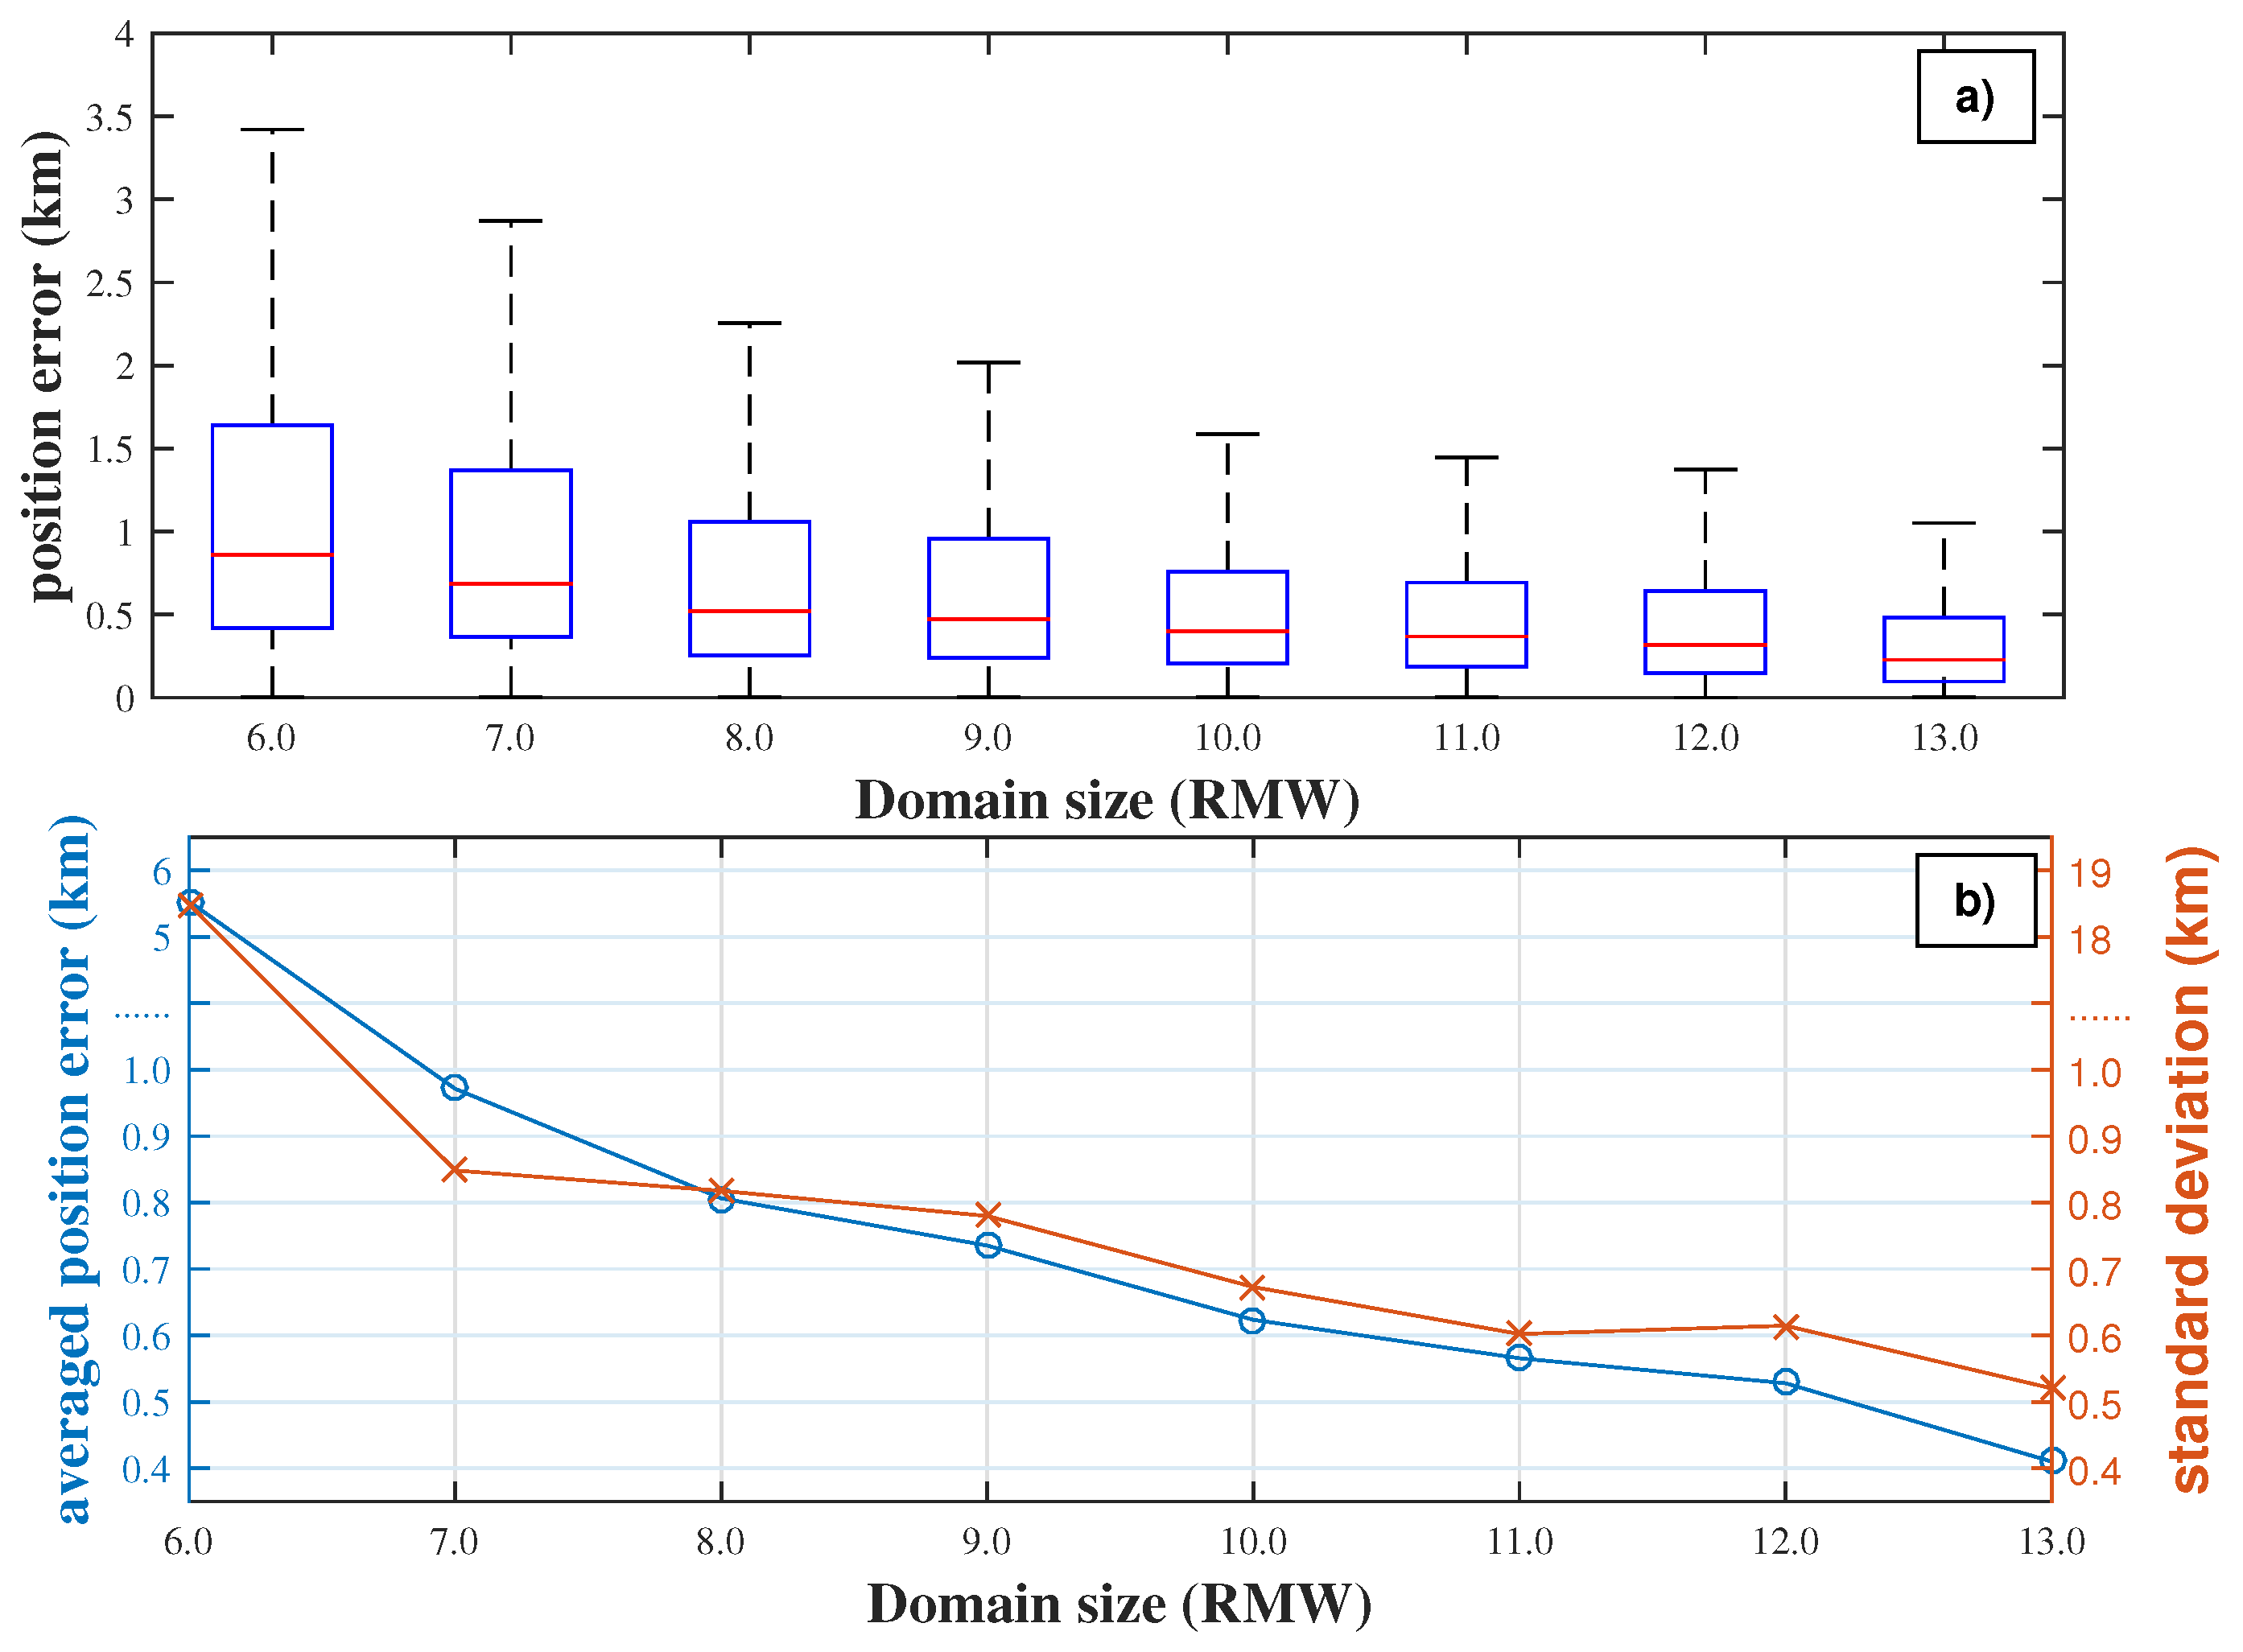
The performance of the proposed algorithm is evaluated by the domain size at first. Figure 2a is the ‘boxplot’ of position error where the medium value in each group is marked in a red line [45]. The edges of the box are the 25 t h percentile and 75 t h percentile, the whiskers extend to the most extreme position error excluding the outliers. Meanwhile, the outliers are defined as follows:
V a l u e > Q 3 + 1.5 × ( Q 3 Q 1 ) or V a l u e < Q 1 1.5 × ( Q 3 Q 1 ) ,
where Q 1 and Q 3 are the 25 t h and 75 t h percentiles, respectively.
According to Figure 2a, the medium position error decreases from 0.76 km to 0.3 km with an increasing of normalized domain size, and it varies a little when normalized domain size is larger than 8 RMW. The medium position decreases 20 % when the domain size increases from 7 RMW to 8 RMW. Meanwhile, the decline rate of medium error is less than 10 % once the domain size is lager than 8 RMW. The lowest position error seems to be not sensitive to the domain size as it is close to zero at each group. So does the 25 t h percentile of position error when the domain size is larger than 8 RMW. The 75 t h percentile of position error decreases a little when the normalized domain size is larger than 10 RMW. Both the group mean and standard deviation in Figure 2b share a similar distribution with the medium position error. The group mean of position error decreases from 5.5 km to 0.41 km when the domain size increases from 6 RMW to 13 RMW. Besides, the group mean and standard deviation are much larger when domain size is smaller than 7 RMW. Therefore, it can be concluded that the performance of the proposed algorithm is sensitive to choice of the domain size which is also relative to the scale of the symmetric vortex. The larger the domain size is, the better the algorithm performs.
In practice, as the ‘true’ RMW of the target vortex is unknown, estimated RMW of the target vortex is considered as an alternative. The mean difference between the estimated RMW and the ‘true’ RMW is found quite small (less than 0.11 RMW), which is consistent with conclusions of Ryglicki et al. [34]. Considering that the large scale circulation is supposed to be uniformed in a ‘small’ area, it is reasonable that the domain size is set as ten times of the estimated RMW for both the computation efficiency and accuracy.

4.2.2. The Truncated Scale

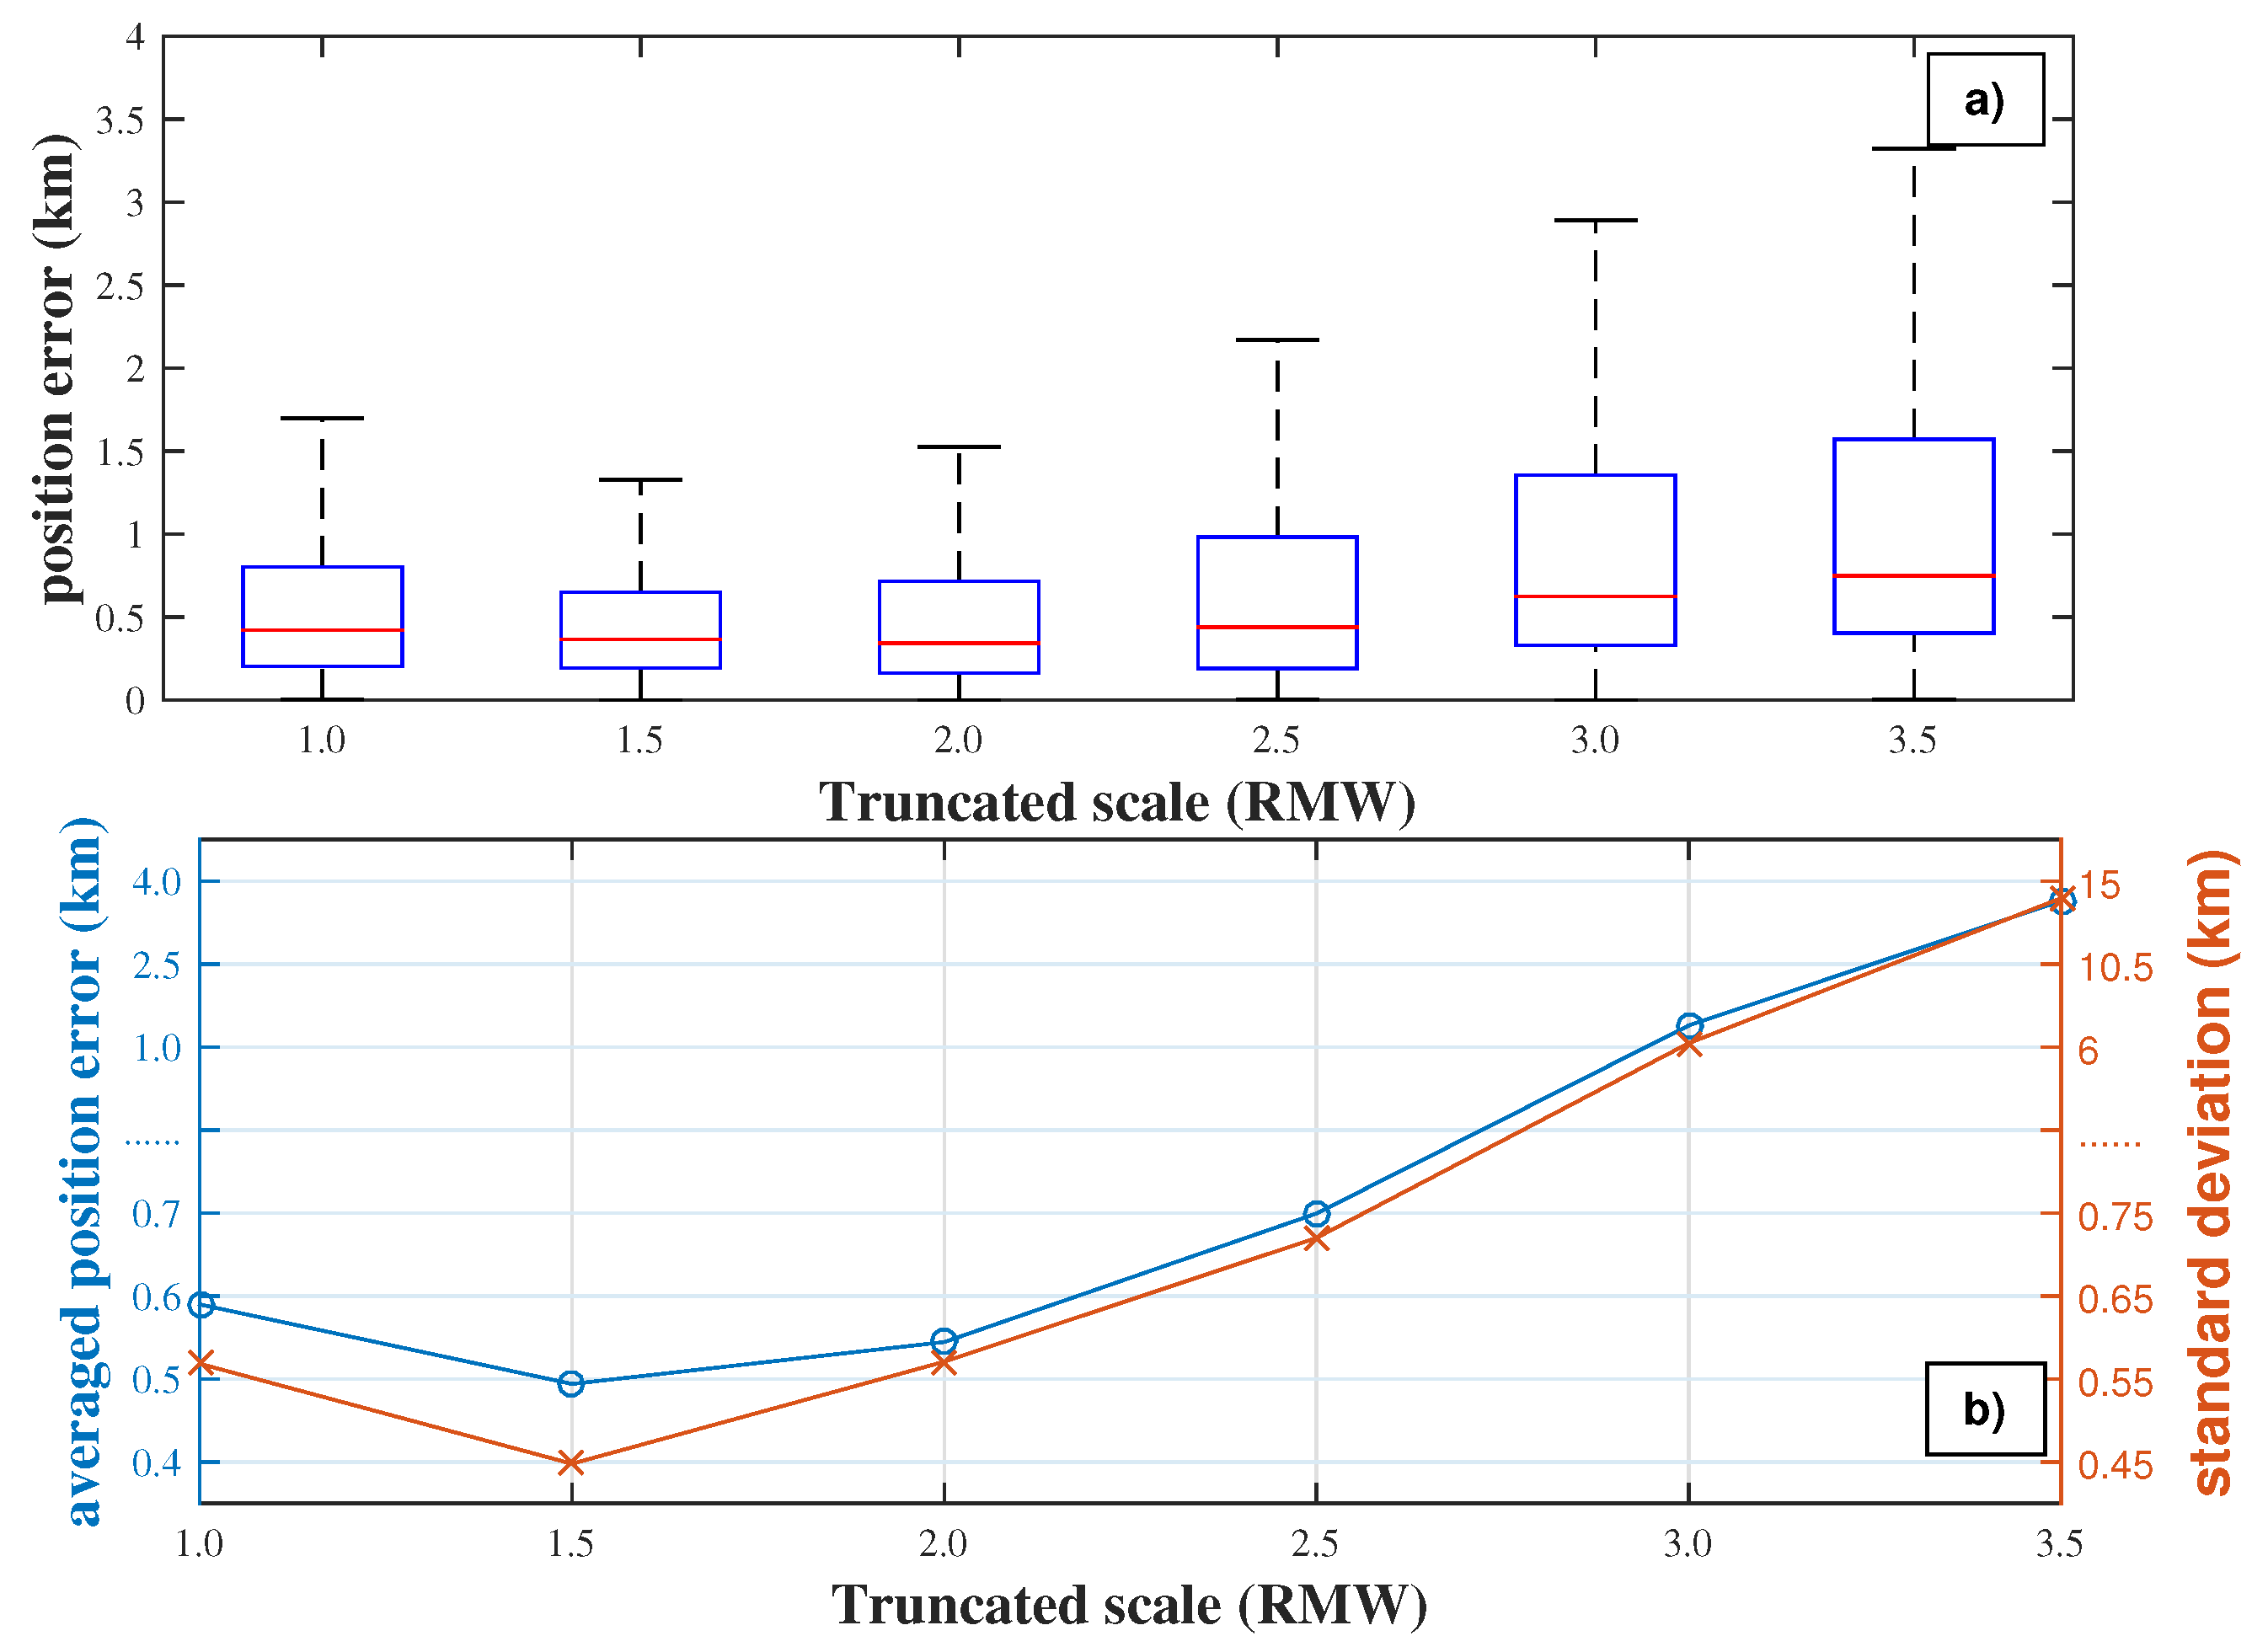
Position error of the proposed algorithm is examined with the training vortexes based on the truncated scale. As shown in Figure 3a, the medium position error increases from 0.37 km to 0.75 km when the normalized truncated scale increases from 1.5 RMW to 3.5 RMW. Meanwhile, the minimum position error does not vary significantly. The 25 t h percentile of position error is close to 0.2 km when the normalized truncated scale is less than 2 RMW, and it increases with truncated scale after then. The 75 t h percentile of position error is close to 0.7 km when the normalized truncated scale is between 1.0 RMW and 2.0 RMW. After that it increases with the growing of the truncated scale. Both the group mean and standard deviation grow with the increasing of the truncated scale once the truncated scale is larger than 1.5 RMW. Therefore, it can be concluded that the performance of the proposed algorithm is sensitive to the choice of truncated scale as well. Perturbations whose wave length are smaller than 1.5 RMW should be eliminated to retrieve the primary symmetric vortex and improve the accuracy of the new algorithm. Therefore, the optimized truncated scale is chosen to be 1.5 times of the estimated RMW of the target vortex in the proposed algorithm.

4.2.3. The Searching Radius

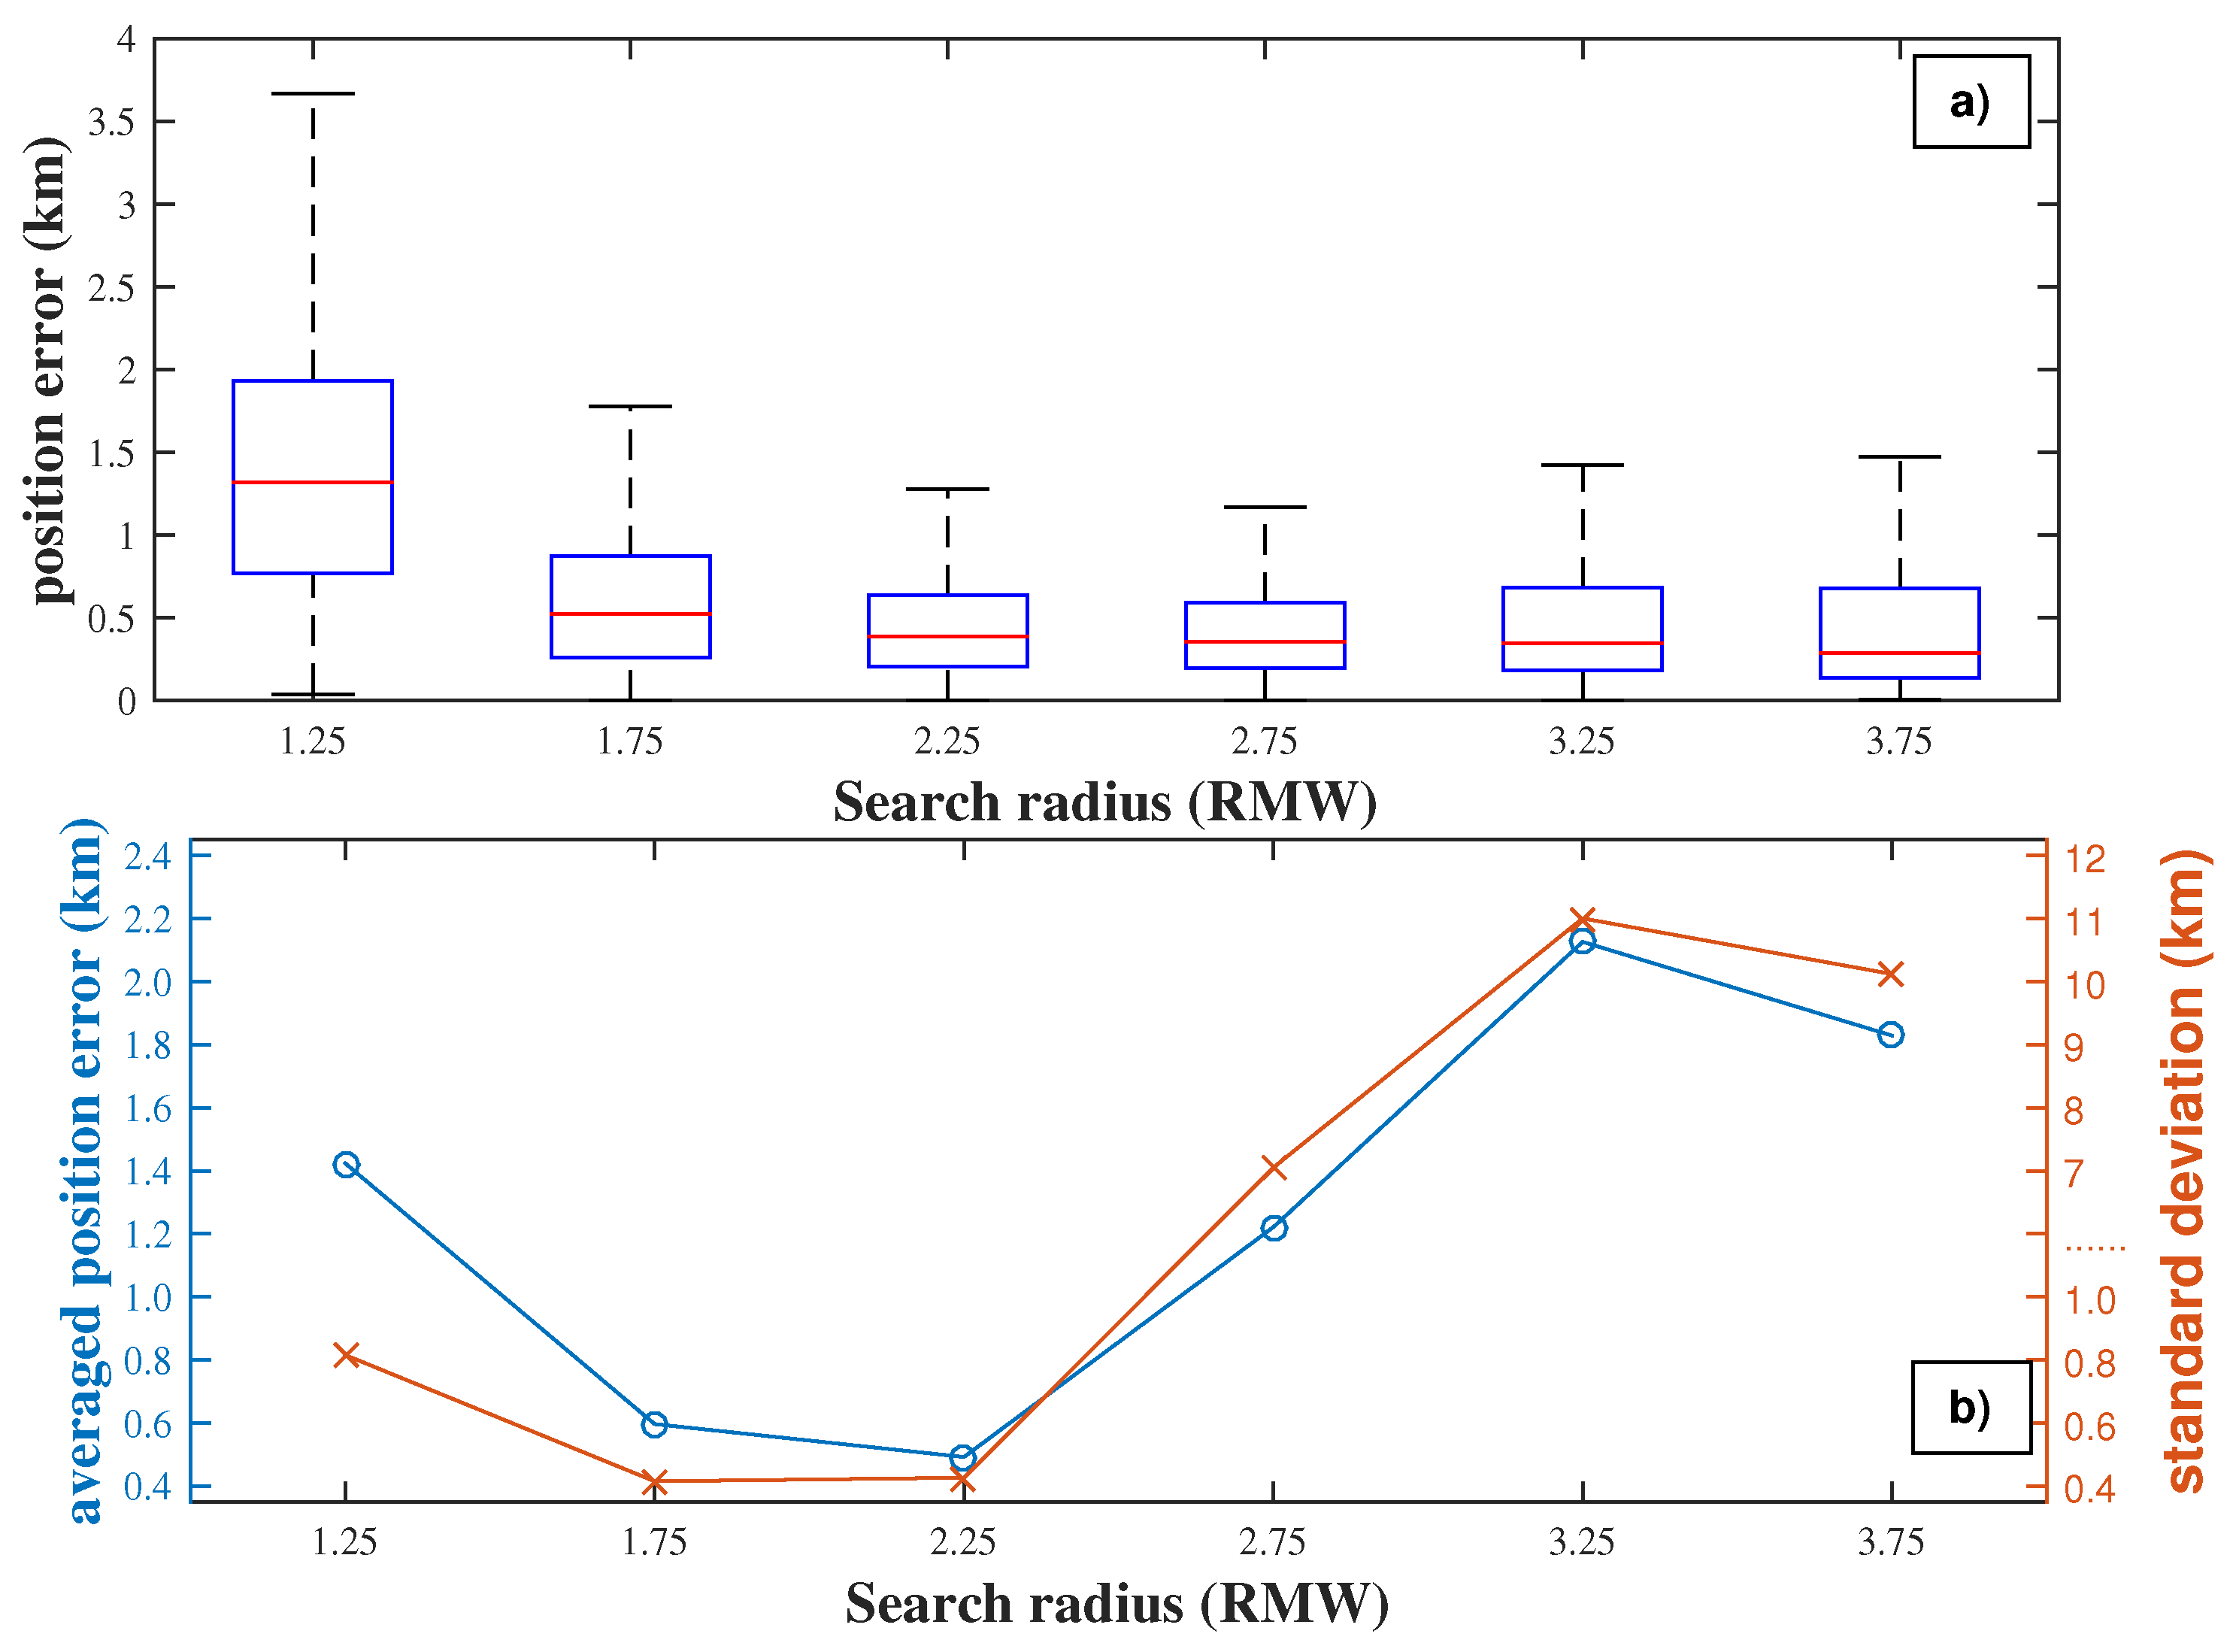
The statistics of the searching radius in the proposed algorithm are shown in Figure 4. As shown in Figure 4a, the medium position error decreases from 1.32 km to nearly 0.3 km when the normalized searching radius increases from 1.25 RMW to 3.75 RMW. The medium position error varies a little when the searching radius is larger than 2.25 RMW. The 25 t h percentile of position error is less than 0.05 km in all groups. Meanwhile, difference in the 75 t h percentile of position error is much significant. The 75 t h percentiles of position error decreases from 3.7 km to 1.2 km when the searching radius increases from 1.25 RMW to 2.75 RMW. Then, it increases with the growing of the searching radius. Besides, the group mean position error decreases with the growing of searching radius until 2.25 RMW in Figure 4b. So does the standard deviation. It should also be noticed that the standard deviation is much larger at 2.75 RMW than that at 2.25 RMW. The reason for this significant increasing in standard deviation is that there are more outliers in the group of 2.75 RMW. Besides, more outliers indicate that the performance of the new algorithm is less reliable when the searching radius is set close to 2.75 RMW. Therefore, it is suggested that the optimized searching radius is chosen as 2.25 times of the estimated RMW in the proposed algorithm.
It should be realized that statistical accuracy of the new algorithm is found to be sensitive to the settings of the three parameters which are found relative to the scale of the target vortex. Therefore, the three parameters are not optimized in their physical values, but in the relationship with the scale of target vortex instead. In this way, the new algorithm could objectively and automatically adjust the physical values of each parameter according to the statistical optimized relationships.

4.3. Algorithm Validation

The accuracy of the proposed optimized algorithm (hereafter FVC) is examined with the fifty vortexes in the testing group. Based on the findings in previous sections, the domain size, truncated scale and searching radius in the optimized algorithm are objectively set to 10, 1.5 and 2.25 times of the estimated RMW of the target vortex, respectively. In other words, the physical values of the three parameters are objectively and automatically defined based on the size of the target vortex. A vorticity centroid algorithm (hereafter VC) is chosen as a compared algorithm. In previous research, the domain size of a vorticity centroid algorithm may vary from 60 km to 300 km [27,38]. As the asymmetric perturbations are initialized within 3 times of the RMW of each vortex which is about 150 km, it is reasonable to set 150 km × 150 km as the domain size of the compared algorithm.
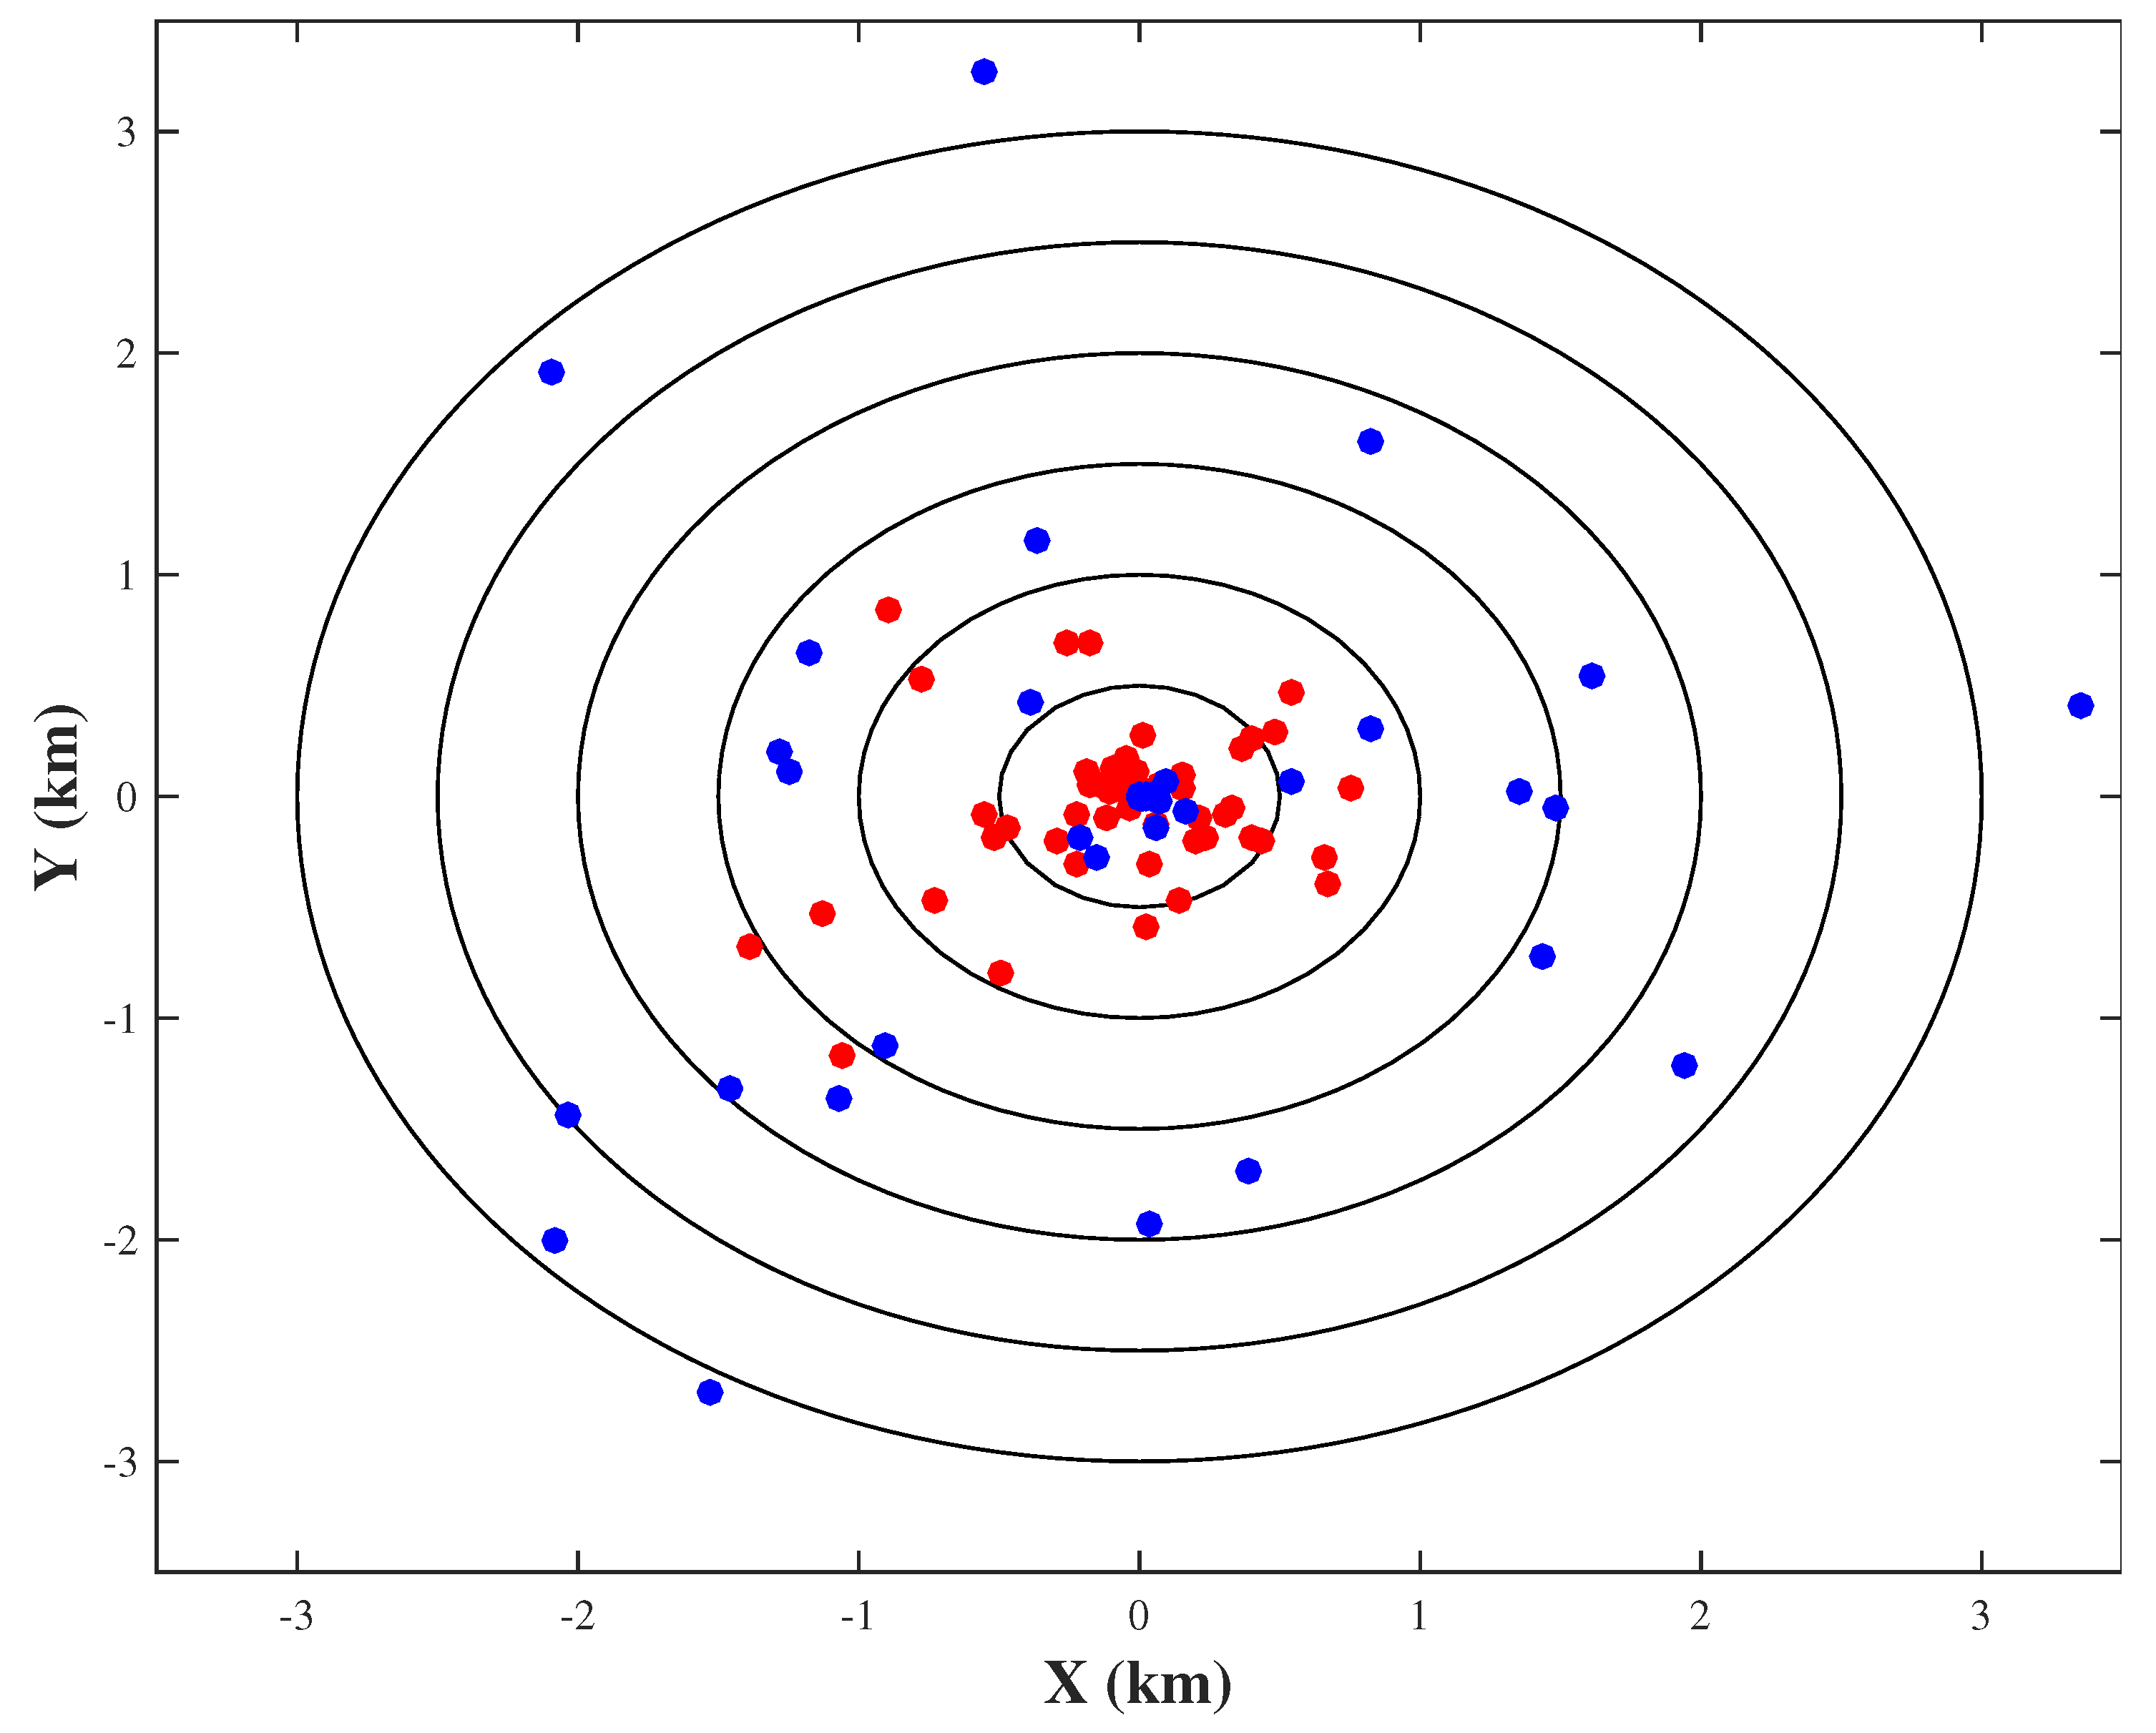
Figure 5 displays the center locations of fifty testing vortexes detected by the FVC method and VC method. There are 33 centers detected by the FVC whose position error is less than 0.5 km. Meanwhile, only 26 centers detected by VC are found with position error less than 0.5 km. Centers detected by VC method could have larger position error, as the maximum position error in VC is about two times of that in FVC. Table 3 shows statistical results of the two algorithm. The mean position error of FVC is 0.4 km, which is much smaller than that of VC. The standard deviation of the VC is as large as 1.06 km. Meanwhile, the performance of FVC seems to be more reliable as its standard deviation is only 0.354 km. The medium position errors of the two algorithm are close to each other, so does the minimum position errors. Therefore, it can be concluded that the proposed objective center-finding algorithm is better than a vorticity centroid algorithm in both accuracy and reliability.

5. Application to High-Resolution Model Data

The objective center-finding algorithm is then applied to a high-resolution (2-km horizontal grid spacing) numerical simulation of Typhoon Soudelor (2015). Soudelor formed as a tropical depression near Pohnpei on 29 July 2015. Then it strengthened slowly before starting rapid intensification on 2 August. The storm made its landfall in eastern Taiwan on 8 August. Then, it moved inland and degraded to a tropical depression by 9 August. The proposed algorithm is applied to the model simulations and its performance is compared with other commonly used algorithms which are shown in Table 4.

5.1. Model Setup

The Advanced Research Weather Research and Forecasting Model (ARW-WRF version 3.3.8) was used to simulate the evolution of Typhoon Soudelor. The model domain was two-way interactive and triply nested with horizontal grid spacings of 18, 6, and 2 km, respectively. The three meshes were set with sizes of 311 × 251, 271 × 271 and 211 × 211. There were 40 σ levels in the vertical, hydrostatic pressure as the vertical coordinate extending from the surface to the model top at 50 hPa. The two nested inner meshes automatically moved following the TC during the model integration, while the outermost 18-km mesh was fixed. Other configurations of the ARW-WRF is displayed in Table 5 similar to those by Wang et al. [46,47].
The model was initialized at 0000 UTC 3 August 2015 and integrated for 120 h up to 0000 UTC 8 August. The Final Analysis (FNL) data with horizontal resolution of 1 × 1 was used for model initial and lateral boundary conditions.

5.2. Verification of the Simulation

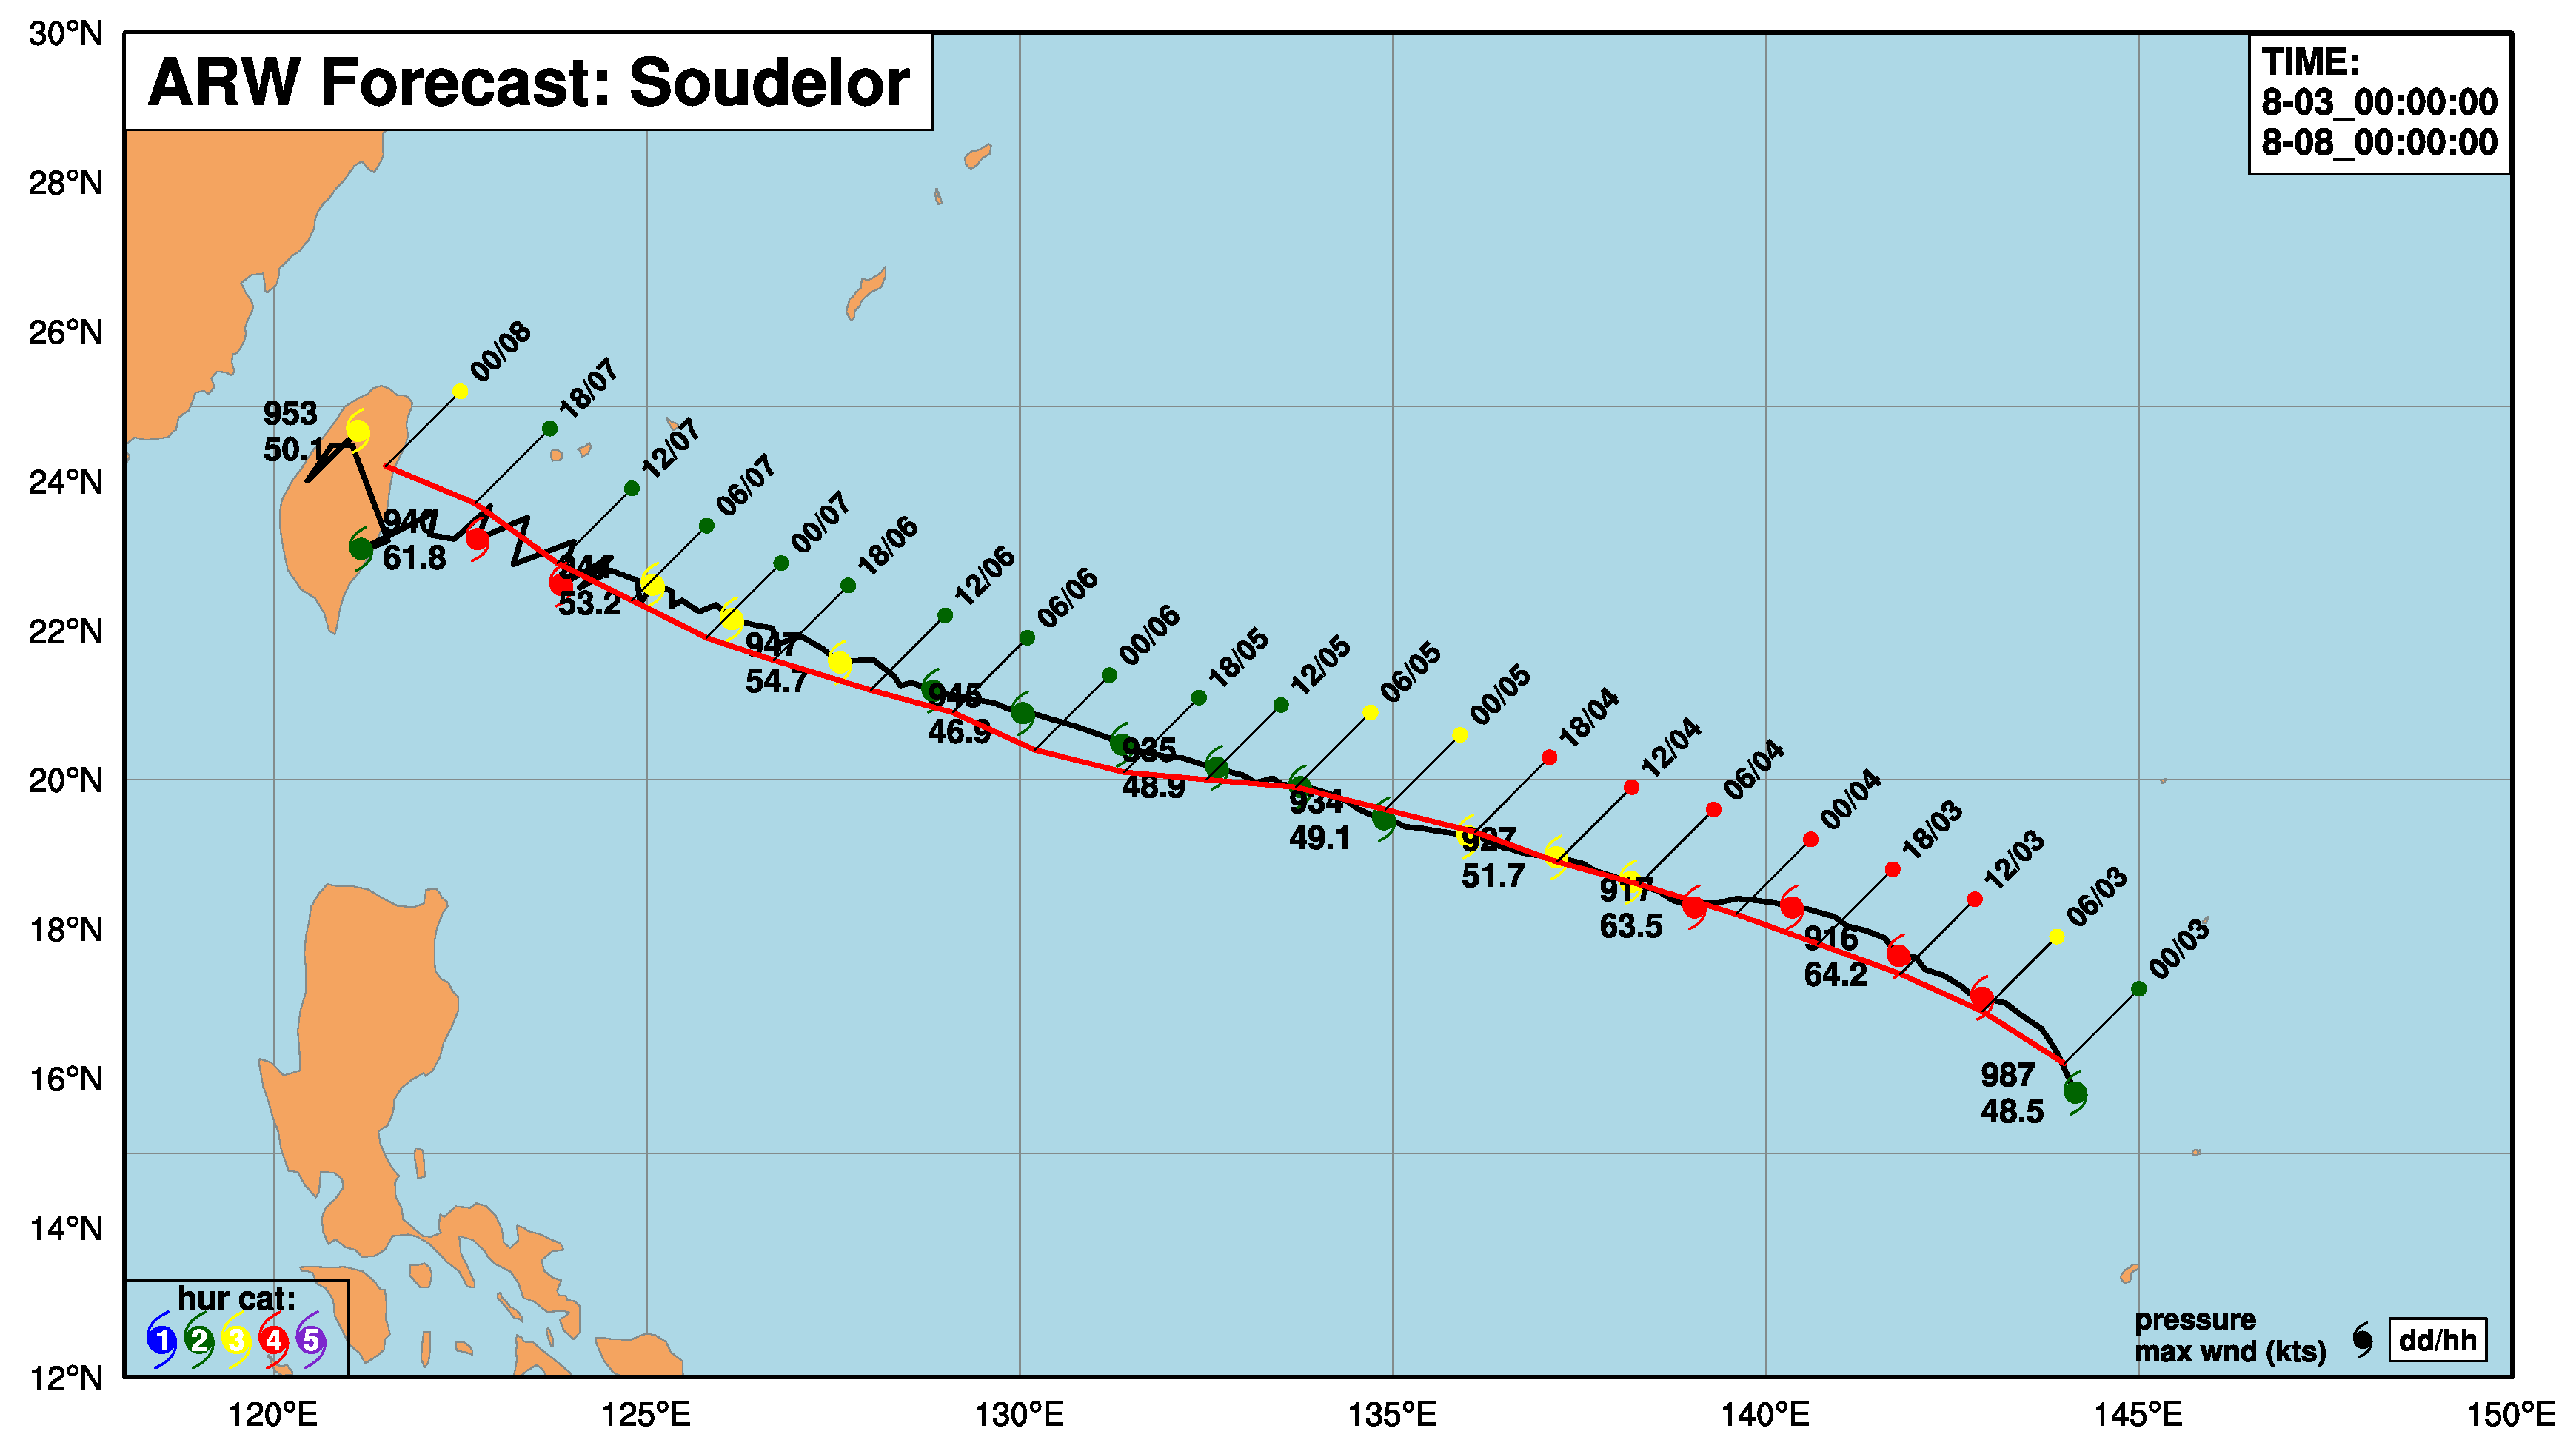
The track and intensity of the simulated Soudelor are compared with those from the JTWC (Joint Typhoon Warning Center) best track data in Figure 6.
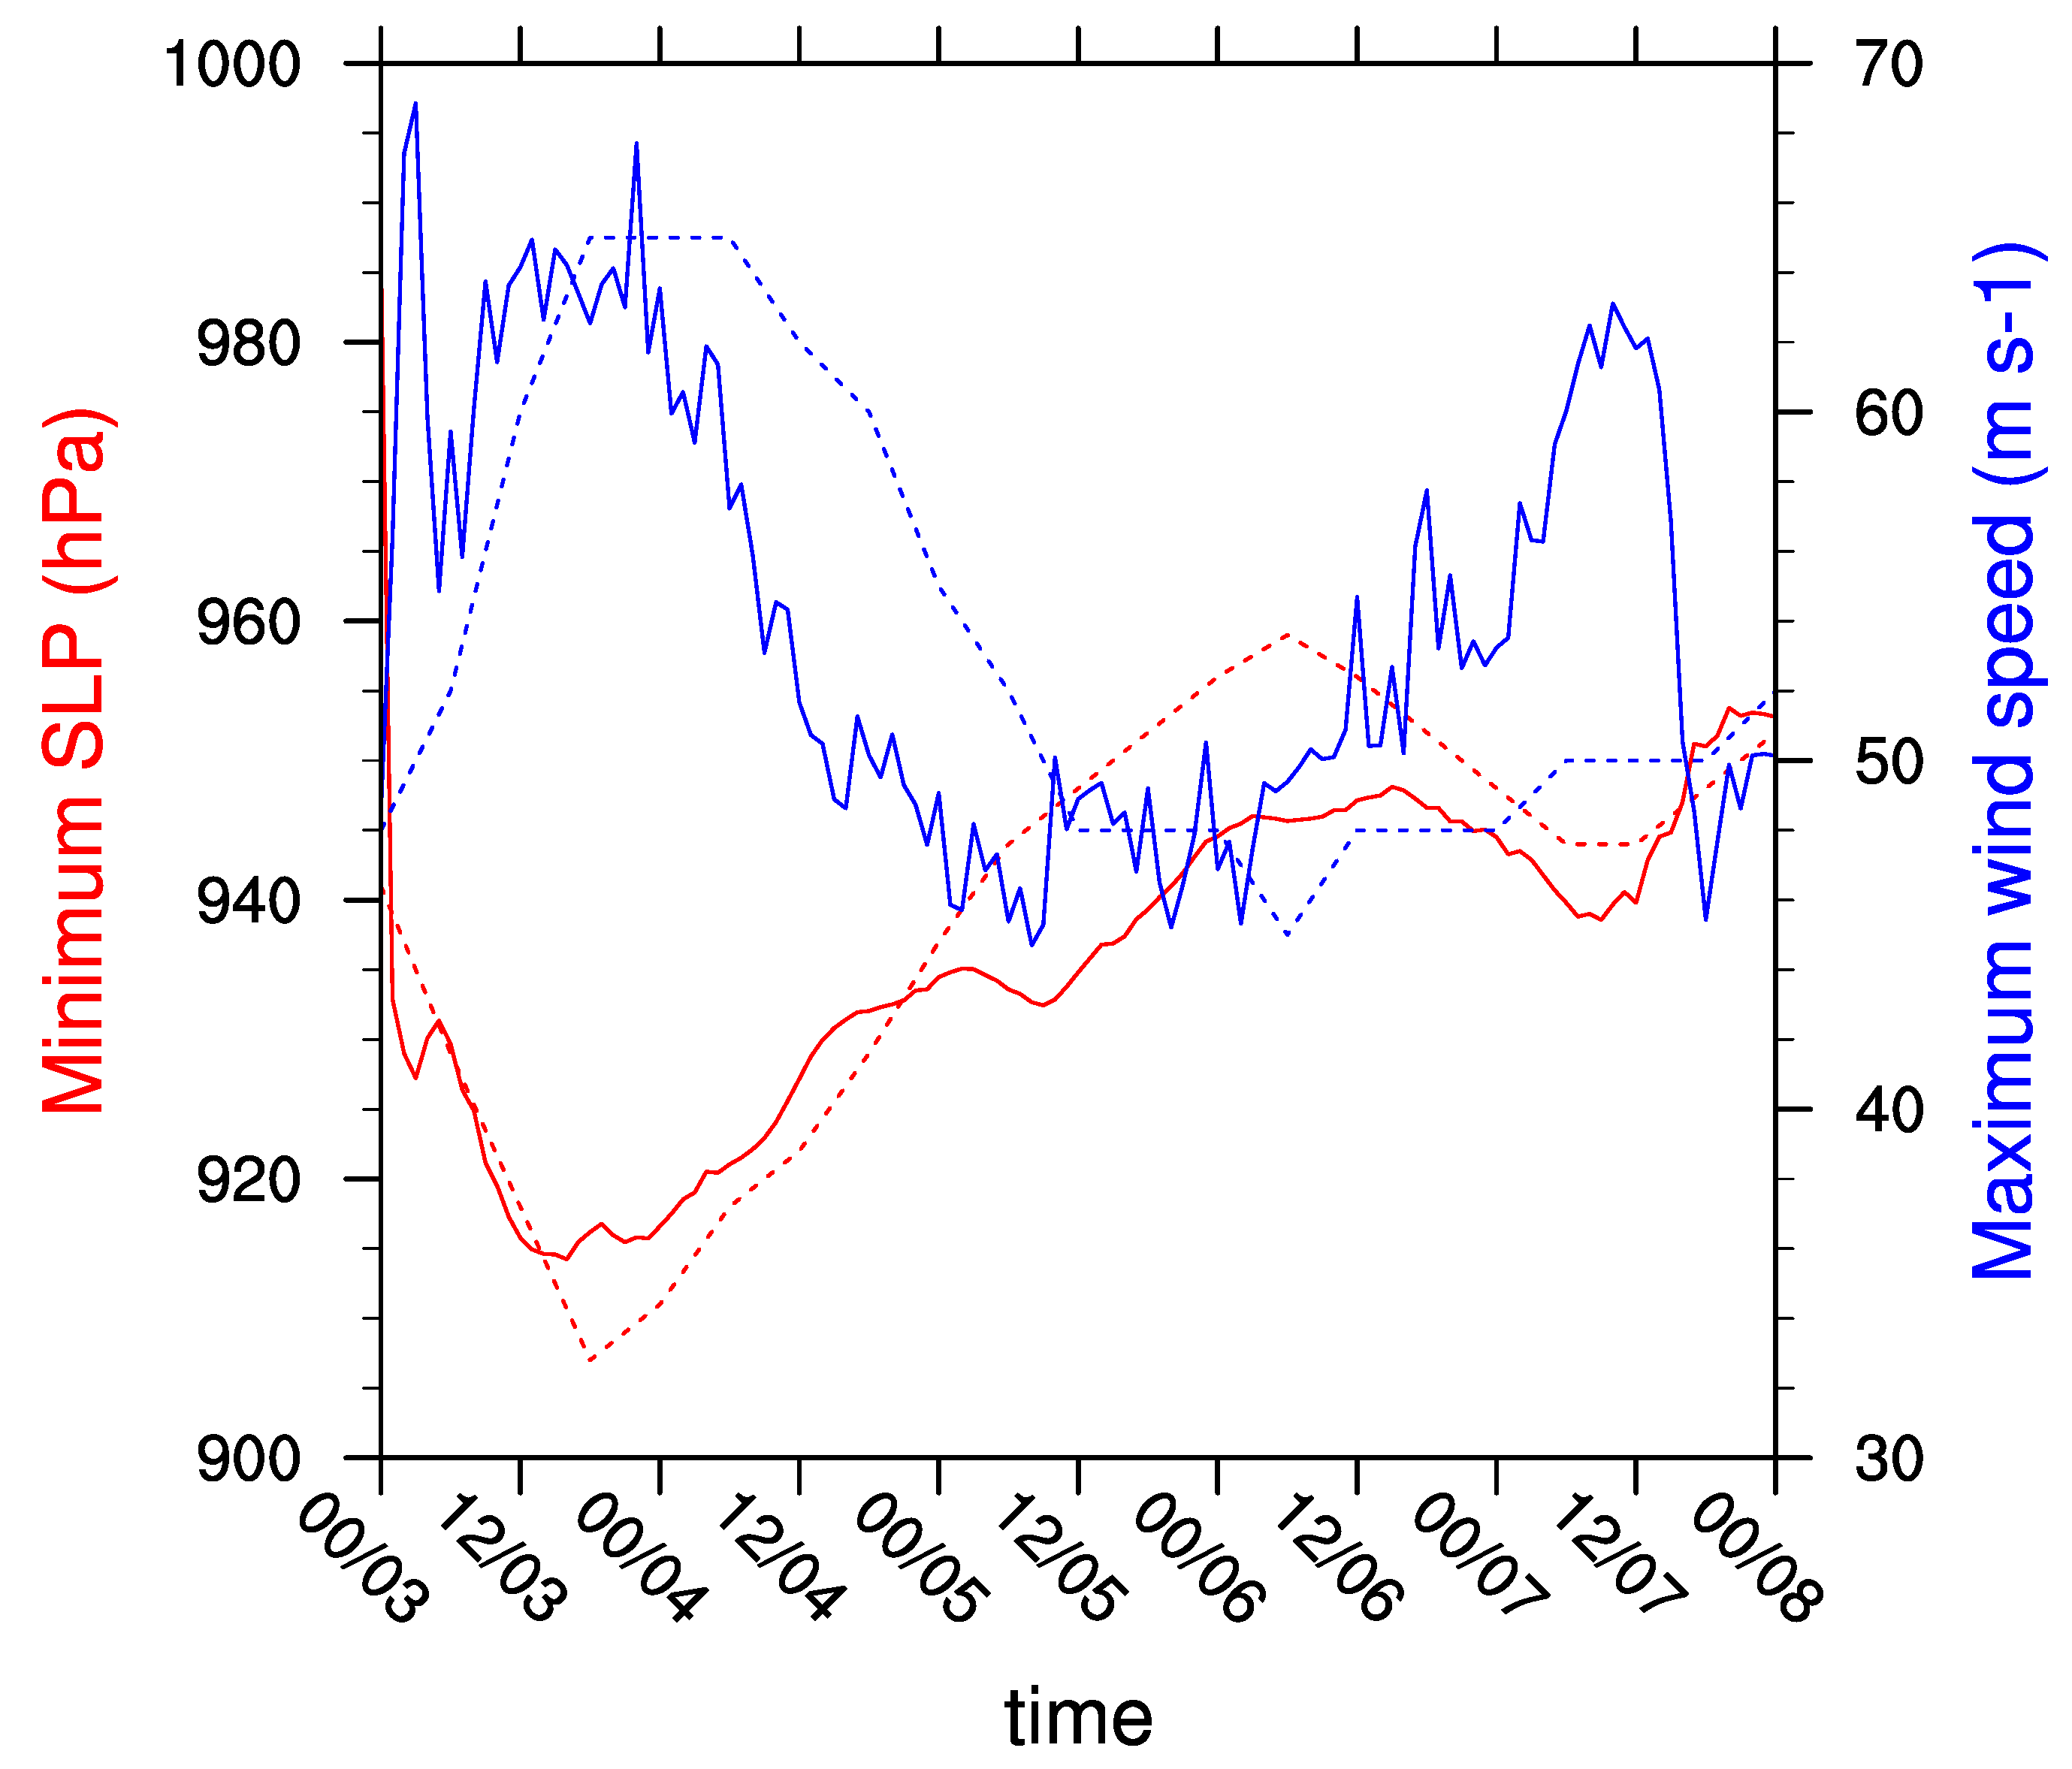
It seems that the model simulated the northwest ward movement quite well. Whereas, the ability to simulate the evolution of intensity is not good enough. Figure 7 shows the evolution of maximum wind speed and minimum surface level pressure.
The Soudelor intensified much more rapidly from 0000 UTC to 1200 UTC 3 August in our simulation. After the rapid intensification (RI), the modeled Soudelor maintained as a category 4 hurricane for nearly 12 h (from 1200 UTC 3 to 0000 UTC 4 August), and then decreased to a category 2 hurricane until 0600 UTC 7 August. It re-intensified before making its landfall in Taiwan at 1800 UTC 7 August. The simulated Soudelor moved faster and landed 6 h earlier than the real storm. The simulation was able to capture the RI, decay, re-intensification and landfall of a tropical cyclone. It is not our intention to clarify every details of the simulation, and attentions are paid on the performance of the proposed algorithm.

5.3. Performance of the Proposed Algorithm

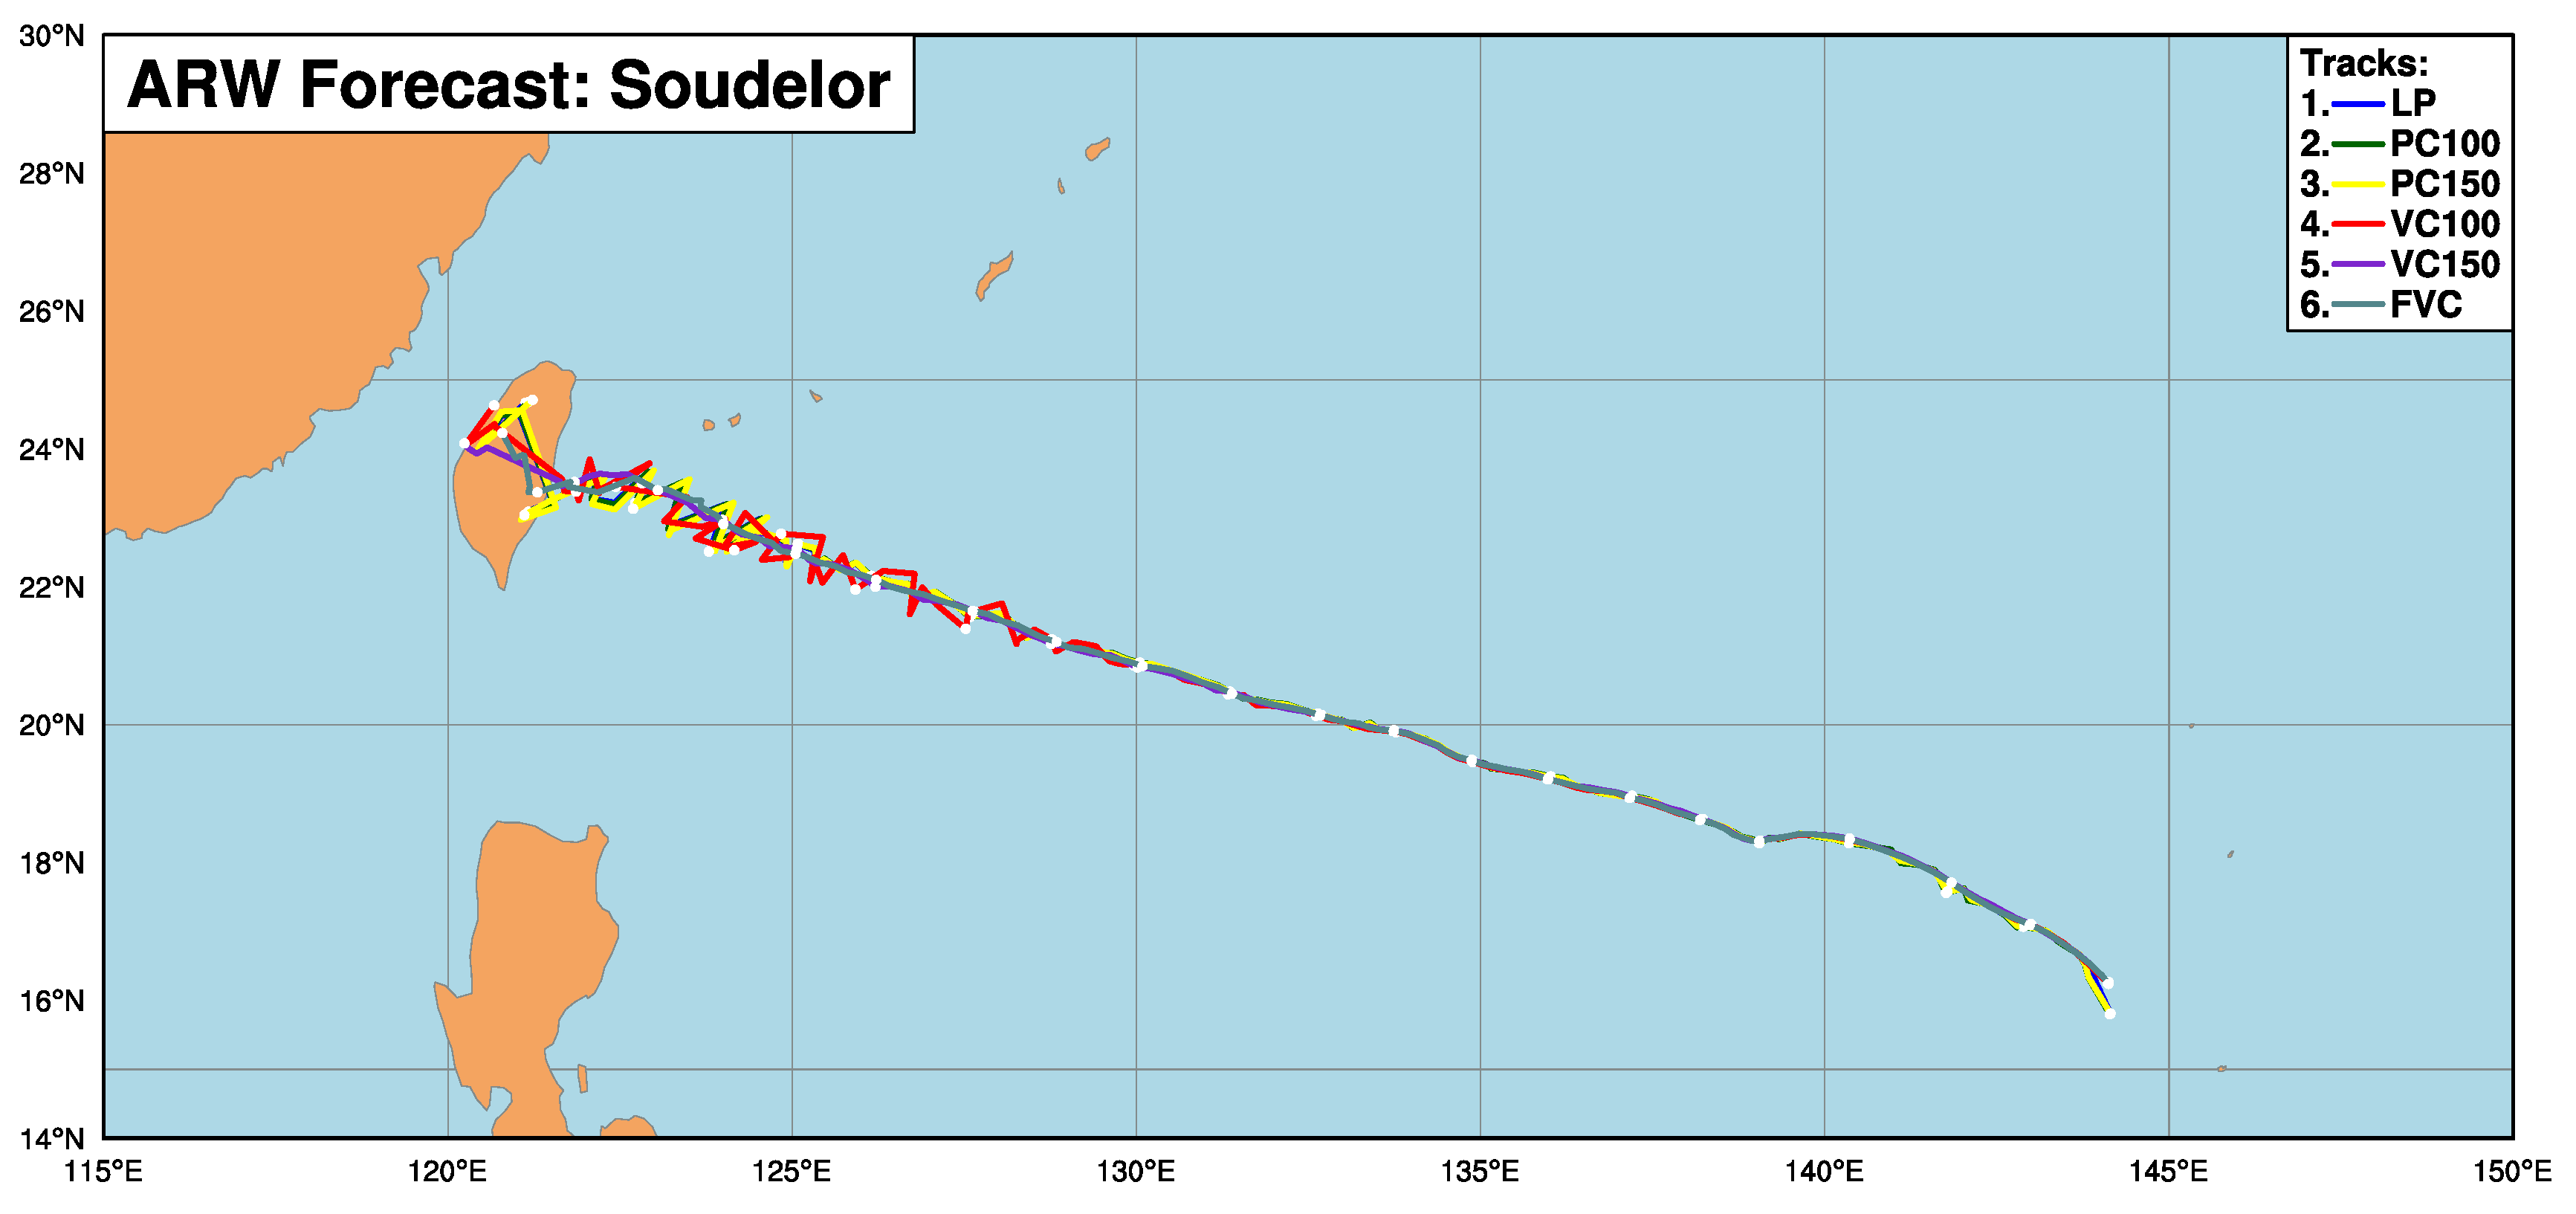
Figure 8 shows the tracks detected by different center-finding algorithms displayed in Table 4.
The centers detected by the six different center-finding algorithms are very close until 0000 UTC 6 August before the re-intensification occured. In other words, the dispersion of center locations is relatively small during the RI, the mature and the decaying period. Whereas, significant differences among the six algorithms exist when the simulated Soudelor re-intensified and made its landfall in Taiwan. Therefore, it seems that it is not the strength of a tropical cyclone that determines the dispersion of the center locations. Besides, the track determined by FVC is found smoother that others.
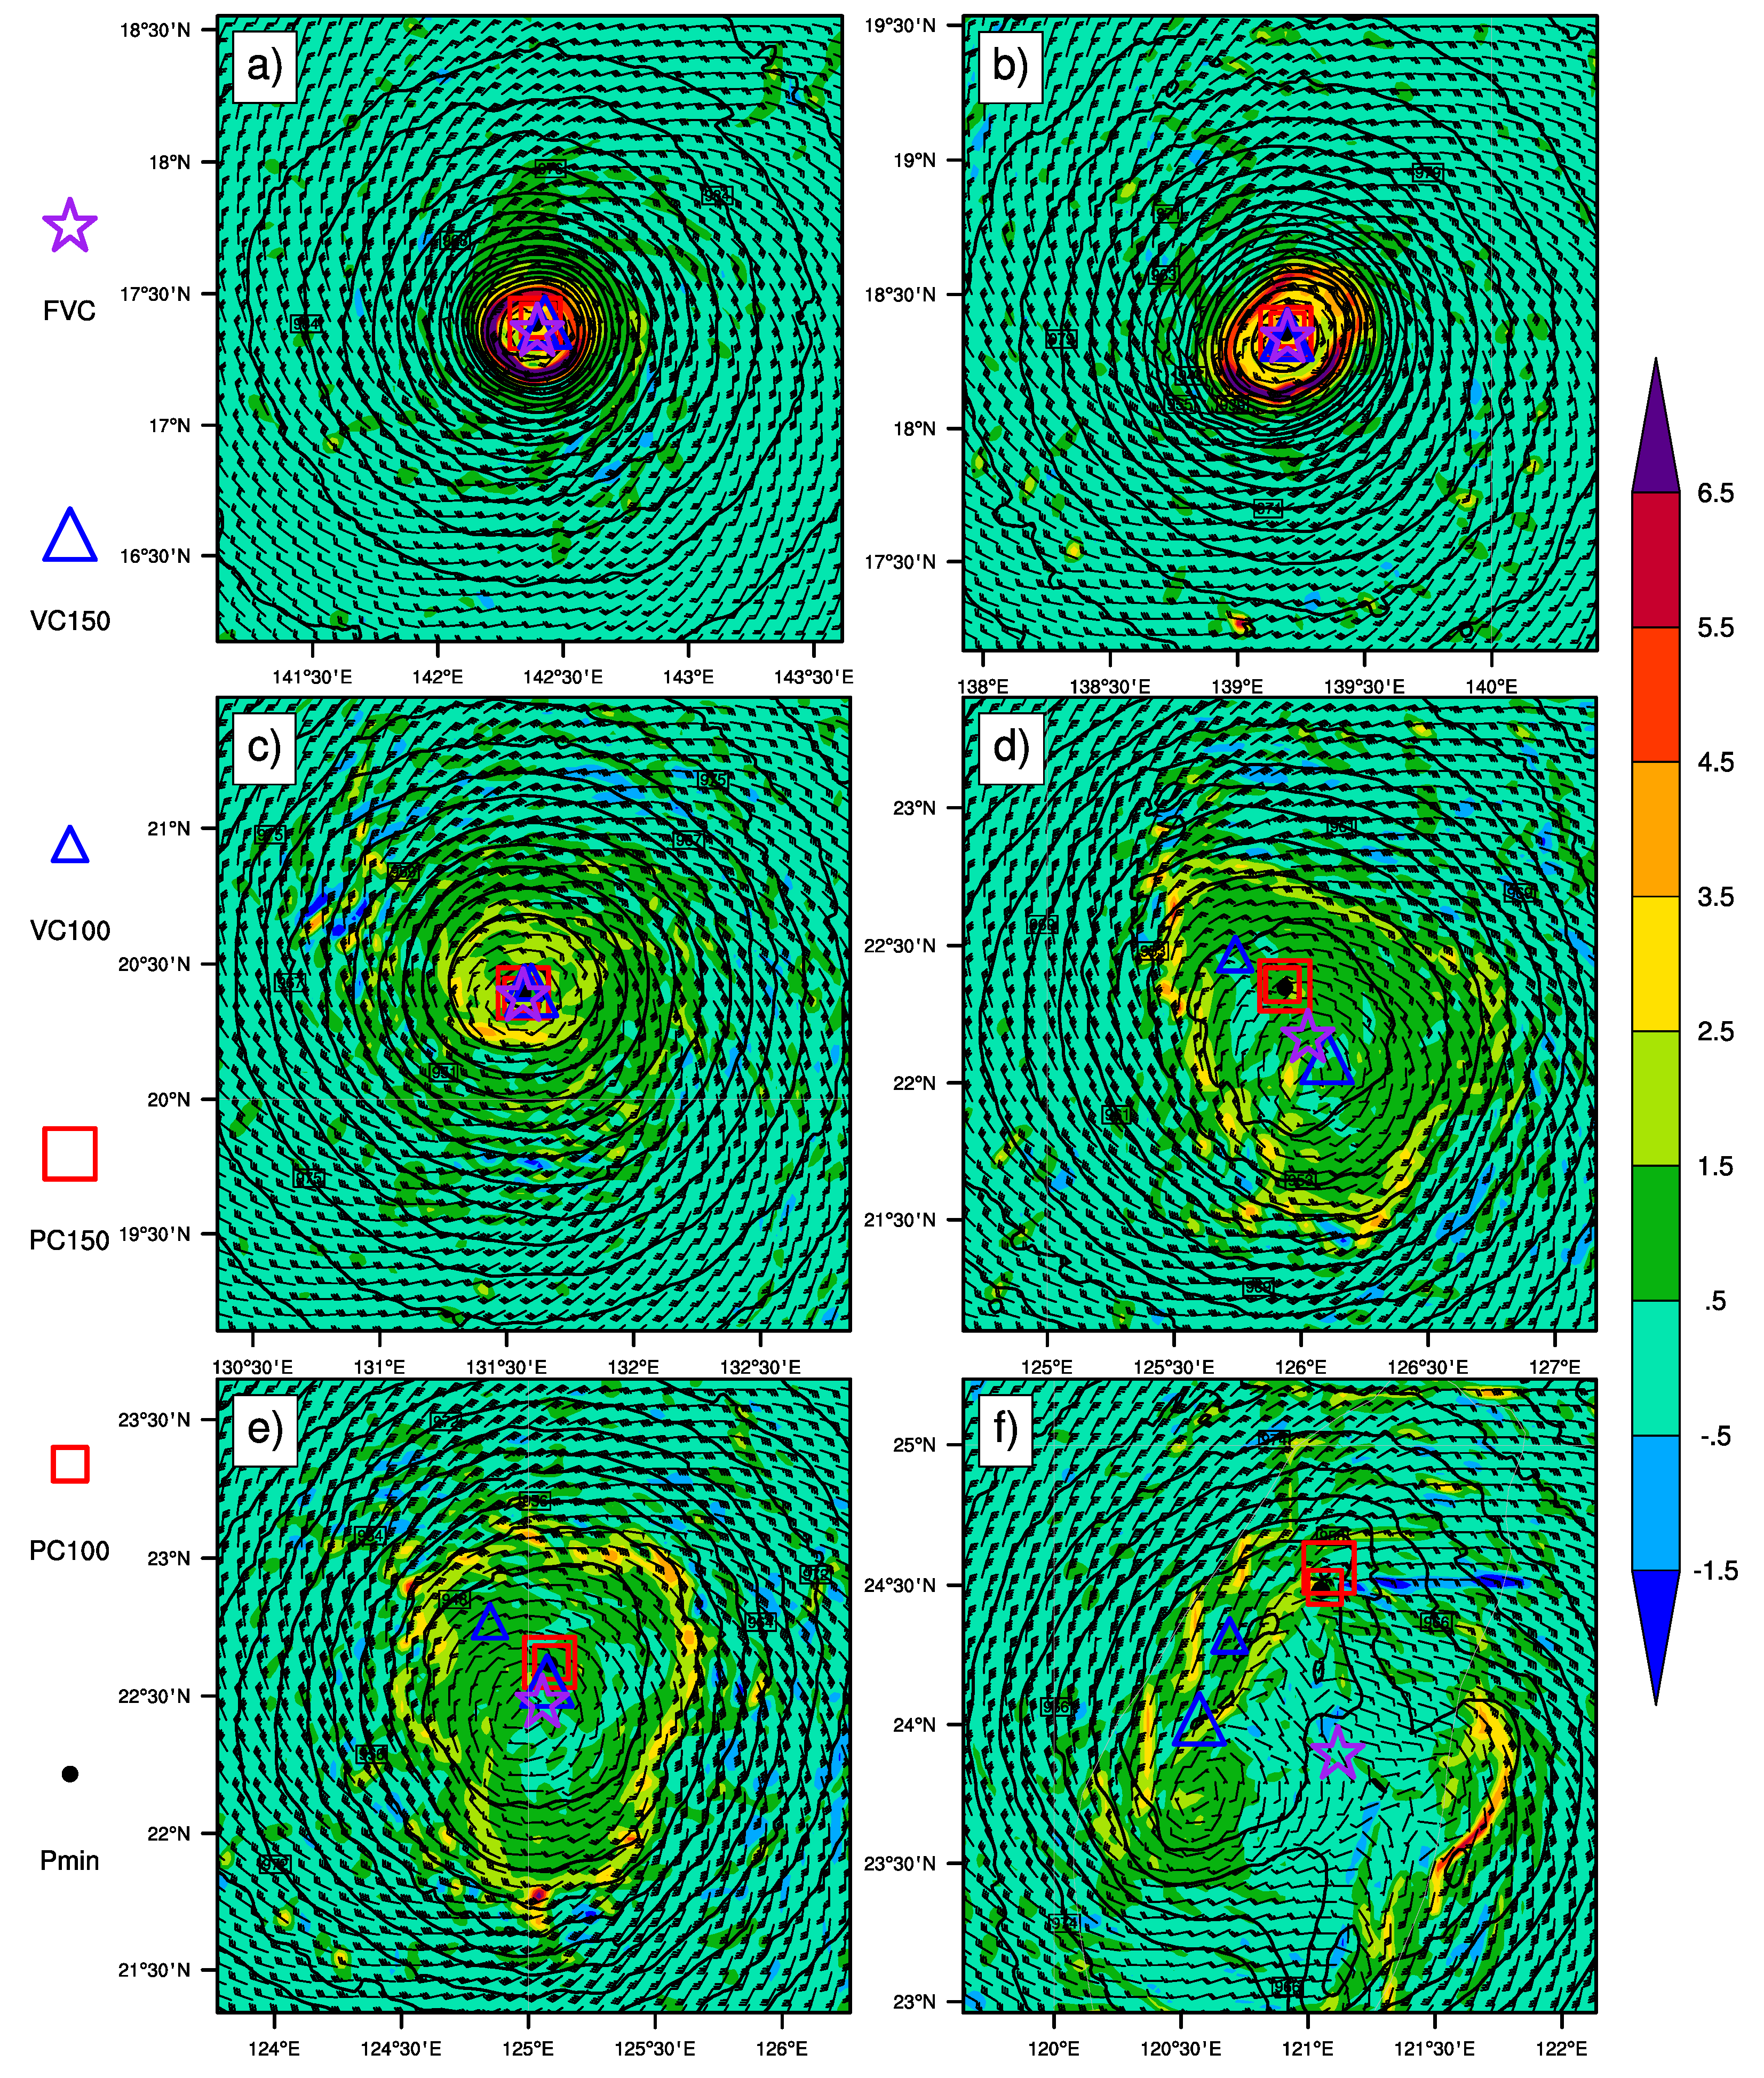
Six snap shots are selected from the 120 h simulation to further evaluate the performance of the proposed algorithm (FVC). The snap shots are selected to represent the structure of simulated Soudelor at different stages. The surface level pressure, vorticity and winds at 10 m above the sea level are displayed in Figure 9 with the center locations detected by the six algorithms as well.
The detected centers are close to each other as the maximum difference of the center locations is less than 4.2 km in Figure 9a when the Soudelor intensifies rapidly. When Soudelor becomes mature, the dispersion of center locations is also relatively small as the maximum difference is nearly 3.59 km in Figure 9b. The center detected by the FVC algorithm is also found close to others in Figure 9c when the Soudelor decreases to a category 2 tropical cyclone. It is difficult to tell which algorithm is more accuracy from Figure 9a–c as the detected centers are close to each other and they all locate in small wind speed areas. However, the dispersion of center locations is much larger in Figure 9d–f. The vorticity field in Figure 9d,e has a triangle distribution rather than circular distributions in Figure 9a–c. The gradient of SLP is much weaker at inner core as well. The centers detected by Pmin, PC100 and PC150 are found located in areas with wind speed higher than 6 m/s in Figure 9d. Besides, the performance of VC100 is worse as the its center locates in a much higher wind speed area. However, centers detected by VC150 and FVC seems to be more reasonable as they all locate at small wind speed area. Similar to Figure 9d, the centers detected by VC150 and FVC seems to be more reasonable than those detected by other algorithms in Figure 9e. Therefore, the VC150 and FVC are more appropriate when applied to an asymmetric storm with a polygon vorticity field. It is notable that the maximum difference of center locations could be as large as 70 km in Figure 9f when the simulated Soudelor makes its landfall in Taiwan. Due to the influence of topography by Central Mountain of Taiwan, the fields of Soudelor become more complicated. Centers detected by the Pmin, PC100 and PC150 are found north to others. Meanwhile, the VC100 and VC150 detect the centers in the high wind speed areas to the west of the Central Mountain. The center detected by the FVC seems to be more reasonable as it located in a small wind speed area and it appeares to be the center of the large scale circulation. Therefore, it is thought that the FVC is able to detect a reasonable center for a tropical cyclone even when the storm is weak and asymmetric.

6. Conclusions

An objective center-finding algorithm was proposed to detect centers of cyclonic vortexes in numerical model datas. The main advantages of the proposed algorithm are summarized as follows:
  • Pressure, winds and vorticity fields are involved in the new algorithm rather than using a single field in previous algorithms. The participating of multiple fields provides more physical factors of a TC.
  • A two-dimensional Fourier filter is involved in the new algorithm to eliminate perturbations whose wave length are smaller than a certain threshold.
  • Most importantly, the parameters involved in the new algorithm could automatically change their physical values according to the scale of target vortex.
As there is no standard definition of the center in a real TC, the objective center-finding algorithm was optimized and validated under idealized vortexes with known centers. A hundred idealized vortexes were constructed by combining symmetric vortex with different sizes and asymmetric perturbations with different structures as benchmarks. The first fifty vortexes (training group) were used for optimization, and the rest vortexes (testing group) were used for validation.
Statistics on position error of fifty idealized vortexes in the training group were used to examine the influence of the settings for the three parameters on the accuracy of algorithm. It is found that the performance of the new algorithm is sensitive to the choice of parameters. Meanwhile, the scale of symmetric vortex has an influence on the performance. Using evaluating indicators such as group mean, standard deviation, medium, 25 t h and 75 t h percentiles, the performance of the new algorithm was found improved when the domain size, truncated scale and searching radius were set close to 10, 1.5 and 2.75 times of the RMW of the target vortex, respectively. A link between the parameters of a center-finding algorithm and the scale of the target TC is built objectively through statistical analysis. In practice, the estimated RMW of a target vortex calculated in step 1 was used instead of the unknown ‘real’ RMW. Therefore, the physical values of the three parameters in this new algorithm were objectively and automatically defined according to the scale of the target vortex.
The optimized algorithm is validated using the fifty idealized vortexes in the testing group. The averaged position error was 0.4 km which is much smaller than that of a vorticity centroid algorithm with a 150 km × 150 km domain size. The new algorithm was also proved more reliable as it is smaller in standard deviation and maximum position error.
The performance of the proposed objective center-finding algorithm is examined and compared with other commonly used algorithms in the WRF simulation of Typhoon Soudelor (2015). The center locations detected by different algorithms are close to each other when the storm is symmetric. Whereas, large dispersion of algorithms exists when the storm has a polygon vorticity field or is influenced by topography. The FVC is found to be able to detect a reasonable center for a tropical cyclone at different stages including RI, decaying, re-intensification and making a landfall.
The objective center-finding algorithm is optimized and validated with idealized vortexes where their symmetric parts are constructed stronger than a category 1 vortex. Future study should focus on the performance of the new algorithm when it is applied to real TCs, especially when extra-tropical transformation occurs. As the new algorithm is developed able to detect multiple vortexes, it is necessary to examine its performance by considering the merging of two TCs.

Author Contributions

Conceptualization, C.Z., J.S.; Formal analysis, C.Z.; Supervision, J.S. and H.L.; Writing—original draft, C.Z.; Writing—review & editing, J.Z. and H.L.

Funding

This research was funded by the National Natural Science Foundation of China, Grant Number [41605070].

Conflicts of Interest

The authors declare no conflict of interest.

References

  1. Velden, C.; Harper, B.; Wells, F.; Beven, J.L.; Zehr, R.; Olander, T.; Mayfield, M.; Lander, M.; Edson, R.; Avila, L.; et al. The dvorak tropical cyclone intensity estimation technique a Satellite-Based Method that Has Endured for over 30 Years. Bull. Am. Meteorol. Soc. 2006, 87, 1195–1210. [Google Scholar] [CrossRef]
  2. Olander, T.L.; Velden, C.S. The Advanced Dvorak Technique: Continued Development of an Objective Scheme to Estimate Tropical Cyclone Intensity Using Geostationary Infrared Satellite Imagery. Weather Forecast. 2007, 22, 287–298. [Google Scholar] [CrossRef]
  3. Rozoff, C.M.; Velden, C.S.; Kaplan, J.; Kossin, J.P.; Wimmers, A.J. Improvements in the Probabilistic Prediction of Tropical Cyclone Rapid Intensification with Passive Microwave Observations. Weather Forecast. 2015, 30, 1016–1038. [Google Scholar] [CrossRef]
  4. Montgomery, M.T.; Zhang, J.A.; Smith, R.K. An Analysis of the Observed Low-level Structure of Rapidly Intensifying and Mature Hurricane Earl (2010). Q. J. R. Meteorol. Soc. 2014, 140, 2132–2146. [Google Scholar] [CrossRef]
  5. Abarca, S.F.; Montgomery, M.T. Are Eyewall Replacement Cycles Governed Largely by Axisymmetric Balance Dynamics. J. Atmos. Sci. 2015, 72, 82–87. [Google Scholar] [CrossRef]
  6. Flaounas, E.; Kelemen, F.D.; Wernli, H.; Gaertner, M.A.; Reale, M.; Sanchez-Gomez, E.; Lionello, P.; Calmanti, S.; Podrascanin, Z.; Somot, S.; et al. Assessment of an ensemble of ocean–atmosphere coupled and uncoupled regional climate models to reproduce the climatology of Mediterranean cyclones. Clim. Dyn. 2018, 51, 1023–1040. [Google Scholar] [CrossRef]
  7. Knapp, K.R.; Kruk, M.C.; Levinson, D.H.; Diamond, H.J.; Neumann, C.J. The International Best Track Archive for Climate Stewardship (IBTrACS): Unifying tropical cyclone data. Bull. Am. Meteorol. Soc. 2010, 91, 363–376. [Google Scholar] [CrossRef]
  8. Ulbrich, U.; Leckebusch, G.C.; Grieger, J.; Schuster, M.; Akperov, M.G.; Bardin, M.Y.; Feng, Y.; Gulev, S.; Inatsu, M.; Keay, K.; et al. Are greenhouse gas signals of Northern Hemisphere winter extra-tropical cyclone activity dependent on the identification and tracking algorithm? Meteorol. Z. 2013, 22, 61–68. [Google Scholar] [CrossRef]
  9. Neu, U.; Akperov, M.G.; Bellenbaum, N.; Benestad, R.S.; Blender, R.; Caballero, R.; Cocozza, A.; Dacre, H.F.; Feng, Y.; Fraedrich, K.; et al. IMILAST: A Community Effort to Intercompare Extratropical Cyclone Detection and Tracking Algorithms. Bull. Am. Meteorol. Soc. 2013, 94, 529–547. [Google Scholar] [CrossRef]
  10. Lionello, P.; Trigo, I.; Gil, V.; Liberato, M.; Nissen, K.M.; Pinto, J.; Raible, C.; Reale, M.; Tanzarella, A.; Trigo, R.; et al. Objective Climatology of Cyclones in the Mediterranean Region: A consensus view among methods with different system identification and tracking criteria. Tellus 2016, 68, 29391. [Google Scholar] [CrossRef]
  11. Reale, M.; Liberato, M.L.; Lionello, P.; Pinto, J.G.; Salon, S.; Ulbrich, S. A Global Climatology of Explosive Cyclones using a Multi-Tracking Approach. Tellus A Dyn. Meteorol. Oceanogr. 2019, 71, 1–19. [Google Scholar] [CrossRef]
  12. Song, J.; Wang, Y.; Wu, L. Trend discrepancies among three best track data sets of western North Pacific tropical cyclones. J. Geophys. Res. 2010, 115. [Google Scholar] [CrossRef] [Green Version]
  13. Wimmers, A.J.; Velden, C.S. Advancements in Objective Multisatellite Tropical Cyclone Center Fixing. J. Appl. Meteorol. Climatol. 2016, 55, 197–212. [Google Scholar] [CrossRef]
  14. Lee, W.C.; Jou, B.J.D.; Chang, P.L.; Deng, S.M. Tropical Cyclone Kinematic Structure Retrieved from Single-Doppler Radar Observations. Part I: Interpretation of Doppler Velocity Patterns and the GBVTD Technique. Mon. Weather Rev. 1999, 127, 2419–2439. [Google Scholar] [CrossRef]
  15. Chaurasia, S.; Kishtawal, C.M.; Pal, P.K. An objective method of cyclone centre determination from geostationary satellite observations. J. Remote Sens. 2010, 31, 2429–2440. [Google Scholar] [CrossRef]
  16. Jaiswal, N.; Kishtawal, C.M. Automatic Determination of Center of Tropical Cyclone in Satellite-Generated IR Images. IEEE Geosci. Remote Sens. Lett. 2011, 8, 460–463. [Google Scholar] [CrossRef]
  17. Bell, M.M.; Lee, W.C. Objective Tropical Cyclone Center Tracking Using Single-Doppler Radar. J. Appl. Meteorol. Climatol. 2012, 51, 878–896. [Google Scholar] [CrossRef] [Green Version]
  18. Wimmers, A.J.; Velden, C.S. Objectively Determining the Rotational Center of Tropical Cyclones in Passive Microwave Satellite Imagery. J. Appl. Meteorol. Climatol. 2010, 49, 2013–2034. [Google Scholar] [CrossRef]
  19. Reppucci, A.; Lehner, S.; Schulz-Stellenfleth, J.; Brusch, S. Tropical Cyclone Intensity Estimated from Wide-Swath SAR Images. IEEE Trans. Geosci. Remote Sens. 2010, 48, 1639–1649. [Google Scholar] [CrossRef]
  20. Li, X.; Yang, X.; Li, Z. Tropical Cyclone Morphology from Spaceborne Synthetic Aperture Radar. Bull. Am. Meteorol. Soc. 2013, 94, 215–230. [Google Scholar] [CrossRef] [Green Version]
  21. Wood, V.T. A Technique for Detecting a Tropical Cyclone Center Using a Doppler Radar. J. Atmos. Ocean. Technol. 1994, 11, 1207–1216. [Google Scholar] [CrossRef] [Green Version]
  22. Potvin, C.K.; Shapiro, A.; Yu, T.Y.; Gao, J.; Xue, M. Using a Low-Order Model to Detect and Characterize Tornadoes in Multiple-Doppler Radar Data. Mon. Weather Rev. 2009, 137, 1230–1249. [Google Scholar] [CrossRef] [Green Version]
  23. Potvin, C.K. A Variational Method for Detecting and Characterizing Convective Vortices in Cartesian Wind Fields. Mon. Weather Rev. 2013, 141, 3102–3115. [Google Scholar] [CrossRef]
  24. Lee, W.C.; Marks, F.D.; Carbone, R.E. Velocity Track Display—A Technique to Extract Real-Time Tropical Cyclone Circulations Using a Single Airborne Doppler Radar. J. Atmos. Ocean. Technol. 1994, 11, 337–356. [Google Scholar] [CrossRef]
  25. Lee, W.C.; Marks, F.D. Tropical Cyclone Kinematic Structure Retrieved from Single-Doppler Radar Observations. Part II: The GBVTD-Simplex Center Finding Algorithm. Mon. Weather Rev. 2000, 128, 1925–1936. [Google Scholar] [CrossRef] [Green Version]
  26. Gang, Z.; Yang, J.; Liu, A.K.; Li, X.; Pichel, W.G.; He, S. Comparison of Typhoon Centers From SAR and IR Images and Those From Best & Track Data Sets. IEEE Trans. Geosci. Remote Sens. 2016, 54, 1000–1012. [Google Scholar]
  27. Ryglicki, D.R.; Hart, R.E. An Investigation of Center-Finding Techniques for Tropical Cyclones in Mesoscale Models. J. Appl. Meteorol. Climatol. 2015, 54, 825–846. [Google Scholar] [CrossRef]
  28. Jones, S.C. The evolution of vortices in vertical shear. I: Initially barotropic vortices. Q. J. R. Meteorol. Soc. 1995, 121, 821–851. [Google Scholar] [CrossRef]
  29. Hsiao, L.F.; Liou, C.S.; Yeh, T.C.; Guo, Y.R.; Chen, D.S.; Huang, K.N.; Terng, C.T.; Chen, J.H. A Vortex Relocation Scheme for Tropical Cyclone Initialization in Advanced Research WRF. Mon. Weather Rev. 2010, 138, 3298–3315. [Google Scholar] [CrossRef]
  30. Riemer, M.; Montgomery, M.T.; Nicholls, M.E. A new paradigm for intensity modification of tropical cyclones: Thermodynamic impact of vertical wind shear on the inflow layer. Atmos. Chem. Phys. 2009, 10, 3163–3188. [Google Scholar] [CrossRef]
  31. Reasor, P.D.; Montgomery, M.T. Three-Dimensional Alignment and Corotation of Weak, TC-like Vortices via Linear Vortex Rossby Waves. J. Atmos. Sci. 2001, 58, 2306–2330. [Google Scholar] [CrossRef] [Green Version]
  32. Braun, S.A. A Cloud-Resolving Simulation of Hurricane Bob (1991): Storm Structure and Eyewall Buoyancy. Mon. Weather Rev. 2002, 130, 1573–1592. [Google Scholar] [CrossRef] [Green Version]
  33. Nguyen, L.T.; Molinari, J.; Thomas, D. Evaluation of Tropical Cyclone Center Identification Methods in Numerical Models. Mon. Weather Rev. 2014, 142, 4326–4339. [Google Scholar] [CrossRef]
  34. Ryglicki, D.R.; Hodyss, D. A Deeper Analysis of Center-Finding Techniques for Tropical Cyclones in Mesoscale Models. Part I: Low-Wavenumber Analysis. J. Appl. Meteorol. Climatol. 2016, 55, 531–559. [Google Scholar] [CrossRef]
  35. Zhao, C.; Song, J.; Leng, H.; Zhao, J. Potential Uncertainties in the Analysis of Low-Wavenumber Asymmetries Caused by Aliasing Center in Tropical Cyclones. Atmosphere 2019, 6, 300. [Google Scholar] [CrossRef]
  36. Frank, W.M.; Ritchie, E.A. Effects of Environmental Flow upon Tropical Cyclone Structure. Mon. Weather Rev. 1999, 127, 2044–2061. [Google Scholar] [CrossRef] [Green Version]
  37. Zou, H.; Wu, S.; Yi, X.; Wu, N. The Application of Barnes Filter to Positioning the Center of Landed Tropical Cyclone in Numerical Models. Adv. Meteorol. 2018, 2018, 1747530. [Google Scholar] [CrossRef]
  38. Reasor, P.D.; Montgomery, M.T.; Grasso, L.D. A New Look at the Problem of Tropical Cyclones in Vertical Shear Flow: Vortex Resiliency. J. Atmos. Sci. 2004, 61, 3–22. [Google Scholar] [CrossRef] [Green Version]
  39. Stern, D.P.; Zhang, F. How Does the Eye Warm? Part II: Sensitivity to Vertical Wind Shear and a Trajectory Analysis. J. Atmos. Sci. 2013, 70, 1849–1873. [Google Scholar] [CrossRef]
  40. Davis, C.A.; Jones, S.C.; Riemer, M. Hurricane Vortex Dynamics during Atlantic Extratropical Transition. J. Atmos. Sci. 2008, 65, 714–736. [Google Scholar] [CrossRef] [Green Version]
  41. Cavicchia, L.; von Storch, H.; Gualdi, S. A long-term climatology of medicanes. Clim. Dyn. 2014, 43, 1183–1195. [Google Scholar] [CrossRef]
  42. Lu, C. A Modified Algorithm for Identifying and Tracking Extratropical Cyclones. Adv. Atmos. Sci. 2017, 34, 909–924. [Google Scholar] [CrossRef]
  43. Nolan, D.S.; Montgomery, M.T. Nonhydrostatic, Three-Dimensional Perturbations to Balanced, Hurricane-like Vortices. Part I: Linearized Formulation, Stability, and Evolution. J. Atmos. Sci. 2002, 59, 2989–3020. [Google Scholar] [CrossRef]
  44. Nolan, D.S.; Moon, Y.; Stern, D.P. Tropical Cyclone Intensification from Asymmetric Convection: Energetics and Efficiency. J. Atmos. Sci. 2007, 64, 3377–3405. [Google Scholar] [CrossRef]
  45. Kampstra, P. Beanplot: A Boxplot Alternative for Visual Comparison of Distributions. J. Stat. Softw. 2008, 28, 1–9. [Google Scholar] [CrossRef] [Green Version]
  46. Wang, H.; Wang, Y.; Xu, H. Improving simulation of a tropical cyclone using dynamical initialization and large-scale spectral nudging: A case study of Typhoon Megi (2010). Acta Meteorol. Sin. 2013, 27, 455–475. [Google Scholar] [CrossRef]
  47. Wang, H.; Wang, Y. A Numerical Study of Typhoon Megi (2010). Part I: Rapid Intensification. Mon. Weather Rev. 2014, 142, 29–48. [Google Scholar] [CrossRef]
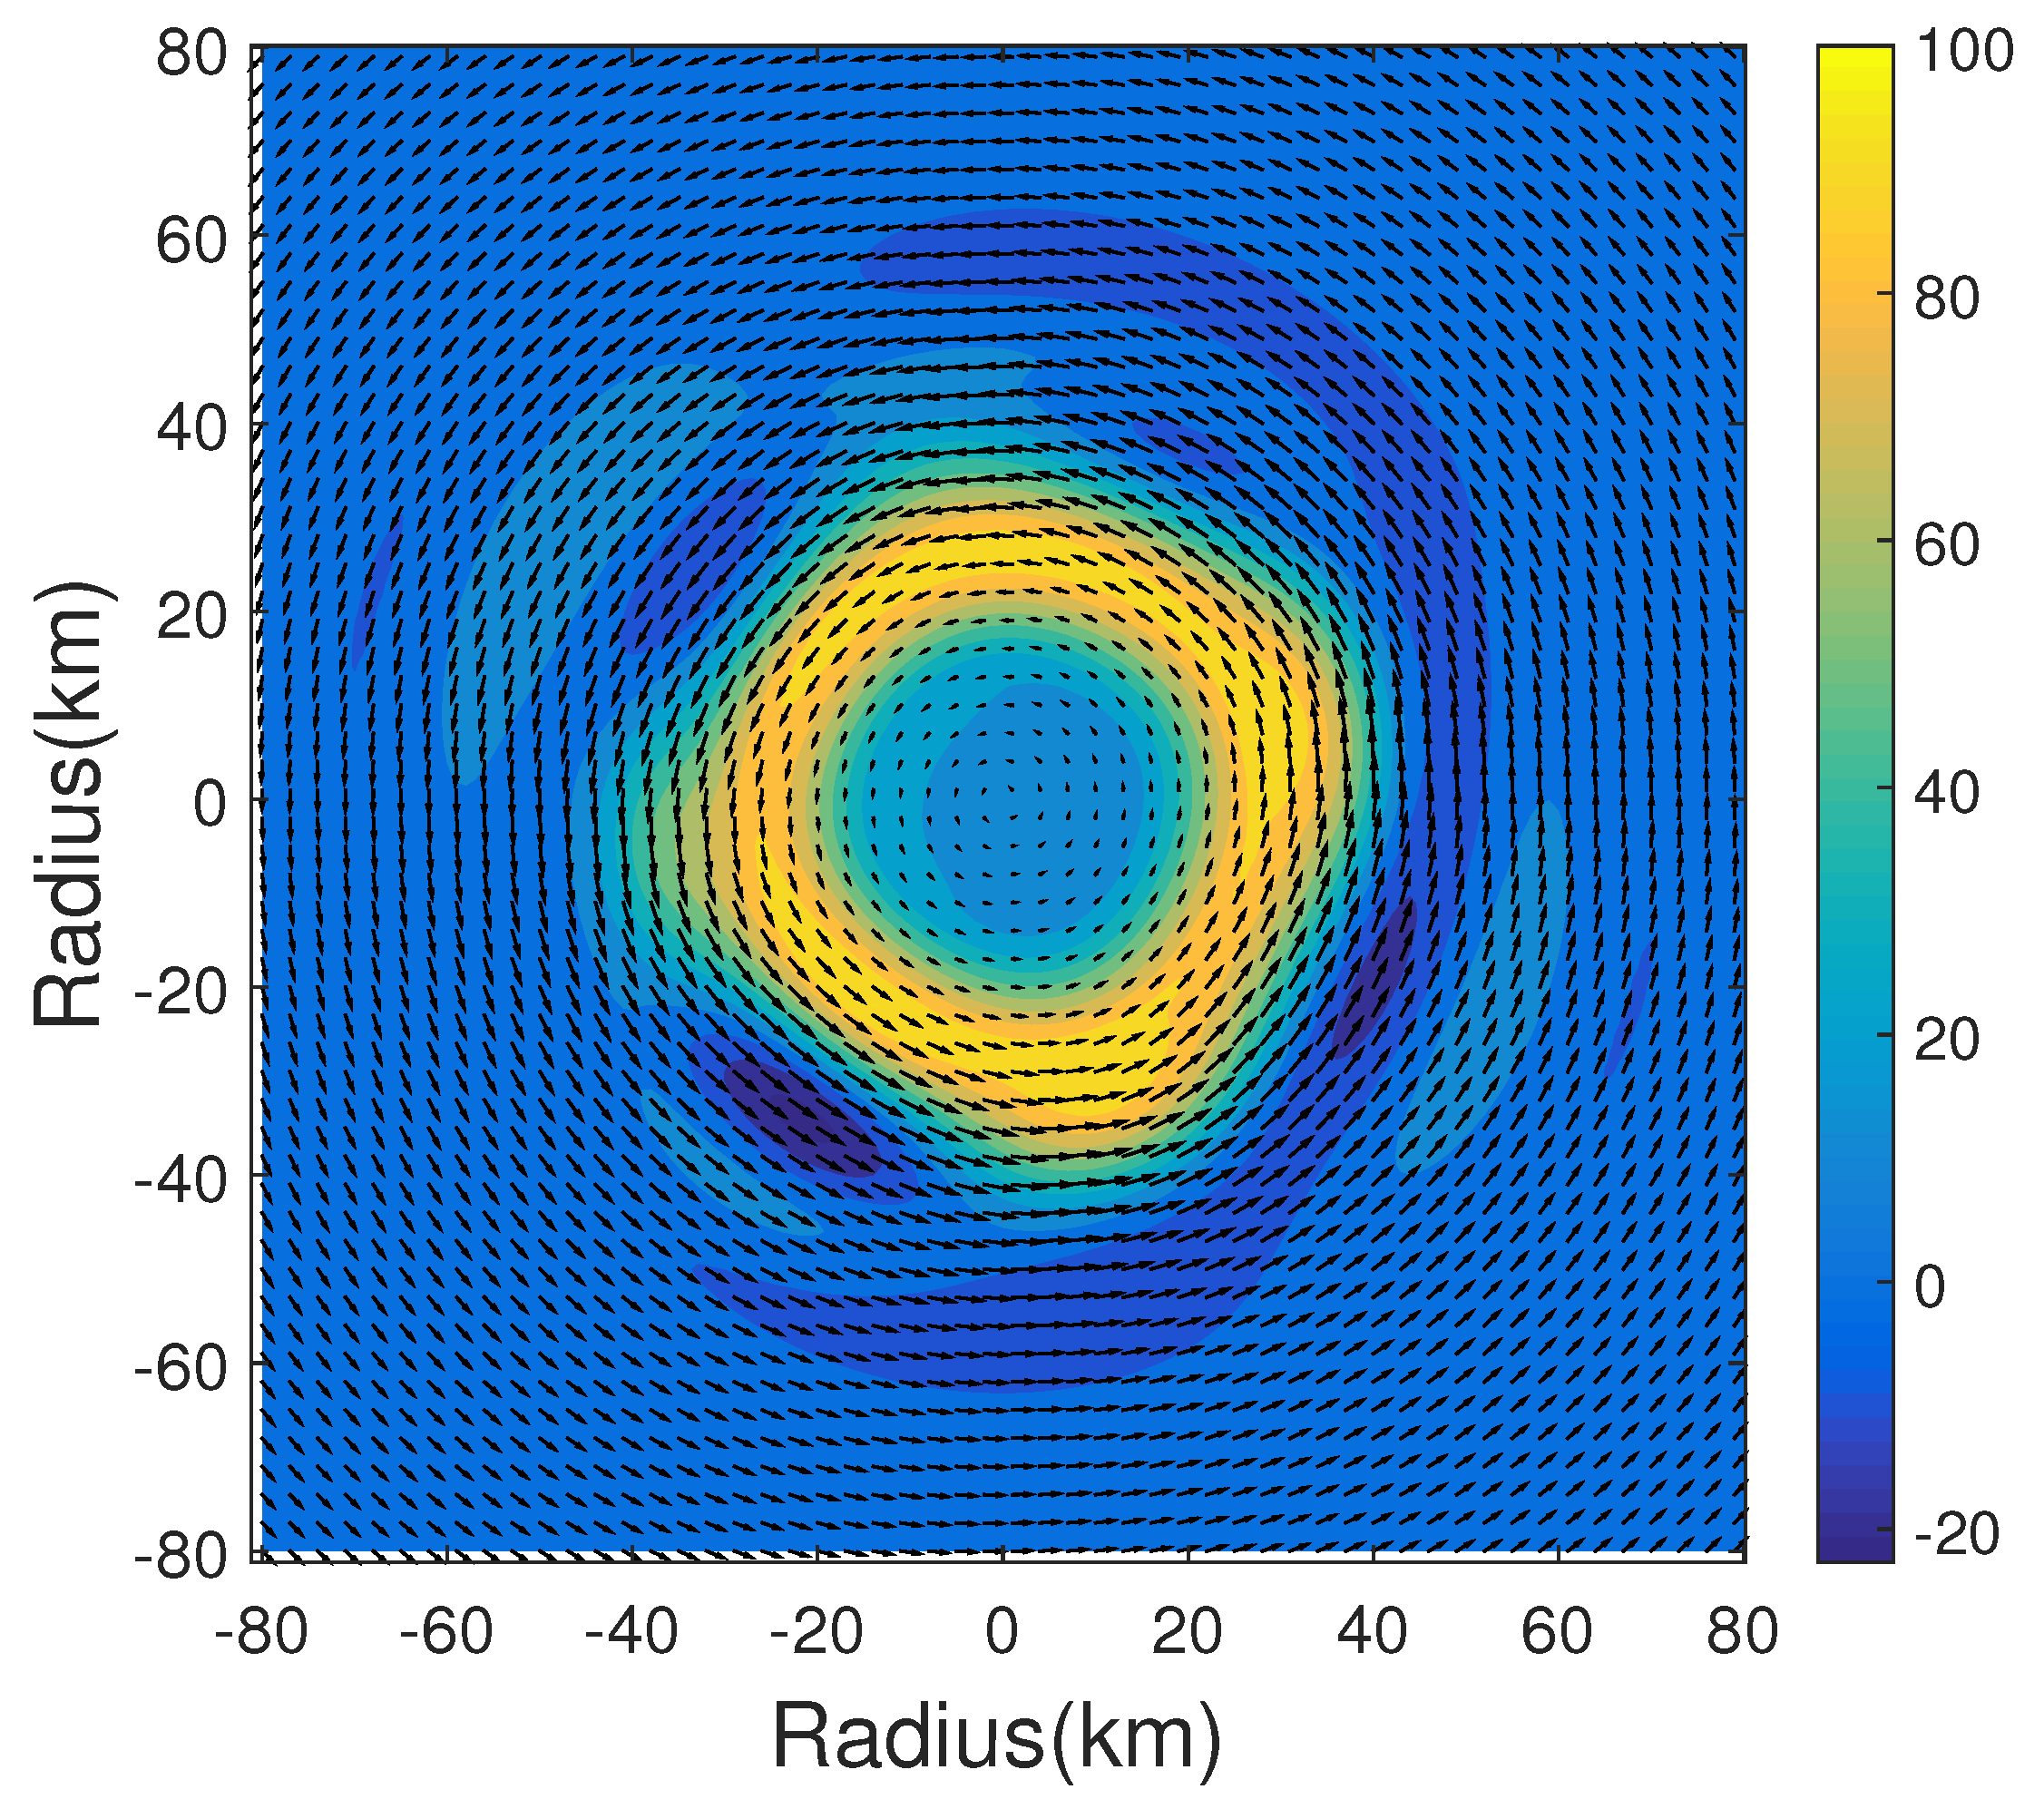
Figure 1. The normalized vorticity (shaded) and horizontal winds (arrows) of a sample vortex. The vorticity field was normalized by the maximum vorticity ( 2.64 × 10 3 ) s 1 .
Atmosphere 10 00376 g001
Figure 2. The statistics of position error according to normalized domain size. (a) the boxplot of position error. (b) the group averaged position error (blue line and circles) and standard deviation (red line and crosses) in each group.
Atmosphere 10 00376 g002
Figure 3. The statistics of position error according to normalized truncated scale. (a) the boxplot of position error. (b) the group averaged position error (blue line and circles) and standard deviation (red line and crosses) in each group.
Atmosphere 10 00376 g003
Figure 4. The statistics of position error according to normalized searching radius. (a) the boxplot of position error. (b) the group averaged position error (blue line and circles) and standard deviation (red line and crosses) in each group.
Atmosphere 10 00376 g004
Figure 5. The center positions of the fifty vortexes in the testing group detected by the FVC method (red dots) and the VC method (blue dots). Black lines from inner to outer represent position errors increasing from 0.5 km to 3 km linearly.
Atmosphere 10 00376 g005
Figure 6. Track of Typhoon Soudelor (2015) with every 6-h position from 0000 UTC 3 August to 0000 UTC 8 August 2015 based on the JTWC best track data (red line) and simulation (black line). The solid circles with different colors represent different categories. The solid circles of the JTWC best track data are plotted northeast to the track with the information of date.
Atmosphere 10 00376 g006
Figure 7. The evolution of maximum surface wind (blue) and minimum surface level pressure (red). Those from simulation and JWTC best track data are represented by solid and dash lines, respectively.
Atmosphere 10 00376 g007
Figure 8. Tracks of Typhoon Soudelor (2015) with every 6-h position from 0000 UTC 3 August to 0000 UTC 8 August 2015 based on the six center-finding algorithms.
Atmosphere 10 00376 g008
Figure 9. The horizontal structures of simulated Soudelor including the surface level pressure (black lines), vorticity (shaded) and winds (wind-bars) at 10 m above the sea level. The location of detected centers are represented by different markers displayed at left. (af) display the fields at time 0900 UTC 3, 2300 UTC 3, 1700 UTC 5, 1900 UTC 6, 0000 UTC 7, and 2100 UTC 7 August, respectively.
Atmosphere 10 00376 g009
Table 1. Restrictions for each parameter to generate random vortexes.
r 2 (km)NumbersWavenumberAmplitude (m s 2 )b (RMW)c (km) φ (degree)
35–451–101–4 0.5 2.0 0.9 3.0 10–140–360
Table 2. Ranges of parameters for generating testing algorithms. Units are in kilometers. The interval of each parameter is displayed in blanks.
Domain Size Truncated ScaleSearching Radius
260–500 (40)50–150 (20)50–150 (20)
Table 3. Statistics on position error of two algorithms. Statistics are in kilometers.
MinMaxMeanMedianStd dev
VC 0.0 3.37 0.901 0.290 1.06
FVC 0.036 1.534 0.4 0.292 0.354
Table 4. Center-finding algorithms used in comparison.
MethodAbbreviation
Surface pressure minimumPmin
Pressure centroid, 100 km × 100 km weighting area, pressure min first guess, 1000 iterationsPC100
Pressure centroid, 150 km × 150 km weighting area, pressure min first guess, 1000 iterationsPC150
Vorticity centroid, 100 km × 100 km weighting area, pressure min first guess, 1000 iterationsVC100
Vorticity centroid, 150 km × 150 km weighting area, pressure min first guess, 1000 iterationsVC150
The proposed objective center-finding algorithmFVC
Table 5. WRF model settings.
Mesh 1Mesh 2Mesh 3
Time steps (s)45155
Cloud microphysicsWSM6 (Hong and Lim 2006)WSM6WSM6
Longwave radiationRRTM (Hong and Lim 2006)RRTMRRTM
Shortwave radiationDudhia (Dudhia 1989)DudhiaDudhia
Cumulus convectionKain-Fritsch (Kain 2005)NoNo
PBL schemeMYNN2.5 (Nakanishi and Niino 2004)MYNN2.5MYNN2.5
Land surface processesNoah (Ek et al. 2003)NoahNoah