Impacts of Urban Expansion on Relatively Smaller Surrounding Cities during Heat Waves
Abstract
1. Introduction
2. Methodology
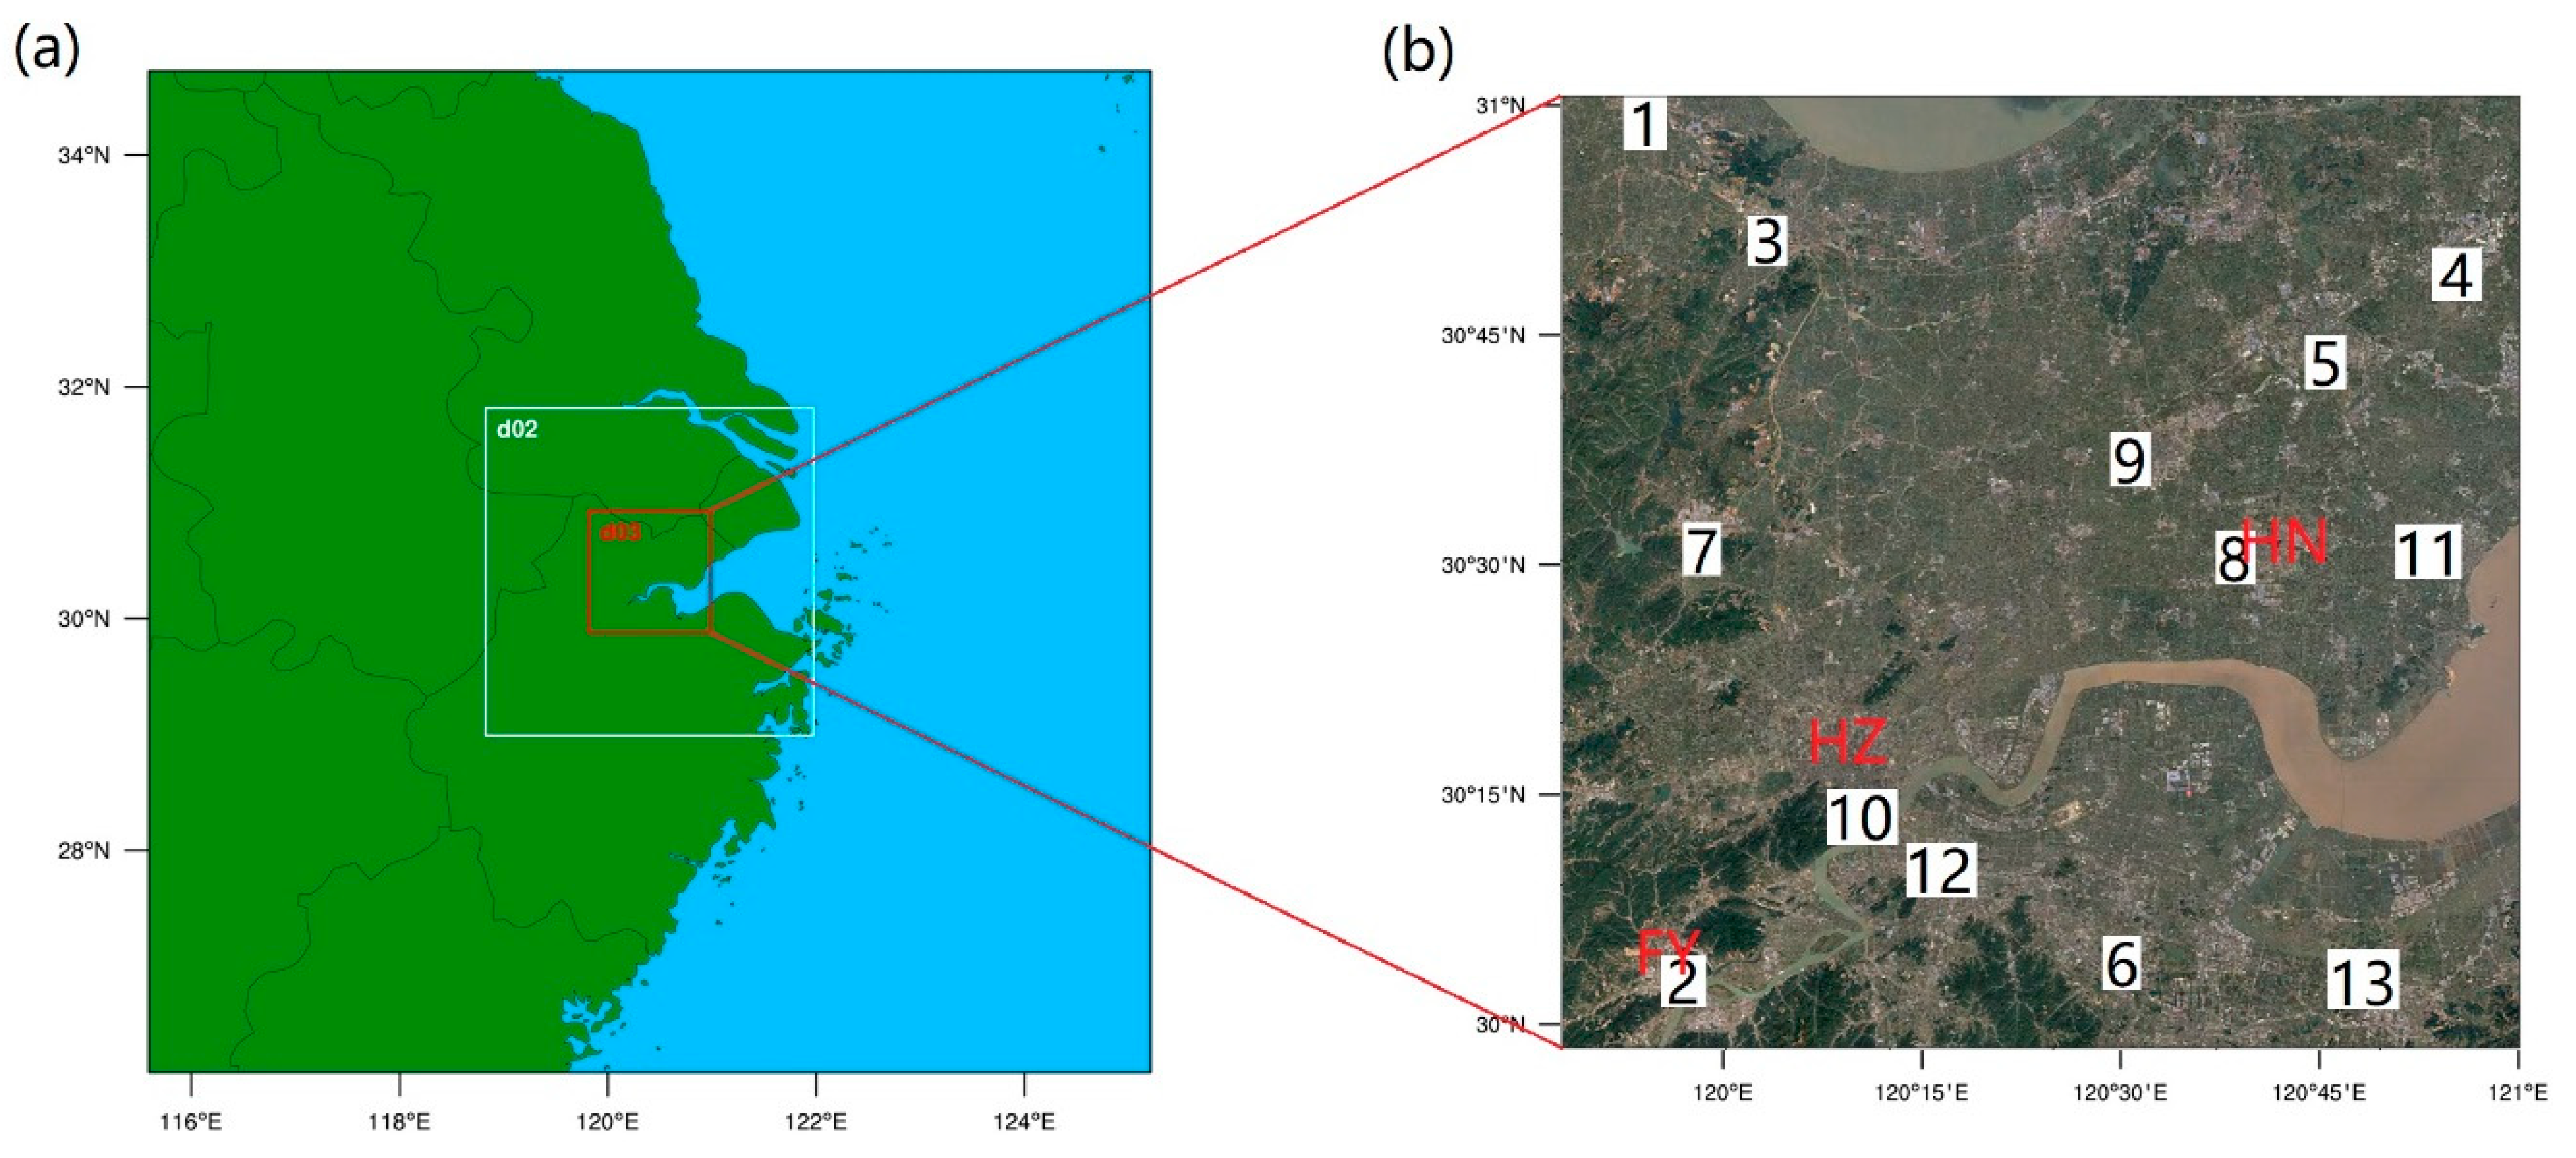
2.1. Study Area
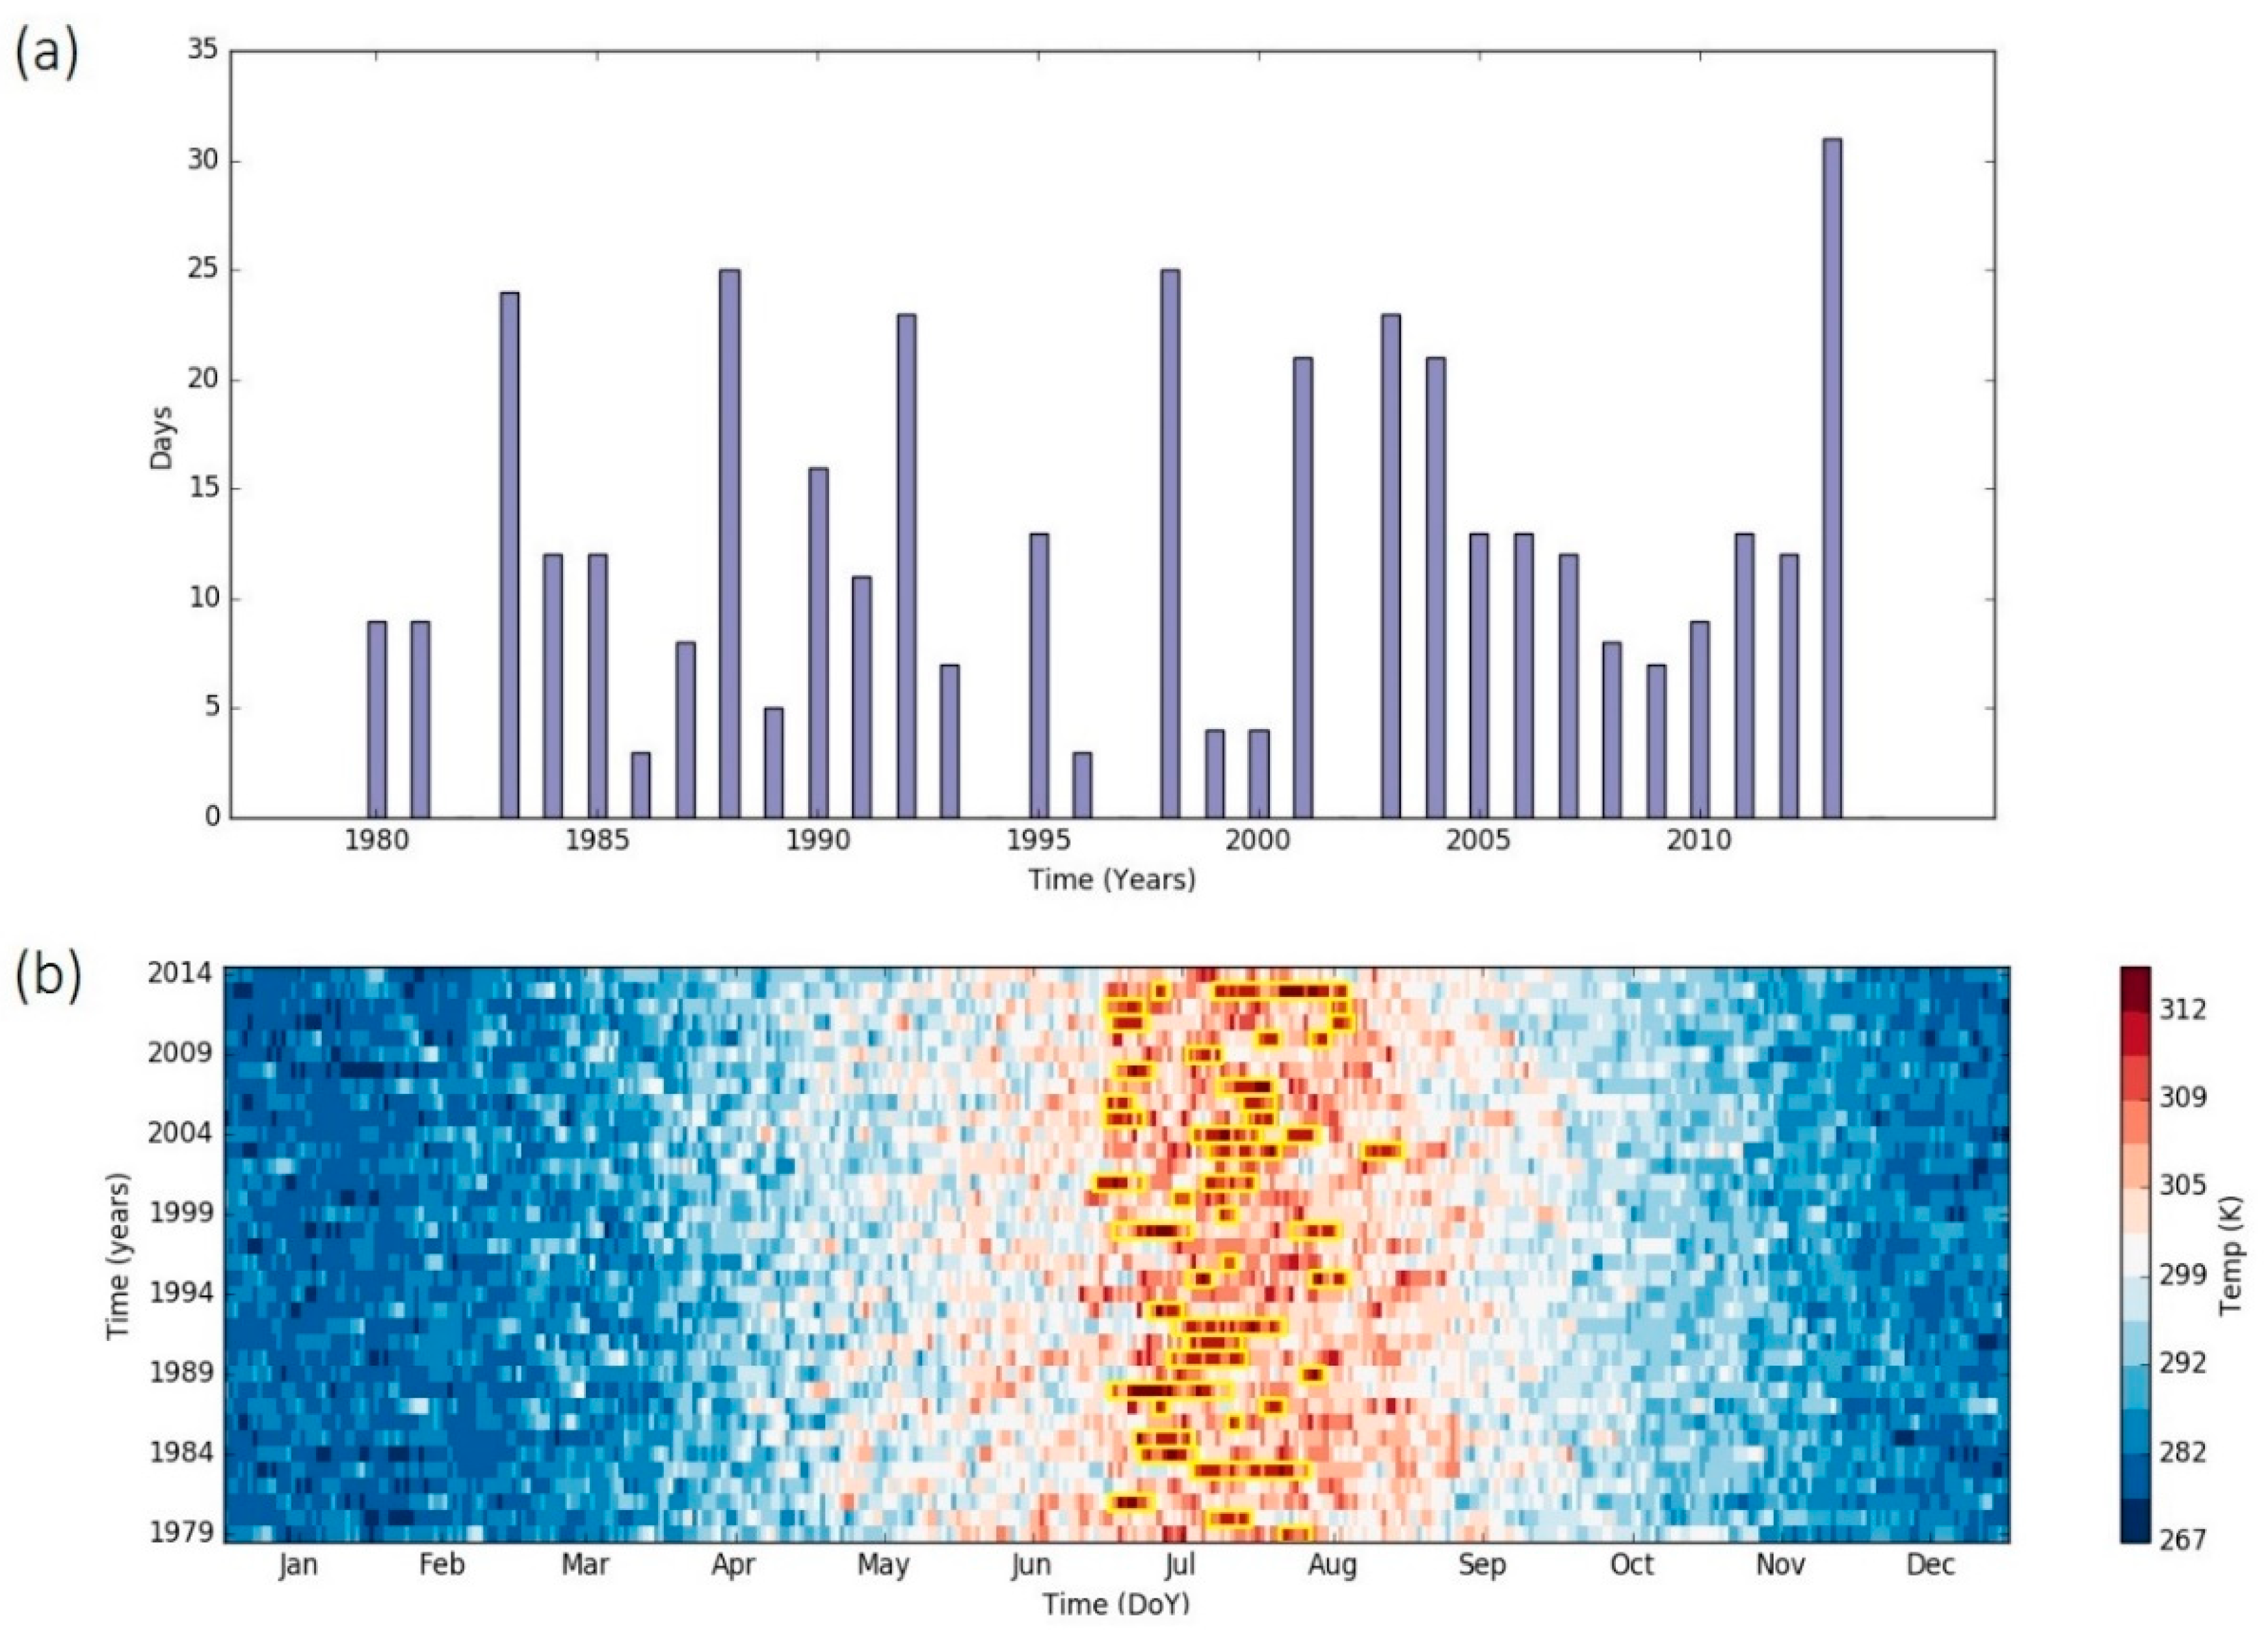
2.2. Heat Wave Characteristics
2.3. Simulation Configuration
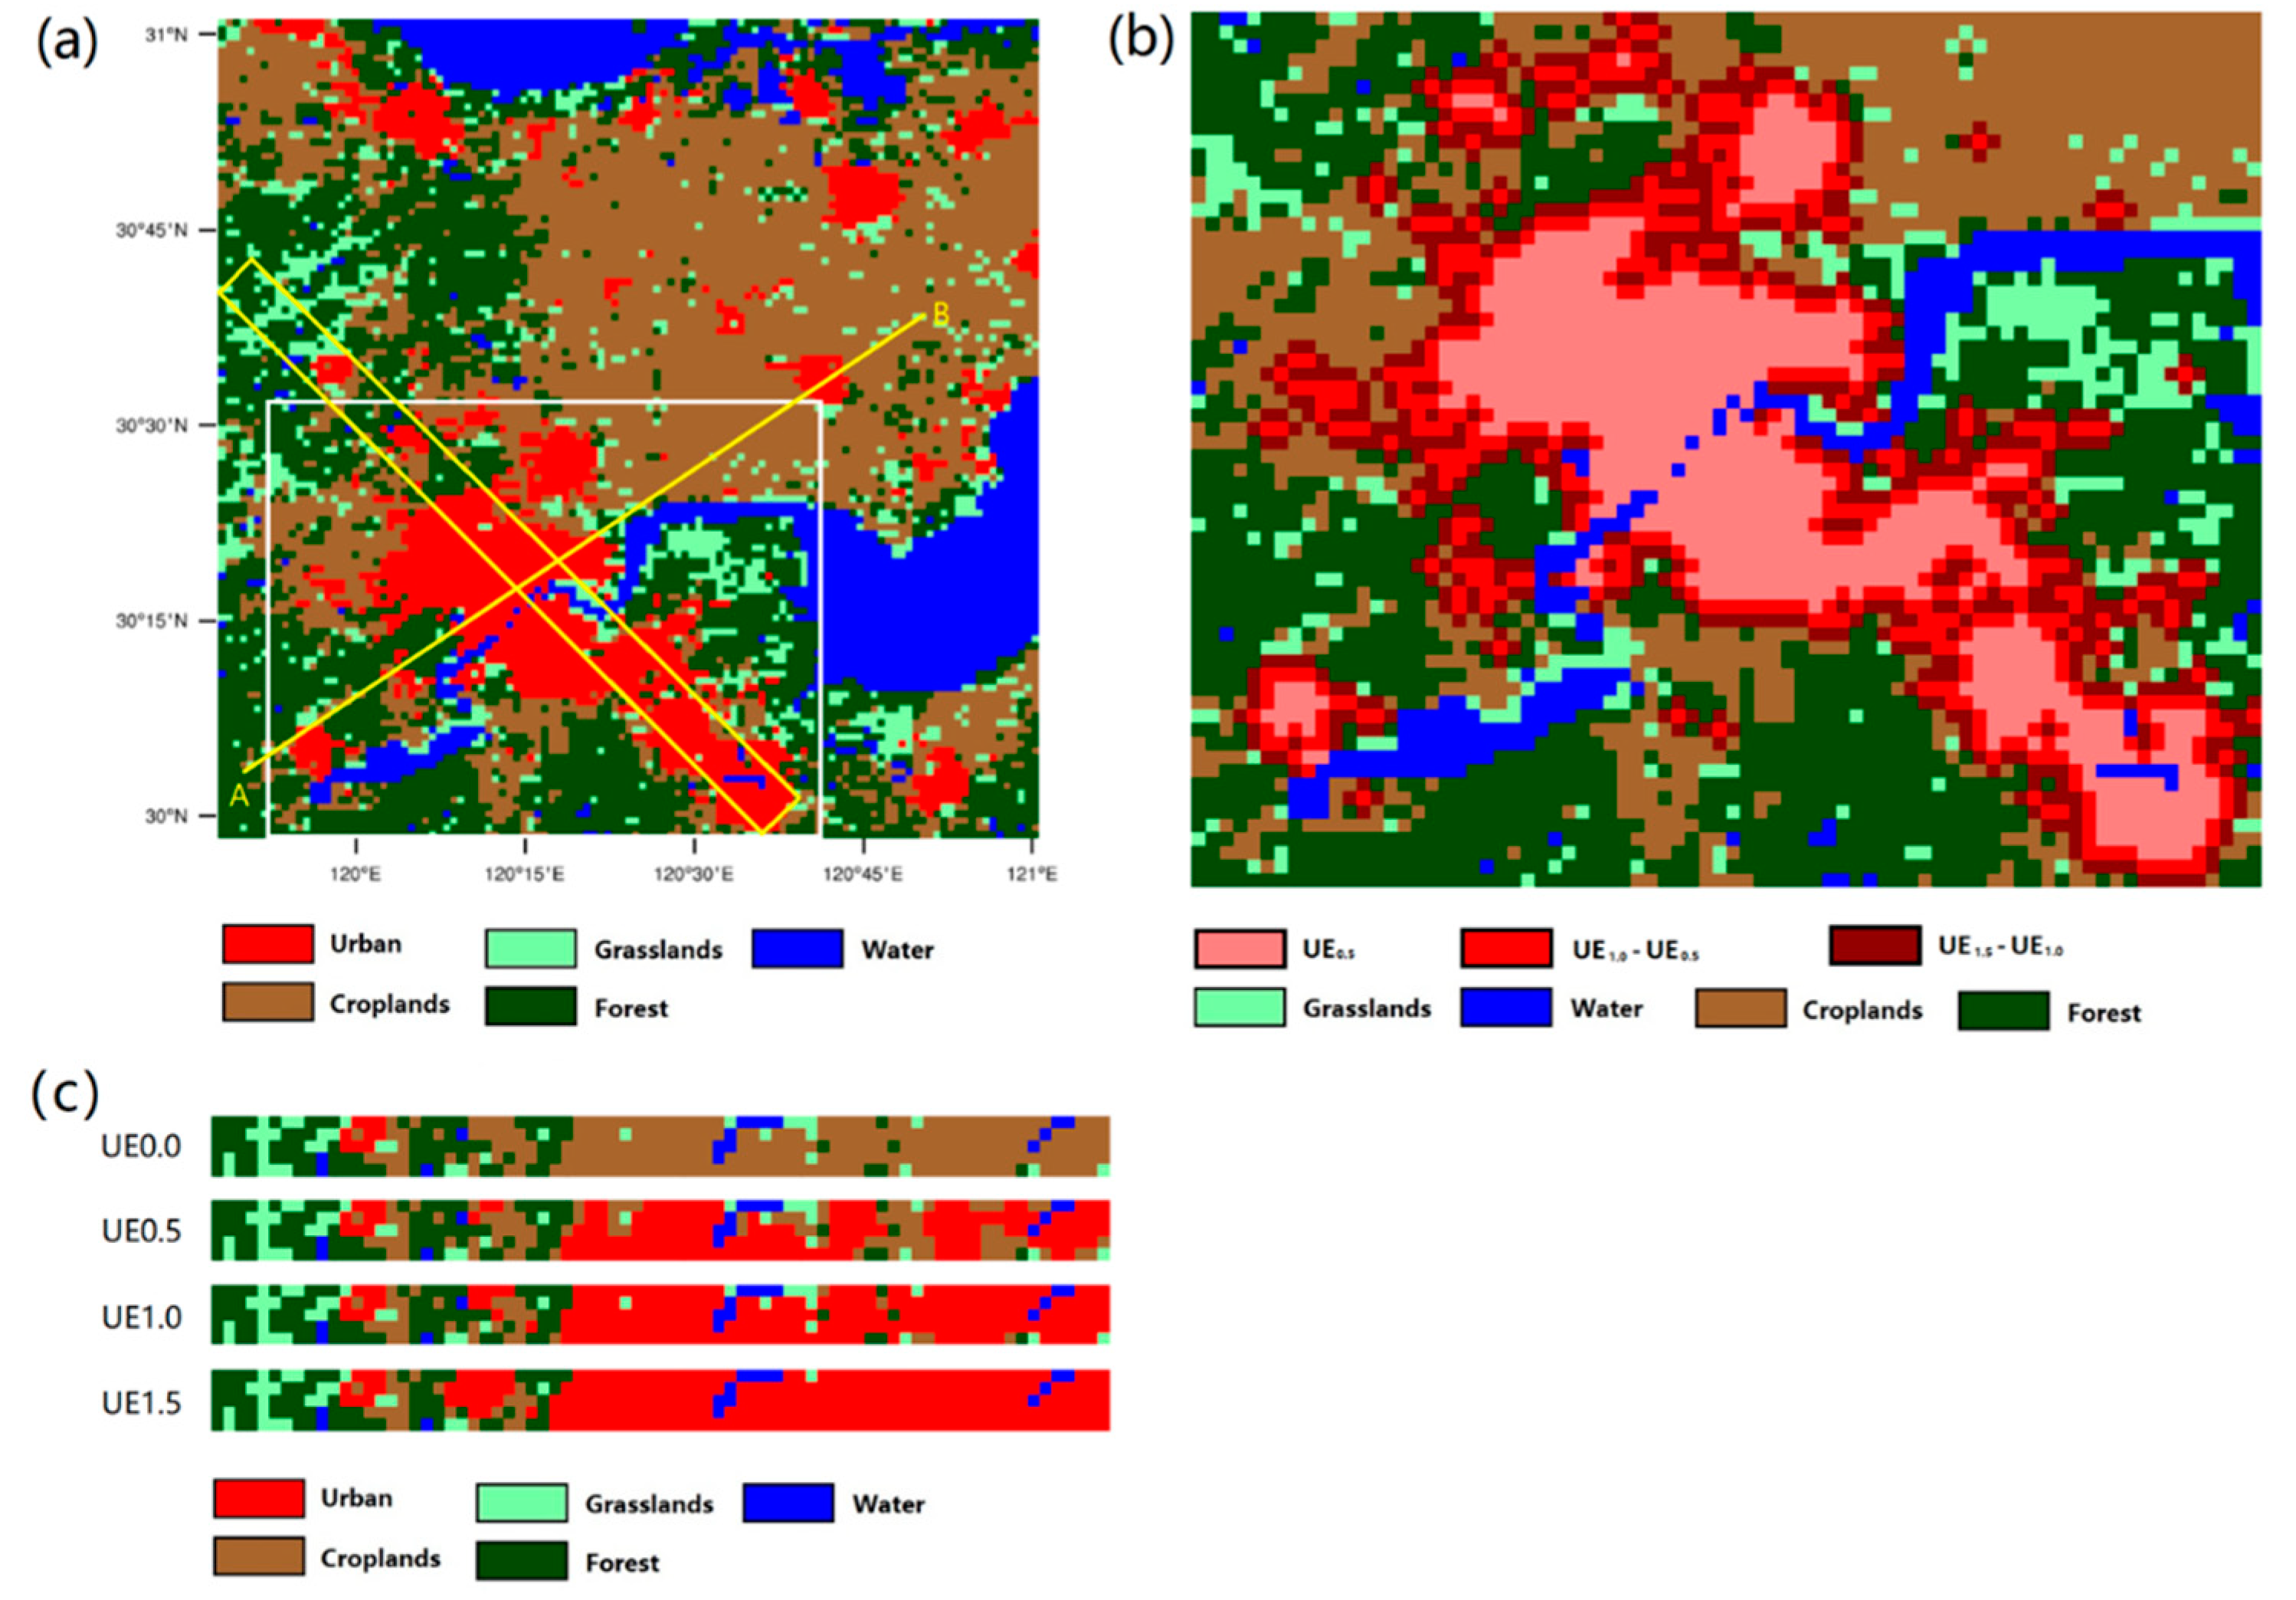
2.4. Numerical Experimental Design
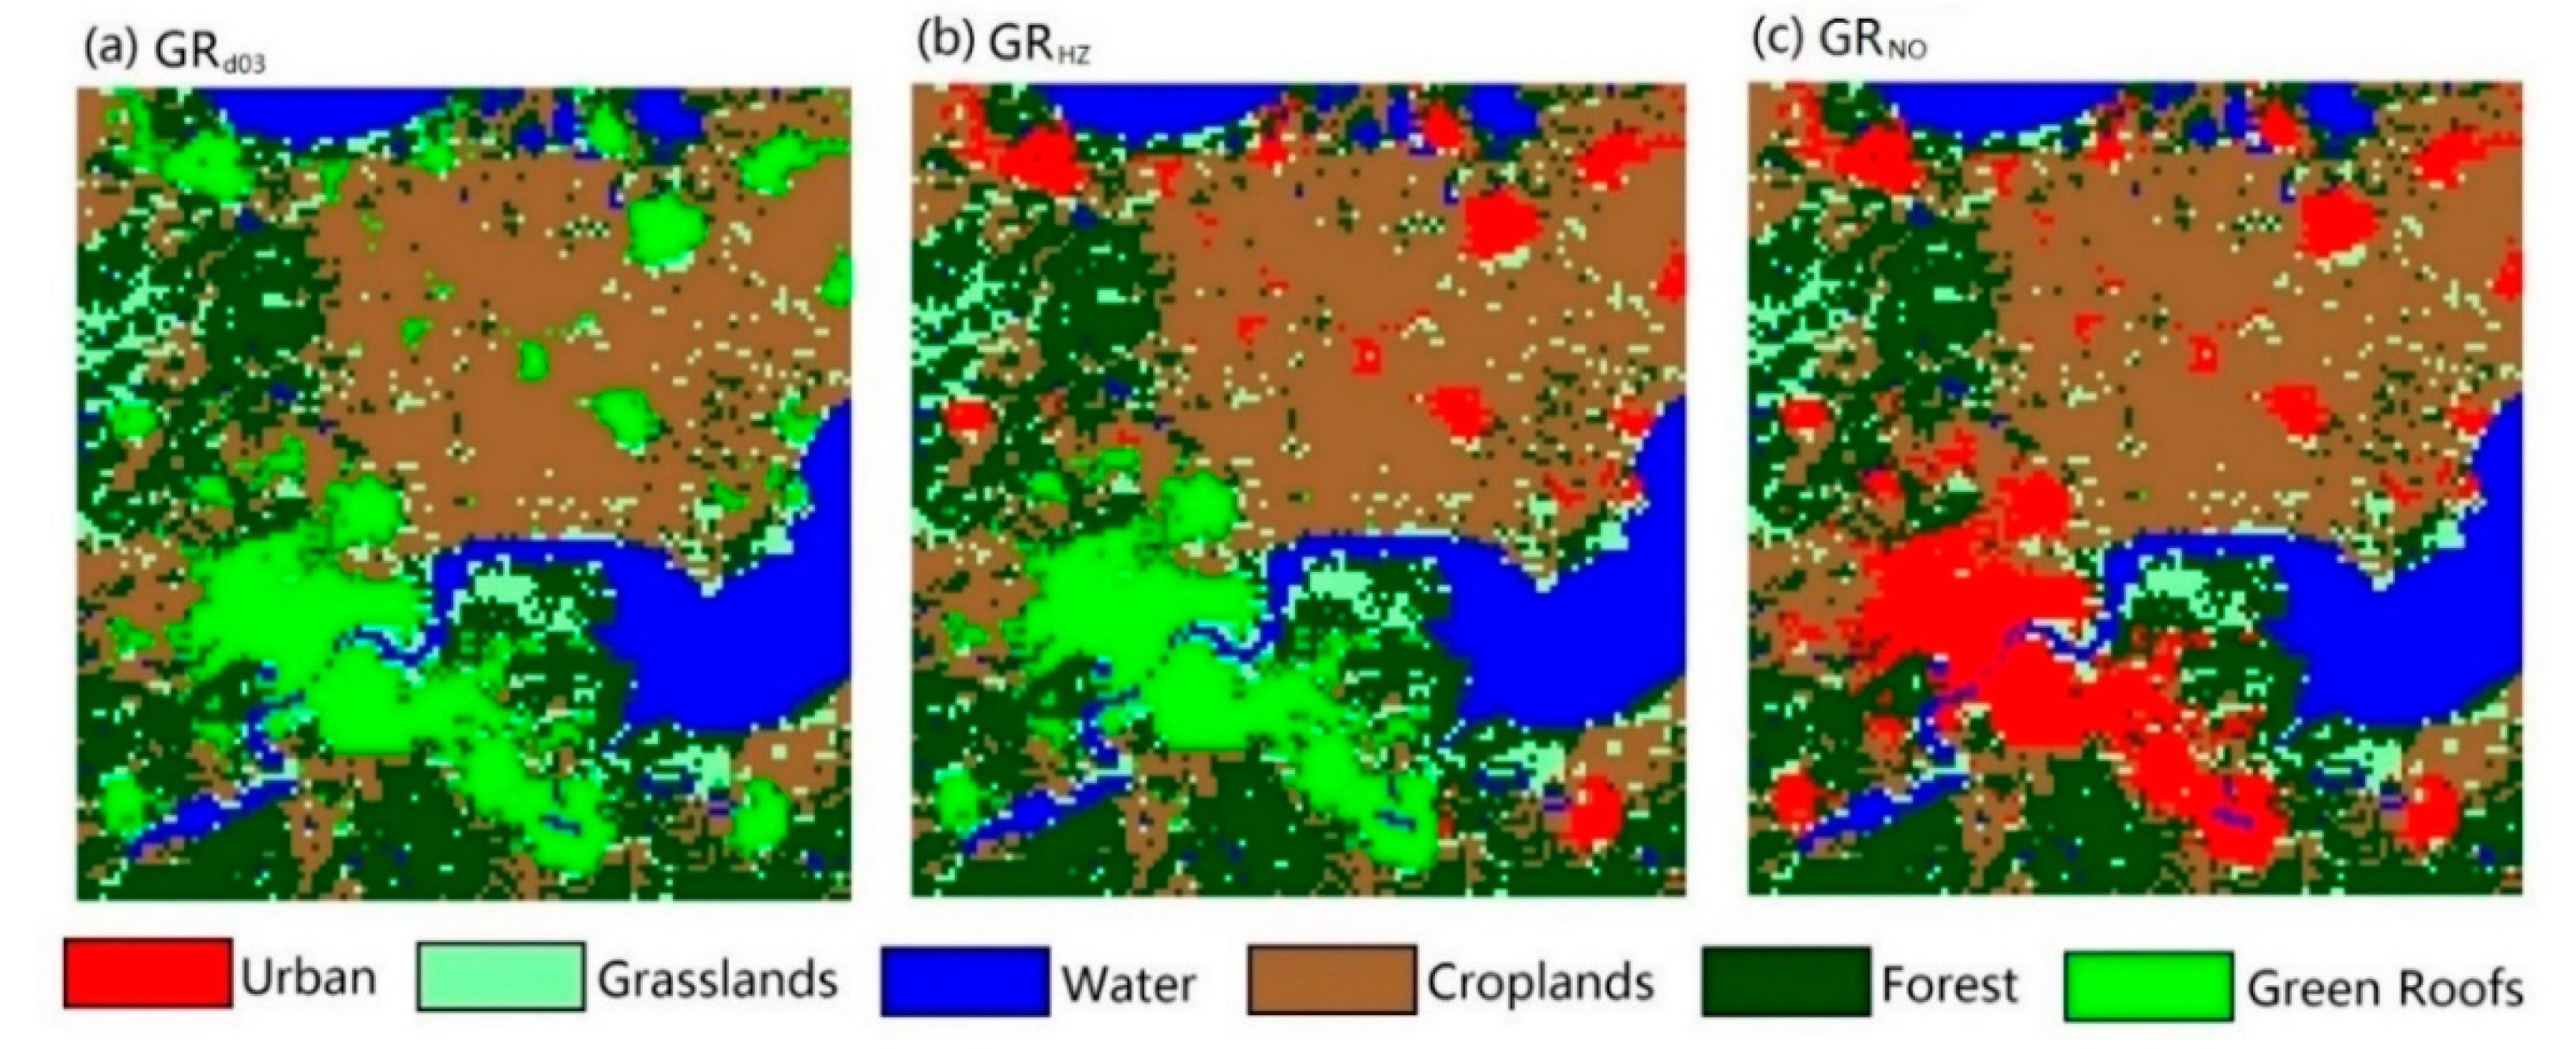
- UE1.0: current urban extent (IGBP-Modified MODIS 20-category data [48]);
- UE1.5: a 1 km outward expansion in both the east–west and north–south directions (water body grids remain unchanged), creating an urban area 152.3% of the present-day extent;
- UE0.5: an urban contraction in both directions, to become 57% of the current extent (area is replaced with crops, water areas unchanged);
- UE0.0: all urban grids (Figure 3) changed to crops.
2.5. Evaluation of Model Performance
3. Impacts of the Upwind Megacity Size
4. Impacts on the Downwind Regions
5. Can these Urban Expansion Impacts Be Mitigated with Green Roofs?
6. Concluding Remarks
- Without the urban surface of Hangzhou, the 2 m temperature is 5 °C lower at night, and the 2 m specific humidity is 3.5 g kg−1 higher during the daytime, compared to the current urban extent (UE1.0).
- With increasing urban expansion, an increase of nighttime 2 m air temperature of 2.7 °C for UE0.5 to UE1.0, and 1.7 °C for UE1.0 to UE1.5, as well as a 2.1 g kg-1 and 1.4 g kg-1 decrease, respectively, of daytime 2 m specific humidity are predicted.
- Greater heat flux heterogeneity caused by urban areas leads to an increase of 1.0 and 0.8 m s-1 for 10 m wind speed in Hangzhou.
- Comparison of the conditions for a small city upwind (Fuyang) and downwind (Haining) of the megacity (Hangzhou) indicates large impacts from upwind urban expansion on regional climate.
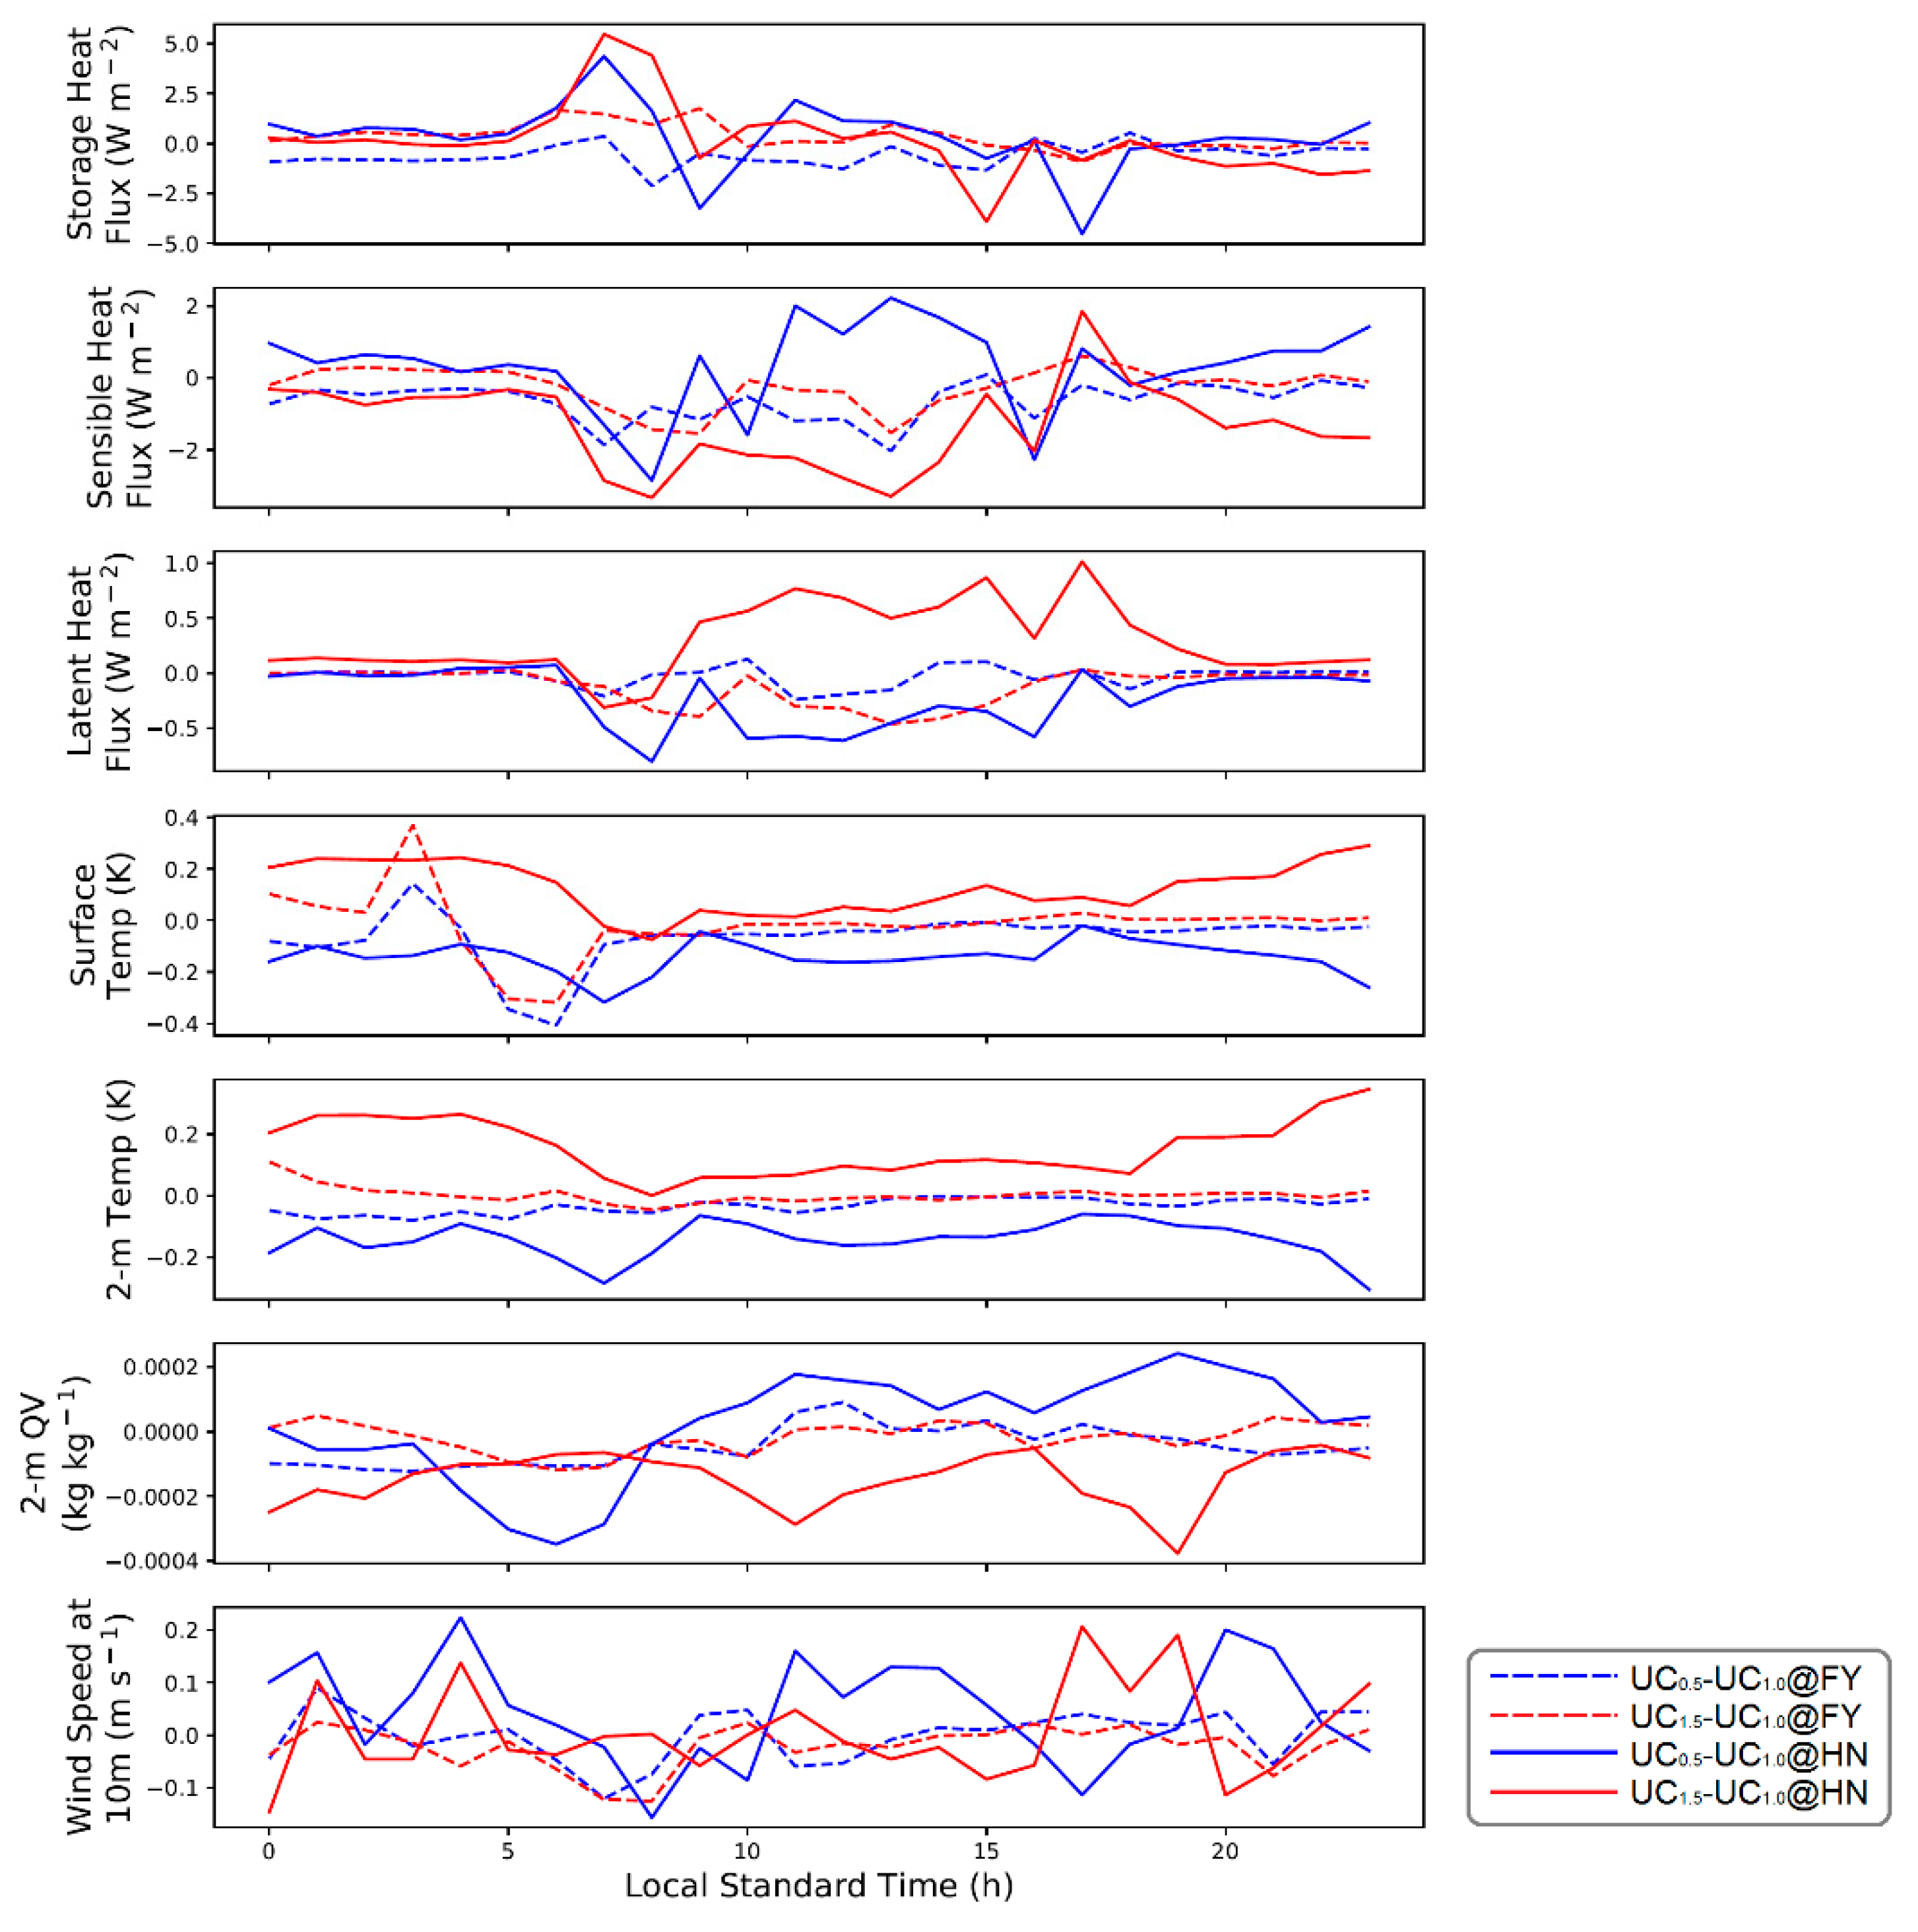
- Given the predominant southwesterly winds, the urbanization in Hangzhou increases 2 m air temperature in Haining by about 0.3 °C between UE0.5 and UE1.0, and 0.4 °C between UE1.0 and UE1.5, while the increases are about 0.05 °C and 0.1 °C, respectively, for Fuyang.
- The strongest and widest warming effect appears at 0700 LST, and the weakest effect occurs in the afternoon. Similar results are predicted for 2 m specific humidity and 10 m wind speed.
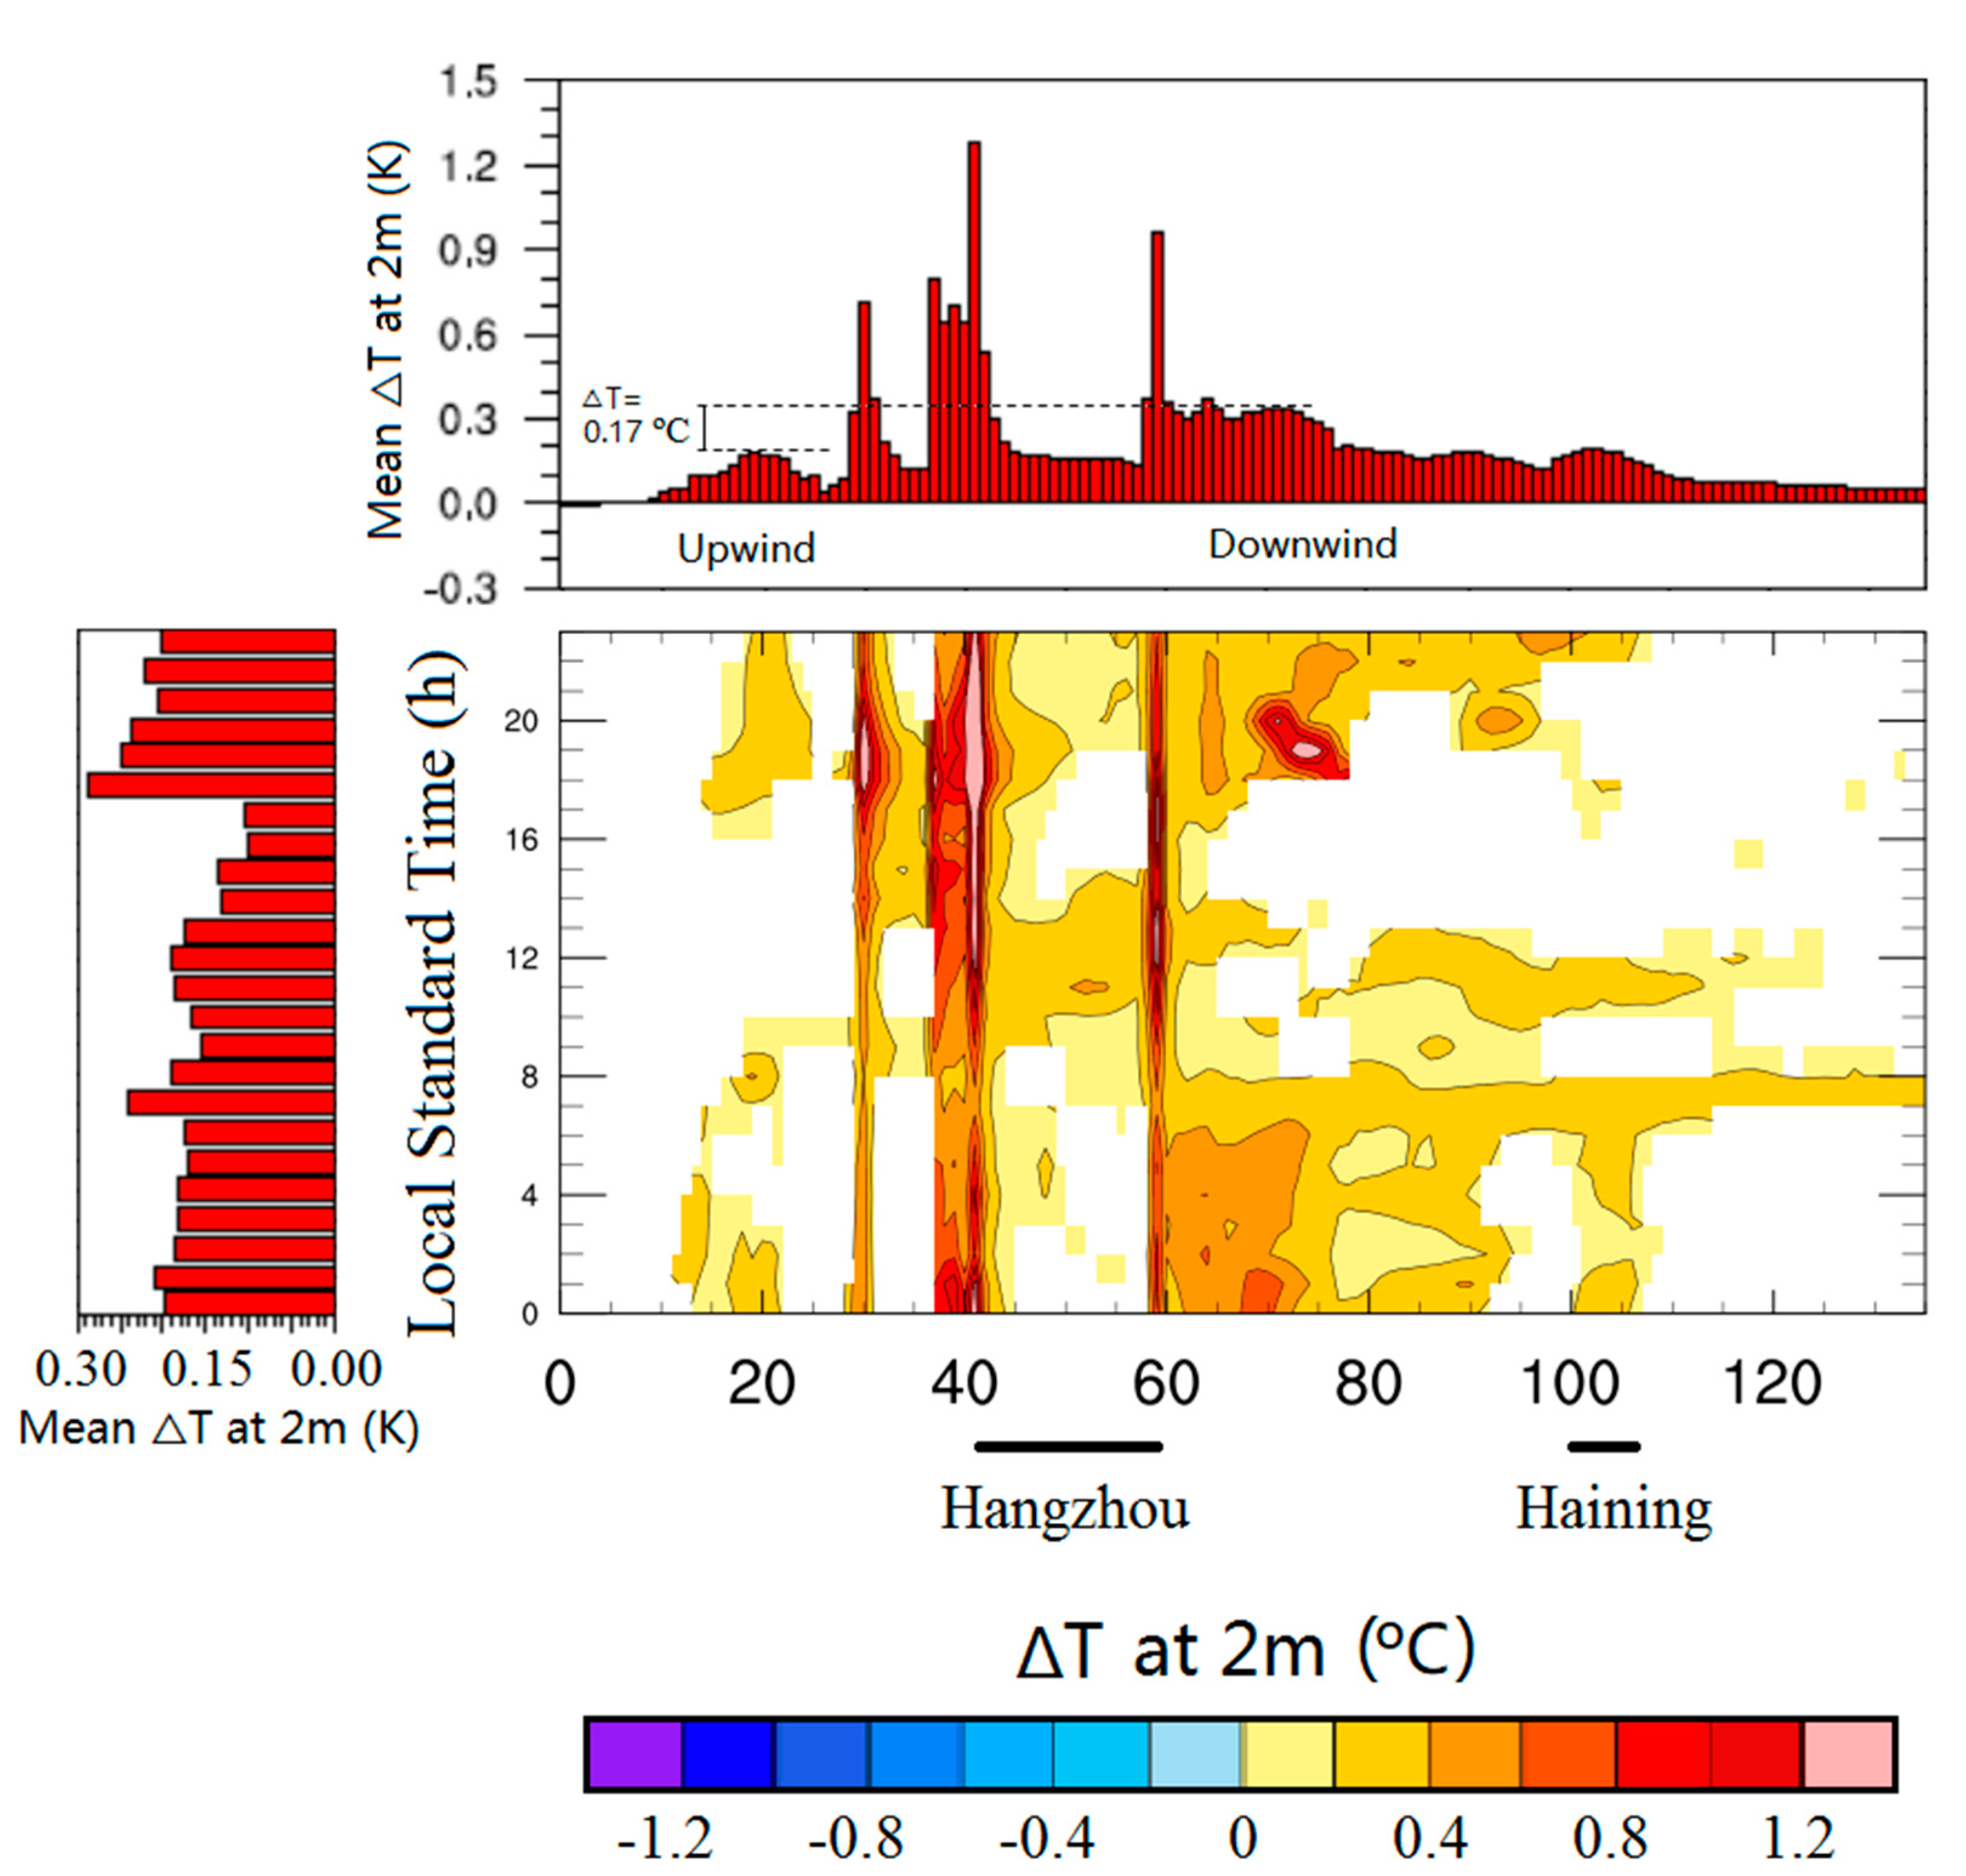
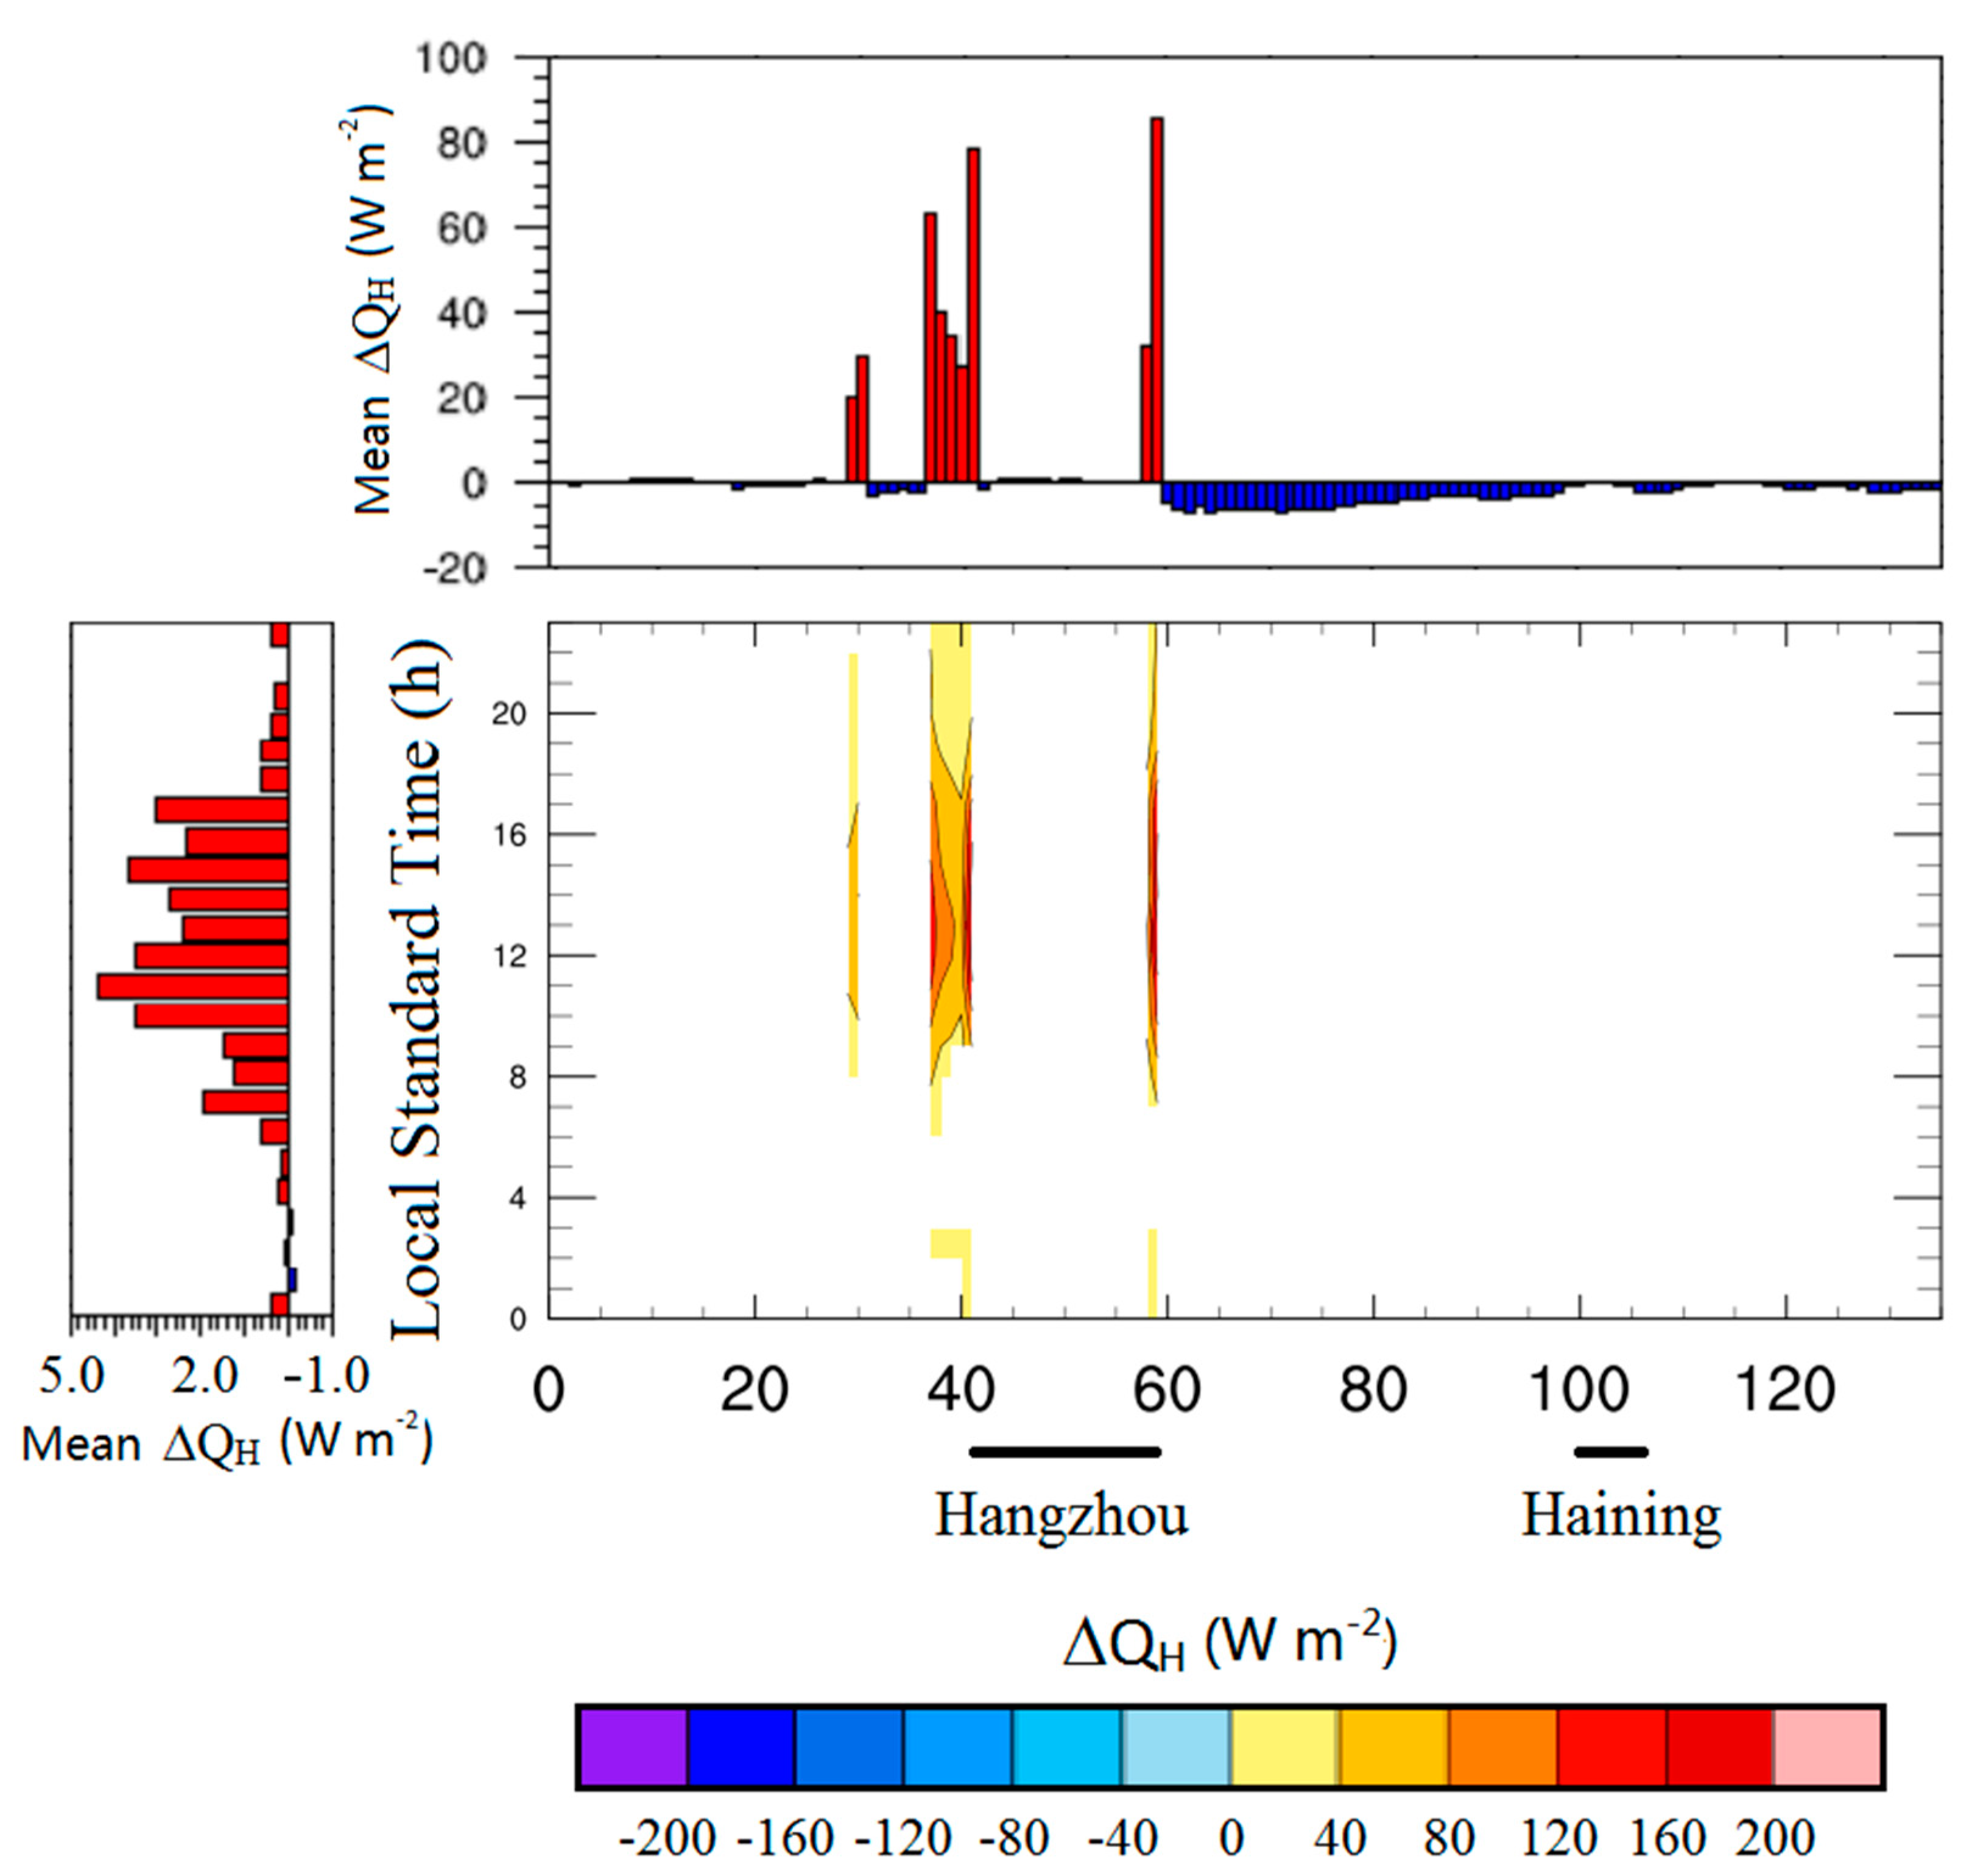
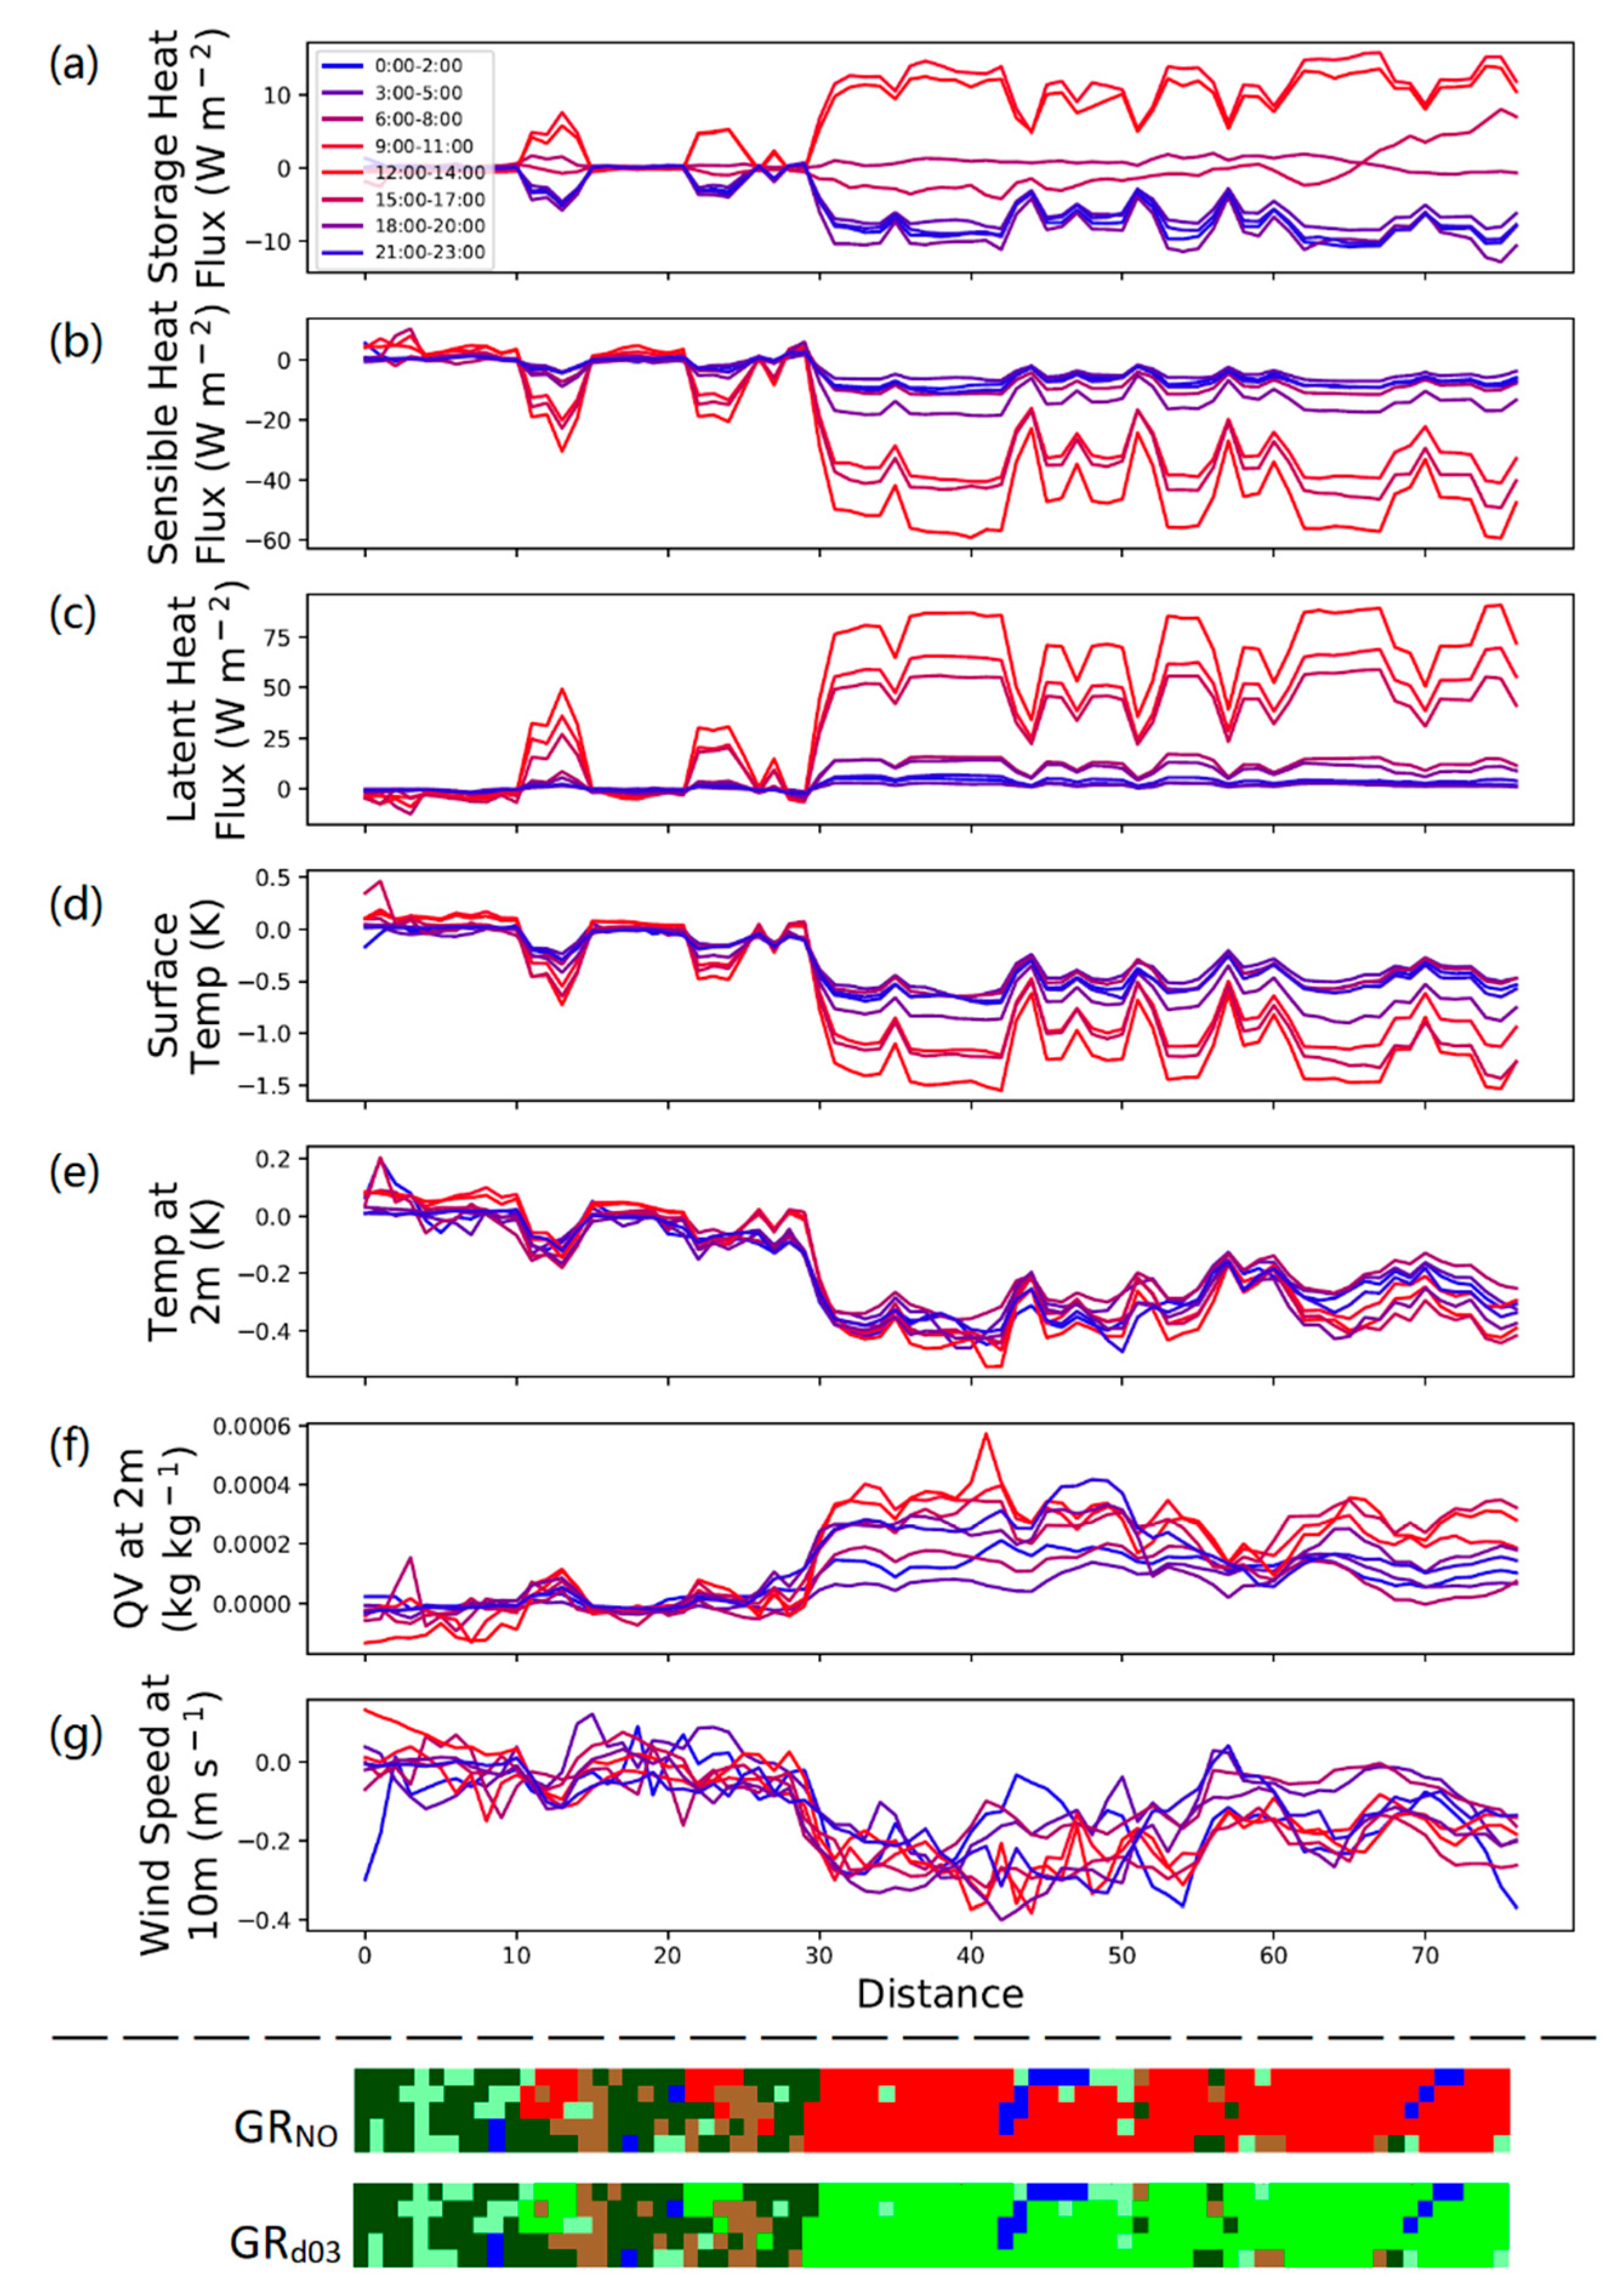
- Green roof coverage of 50% in the d03 area could reduce the daytime 2 m air temperature in Hangzhou by 0.5 °C, and increase the 2 m specific humidity by 0.6 g kg−1. Such changes effectively alleviate the UHI effect and the “dry island” effect within Hangzhou.
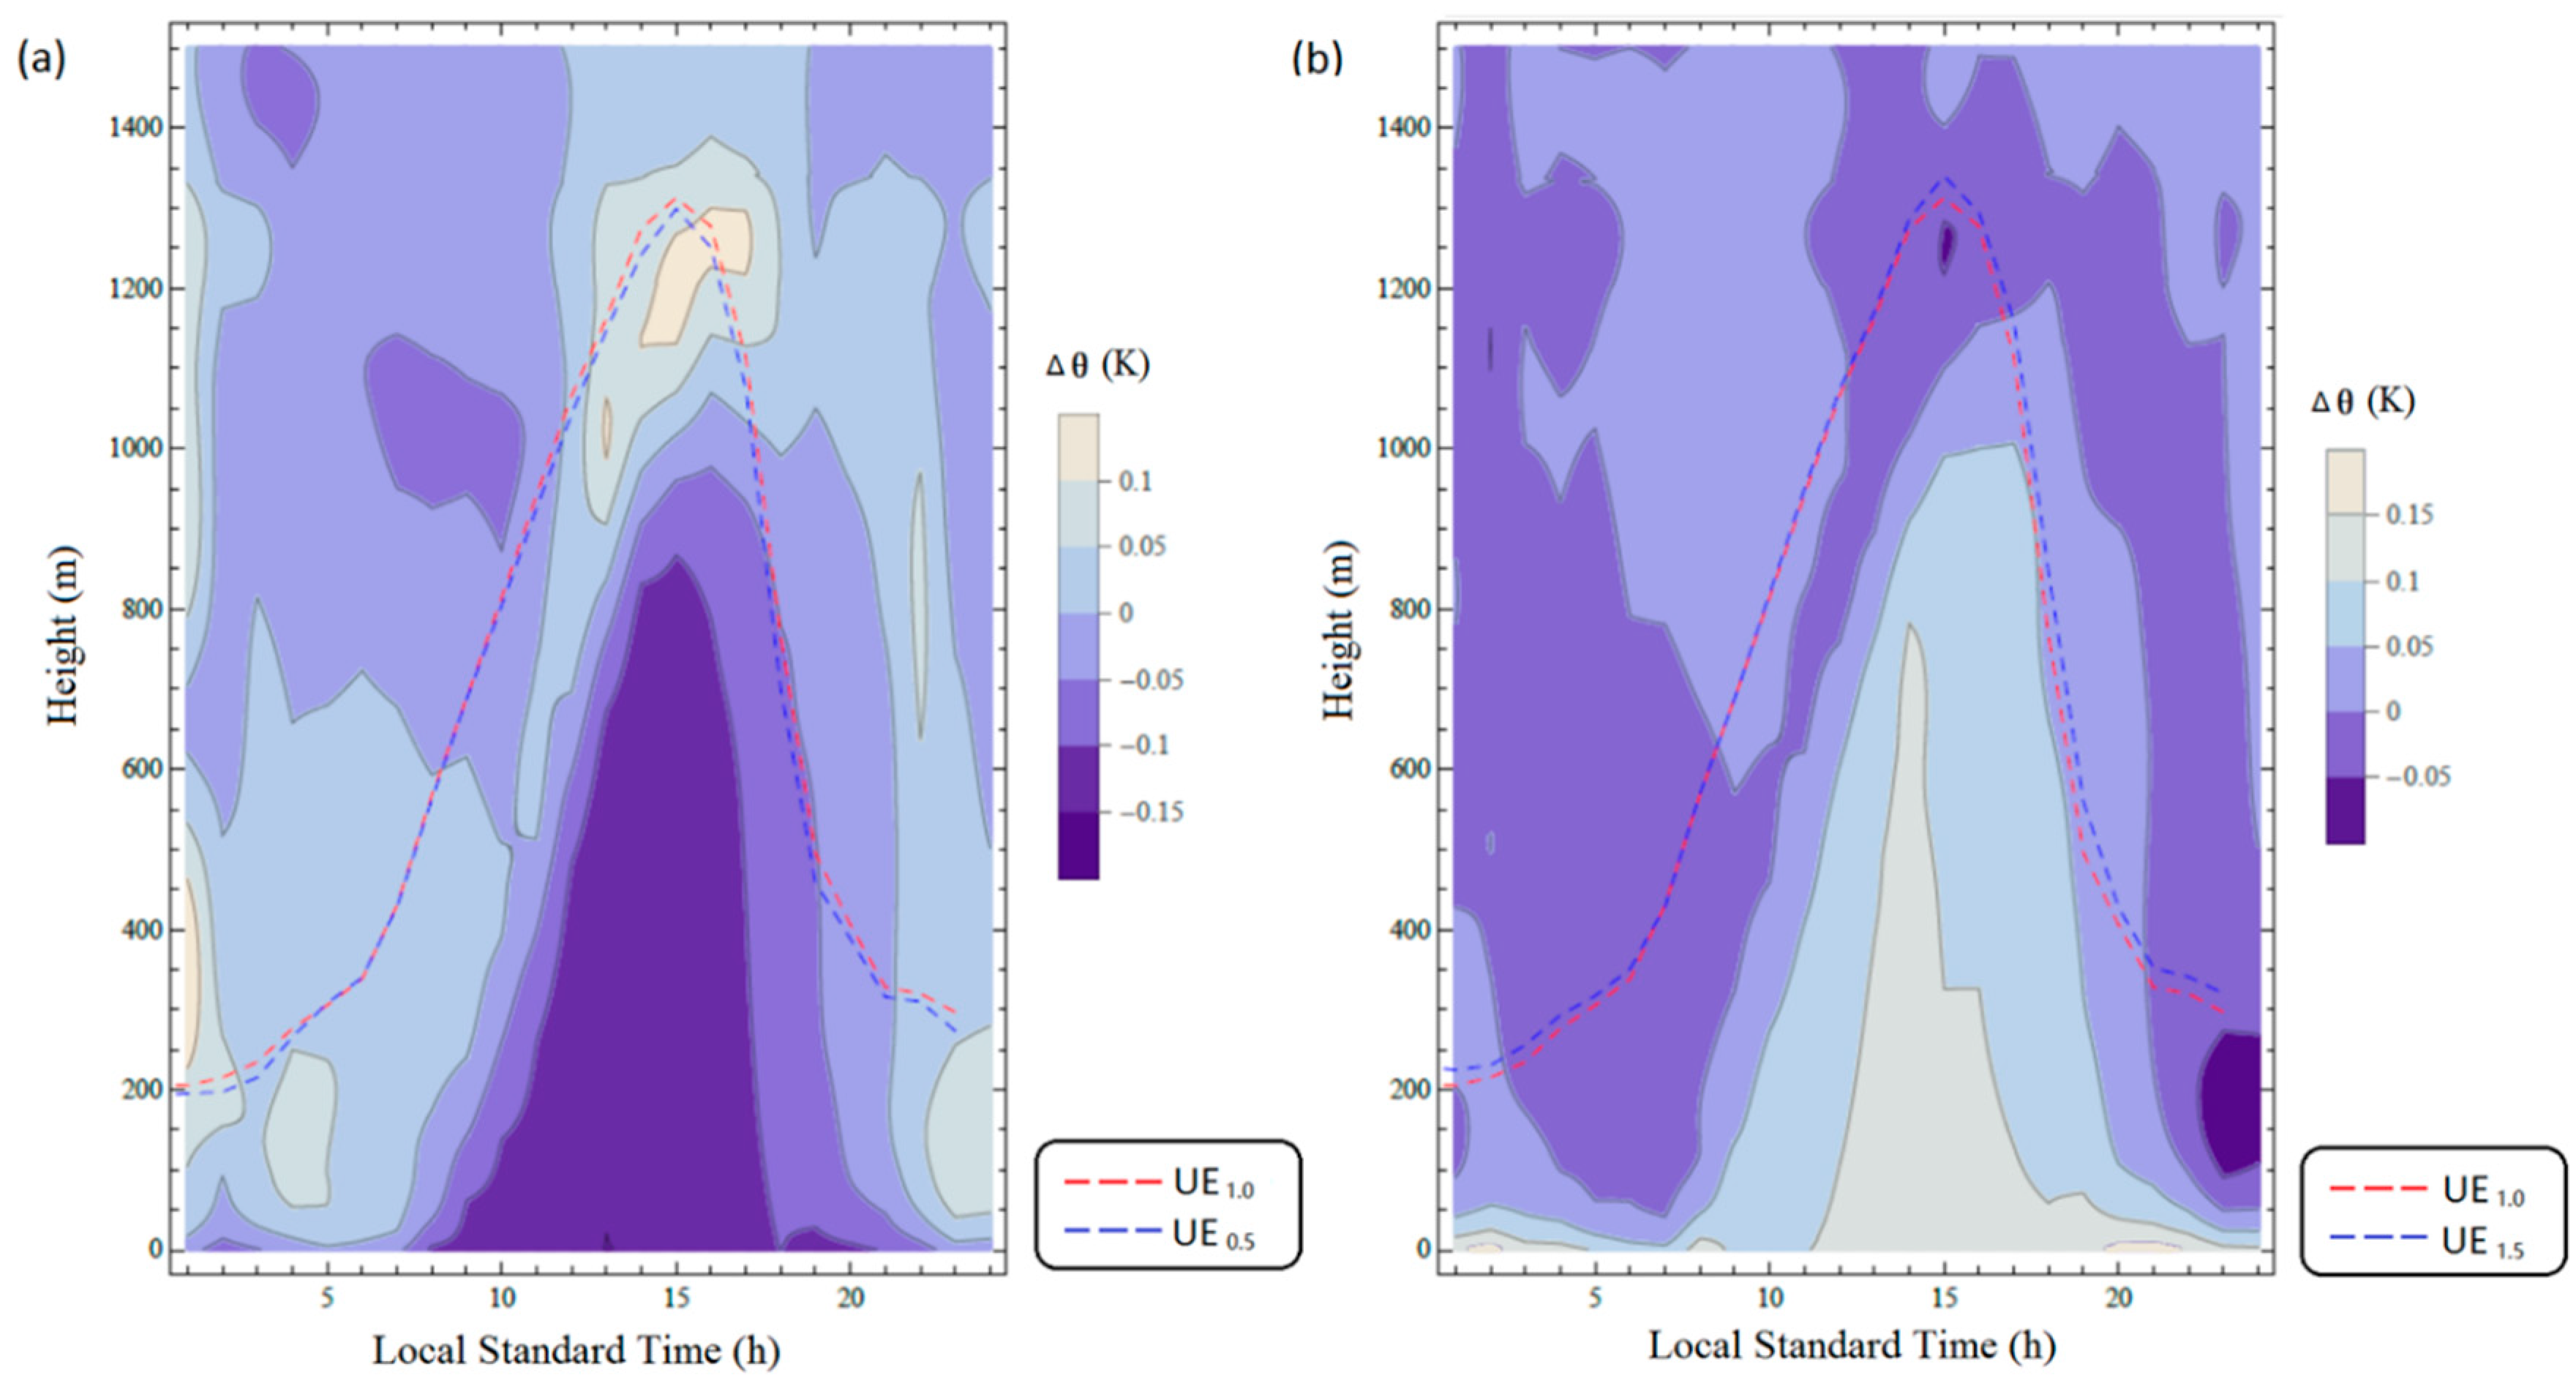
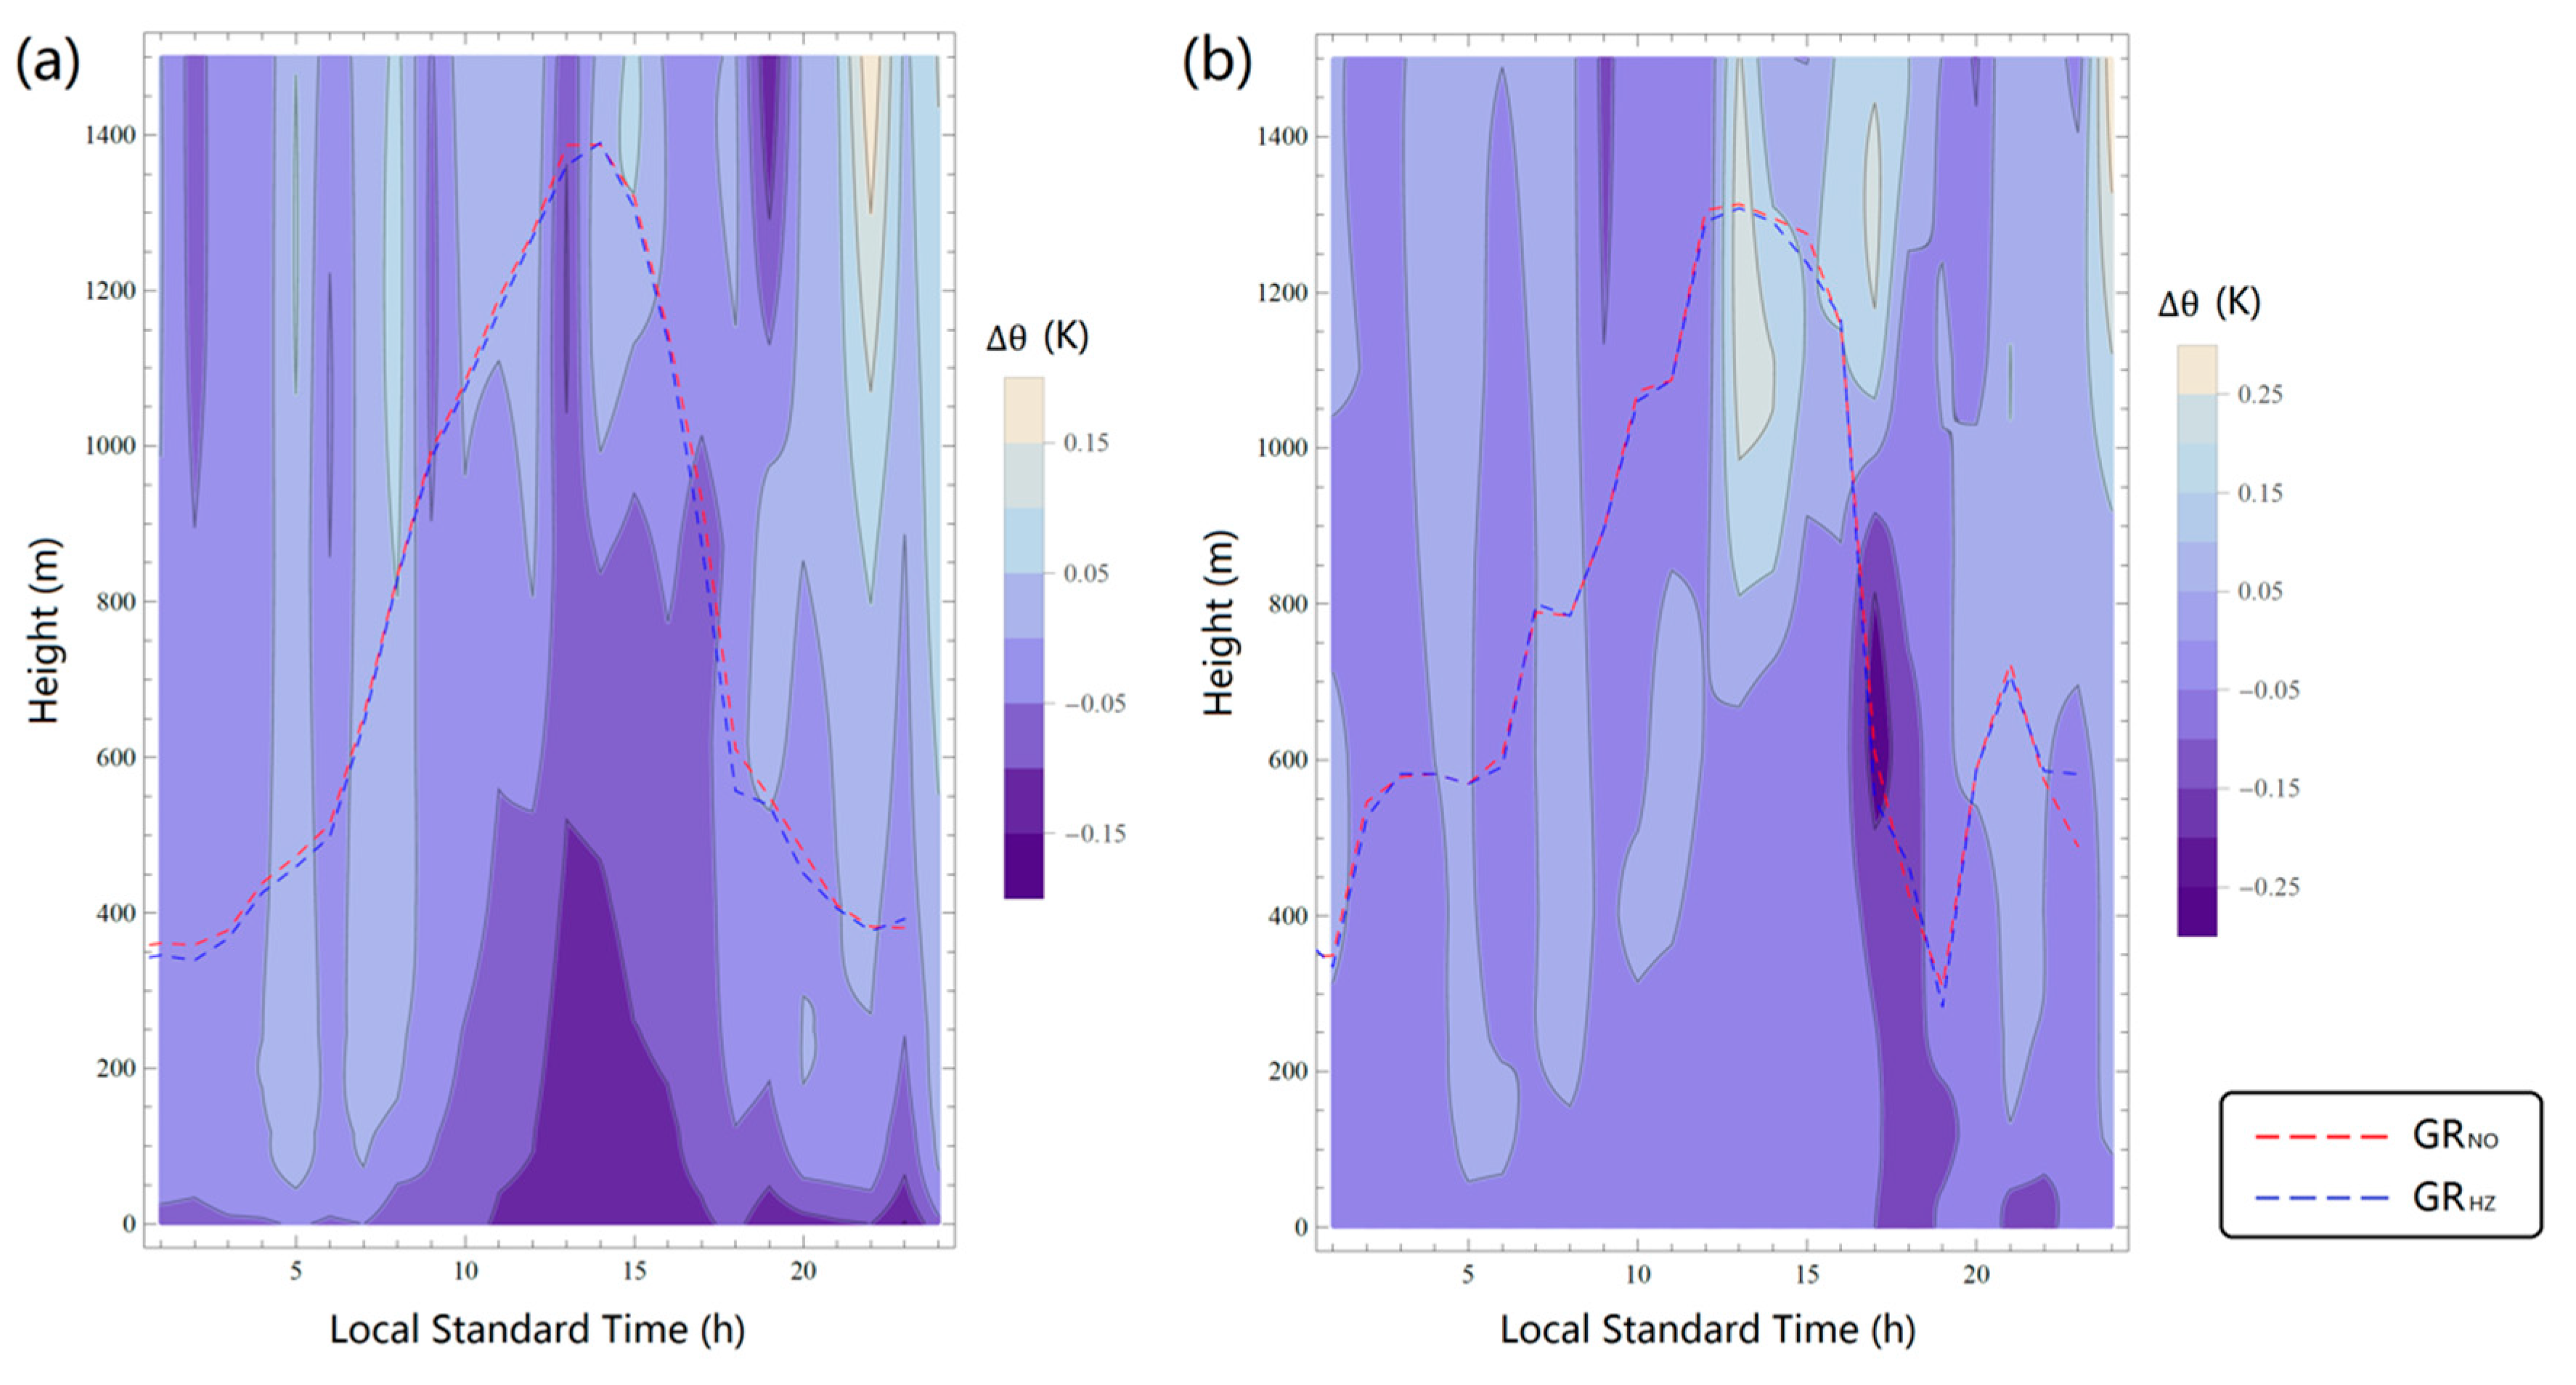
- Green roofs in Hangzhou can relieve the thermal stress in the downwind city Haining by decreasing the potential temperature by 0.25 °C.
- The strongest mitigation effects appear at 1300 LST in Hangzhou and 1600 LST in Haining.
- City location is important within an urban cluster as a modifier of urban microclimate.
- Green roofs may have the potential to mitigate some of the urban effects in a chain of cities.
- There are differential effects in cities and linked impacts in proximal cities.
Author Contributions
Funding
Acknowledgments
Conflicts of Interest
Appendix A
References
- Anderson, G.B.; Bell, M.L. Heat waves in the United States: Mortality risk during heat waves and effect modification by heat wave characteristics in 43 U.S. communities. Environ. Health Perspect. 2011, 119, 210–218. [Google Scholar] [CrossRef] [PubMed]
- Li, D.; Bou-Zeid, E.; Oppenheimer, M. The effectiveness of cool and green roofs as urban heat island mitigation strategies. Environ. Res. Lett. 2014, 9, 055002. [Google Scholar] [CrossRef]
- Kalkstein, L.S. Direct impacts in cities. Lancet 1993, 342, 1397–1399. [Google Scholar] [CrossRef]
- Weisskopf, M.G.; Anderson, H.A.; Foldy, S.; Hanrahan, L.P.; Blair, K.; Török, T.J.; Rumm, P.D. Heat wave morbidity and mortality, Milwaukee, Wis, 1999 vs 1995: An improved response? Am. J. Public Health 2002, 92, 830–833. [Google Scholar] [CrossRef] [PubMed]
- Arnfield, A.J. Two decades of urban climate research: A review of turbulence, exchanges of energy and water, and the urban heat island. Int. J. Climatol. 2003, 23, 1–26. [Google Scholar] [CrossRef]
- Pielke Sr, R.A.; Adegoke, J.; BeltraáN-Przekurat, A.; Hiemstra, C.A.; Lin, J.; Nair, U.S.; Nobis, T.E. An overview of regional land-use and land-cover impacts on rainfall. Tellus B Chem. Phys. Meteorol. 2007, 59, 587–601. [Google Scholar] [CrossRef]
- Li, D.; Bou-Zeid, E. Synergistic interactions between urban heat islands and heat waves: The impact in cities is larger than the sum of its parts. J. Appl. Meteorol. Climatol. 2013, 52, 2051–2064. [Google Scholar] [CrossRef]
- Ramamurthy, P.; Li, D.; Bou-Zeid, E. High-resolution simulation of heatwave events in New York City. Theor. Appl. Climatol. 2017, 128, 89–102. [Google Scholar] [CrossRef]
- Li, D.; Sun, T.; Liu, M.; Yang, L.; Wang, L.; Gao, Z. Contrasting responses of urban and rural surface energy budgets to heat waves explain synergies between urban heat islands and heat waves. Environ. Res. Lett. 2015, 10, 054009. [Google Scholar] [CrossRef]
- Li, D.; Sun, T.; Liu, M.; Wang, L.; Gao, Z. Changes in wind speed under heat waves enhance urban heat Islands in the Beijing metropolitan area. J. Appl. Meteorol. Climatol. 2016, 55, 2369–2375. [Google Scholar] [CrossRef]
- Sun, T.; Kotthaus, S.; Li, D.; Ward, H.C.; Gao, Z.; Ni, G.-H.; Grimmond, C.S.B. Attribution and mitigation of heat wave-induced urban heat storage change. Environ. Res. Lett. 2017, 12, 114007. [Google Scholar] [CrossRef]
- Oke, T.R. The energetic basis of the urban heat island. Q. J. R. Meteorol. Soc. 1982, 108, 1–24. [Google Scholar] [CrossRef]
- Shepherd, J.M. A review of current investigations of urban-induced rainfall and recommendations for the future. Earth Interact. 2005, 9, 1–27. [Google Scholar] [CrossRef]
- Kang, H.-Q.; Zhu, B.; Zhu, T.; Sun, J.-L.; Ou, J.-J. Impact of megacity Shanghai on the urban heat-island effects over the downstream city Kunshan. Bound. Layer Meteorol. 2014, 152, 411–426. [Google Scholar] [CrossRef]
- Zhang, D.-L.; Shou, Y.-X.; Dickerson, R.R.; Chen, F. Impact of upstream urbanization on the urban heat island effects along the Washington–Baltimore corridor. J. Appl. Meteorol. Climatol. 2011, 50, 2012–2029. [Google Scholar] [CrossRef]
- Lowry, W.P. Empirical estimation of urban effects on climate: A problem analysis. J. Appl. Meteorol. 1977, 16, 129–135. [Google Scholar] [CrossRef]
- Sharma, A.; Conry, P.; Fernando, H.; Hamlet, A.F.; Hellmann, J.; Chen, F. Green and cool roofs to mitigate urban heat island effects in the Chicago metropolitan area: Evaluation with a regional climate model. Environ. Res. Lett. 2016, 11, 064004. [Google Scholar] [CrossRef]
- Tewari, M.; Yang, J.; Kusaka, H.; Palou, F.S.; Watson, C.; Treinish, L. Interaction of urban heat islands and heat waves under current and future climate conditions and their mitigation using green and cool roofs in New York City and Phoenix, Arizona. Environ. Res. Lett. 2018, 14, 034002. [Google Scholar] [CrossRef]
- Yang, J.; Bou-Zeid, E. Scale dependence of the benefits and efficiency of green and cool roofs. Landsc. Urban Plan. 2019, 185, 127–140. [Google Scholar] [CrossRef]
- Google Timelapse. Available online: https://earthengine.google.com/timelapse (accessed on 23 May 2019).
- Hangzhou Statistical Bureau. Available online: http://www.hangzhou.gov.cn/col/col1224749/index.html (accessed on 23 May 2019).
- Deng, J.; Li, J.; Yu, L.; Wang, K. Dynamics of land use landscape pattern in Hangzhou City during its rapid urbanization. Yingyong Shengtai Xuebao 2008, 19, 9. [Google Scholar]
- Chen, K. Warming trend and seasonal variation in Hangzhou from 1961 to 2012. Chin. Agric. Sci. Bull. 2013, 29, 345–350. [Google Scholar]
- Weedon, G.; Gomes, S.; Viterbo, P.; Shuttleworth, W.; Blyth, E.; Österle, H.; Best, M. Creation of the WATCH forcing data and its use to assess global and regional reference crop evaporation over land during the twentieth century. J. Hydrometeorol. 2011, 12, 823–848. [Google Scholar] [CrossRef]
- Weedon, G.P.; Balsamo, G.; Bellouin, N.; Gomes, S.; Best, M.J.; Viterbo, P. The WFDEI meteorological forcing data set: WATCH forcing data methodology applied to ERA-interim reanalysis data. Water Resour. Res. 2014, 50, 7505–7514. [Google Scholar] [CrossRef]
- Meehl, G.A.; Tebaldi, C. More intense, more frequent, and longer lasting heat waves in the 21st century. Science 2004, 305, 994–997. [Google Scholar] [CrossRef] [PubMed]
- Lindberg, F.; Grimmond, C.S.B.; Gabey, A.; Huang, B.; Kent, C.W.; Sun, T.; Theeuwes, N.E.; Järvi, L.; Ward, H.C.; Capel-Timms, I.; et al. Urban multi-scale environmental predictor (UMEP): An integrated tool for city-based climate services. Environ. Model. Softw. 2018, 99, 70–87. [Google Scholar] [CrossRef]
- Skamarock, W.C.; Klemp, J.B. A time-split nonhydrostatic atmospheric model for weather research and forecasting applications. J. Comput. Phys. 2008, 227, 3465–3485. [Google Scholar] [CrossRef]
- Kusaka, H.; Kondo, H.; Kikegawa, Y.; Kimura, F. A simple single-layer urban canopy model for atmospheric models: Comparison with multi-layer and slab models. Bound. Layer Meteorol. 2001, 101, 329–358. [Google Scholar] [CrossRef]
- Kusaka, H.; Kimura, F. Coupling a single-layer urban canopy model with a simple atmospheric model: Impact on urban heat island simulation for an idealized case. J. Meteorol. Soc. Jpn. Ser. II 2004, 82, 67–80. [Google Scholar] [CrossRef]
- Loridan, T.; Grimmond, C.; Grossman-Clarke, S.; Chen, F.; Tewari, M.; Manning, K.; Best, M. Trade-offs and responsiveness of the single-layer urban canopy parametrization in WRF: An offline evaluation using the MOSCEM optimization algorithm and field observations. Q. J. R. Meteorol. Soc. 2010, 136, 997–1019. [Google Scholar] [CrossRef]
- Loridan, T.; Grimmond, C.S.B. Multi-site evaluation of an urban land-surface model: Intra-urban heterogeneity, seasonality and parameter complexity requirements. Q. J. R. Meteorol. Soc. 2012, 138, 1094–1113. [Google Scholar] [CrossRef]
- Loridan, T.; Lindberg, F.; Jorba, O.; Kotthaus, S.; Grossman-Clarke, S.; Grimmond, C. High resolution simulation of surface heat flux variability across central London with urban zones for energy partitioning. Bound. Layer Meteorol. 2013, 147, 493–523. [Google Scholar] [CrossRef]
- Yang, J.; Wang, Z.-H.; Chen, F.; Miao, S.; Tewari, M.; Voogt, J.A.; Myint, S. Enhancing hydrologic modelling in the coupled weather research and forecasting–urban modelling system. Bound. Layer Meteorol. 2015, 155, 87–109. [Google Scholar] [CrossRef]
- Wang, Z.H.; Bou-Zeid, E.; Smith, J.A. A coupled energy transport and hydrological model for urban canopies evaluated using a wireless sensor network. Q. J. R. Meteorol. Soc. 2013, 139, 1643–1657. [Google Scholar] [CrossRef]
- Wang, Z.-H.; Bou-Zeid, E.; Au, S.K.; Smith, J.A. Analyzing the sensitivity of WRF’s single-layer urban canopy model to parameter uncertainty using advanced Monte Carlo simulation. J. Appl. Meteorol. Climatol. 2011, 50, 1795–1814. [Google Scholar] [CrossRef]
- Wang, Z.-H.; Bou-Zeid, E.; Smith, J.A. A spatially-analytical scheme for surface temperatures and conductive heat fluxes in urban canopy models. Bound. Layer Meteorol. 2011, 138, 171–193. [Google Scholar] [CrossRef]
- Sun, T.; Bou-Zeid, E.; Wang, Z.-H.; Zerba, E.; Ni, G.-H. Hydrometeorological determinants of green roof performance via a vertically-resolved model for heat and water transport. Build. Environ. 2013, 60, 211–224. [Google Scholar] [CrossRef]
- Sun, T.; Grimmond, C.S.B.; Ni, G.-H. How do green roofs mitigate urban thermal stress under heat waves? J. Geophys. Res. Atmos. 2016, 121, 5320–5335. [Google Scholar] [CrossRef]
- National Centers for Environmental Prediction; National Weather Service; NOAA, U.S.; Department of Commerce. NCEP FNL operational model global tropospheric analyses, continuing from July 1999. 2000. Available online: https://rda.ucar.edu/datasets/ds083.2/ (accessed on 23 May 2019).
- Smagorinsky, J. General circulation experiments with the primitive equations: I. The basic experiment. Mon. Weather Rev. 1963, 91, 99–164. [Google Scholar] [CrossRef]
- Smagorinsky, J. Some historical remarks on the use of nonlinear viscosities. Large Eddy Simul. Complex Eng. Geophys. Flows 1993, 1, 69–106. [Google Scholar]
- Mellor, G.L.; Yamada, T. Development of a turbulence closure model for geophysical fluid problems. Rev. Geophys. 1982, 20, 851–875. [Google Scholar] [CrossRef]
- Janjić, Z.I. The step-mountain coordinate: Physical package. Mon. Weather Rev. 1990, 118, 1429–1443. [Google Scholar] [CrossRef]
- Mlawer, E.J.; Taubman, S.J.; Brown, P.D.; Iacono, M.J.; Clough, S.A. Radiative transfer for inhomogeneous atmospheres: RRTM, a validated correlated-k model for the longwave. J. Geophys. Res. Atmos. 1997, 102, 16663–16682. [Google Scholar] [CrossRef]
- Dudhia, J. Numerical study of convection observed during the winter monsoon experiment using a mesoscale two-dimensional model. J. Atmos. Sci. 1989, 46, 3077–3107. [Google Scholar] [CrossRef]
- Stensrud, D.J. Parameterization Schemes: Keys to Understanding Numerical Weather Prediction Models; Cambridge University Press: Cambridge, UK, 2009. [Google Scholar]
- Friedl, M. Modified IGBP MODIS 20-Category Vegetation (Land-Use) Data. 2008. Available online: ftp://ftp.emc.ncep.noaa.gov/mmb/gcp/ldas/noahlsm/README (accessed on 23 May 2019).
- Giannaros, T.M.; Melas, D.; Daglis, I.A.; Keramitsoglou, I.; Kourtidis, K. Numerical study of the urban heat island over Athens (Greece) with the WRF model. Atmos. Environ. 2013, 73, 103–111. [Google Scholar] [CrossRef]
- Chen, F.; Yang, X.; Zhu, W. WRF simulations of urban heat island under hot-weather synoptic conditions: The case study of Hangzhou City, China. Atmos. Res. 2014, 138, 364–377. [Google Scholar] [CrossRef]
- Schlünzen, K.H.; Katzfey, J.J. Relevance of sub-grid-scale land-use effects for mesoscale models. Tellus A Dyn. Meteorol. Oceanogr. 2003, 55, 232–246. [Google Scholar] [CrossRef]
- Taylor, K.E. Summarizing multiple aspects of model performance in a single diagram. J. Geophys. Res. Atmos. 2001, 106, 7183–7192. [Google Scholar] [CrossRef]
- Kang, S.-L.; Lenschow, D.H. Temporal evolution of low-level winds induced by two-dimensional mesoscale surface heat-flux heterogeneity. Bound. Layer Meteorol. 2014, 151, 501–529. [Google Scholar] [CrossRef]

| Parameter | UCM (Urban Canopy Model) (Roof) | PCUM (Princeton Urban Canopy Model) (Green Roof) |
|---|---|---|
| Roof Heat Capacity [J m−3 K−1] | 1.0 × 10⁶ | 1.9 × 10⁶ |
| Thermal Conductivity [J m−1 s−1 K−1] | 0.67 | 1.00 |
| Surface Albedo | 0.20 | 0.30 |
| Surface Emissivity | 0.90 | 0.95 |
| Depth of Green Roof * [m] | 0.1 | |
| Fraction of Roofs that are GR | 0.5 | |
| Anthropogenic Heat [W m−2] | 50 (Maximum) | |
| Diurnal Profile of Anthropogenic Heat | 0.16, 0.13, 0.08, 0.07, 0.08, 0.26, 0.67, 0.99, 0.89, 0.79, 0.74, 0.73, 0.75, 0.76, 0.82, 0.90, 1.00, 0.95, 0.68, 0.61, 0.53, 0.35, 0.21, 0.18 | |
© 2019 by the authors. Licensee MDPI, Basel, Switzerland. This article is an open access article distributed under the terms and conditions of the Creative Commons Attribution (CC BY) license (http://creativecommons.org/licenses/by/4.0/).
Share and Cite
Huang, B.; Ni, G.-h.; Grimmond, C.S.B. Impacts of Urban Expansion on Relatively Smaller Surrounding Cities during Heat Waves. Atmosphere 2019, 10, 364. https://doi.org/10.3390/atmos10070364
Huang B, Ni G-h, Grimmond CSB. Impacts of Urban Expansion on Relatively Smaller Surrounding Cities during Heat Waves. Atmosphere. 2019; 10(7):364. https://doi.org/10.3390/atmos10070364
Chicago/Turabian StyleHuang, Bei, Guang-heng Ni, and C. S. B. Grimmond. 2019. "Impacts of Urban Expansion on Relatively Smaller Surrounding Cities during Heat Waves" Atmosphere 10, no. 7: 364. https://doi.org/10.3390/atmos10070364
APA StyleHuang, B., Ni, G.-h., & Grimmond, C. S. B. (2019). Impacts of Urban Expansion on Relatively Smaller Surrounding Cities during Heat Waves. Atmosphere, 10(7), 364. https://doi.org/10.3390/atmos10070364


