Article

Yield Data Provide New Insight into the Dynamic Evaluation of Maize’s Climate Suitability: A Case Study in Jilin Province, China

1
School of Environment, Northeast Normal University, Changchun 130117, China
2
State Environmental Protection Key Laboratory of Wetland Ecology and Vegetation Restoration, Northeast Normal University, Changchun 130117, China
3
Key Laboratory for Vegetation Ecology, Ministry of Education, Changchun 130117, China
*
Authors to whom correspondence should be addressed.
Atmosphere 2019, 10(6), 305; https://doi.org/10.3390/atmos10060305
Submission received: 28 April 2019 / Revised: 18 May 2019 / Accepted: 25 May 2019 / Published: 3 June 2019

Abstract

:
Examining the effects of climate change on spring maize, and its suitability under dynamic cultivation patterns, will aid strategic decision-making for future agricultural adaptation. This paper investigates the climate suitability of spring maize, based on daily data from 50 meteorological stations, and statistics on maize yield and area at the county level in Jilin Province, China, between 1986 and 2015. Based on a significant correlation between the cultivation patterns indicator ≥10 °C accumulated temperature (AAT10) and the average yield (R2 = 0.503), the yield data are used to determine suitable thresholds for meteorological factors under the dynamic cultivation pattern, and a fuzzy fitness approach is used to evaluate the climate suitability. The results showed a good agreement between suitability estimates and scaled observed yields (average d = 0.705). Moreover, good consistency between cultivation patterns, climate suitability and yield show that the late-maturing varieties of maize have gradually moved northward and eastward, and the areas of high suitability and high yield have gradually expanded eastward. In addition, drought and chilling hazard factors limit the suitability of climate resources, especially in the eastern and western regions.

1. Introduction

Climate change is expected to affect both regional and global food production, through changes in overall agro-climatic conditions [1], which will directly affect yields and crop climate suitability. Research has indicated that climate change, including warming, might induce tremendous decreases in crop yield. Since 1989, the crop yield of the United States has decreased by 17% [2], the primary productivity of Europe has decreased by 30% [3], and there has been a negative impact of 12% on China’s maize crop [4]. However, it has been confirmed that crop production might benefit from future warming if suitable adaptations are implemented for crop cultivation [5,6], especially in the middle and high latitude areas [7]. Jilin Province, China, known as the “golden corn belt,” is also located in middle latitudes of an area most vulnerable to climate change. In 2017, the total maize production in Jilin Province was 32,570,800 tons, accounting for 15% of the national maize production. Maize production in Jilin Province directly influences the national maize production [8]. As a crucial food crop in China, maize production must increase to meet the needs of the Chinese population, which expected to peak at 1.5 billion in 2033 [9]. With the prolonged growing season and expanded potential cropping area for spring maize in middle and high latitude areas, farmers have blindly shifted the cultivated area northward and expanded it eastward to pursue higher yields, and late-maturing varieties have gradually replaced early-maturing ones, causing certain losses [10,11]. Therefore, it is critically important to understand how climate change has been affecting agricultural production, to ensure regional food security and to inform adaptation decisions [12,13,14]. To address these issues, a large variety of approaches have been developed and applied over recent decades, to scope out agro-climatic potentials and constraints, and to explore possible shifts in suitability with climate change.
A widely applied approach to quantifying the spatial response of crops to climate change is simulation modeling [15,16], including niche models, species distribution models, and spatial crop models. The potential geographic distribution of a species is predicted based on the interactive relationship between its known geographic locations and environmental variables [17,18,19]. However, the correlation models are highly influenced by species biology and ecology, as well as data quality, resolution, model algorithms, and model parameters. Therefore, the accuracy of these models needs to be continuously improved [20,21]. Based on the above limitations, expertise-based approaches are often used to assess climate or land suitability. Multiple indicators, such as temperature, precipitation, drought, and soil variables have been considered when quantifying suitability though expert questionnaire surveys and literature reviews. For example, Yin et al., [22] determined multiple indicators by an expert questionnaire, including temperature, precipitation, drought, etc., and provided a comprehensive analysis of suitable cropping systems for various crops in the northeastern agricultural areas. Based on factors of temperature, precipitation and sunshine, Zhao et al., [23] evaluated the suitability of different varieties of maize. These expert-based approaches have the advantage of being simple and flexible. However, due to their strong subjectivity and uncertainty of local application, the introduction of statistical methods provides a more scientific basis for the formulation of suitability indicators, especially for specific regions.
Yield is the basic input for production analysis and impact assessment, as well as vulnerabilities and adaptation estimation [24]. As the direct receptor of climate factor fluctuation, the high-stability of crop yield will effectively reflect the potential climate suitability [8]. Zhao [8,25] assesses potential climate suitability based on a comprehensive consideration of high-stability yield potential; however, this is a crop model simulation method which requires a large experimental dataset, and lacks universal applicability. Holzkamper et al., [26] attempted to improve suitability assessments for maize in Switzerland by using the observed yields and received a good response. Meanwhile, Chinese scholars [4,27,28] used observed statistics to separate the effects of climate contributions and crop management factors, confirming that the meteorological yield in Northeast China is significantly affected by climate variables. Therefore, considering the high-stability production performance of meteorological yield provides a new method for evaluating climate suitability, especially for crops on a regional basis.
In this study, we introduce the concept of meteorological yield to improve the approach to meteorological factors based on traditional knowledge. Based on the dynamic cultivation patterns caused by climate change, we attempt to evaluate the changes in climate suitability and limiting factors for maize production in Jinlin Province, China. The objectives of the present study are to: (1) determine the spatial and temporal relationships between planting pattern and yield; (2) propose a threshold division method for meteorological factors, based on dynamic cultivation patterns, and verify it; (3) investigate the climate suitability of spring maize in Jilin Province from 1986 to 2015, and quantify the relationship between areas of particular cultivation patterns, yield area, and area of climate suitability. Finally, the meteorological limitations of stations with poor quantitative evaluation results are analyzed.

2. Materials and Methods

2.1. Study Area

Jilin Province is located in northeastern China, between 40°52′–46°18′ N and 121°38′–131°19′ E, with a total area of 18.74 × 10⁴ km2. This area has a monsoonal climate with four clearly distinct seasons. The annual mean temperature is 2–6 °C and the frost-free period lasts for 100–160 days. Annual sunshine is 2259–3016 h, and annual precipitation is 400–600 mm. The altitude is generally high in the southeast and low in the northwest. The western region is known as the “golden corn belt.”

2.2. Data

Long-term daily climate data, gathered from 50 meteorological stations in Jilin Province, China, from 1986 to 2015, were obtained from the National Meteorological Information Center. These data were organized in a database containing variables such as average temperature, minimum temperature, maximum temperature, precipitation, and sunshine hours. Statistics including corn yield and acreage data for 50 counties, from 1986 to 2015, were obtained from the Jilin Provincial Bureau of Statistics.
To relate climate data to yield data, the meteorological data from each station were matched to the statistical data of its county-level administrative region, and the dataset thus obtained included the corn yield, area, and climate data of 50 stations for 30 years. We used 75% of the dataset to calibrate the suitability threshold for meteorological factors, and 25% were independently verified [29]. The calibration and verified sites are shown in Figure 1.

2.3. Evaluation Approach

The dynamic maize evaluation approach was based on agro-climatic indices that were calculated on an annual basis for relevant phenological phases of continuously changing cultivation patterns. These climate indices are referred to as factors, and suitability functions were specified to relate factor values to factor suitability scores, ranging from 0 to 1. The factor suitability functions were initially used to identify the climate indices affected by cultivation patterns of different maturities, and in the second step were refined by climate yield data based on scientific literature and expert knowledge. Rules were used to aggregate factor suitability and to derive dynamic maize suitability.

2.3.1. Maize Cultivation Patterns and Climate Indices

As a thermophilic plant, maize requires a certain accumulated temperature to complete its growth and development process [23]. However, different values of ≥10 °C accumulated temperature (AAT10) during the growing season are required for different mature varieties (Table 1) (generally late maturity > medium maturity > early maturity). Regions with high heat conditions are more suitable for mid-late maturing varieties, while areas with low heat conditions are only suitable for early maturing varieties, or may not be suitable at all. Hotter areas mean relatively high climate productivity; thus, the yield of a mid-late maturing variety is generally higher than that of an early maturing one. With rising temperature, the climate-limited production potential in areas with insufficient heat increases, and early maturing varieties tend to be replaced by mid-late maturing ones [10]. Additionally, maize is a mesophyte, and its water consumption varies significantly at different stages of growth, basically following the rule of “less early, more in the middle, and less late.” Maize is also a short-day crop, and late-maturing varieties are sensitive to long-term sunshine. As a C4 plant, maize requires more photosynthetic products to achieve a high yield, especially in the tasseling-milking stage.
To quantify the effects of climate change on crop growth, a series of climatic indices in areas of different maturity were selected for suitability evaluation. Three indices (average temperature, precipitation, and sunshine hours) were chosen to quantify the basic crop requirements of temperature, light, and water, based on expert knowledge and literature on crop suitability [23,26,30]. The phenological phases of spring maize are usually divided into four stages, based on valid data from agricultural meteorological observatories: period 1 from germination to jointing (early May to mid-June), period 2 from jointing to tasseling (late June to mid-July), period 3 from tasseling to milking (late July to late August), and period 4 from milking to maturity (September). Suitability functions were synthesized from climate factors in the relevant phenological phases of various maize cultivations.

2.3.2. Meteorological Yield

Generally speaking, crop yield can be expressed as the sum of climate contributions, management factors, and random error [27,31]. Crop yield caused by climate fluctuation is called meteorological yield, which mainly reflects the short-term yield fluctuation caused by the changing of meteorological factors. Crop management-induced crop yield is mainly determined by the development level of long-term productivity (based on the available science and technology), and is also known as the trend yield. Since the effect of random error on the actual yield is small, it is usually ignored. Therefore, crop yields consist of long-term trend yields and short-term fluctuations from meteorological yields. To separate the trend yield sequence from the actual yield, an HP filtering method [32,33] was used to fit the trend yield:
y = y t + y w + Δ y
where y is the crop yield; y t and y w are the trend yield and meteorological yield, respectively; and Δ y is random noise.

2.3.3. Yield-Based Refinement of Factor Suitability

To refine the factor suitability within knowledge-based bounds [30,34], we referred to Holzkamper et al., [26] and used yield data to refine the meteorological suitability thresholds of differently maturing varieties. The smallest enclosing disk approximation algorithm (DPs) [35] was selected to capture the corresponding optimal threshold of the climatic factor based on the high-stability yield range. Referring to the cumulative frequency distribution [8], when the number of sites greater than the negative stable yield value accounts for 80% of the total number of sites, the corresponding meteorological factor value is the optimal threshold, and 95% is the sub-suitability threshold. The refinement of factor suitability was conducted as follows (Figure 2):
1. Scatter plot construction. The climate factors and meteorological yields for each site are the abscissa and the ordinate, respectively. We found that a 4% fluctuation in climate yield corresponded to the stable yield range of maize, according to the assessment method of the agricultural meteorological production forecasting business [36].
2. Calculation of the projection interval [min X, max X] of all points on the X-axis, and calculation of the maximum distance d1 from all points to the first point.
3. The dual decision. It is constructed with r = 3d1/4 as the initial radius and the search interval [Max X-r, min X+r], and the iterative solution employs (Max x-min x)/400 as the step length.
4. Finally, the minimum threshold of sites larger than the stable yield line, accounting for 80% of the total sites, is the optimal threshold [Xa, Xb], and the number of sites accounting for 95% of the total site is the sub-optimal threshold [Xc, Xd].

2.3.4. Definition of the Evaluation Function

The factor suitability function should be calculated by specific rules to obtain the climate suitability scores for the regional maize. The ideal degree of climatic resource elements that satisfy the growth of maize was defined as an appropriate range of climate factors, as well as the fuzzy subset of intervals [0,1] [37]. When the fuzzy subordinate function is used for conversion quantization, the most suitable value is 1, while the most unsuitable value is 0, and the rest is the continuous excessive state. It is defined as:
S = S T × S P × S S 3
subject to
F ( s i ) = j = 1 n A i j S i j
A i j = R j j = 1 n R j
R j = r j r min r max r min
S i j = { 0 S < x c o r S > x d S x c x a x c x c S x a 1      x a < S < x b x d S x d x b x b < S < x d
where regional climate suitability S is determined by multi-factor suitability, including temperature suitability T, precipitation suitability P, and sunshine suitability S. F ( s i ) (weighted by the suitability of each stage j) is the climate suitability factor i for the whole growth period, and in this case the factor i includes average temperature, precipitation and sunshine hours for the four phenological phases j. A i j is the weight coefficient of the climate suitability factor i for the j-th growth stage (n = 4), calculated from the ratio of the normalized correlation coefficient R j of the j-th stage to the sum of the correlation coefficients of the entire growth period. r j is the correlation coefficient; r max is the maximum correlation coefficient, while r min is the minimum correlation coefficient. S i j is the climate suitability factor i in phenological phase j; χ a , χ b , χ c , χ d are the optimal range and upper and lower limits of the climate factor, respectively.
In this study, climate suitability was divided into four grades [8,38]: low (0–0.25), general (0.25–0.75), medium (0.75–0.95), and high suitability (0.95–1). Correspondingly, we have classified the plant heights of corn milk maturity, from low to high, for nearly 30 years, and selected the top 25%, 75%, and 95% values as the low, normal, medium, and high evaluation indicators, respectively.

2.3.5. Validation of the Suitability Evaluation

To evaluate the suitability assessment performance and accuracy, Willmott’s index of agreement ( d value) [39] was computed from observed meteorological yield and simulated climate suitability. Willmott’s d value is a good indicator of model performance, particularly relative to the 1:1 line. When d is closer to 1, the effect of the observation is better; when it is closer to 0, the correlation between the simulated value and the observed value is less:
d = 1 j = 1 N ( S j O j ) 2 j = 1 N ( | S j O ¯ | + | O j O ¯ | ) 2
where S j is the suitability estimate; O j is the scaled yield, which is obtained from the normalization of the meteorological yield [26]; and O ¯ is the mean value of the scaled yield.

2.4. Analysis of the Climatic Limiting Factors

To further explore the limiting factors on climate suitability, we analyzed climatic factors and hazard factors in areas with limited suitability ( S < 0.8). We conducted a gray correlation analysis between climate suitability, climate factors (average temperature, precipitation, and sunshine hours) and typical hazard factors (drought in the west, chilly damage in the east), and the degree of correlation of the climatic limiting factors at each stage is discussed. The western part of Jilin Province was seriously affected by drought, and the water deficit index was used as a factor to quantify the degree of drought [40]. Chilling damage occurred in the eastern region, and here the chilling injury index was used as the quantitative factor [41].
The gray correlation degree is calculated as the degree of similarity between the sequence curve of climate suitability and the geometric shape of each factor. The greater the degree of association, the more restricted the sub-suitable area. There are n sites, each with m-year data. The normalized data is X 1 , X 2 , , X m . X i = [ x i ( 1 ) , x i ( 2 ) , x i ( n ) ] , i = 1 , 2 , , m . x 0 is the climate suitability, and the correlation coefficient between x 0 and x i in the k-th year is:
ξ i ( k ) = Δ min + ρ Δ max Δ i ( k ) + ρ Δ max , i = 1 , 2 , , n ; k = 1 , 2 , , m
where Δ min = min i [ min k ( | x 0 ( k ) x i ( k ) | ) ] ; Δ max = max i [ max k ( | x 0 ( k ) x i ( k ) | ) ] ; ρ is the resolution coefficient; the value area is [0,1]; and the optimum is 0.5.

3. Results

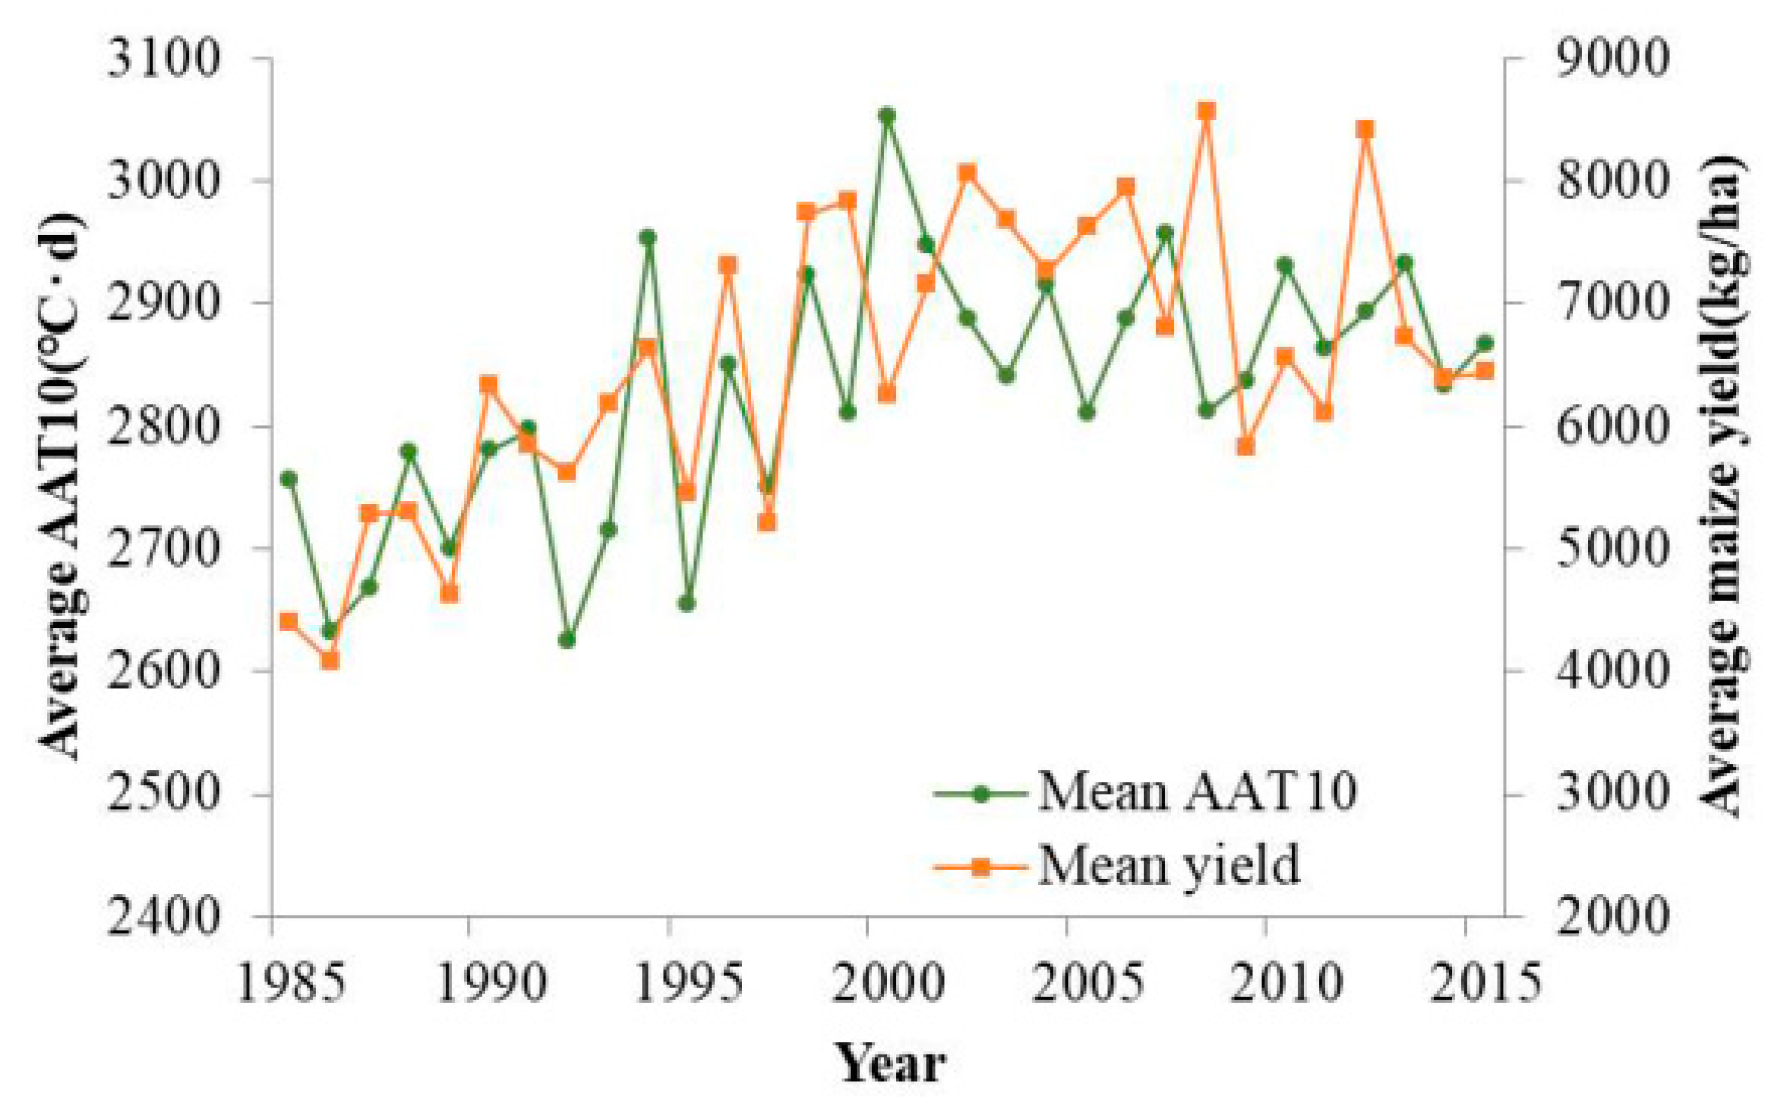
3.1. Temporal and Spatial Changes in Cultivation Patterns and Yield

There were significant changes found in the cultivation patterns of differently maturing spring maize varieties in Jilin Province from 1986 to 2015 (Figure 3a–d). The distribution of cultivation patterns, from the northwest to the southeast, was: late maturity, medium maturity, early maturity, and unsuitable for planting. The early, medium, and late maturing planting areas were each approximately 1/3 of the province in the first 10 years (1986–1995); then, in the middle 10 years (1996–2005) the late maturity area increased rapidly to 1/2, with the early maturity and unsuitable areas reducing correspondingly. The weak temperature fluctuations in the last 10 years (2006–2015) have led to relatively few changes in cultivation patterns.
Figure 3e–h shows the variations of average yield per county for the three decades. Overall, the central regions of Jilin Province had the highest yields, while the western and eastern regions had general yields, and the northeast and part of the west had low yields. The middle and high yield areas in the last 20 years (1996–2015) moved significantly northward and eastward compared to the previous 10 years (1986–1995). In particular, the area of high yield expanded from 1/10 to 2/5 of the province, and the area of middle and low yields decreased by 1/10, while the area of general yield demonstrated little change.
Comparing the cultivation pattern indicator (AAT10) and average yield in the past 30 years (Figure 4), both showed a significant increasing trend. The fluctuations in the average yield were highly consistent with the AAT10 curve, and there was a significant positive correlation between the mean yield and AAT10 (R2 = 0.537, p < 0.1). As a result, we concluded that AAT10 and its characterized cultivation patterns were a key factor for maize yield formation. The change of maize varieties in terms of maturing transformation had a favorable effect in increasing the yield, where the thermal resource was originally insufficient. However, regional yields of late-maturing maize may be reduced, as in the west. Therefore, besides differently maturing varieties, maize yield is also likely to be determined by other factors, such as temperature, precipitation, and sunshine. Furthermore, a more accurate suitability assessment will be obtained by classifying the suitability of climate resources for differently maturing varieties based on yield.

3.2. Climatic Suitability of Maize

3.2.1. Yield-Based Refinement of Factor Suitability and Validation

Figure 5 shows the suitability thresholds of different meteorological factors based on the 30-year meteorological yield data. From the temperature suitability of different stages: Because a temperature of above 10–12 °C is required for germination, and the temperature in Jilin province was generally lower than 20 °C during this period, the suitable temperature was set at 12.2–19.0 °C; The growth rate of jointing-harvesting maize is proportional to the temperature within the range of 18.5–24.8 °C [42]; The average temperature during the tasseling-milking period in Jilin province is about 21 °C, which is suitable for the temperature of 19.2–23.3 °C; The temperature gradually decreasing during the maturity period is beneficial to the accumulation of dry matter, and too low or too high a temperature may reduce enzyme activity and decrease the yield. In addition, the water consumption during the emergence-jointing period accounts for 20% of the total water consumption, the joint-milk ripening period accounts for 50%, and the milk-maturing-mature period consumes less water, at 10–30%. The average monthly precipitation in the fastest growing stage is about 90–110 mm, and the threshold is roughly consistent with the actual water requirement of maize. The sunshine suitability of maize in different growth stages was also basically consistent with existing studies [26], especially the relatively high requirement in the tasseling-milking stage. From the above analysis, yield-based refinement of factor suitability generally conforms to expert knowledge and crop growth requirement, but the results are more regionally targeted.
The automatic calibration runs converged on average after 400 iterations, reaching a good agreement between long-term suitability estimations and average normalized meteorological yields at most stations (average d = 0.705 ± (0.12SD)). Figure 6 shows a comparison of station mean meteorological yield and station mean suitability, with stations of the calibration dataset and the validation dataset indicated by different signs. The results clearly distinguish the simulated levels of climate suitability obtained from meteorological yields at different stations. Most stations of both the calibration and validation data sets are very close to the 1:1 line. Some of the sites show a mismatch between climate suitability and meteorological yields, including ZL, TY in the west and BS, LJ, CB in the east.

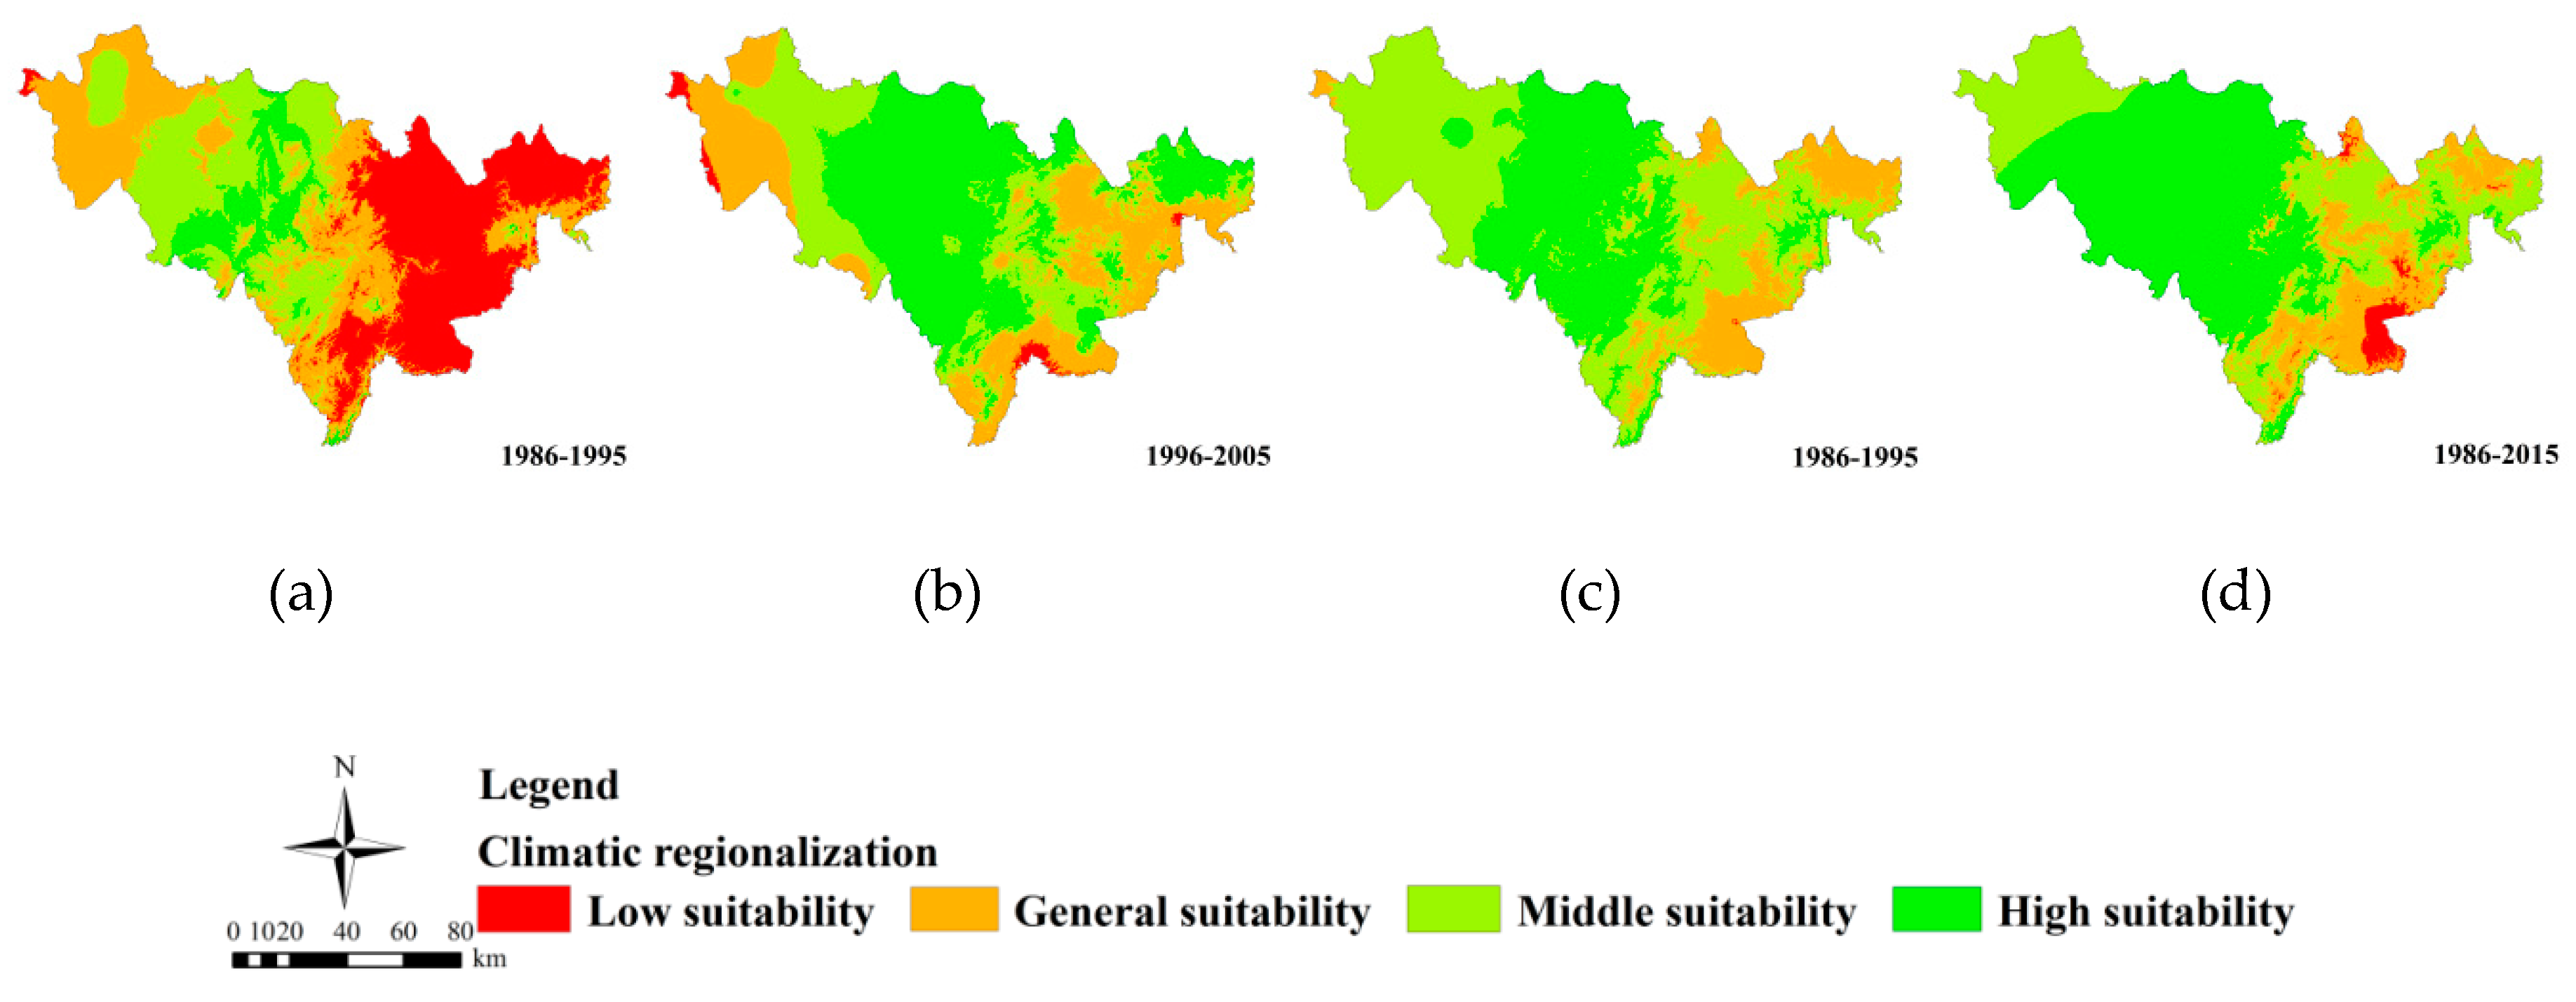
3.2.2. Temporal and Spatial Changes in Climate Suitability

The results for differently maturing maize varieties (Figure 7) from 1985 to 2015 showed that the order of suitability was: early maturing > medium maturing > late maturing. From the time series of the average values, the suitability of early maturing varieties gradually decreased, while the suitability of mid-late maturing varieties gradually increased. The climatic suitability of the three mature varieties declined from 1985 to 1995. From 1996 to 2005, the suitability of the early maturing varieties decreased significantly, and the suitability of mid-late maturing varieties increased significantly; this is consistent with the trend that the mid-late ripening varieties gradually replaced the early-maturing varieties under the temperature increase around 2000. This trend has slowed down since 2005.
The spatial distributions of the climate suitability in Jilin Province are shown in Figure 8. From 1986 to 2015, the central regions mainly had high suitability, with the middle suitability concentrated in the western and east-central regions. Nevertheless, the suitability of the eastern Changbai high-altitude area and the northeastern high-latitude area was low. In the first 10 years, the thermal conditions were relatively poor, and the suitability of the eastern region (about 1/3 of the province) was not high, while the west was also classified as having general suitability. In 1996-2005, the suitable area moved northward and eastward, and the low suitability area decreased significantly, with middle or high suitability in most of the province. From 2006 to 2015, most of the province’s climate resources essentially meet the conditions required for growth of maize. With the advance of time, the improvement of climate resources and maize suitability evaluation were basically consistent with the increase in the province’s yield.

3.3. The Relationship between Cultivation Patterns, Yield, and Climate Suitability

The trends in the areas of cultivar patterns, yields and climate suitability are basically the same (Figure 9). The positive correlation between the three variables reveals that the cultivation area of late-maturing maize is larger, and the high-yield area is larger, and the area with high suitability is also larger. In the past 30 years, the percentage of late-maturing maize in the province has increased by 18.8%, while the high-yield area has increased by 33.5%, and the high-suitability area has increased by 32%. When the cultivation area variation of late-maturing maize was small, the area of early maturing maize increased by 5%, while the middle-yield area increased by 7.7%, and the middle-suitability area increased by 21%. With the gradual increase of temperature, mid-late-maturing maize cultivation is expanding, and the climate suitability is improved, which is more conducive to corn growth and yield formation.

3.4. Analysis of Factors Limiting Climate Suitability

Figure 10 shows the gray correlation between climatic suitability and meteorological factors, and typical regional disaster factors, which are drought in the west (ZL, TY) and chilling damage in the east (BS, CB, LJ). The results showed that suitability is mostly affected by the hazard factors. The climatic suitability of the eastern part during period 1–2 was greatly affected by the chilling factors, which was most significantly related to the temperature limitation during the jointing stage. However, the increase in temperature in the subsequent periods has an accumulated temperature compensation effect on corn growth, and reduces losses. Interestingly, the influence of altitude on suitability is considered in the interpolation process. Therefore, the low altitude climate suitability of CB, LJ and BS are more in line with the actual characteristics. Moreover, for the western region, the suitability and drought factors are moderately correlated throughout the full growth period, resulting in increased losses. However, the occurrence of drought is mainly concentrated in individual years [43]. Therefore, the assessment of suitability can capture the average climate resource status of the region. Additionally, the eastern region is more affected by sunshine in September, mainly because the rainy season makes the period of sunshine relatively short. The western region is strongly influenced by the number of sunshine hours, mainly because the mid-late maturing varieties planted in the western region are relatively sensitive to sunshine conditions.

4. Discussion

4.1. Improvement of the Climate Suitability Assessment Approach

In this paper, we present a yield-based approach for evaluating the climate suitability of accumulated temperature-induced maize cultivation patterns. Like the process-based crop model approach, our study can also capture single-year or long-term suitability changes, and the method is relatively simple and straightforward. Previous studies on land suitability have taken agroclimatic indices into account, but have not considered the climate suitability for each phenological period. For example, Golnaz Badr et al., [44] assessed the spatial suitability of vineyards using agroclimatic indices, and quantified only the general effects of climate suitability on land-use evaluation. In contrast, this study evaluates the climate suitability of maize for each phenological period, allowing for more detailed and accurate monitoring of process-based climate impacts, which is more common in agroclimate studies. Dimitris [45] combined the precipitation and effective precipitation of each month in the crop growing season to analyze the characteristics of agricultural drought. Thuan et al., [46] evaluated the temperature and precipitation suitability of maize and wheat in different months. Similarly, Holzkämper [26] proposed a rule-based approach to evaluate crop-specific suitability for phenophase-specific climate indices, but that study did not consider varieties that mature differently. Our approach can be applied to the dynamic assessment of the climate suitability of maize varieties with different maturation characteristics, based on changes in accumulated temperature. Previous studies have focused on climate resources, cropping systems, yield, and natural disaster risks in changing areas of different maturity cultivation patterns [8,10,47], but there are few studies on climate suitability assessment combined with changes in crop varieties [23]. Moreover, traditional methods of evaluating agricultural climatic suitability have relied mainly on meteorological data, and have used surveys and existing studies to set the lower and upper thresholds of the acceptable and optimal meteorological indicators. For example, Zhao et al., [48] and Qiu et al., [30] used the threshold of meteorological factor suitability, based on expert knowledge, to evaluate the climatic suitability of potato and corn, respectively. Our studies used high-stability of meteorological yield to improve the traditional methods for the more statistically significant climate indicators, and it is more meaningful to capture the impact of climate change on crops in specific regions. Comparing the research results for maize suitability, based on the MaxEnt model in China [49], it is found that the climate suitability in Jilin Province is basically consistent with our study. However, combined with the actual maize yield data (Figure 3h), the result of Ye et al., is relatively high in the western region, and our study is closer to the actual maize production in Jilin Province. Moreover, our analysis of the limiting factors for individual points with poor evaluation results found that extreme meteorological disasters in individual years have a certain impact on the suitability evaluation, so it is necessary to include meteorological disaster factors into the suitability assessment in future research.

4.2. The Influence of Climate Change on the Climate Suitability Of Maize

Climate warming has increased maize production (where other resources are not restricted) and the 1980s and 1990s show a maize yield increase of 17.98% and 26.78%, respectively [12]. Studies [50,51] have confirmed that the yield gradually increases with the temperature up to 30 °C, but decreases rapidly at higher temperatures, which indicates that there is a complex nonlinear relationship between temperature and crop yield. As the temperature rises, corn growth conditions in northern countries have improved significantly, especially in Eastern Europe and Denmark, and areas suitable for growing are expected to extend to the north [52,53]. The rate of temperature increase in Northeastern China accelerated in 1980 and rose sharply during the 1990s, then rose slowly in the 21st century [54]. Previous research [10,30] has confirmed that the northern boundary of corn growth in Northeast China has moved significantly northward and eastward, and the average resource suitability index gradually expanded from southwest to northeast in the 1961-2010 period, which was conducive to the growth and yield formation of maize. Accordingly, our study reveals that the maize cultivation pattern in Jilin Province has undergone significant displacement around 1990, and the late-maturing variety has shifted significantly eastward, which leads directly to the displacement of the climatically suitable and high yield area to the central and eastern regions. When the temperature changed slowly after 2006, the change in climate suitability and yield was relatively small, based on the small change in cultivation patterns. A study [10] has confirmed that the northernmost boundary of maize growth in northeast China occurred in 2001–2007. Liu argued that the maize yield of Jilin Province should be increased by about 25%, when the early-middle maturing varieties were replaced by the late maturing variety. In our study, if the late-maturing variety in the province replaced 18.8% of the early-maturing varieties, the high-suitability and high-yield areas increased by 32% and 33.5%, respectively. Moreover, the choice of cultivars gradually changed to mid-late maturing within a certain temperature range, and the climatic resources in high latitudes were also more conducive to crop growth, which led to increased yield, supporting the theory of the northward spatiotemporal expansion of maize cultivation [53]. Finally, an in-depth study of the limiting factors in the individual regions found that cold damage and drought have significant effects, and late-maturing varieties are greatly affected by sunlight, which can support the improvement of corn climate suitability. In conclusion, adaptation strategies are needed, such as changing the planting pattern, replacing relatively high-yielding mature varieties, and improving the climate resources of the restricted areas to achieve higher production efficiency under global warming.

5. Conclusions

Our approach for evaluating the climate suitability of maize allows for a specific suitability classification to evaluate agro-climatic potentials and constraints. A particular strength of our approach is its use of both traditional knowledge and statistical approaches to yield data, which better captures the spatiotemporal variability in the climate suitability and yield of maize. This article takes maize in Jilin Province as an example, and the results show that the method has good performance in climate suitability evaluation, with Willmott’s index reaching 0.705, and the suitability of most sites being well matched to their meteorological yields.
(1) The accumulated temperature of the maize growing season in Jilin Province from 1986 to 2015 showed a positive correlation with yield (R2 = 0.537, p < 0.1). After 1995, the accumulated temperature increased significantly, and the early-maturing varieties in the central and eastern regions were replaced by mid-late maturing varieties. Accordingly, the high-yield areas expanded significantly from the central region. The changes in the decade after 2005 were relatively small.
(2) The climate suitability of differently maturing maize varieties was evaluated based on their yield data. The suitability of early maturing varieties decreased, and the suitability of mid-late maturing varieties increased, which matched the trend of the earlier varieties being replaced by mid-late maturing ones. The high climate-suitability areas gradually expanded from the central region to the western and eastern regions. However, the instability of high-latitude and high-altitude regions affects the climate suitability assessment.
(3) The cultivar pattern, corn yield and climate suitability are all positively correlated. In the past 30 years, with the gradual increase of temperature, the late-maturing area increased by 18.8%, high-yield areas increased by 33.5%, and high-suitability areas increased by 32%. The increase in temperature promotes the replacement of varieties, which in turn increases the yield, and the climate resources are conducive to the growth of maize.
In summary, these results can provide useful insights when attempting to develop effective and adaptive strategies of agricultural development at a regional scale. Additionally, other varying factors, such as agricultural disasters, weather events, and farm practices, should be considered in a complete evaluation of climatic suitability for maize production.

Author Contributions

Conceptualization, J.Z., Z.T. and J.Z.; Data curation, R.W.; Funding acquisition, Z.T. and J.Z.; Methodology, J.Z. and K.L.; Project administration, Z.T. and J.Z.; Software, J.Z. and K.L.; Supervision, Z.T. and J.Z.; Validation, J.Z. and K.L.; Visualization, J.Z.; Writing—original draft, J.Z.; Writing—review and editing, J.Z., R.W. and J.Z.

Funding

This research is supported by the National Science Foundation of China (41571491 and 41877520); The Science and Technology Development Planning of Jilin Province(20190303018SF); The Science and Technology Planning of Changchun(19SS007); The China Special Fund for Meteorological Research in the Public Interest (No. GYHY201506001-6); The National Key Technology R&D Program of China under Grant (2013BAK05B01); The Fundamental Research Funds for the Central Universities of China (2412016KJ046).

Acknowledgments

We would like to thank the Jilin Institute of Meteorological Science for collecting Maize production dataset.

Conflicts of Interest

The authors declare no conflict of interest.

References

  1. Trnka, M.; Olesen, J.E.; Kersebaum, K.C.; SkjelvÅg, A.O.; Eitzinger, J.; Seguin, B.; Peltonen-Sainio, P.; RÖtter, R.; Iglesias, A.; Orlandini, S.; et al. Agroclimatic conditions in Europe under climate change. Glob. Chang. Biol. 2011, 17, 2298–2318. [Google Scholar] [CrossRef] [Green Version]
  2. Lobell, D.B.; Asner, G.P. Climate and management contributions to recent trends in U.S. agricultural yields. Science 2003, 299, 1032. [Google Scholar] [CrossRef] [PubMed]
  3. Ciais, P.; Reichstein, M.; Viovy, N.; Granier, A.; Ogee, J.; Allard, V.; Aubinet, M.; Buchmann, N.; Bernhofer, C.; Carrara, A.; et al. Europe-wide reduction in primary productivity caused by the heat and drought in 2003. Nature 2005, 437, 529–533. [Google Scholar] [CrossRef] [PubMed]
  4. Wei, T.; Cherry, T.L.; Glomrod, S.; Zhang, T. Climate change impacts on crop yield: Evidence from China. Sci. Total Environ. 2014, 499, 133–140. [Google Scholar] [CrossRef] [PubMed] [Green Version]
  5. Lobell, D.B.; Burke, M.B.; Tebaldi, C.; Mastrandrea, M.D.; Falcon, W.P.; Naylor, R.L. Prioritizing climate change adaptation needs for food security in 2030. Science 2008, 319, 607–610. [Google Scholar] [CrossRef]
  6. Chen, C.; Qian, C.; Deng, A.; Zhang, W. Progressive and active adaptations of cropping system to climate change in Northeast China. Eur. J. Agron. 2012, 38, 94–103. [Google Scholar] [CrossRef]
  7. Intergovernment Panel on Climate Change. Intergovernmental Panel on Climate Change Climate Change 2007 Fourth Assessment Report; Cambridge University Press: Cambridge, UK, 2007.
  8. Zhao, J.; Yang, X.; Liu, Z.; Lv, S.; Wang, J.; Dai, S. Variations in the potential climatic suitability distribution patterns and grain yields for spring maize in Northeast China under climate change. Clim. Chang. 2016, 137, 29–42. [Google Scholar] [CrossRef]
  9. Meng, Q.F.; Hou, P.; Wu, L.; Chen, X.P.; Cui, Z.L.; Zhang, F.S. Understanding production potentials and yield gaps in intensive maize production in China. Field Crops Res. 2013, 143, 91–97. [Google Scholar] [CrossRef] [Green Version]
  10. Liu, Z.; Yang, X.; Chen, F.; Wang, E. The effects of past climate change on the northern limits of maize planting in Northeast China. Clim. Chang. 2013, 117, 891–902. [Google Scholar] [CrossRef]
  11. Zhao, J.; Yang, X.; Lv, S.; Liu, Z.; Wang, J. Variability of available climate resources and disaster risks for different maturity types of spring maize in Northeast China. Reg. Environ. Chang. 2014, 14, 17–26. [Google Scholar] [CrossRef]
  12. Wang, X.; Peng, L.; Zhang, X.; Yin, G.; Zhao, C.; Piao, S. Divergence of climate impacts on maize yield in Northeast China. Agric. Ecosyst. Environ. 2014, 196, 51–58. [Google Scholar] [CrossRef]
  13. Thornton, P.K.; Ericksen, P.J.; Herrero, M.; Challinor, A.J. Climate variability and vulnerability to climate change: A review. Glob. Chang. Biol. 2015, 20, 3313–3328. [Google Scholar] [CrossRef]
  14. Na, L.; Na, R.; Zhang, J.; Tong, S.Q.; Shan, Y.; Ying, H.; Li, X.Q. Vegetation Dynamics and Diverse Responses to Extreme Climate Events in Different Vegetation Types of Inner Mongolia. Atmosphere 2018, 9, 10. [Google Scholar] [CrossRef]
  15. Tao, F.; Yokozawa, M.; Zhang, Z. Modelling the impacts of weather and climate variability on crop productivity over a large area: A new process-based model development, optimization, and uncertainties analysis. Agric. For. Meteorol. 2009, 149, 831–850. [Google Scholar] [CrossRef]
  16. Guo, Y.; Li, X.; Zhao, Z.; Nawaz, Z. Predicting the impacts of climate change, soils and vegetation types on the geographic distribution of Polyporus umbellatus in China. Sci. Total Environ. 2019, 648, 1–11. [Google Scholar] [CrossRef] [PubMed]
  17. Anderson, R.P. A framework for using niche models to estimate impacts of climate change on species distributions. Ann. N. Y. Acad. Sci. 2013, 1297, 8–28. [Google Scholar] [CrossRef] [PubMed]
  18. Herrera, J.P.; Borgerson, C.; Tongasoa, L.; Andriamahazoarivosoa, P.; Rasolofoniaina, B.J.R.; Rakotondrafarasata, E.R.; Randrianasolo, J.L.R.R.; Johnson, S.E.; Wright, P.C.; Golden, C.D. Estimating the population size of lemurs based on their mutualistic food trees. J. Biogeogr. 2018, 45, 2546–2563. [Google Scholar] [CrossRef]
  19. Lamsal, P.; Kumar, L.; Aryal, A.; Atreya, K. Invasive alien plant species dynamics in the Himalayan region under climate change. Ambio 2018, 47, 697–710. [Google Scholar] [CrossRef]
  20. Austin, M.P.; Van Niel, K.P. Improving species distribution models for climate change studies: Variable selection and scale. J. Biogeogr. 2011, 38, 1–8. [Google Scholar] [CrossRef]
  21. Storlie, C.J.; Phillips, B.L.; VanDerWal, J.J.; Williams, S.E. Improved spatial estimates of climate predict patchier species distributions. Divers. Distrib. 2013, 19, 1106–1113. [Google Scholar] [CrossRef]
  22. Yin, X.; Olesen, J.E.; Wang, M.; Ozturk, I.; Zhang, H.; Chen, F. Impacts and adaptation of the cropping systems to climate change in the Northeast Farming Region of China. Eur. J. Agron. 2016, 78, 60–72. [Google Scholar] [CrossRef]
  23. Zhao, J.; Guo, J.; Xu, Y.; Mu, J. Effects of climate change on cultivation patterns of spring maize and its climatic suitability in Northeast China. Agric. Ecosyst. Environ. 2015, 202, 178–187. [Google Scholar] [CrossRef]
  24. Adejuwon, J. Assessing the suitability of the epic crop model for use in the study of impacts of climate variability and climate change in West Africa. Singap. J. Trop. Geogr. 2005, 26, 44–60. [Google Scholar] [CrossRef]
  25. Zhao, J.; Yang, X. Distribution of high-yield and high-yield-stability zones for maize yield potential in the main growing regions in China. Agric. Forest Meteorol. 2018, 248, 511–517. [Google Scholar] [CrossRef]
  26. Holzkamper, A.; Calanca, P.; Fuhrer, J. Identifying climatic limitations to grain maize yield potentials using a suitability evaluation approach. Agric. Forest Meteorol. 2013, 168, 149–159. [Google Scholar] [CrossRef]
  27. Zhao, J.; Guo, J.; Mu, J. Exploring the relationships between climatic variables and climate-induced yield of spring maize in theast China. Agric. Ecosyst. Environ. 2015, 207, 79–90. [Google Scholar] [CrossRef]
  28. Tao, F.; Zhang, Z.; Zhang, S.; Rötter, P.R.; Shi, W.J.; Xiao, D.P.; Liu, Y.J.; Wang, M.; Liu, F.S.; Zhang, H. Historical data provide new insights into response and adaptation of maize production systems to climate change/variability in China. Field Crops Res. 2016, 185, 1–11. [Google Scholar] [CrossRef]
  29. Mourad, M.; Bertrand-Krajewski, J.L.; Chebbo, G. Calibration and validation of multiple regression models for stormwater quality prediction: Data partitioning, effect of dataset size and characteristics. Water Sci. Technol. 2005, 52, 45–52. [Google Scholar] [CrossRef]
  30. Qiu, M.J.; Guo, Q.; Guo, C.M. Temporal and spatial distribution characteristics of spring maize agro-climatic resources suitability in Jilin province. J. Meteor. Environ. 2018, 34, 82–91. (In Chinese) [Google Scholar]
  31. El-Maayar, M.; Lange, M.A. A Methodology to Infer Crop Yield Response to Climate Variability and Change Using Long-Term Observations. Atmosphere 2013, 4, 365–382. [Google Scholar] [CrossRef] [Green Version]
  32. Zhu, X.; Xu, Q.; Tang, M.; Li, H.J.; Liu, F.Z. A hybrid machine learning and computing model for forecasting displacement of multifactor-induced landslides. Neural Comput. Appl. 2018, 30, 3825–3835. [Google Scholar] [CrossRef]
  33. Wang, G.; Lu, J.; Chen, K.; Wu, X. Exploration of Method in Separating Climatic Output Based on HP Filter. Chin. J. Agrometeorol. 2014, 35, 195–199. [Google Scholar]
  34. Guo, J.P.; Ma, S.Q. Theory and Practice of Monitoring and Prediction of Low Temperature and Cold Damage of Crops. China Meteorol. Press. 2009, 11, 53–55. (In Chinese) [Google Scholar]
  35. Frank, N.; Richard, N. A fast deterministic smallest enclosing disk approximation algorithm. Inf. Process. Lett. 2005, 93, 263–268. [Google Scholar]
  36. China Meteorological Administration. Available online: http://www.cma.gov.cn/root7/auto13139/201612/t20161213_349521.html (accessed on 24 February 2019).
  37. Liu, G.C.; Yang, C.B.; Liu, W.S.; Ding, J.H. Research and Application of Agricultural Climate Suitability Division Based on Fuzzy Mathematics. J. Jilin Agric. Univ. 2007, 29, 460–463. [Google Scholar]
  38. FAO. Early Agrometeorological Crop Yield Assessment. FAO Plant Production and Protection; Food and Agricultural Organization: Rome, Italy, 1986; Volume 73, 155p. [Google Scholar]
  39. Willmott, C.J. On the validation of models. Phys. Geogr. 1981, 2, 184–194. [Google Scholar] [CrossRef]
  40. Wang, R.; Zhang, J.Q.; Guo, E.L.; Li, D.J.; Ha, S.; A, L.S. Spatiotemporal characteristics of drought and waterlogging during maize growing season in mid-western Jilin province for recent 55 years. J. Nat. Disasters 2018, 27, 186–197. (In Chinese) [Google Scholar]
  41. Cai, J.J. Risk assessment of maize drought and chilling in Northeast China. Master’s Thesis, Chinese Academy of meteorological Sciences, Beijing, China, 2013. [Google Scholar]
  42. Xia, L.K.; Qiao, J.F.; Zhu, W.H. A book understands corn high yield and disaster prevention and mitigation techniques. Zhongyuan Farmers Publ. House 2016, 5, 31–32. (In Chinese) [Google Scholar]
  43. Zhang, Q.; Zhang, J.; Guo, E.; Yan, D.H. The impacts of long-term and year-to-year temperature change on corn yield in China. Theor. Appl. Climatol. 2015, 119, 77–82. [Google Scholar] [CrossRef]
  44. Badr, G.; Hoogenboom, G.; Moyer, M.; Markus, K.; Rupp, R.; Davenport, J. Spatial suitability assessment for vineyard site selection based on fuzzy logic. Precis. Agric. 2018, 19, 1–22. [Google Scholar] [CrossRef]
  45. Tigkas, D.; Vangelis, H.; Tsakiris, G. Drought characterisation based on an agriculture-oriented standardised precipitation index. Theor. Appl. Climatol. 2019, 135, 1435–1447. [Google Scholar] [CrossRef]
  46. Than, N.T.; Qiu, J.J.; Verdoodt, A.; Li, H.; Van Ranst, E. Temperature and Precipitation Suitability Evaluation for the Winter Wheat and Summer Maize Cropping System in the Huang-Huai-Hai Plain of China. Agric. Sci. Chin. 2011, 10, 275–288. [Google Scholar] [CrossRef]
  47. Li, Z.; Tan, J.; Tang, P.; Chen, H.; Zhang, L.; Liu, H.; Wu, W.; Tang, H.; Yang, P.; Liu, Z. Spatial distribution of maize in response to climate change in northeast China during 1980-2010. J. Geogr. Sci. 2016, 26, 3–14. [Google Scholar] [CrossRef]
  48. Zhao, J.; Zhan, X.; Jiang, Y.; Xu, J. Variations in climatic suitability and planting regionalization for potato in northern China under climate change. PLoS ONE 2018, 13, 9. [Google Scholar] [CrossRef]
  49. Ji, Y.; Zhou, G.; He, Q.; Wang, L.X. The Effect of Climate Change on Spring Maize (Zea mays L.) Suitability across China. Sustainability 2018, 10, 10. [Google Scholar] [CrossRef]
  50. Schlenker, W.; Roberts, M.J. Nonlinear effects of weather on corn yields. Rev. Agr. Econ. 2006, 28, 39. [Google Scholar] [CrossRef]
  51. Schlenker, W.; Roberts, M.J. Nonlinear temperature effects indicate severe damages to US crop yields under climate change. Proc. Natl. Acad. Sci. 2009, 106, 15594–15598. [Google Scholar] [CrossRef]
  52. Tuck, G.; Glendining, M.J.; Smith, P.; House, J.I.; Wattenbach, M. The potential distribution of bioenergy crops in Europe under present and future climate. Biomass Bioenergy 2006, 30, 183–197. [Google Scholar] [CrossRef]
  53. Odgaard, M.V.; Bocher, P.K.; Dalgaard, T.; Svenning, J.C. Climatic and non-climatic drivers of spatiotemporal maize-area dynamics across the northern limit for maize production-A case study from Denmark. Agric. Ecosyst. Environ. 2011, 142, 291–302. [Google Scholar] [CrossRef]
  54. Wang, X.Y. Research on the Evolution Trend of Regional Accumulated Temperature Zone in China. Master’s Thesis, East China Normal University, Beijing, China, 2015. [Google Scholar]
Figure 1. The location of the study area in China.
Atmosphere 10 00305 g001
Figure 2. Factor suitability threshold ([Xa, Xb] is the optimal threshold. [Xc, Xa] and (Xb, Xd] are suboptimal; (−∞, Xc) and (Xd,+∞) are unfavorable).
Atmosphere 10 00305 g002
Figure 3. Spatial distribution of cultivation patterns (ad) and yield (eh).
Atmosphere 10 00305 g003
Figure 4. Temporal changes of ≥10 °C accumulated temperature (AAT10) and yield.
Atmosphere 10 00305 g004
Figure 5. Yield-based refinement of factor suitability (period 1 from germination to jointing, period 2 from jointing to tasseling, period 3 from tasseling to milking, period 4 from milking to maturity; EM: early maturity, MM: middle maturity, LM: late maturity).
Atmosphere 10 00305 g005
Figure 6. Comparison of scaled station mean meteorological yield and station mean suitability (calibration stations: gray dot; validation stations: red triangle; d < 0.6: blue circle; dotted line indicates 1:1 relationship).
Atmosphere 10 00305 g006
Figure 7. Temporal trends of mean suitability of differently maturing varieties (ac represent early maturity, middle maturity, and late maturity, respectively).
Atmosphere 10 00305 g007
Figure 8. Spatial distribution of climate suitability (ad).
Atmosphere 10 00305 g008
Figure 9. Area change for cultivar patterns (a), crop yields (b), and climate suitability (c).
Atmosphere 10 00305 g009
Figure 10. Suitability limitations in the east (a) and the west (b). Taverage: average temperature, Pre: precipitation, Sun: sunshine hours, Chi: the chilling injury index, Dro: the water deficit index.
Atmosphere 10 00305 g010
Table 1. Indicators for maize cultivation.
Cultivation Area≥10 °C Accumulated Temperature (°C·d) (AAT10)
Unsuitable for planting (UP)<2100
Early maturity (EM)2100–2500
Medium maturity (MM)2500–2850
Late maturity (LM)>2850

