1. Introduction
Hato is one of the strongest tropical cyclones (TCs) to have made landfall and cause serious impacts to the Pearl River Delta (PRD) in recent years. According to government and media reports, Hato resulted in 24 dead or missing, over 800 injured, and a loss of over 6 billion U.S. dollars to the economy of Hong Kong, Macau, Zhuhai, and other places along its track. Direct impacts to the region included collapsed and damaged buildings, landslides, fallen trees, flooding, transportation difficulties, and the loss of many homes. The effects have been long-lasting, and recovery has been slow. It is one of the most destructive TCs on record in the PRD.
Historically, TCs have been extremely deadly. Serious TC-induced casualties and economic losses have frequently occurred. Some examples follow: Bhola in 1970 caused 30,000–50,000 deaths in Bangladesh; Nina brought about 171,000 deaths in 1975; and Nargis in 2008 led to 138,000 casualties in Myanmar. In China, casualties due to TCs in the past several decades have amounted to over 11,000, with 400 each year on average [
1]. In fact, the number of TC-induced casualties has decreased slightly in the past several decades, thanks to increased efforts in natural disaster prevention and mitigation by the government [
1]. However, many studies have found economic losses to be on the rise, associated with increasing coastal population, urbanization, and global warming [
1,
2,
3,
4,
5]. Although studies have found no obvious trend in casualties, the importance of TC-induced destructiveness, even nowadays, should not be disregarded, whether in rural or urbanized regions, because of the continuing economic losses.
In addition to such direct and serious economic losses and casualties, other potential hazards brought about by TCs have been less discussed in previous studies. Hot weather and severe air pollution episodes are possibly related to TCs. According to the historical records of the Hong Kong Observatory (HKO), very hot weather occurs with an approaching TC [
6,
7]; examples are Soudelor in 2015, Fung-Wong in 2008, and Yancy in 1990. A TC’s peripheral sinking motion, or subsidence air, would lead to a rise in temperature with a small amount of cloud. Also, strong subsidence induced by peripheral circulations of TCs, such as Melor in 2003, can lead to adiabatic heating, which increases the temperature in the lower troposphere [
8]. On the other hand, in a study of six summer pollution episodes between 1994 and 1999, tropical cyclones always occurred on the episode days [
9]. Another study illustrated that a high concentration of particulate matter with an aerodynamic diameter ≤ 10 μm (PM
10) and ozone (O
3) in Hong Kong is likely to occur in association with a TC near Taiwan [
10]. Some meteorological factors, including a sinking motion, less cloud cover, and continental flow, were observed in studies of air quality deterioration with TCs. The sinking motion would reduce the planetary boundary layer’s height, which favors the accumulation of particulate matter near emission sources in the PRD region [
8]. During the day, strong solar radiation with less cloud cover could increase the ozone concentration with photochemical reactions [
9]. At night, less cloud cover would enhance the radiative cooling, which leads to nocturnal temperature inversion and stagnant atmospheric conditions. This reduces the dispersion of pollutants [
8]. The continental flow induced by TCs can enhance the horizontal advection of pollutants from upwind regions [
8,
9,
10].
The PRD is one of the most developed urban centers in China and the world. It is an integrated industrial, commercial, financial, and logistical center in south China. The Chinese government recognizes the importance of the Guangdong–Hong Kong–Macao Greater Bay Area and enhancing the development of the region in the future. However, the potential hazards of hot weather and air pollution in the PRD will increase with future development and global warming [
11,
12]. Previous studies illustrate that the temperature has increased in Shenzhen much faster than in Hong Kong in recent decades, associated with its greater growth rates of urbanization and economy. Temperature increases in the PRD were simulated in the Representative Concentration Pathway (RCP) 4.5 and RCP 8.5 scenarios from the Coupled Model Intercomparison Project Phase 5 (CMIP 5) [
11]. The added effect of hot temperatures from urbanization, global warming, and TC-induced heating would bring about extreme hot weather that will enhance the incidence rate of heat-related diseases, reduce productivities [
13,
14,
15], and lead to serious economic and health challenges in the future. However, previous studies mainly focus on the direct destructiveness, and focus less on the comprehensive influences of TCs. In this study, we summarize the meteorological and environmental influences of typhoon Hato on the PRD in order to provide a more comprehensive assessment of the influence of an intense TC on the PRD.
2. Data
a) Study Area
The PRD is a major contributor to the Gross Domestic Product of China. This highly populated region is also an industrial, commercial, high-technology, and innovative integration center, and, because it is included in the Guangdong–Hong Kong–Macao Greater Bay Area, it is key to the strategic planning of China’s development. It is located in a subtropical region, with generally wet summers and dry winters. The precipitation during summer is mainly due to the summer monsoon, associated with southwesterly wind from the Indian Ocean, cross-tropical air transported from the nearby Maritime Continent, and typhoons. On the other hand, extreme high temperatures have occurred more frequently in recent years and have become a potential health risk. Since this is one of the most densely and highly developed areas in China, air quality is of great concern. According to past records from the Hong Kong Environmental Protection Department (HKEPD), particulate matter (PM) has been one of the major pollutants in Hong Kong. With improvements undertaken by Hong Kong and cooperation among the cities of the Pearl River Delta, such as setting up emissions reduction targets, the concentration of PM10 has been reduced. However, in recent years, ozone has become one of the major pollutants in Hong Kong. It is associated with a photochemical reaction in the presence of sunlight and nitrogen oxides, mainly from vehicle exhaust, power plants, and industry. In fact, although emissions have been reduced, in some pollution episodes, many pollutant concentrations can rise to extremely high values because of atmospheric influence.
b) Data
In this study, the intensity and position of TCs were taken from the Joint Typhoon Warning Center (JTWC) at 6-hour intervals, a common practice in the study of TCs. In order to study meteorological influences during TC activity, a four-times-daily reanalysis data from the National Centers for Environmental Prediction and the National Center for Atmospheric Research (NCEP/NCAR Reanalysis 1) with a 2.5° × 2.5° horizontal resolution were adopted to illustrate the evolution of circulation in the western North Pacific (WNP) and South China. Also, local daily meteorological observations in the PRD collected from the Hong Kong Observatory (HKO), the Zhuhai Meteorological Dureau, and the Macao Meteorological and Geophysical Bureau were used as local observational data to demonstrate the local impact of Hato, as shown in
Figure 1. In addition, meteorological data from the Meteorological Bureau of Shenzhen Municipality, obtained between 20 August 2017 and 24 August 2017, were used in this study, with an extremely high temporal and vertical spatial resolution, 10-second intervals, and uneven vertically distributed measurements from 10 m to 350 m above the ground. In the evolution of pollution, hourly air quality records from the HKEPD were used in this study.
c) Heat Index Equation
To consider a potential hazard due to the hot temperatures before a TC’s landfall, a heat index (HI) proposed by Lans P. Rothfusz [
16] was used in this study. It is a simplified equation showing the physiological effects of a high temperature from extensive biometeorological studies by “apparent temperature” [
17]. The detail of the simplified equation is shown below:
where T is the dry bulb temperature (°F) and R is the relative humidity (%).
3. Evolution of Hato and Its Direct Destructive Meteorological Influences
Typhoon Hato, with category-3 intensity in the Saffir–Simpson Hurricane Wind Scale, is one of the strongest typhoons to approach and make landfall on the PRD in recent years. According to data from the JTWC during June to November (JJASON) since 1982, Hato is one of the strongest TCs to pass through the South China Sea (SCS) (10–35° N, 100–120° E), with a ranking in the 94th percentile historically. The maximum sustained wind reached 100 knots. Hato was classified as a Super Typhoon by the HKO, and it is the third strongest TC centered within 800 km of Hong Kong in the local historical record. The evolution of the moving trajectory of Hato, including its intensity, is shown in
Figure 2. On 20 August 2017, a low-pressure system was established in the Western Pacific (WP) around 19.8° N, 127.0° E. It then passed though the Luzon Strait on 22 August 2017 and kept intensifying in association with the warm sea surface temperature (SST) in the SCS. On 23 August 2017, Hato rapidly intensified to a category 3 typhoon with winds of around 185 km per hour near its center when it was located close to the PRD, and it made landfall on the southern coast of Zhuhai on 23 August 2017 around noon local time (LT) in Hong Kong.
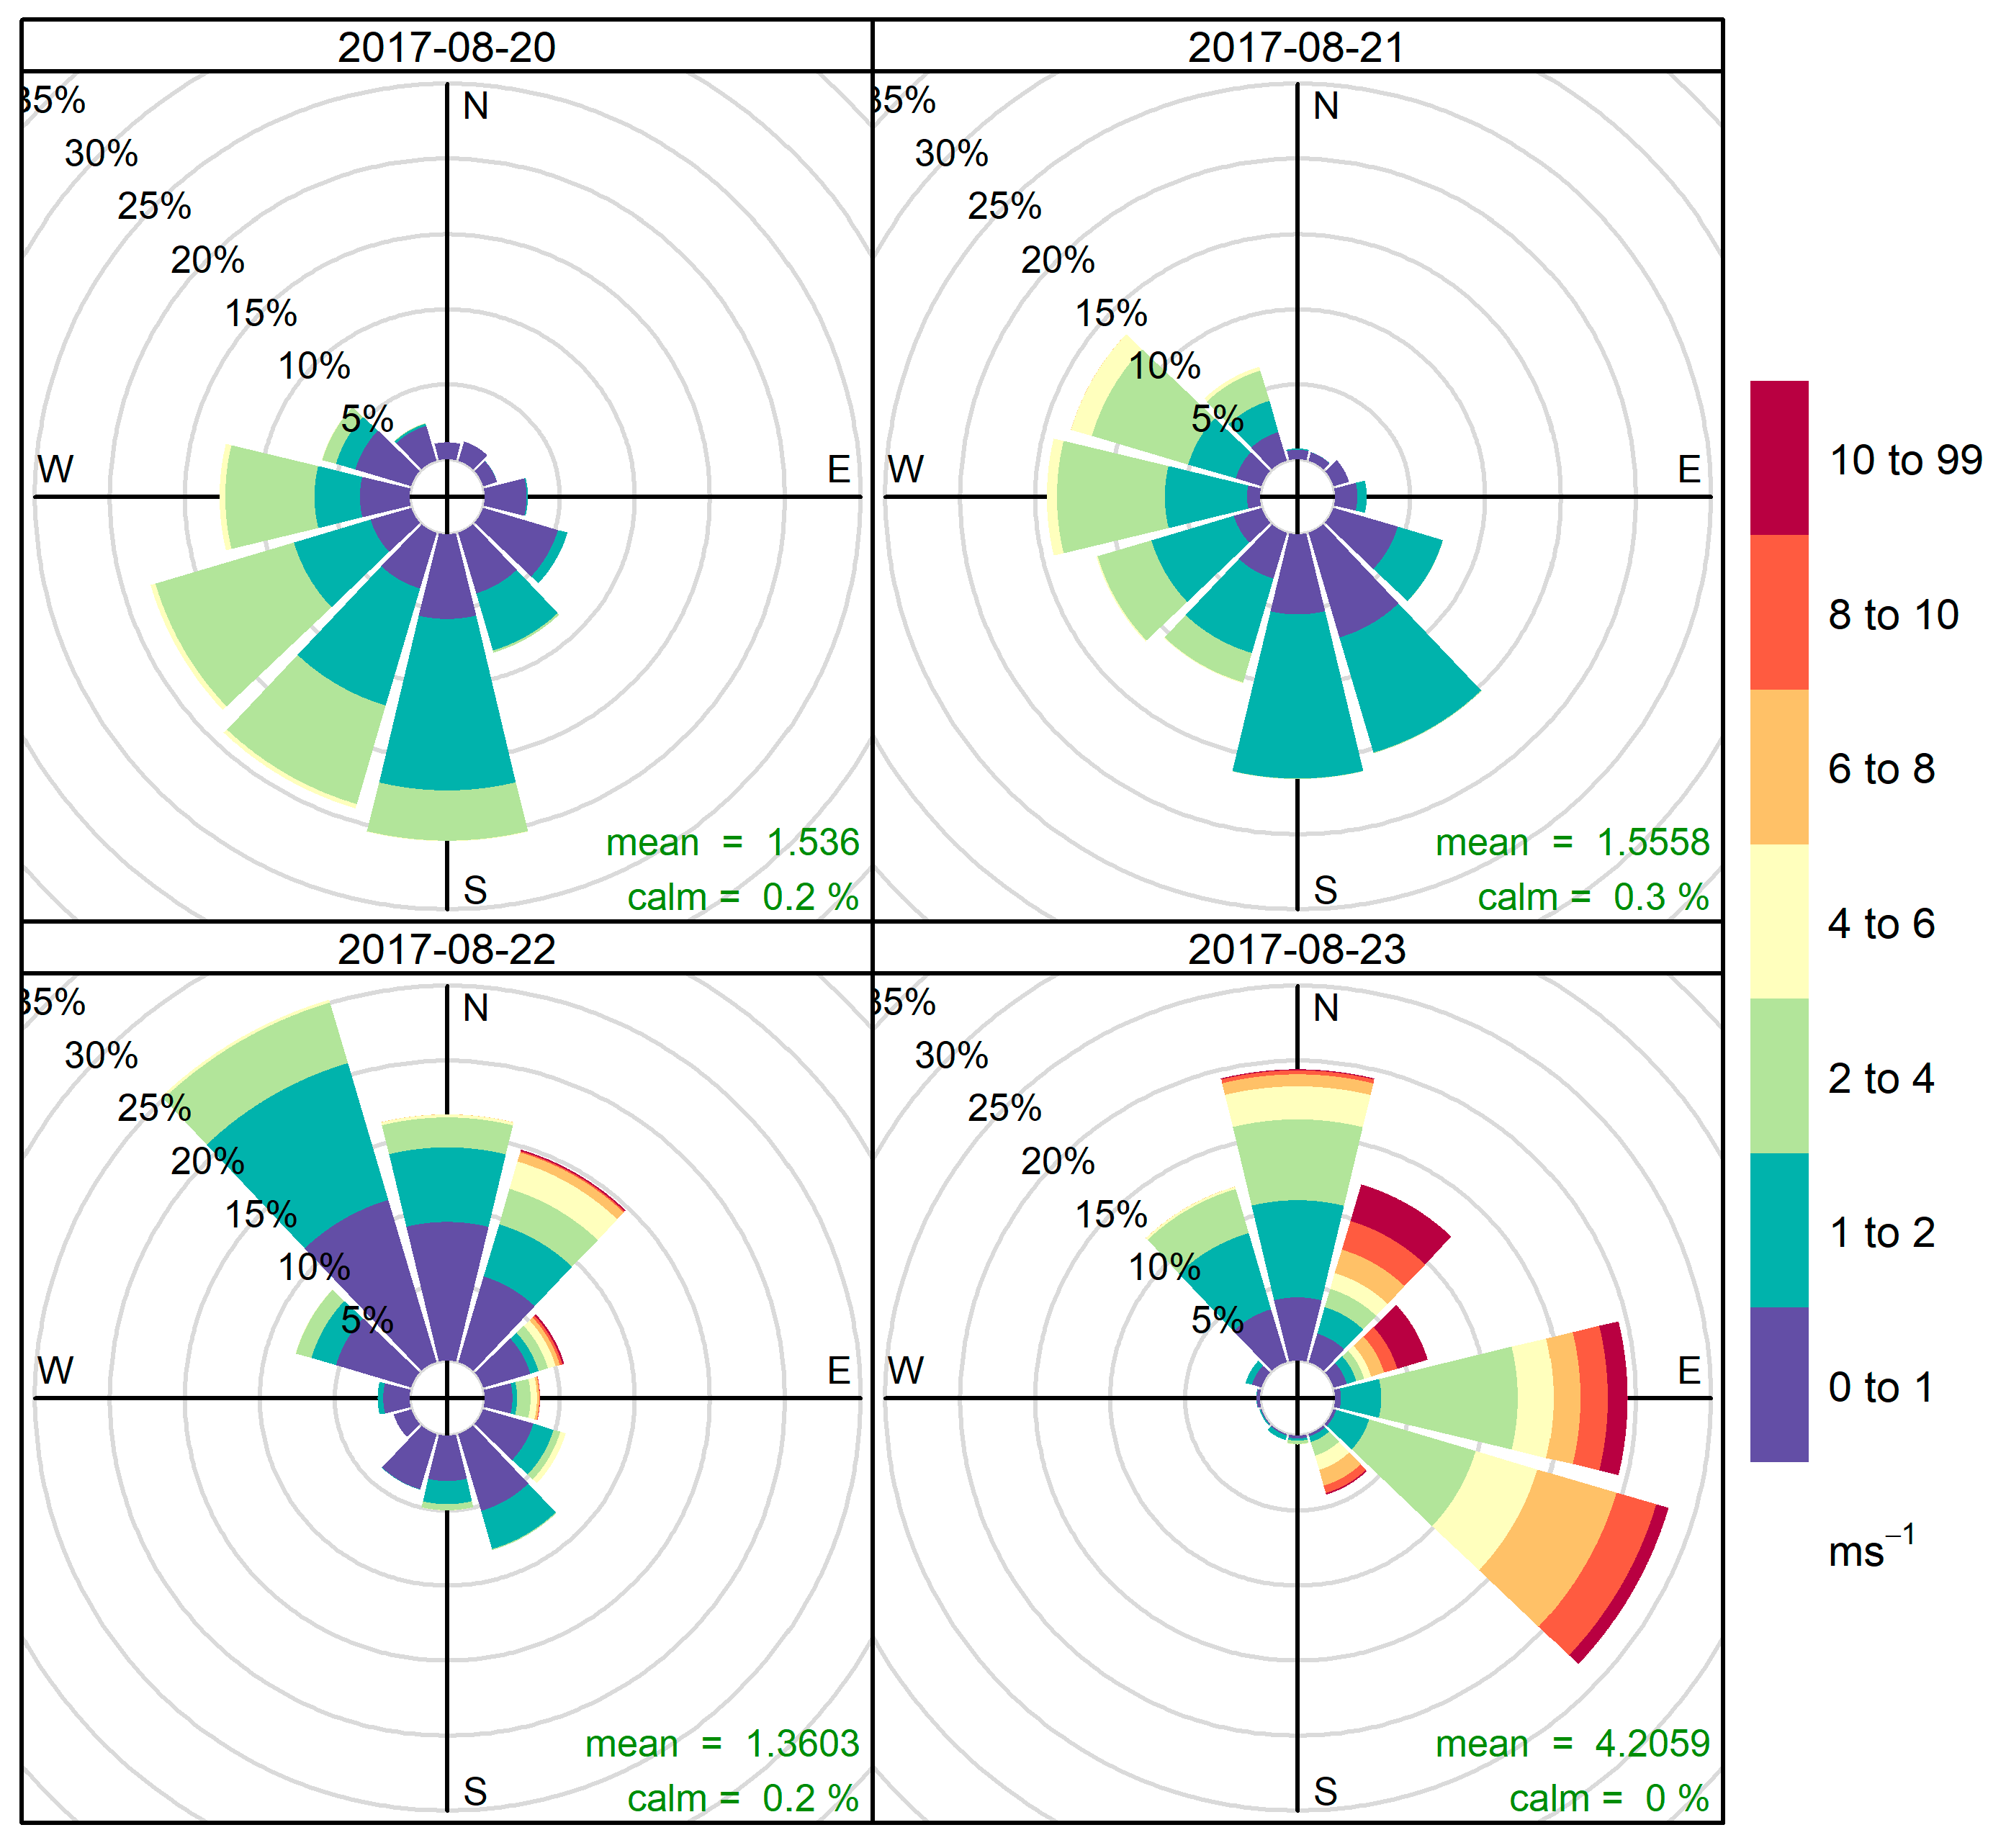
In terms of the direct destructive meteorological influences of Hato, local wind measurements at Shenzhen during the TC event are shown in
Figure 3. The evolution of the local surface wind has an obvious change that is associated with the location of Hato. During 20–21 August 2017, although Hato was generated in the WP, the prevailing southerly or southwesterly wind in Shenzhen was still controlled by the Asian summer monsoon, rather than by Hato, as shown by local measurements, because Hato was weak and far away from Shenzhen at this time. On 22 August 2017, the TC enters the SCS, as shown in
Figure 2.
An obvious difference in wind is observed compared to previous days. There was not only less proportional southerly or southwesterly wind observed on this day, but a dominant weaker northwesterly or northerly wind was observed, as shown by the wind rise in
Figure 3. According to the measurements, the wind speed for more than half of the day was under 1 m s
−1, providing very weak ventilation in the atmosphere, and associated with the TC’s peripheral circulation, while there was a sinking motion in the atmosphere and a calm wind at the surface level [
8].
During 23 August 2017, Hato rapidly intensified to a category-3 typhoon, associated with the warm SST in the SCS. Due to the intensification and approach of Hato, a dramatic strengthening of an easterly prevailing wind, with a mean speed of over 4 m s
−1, and a mean speed of 10–20 m s
−1 during the landfall of Hato, was observed in Shenzhen. Comparable results were obtained at some coastal stations relative to the Shenzhen station, such as in King’s Park and Waglan Island, with a mean speed of over 6 m s
−1 and 15 m s
−1, respectively, compared with the daily mean wind speed of less than 2.5 m s
−1 and 4.5 m s
−1, respectively, that was observed the previous day. Although Shenzhen is located inland compared to King’s Park and Waglan Island, it also experienced the power of Hato. Wind and pressure measurements with a very high temporal resolution at Shenzhen are illustrated in
Figure 4. Along the time series, it is observed that the TC-induced intensified local wind, or destructiveness, appears mainly between 0900 and 1300 LT. During this period, the pressure drops to about 950 mb near the surface, which corresponds to landfall and the closest distance to the PRD. Although surface wind intensity can represent part of the TC’s destructiveness to the whole of Shenzhen, the vertical gradient of the wind speed should also be considered to compensate for the reduced intensity by the complex terrain, especially in a dense urban area.
Figure 4 shows that the wind speed increases with height. The maximum gusts during this period at 10 m, 50 m, 100 m, and 300 m reached more than 17 m s
−1, 24 m s
−1, 26 m s
−1, and 30 m s
−1, respectively. On the other hand, an obvious change in wind direction is illustrated in
Figure 4b. From 0200 to 0700 LST, the wind is calm and has no obvious direction in Shenzhen. With the approach of Hato, the wind direction changes, associated with its distance and direction relative to the PRD. At 0800 LST, a northerly wind was observed and intensified in the upper level, and such changes subsequently started to appear at the surface. The northerly wind changed to the strongest east–northeasterly wind at 1200 LST, and then finally became a median southeasterly wind. In Zhuhai, one of the cities closest to the landfall location of Hato, the 10-min maximum wind reached 29.9 m s
−1, and the maximum gust reached over 50 m s
−1 in the measurement, compared to the previous highest record of 26.9 m s
−1 and 36.4 m s
−1 in maximum wind and maximum gust, respectively, during the TC activity in Vicente in 2012.
In terms of the local destructiveness in the PRD, huge areas of destruction were reported in Hong Kong, Macau, and Zhuhai, which were the closest to the TC’s landfall. A total of 16 fatalities were reported in Macau and Zhuhai. In addition to many of the typical TC-related accidents, such as landslides and falling trees, many windows were broken by a strong wind on 23 August 2017. In Zhuhai, according to the official reports from the government, over 700,000 people were affected by the TC event, in which more than 90,000 people had to be evacuated, 34 buildings were collapsed, more than 11,000 buildings were damaged, and over 8000 hectares of agricultural area were damaged. Nevertheless, flooding was a major cause of deaths and injuries due to drowning and electrical malfunctions, associated with the additive effect of rainfall from the storm, the storm surge, and the astronomical tide. HKO records indicate that the maximum sea level during 23 August 2017 was as high as that from all available stations during the TC’s passage, 3.91 m and 4.56 m, which is comparable to the highest records at Shek Pik station and Tsim Bei Tsui station (located in southwest and northwest Hong Kong, respectively).
4. Temperature Extremes before the TC’s Landfall
In addition to the direct destructiveness of Hato as reported by the media and the government, other meteorological influences of the storm were felt. One of potential public health risks associated with TC activity is extreme high temperature, which was documented by the HKO, and it was also observed before Hato made landfall in this study.
Figure 5 shows the evolution of temperature, the sinking motion, and surface wind during Hato’s approach. It can be observed that the PRD was suffering from high surface temperatures and a sinking motion in the afternoon during the period 20 August 2017 to 22 August 2017. The evolution of the temperature at Shenzhen is shown in
Figure 6. The daily maximum temperatures before the TC’s landfall, from 20 August 2018 to 22 August 2018, are 34.9 °C, 36.5 °C, and 38.4 °C, respectively. Similarly, the temperatures in the nearby regions Hong Kong and Macau increased from 33.4 °C to 36.9 °C, and from 33.1 °C to 38 °C, respectively. The temperature increases during this period can be explained by the sinking motion, adiabatic warming, horizontal advection, and cloud cover decreases associated with the approach of Hato.
Figure 7 illustrates the evolution of the potential temperature and vertical motion during the period 19 August 2017 to 23 August 2017 in the lower atmosphere. The potential temperature represents the near-surface temperature when an air mass at a certain pressure level is adiabatically brought to the ground level. Both the lower-level potential temperature and the sinking motion were strengthened during the period 20 August 2017 to 22 August 2017, which can lead to temperature increases at the surface. In addition, a regional-scale northwesterly wind was observed on 22 August 2017, which enhanced the temperature advection from the northwestern area to Shenzhen, Hong Kong, and Macau. Furthermore, the local daily mean cloud cover faction recorded by the HKO during the period 20 August 2017 to 21 August 2017 was 29% and 42%, respectively, which is much lower than the monthly mean of 70%. Because of this, the region experienced strong radiation forcing, which is also one of the factors that contributed to the temperature extreme in this case study.
The heat index based on the temperature at 1-min intervals at Shenzhen station during the period 20 August 2017 to 22 August 2017 is shown in
Figure 8. Obviously, the heat index was increasing during the period. During 20 August 2017 and 21 August 2017, extreme caution and danger warnings were issued, while, on 22 August 2017, a danger warning was issued. The evolution of the heat index during the storm event indicates that extreme hot weather can be a potential hazard and should not be disregarded.
5. Occurrence of a Serious Pollution Episode in the PRD
With the influence of Hato on the local weather in the PRD, the air quality in the region undoubtedly underwent an obvious change in response to TC-induced meteorological variations. In boreal summer, better air quality and visibility in Hong Kong is observed [
18,
19,
20]. The southerly or southwesterly prevailing wind and the major rainfall period, as characteristics of summer in the PRD that are controlled by the summer monsoon, can reduce the outflow of continental ambient air pollutants and favor the dispersion of local pollutants. However, a serious and rapid deterioration of air quality was observed just before the TC’s landfall, as shown in
Figure 9. The time-series of pollutant concentrations from the Mong Kok, Sham Shui Po, and Tap Mun stations, respectively representing roadsides, general urban environments, and rural environments in Hong Kong, illustrates the influence of Hato. Generally, local characteristics of pollutants can also be observed in the time-series. The PM
10 at the rural, general, and roadside stations has similar levels and variations, which shows that the local particulate emissions are lower compared with those of other pollutants. For nitrogen dioxide (NO
2) and nitrogen oxides (NO
X), the highest (lowest) concentration was observed at the roadside (rural) station, because these pollutants are emitted mainly by transportation sources in Hong Kong. The concentration of ozone, a secondary pollutant, was highest (lowest) at the rural (roadside) station and increased (reduced) with the volatile organic compounds (VOCs) (NO) concentration.
During the period 19 August 2017 to 20 August 2017, the air quality was good to medium, with lower concentrations of all pollutants. However, when the TC approached the PRD and entered the SCS, its influence was observed in the pollution levels. In fact, many previous studies have also illustrated the influence of typhoons on air quality [
8,
10,
21,
22,
23]. During 21 August 2017, the pollutant concentrations rapidly increased. Compared to the concentrations the previous day, the daily mean PM
10 concentrations increased from 22.1 to 39.1 μg m
−3 at the Tap Mun station, from 15.8 to 40.5 μg m
−3 at the Sham Shui Po station, and from 17.9 to 40.5 μg m
−3 at the Mong Kok station, which are almost double the concentrations of the previous day. The outflow of continental pollutants and weakening of the pollutant dispersion respectively associated with the norther-westerly wind and the sinking motion would be the possible factors. Similar to the PM
10, NO
2 rapidly increased from 41.3 to 78.5 μg m
−3, and from 71.5 to 130.8 μg m
−3, at the general urban and roadside stations, respectively, being double the values of previous days. However, the source of this pollutant may be different compared with PM
10. The concentration at Tap Mun was similar to that of previous days, which shows that some NO
2 comes from local emissions. Similar variation was observed in NO
X concentrations: from 80.3 μg m
−3 to 118.2 μg m
−3 and from 168.2 μg m
−3 to 241.3 μg m
−3 at the general urban and roadside stations, respectively. According to the HKEPD, the local emitted NO
X comes from traffic and lasts for only very short periods, so the rapid increase in NO
X is less associated with regional transport.
The concentration of O
3 rapidly increased on 21 August 2017. This increase may have resulted from TC-induced meteorological conditions and regional emissions of O
3 precursors. During the approach of TCs, an anomalous lower relative humidity and less cloud cover upwind of Hong Kong, along with continental transport, have been observed in previous studies, and these factors can enhance O
3 formation with NO
X, CO, and VOCs in remote regions and regional transport to the PRD. On the other hand, many studies have also found that the formation of O
3 in South China and Hong Kong is VOC-limited [
24,
25,
26]. The observed high temperatures at the surface just before landfall would be able to increase surface VOC emissions from both biogenic and anthropogenic sources [
27,
28,
29], which would enhance the regional contribution to a rapid O
3 increase.
6. Discussion and Conclusions
The destructiveness and potential health risks of the category-3 tropical cyclone Hato were comprehensively investigated compared to traditional studies of the direct destructiveness of TCs that have made landfall. The direct destructiveness, economic losses, and casualties of Hato in Hong Kong, Macau, and Zhuhai were reported on by the media and the government. However, the potential hazards of high temperatures and air quality deterioration before a TC’s landfall should not be disregarded. In this study, the environmental and societal impacts of Hato during the period 20 August 2017 to 23 August 2017 was found to have three components: direct destructiveness, extreme temperatures, and pollution episodes. Direct destructiveness, including high wind intensity, precipitation, and storm surge, caused serious economic loss and casualties in the PRD.
In addition to the direct destructiveness of Hato, the extreme high temperature and pollution episode were observed before Hato’s landfall. Under the influence of Hato’s circulation before its landfall, noticeable temperature increases occurred, from 34.9 °C to 38.4 °C, from 33.4 °C to 36.9 °C, and from 33.1 °C to 38 °C in Shenzhen, Hong Kong, and Macau, respectively, which caused rare and extreme hot weather in the PRD. Moreover, two major pollutants, PM
10 and O
3, showed a prominent increase in Hong Kong. The concentrations rapidly increased on 21 August 2017, during which the pollutant concentrations were 2 times as much as those on the previous day in in Hong Kong. The sinking motion, continental advection and the less cloud cover would be possible factors causing hot weather and pollution episodes before it’s landfall. In fact, Chow et. al. [
10] found that when TC locates at the east of Hong Kong, PM
10 and O
3 would increase. Although the mechanism of high temperature induced by TCs in the PRD is still not clear, we expect that the TC locations and the TC intensities would be highly associated with occurrences of extreme high temperatures and pollution episodes. When a TC at the east of the PRD, it would be able to induce northwesterly, northerly or northeasterly continental flow. Coupled with the sinking motion and less cloud cover, those meteorological conditions would favor high temperature events and pollutions episodes.
This study highlights that the influences of TC Hato on the environment and society are not limited only to the direct destructiveness during landfall, but also leading to the extreme temperature event and the pollution episode before landfall. The detailed mechanism of those hazards associated with TCs in the PRD need to be studied in the future, in order to find out the TC’s properties which favor extreme temperature events and pollution episodes.


