Article

Warm Season Hydroclimatic Variability and Change in the Appalachian Region of the Southeastern U.S. from 1950 to 2018

Department of Geography and Planning, Appalachian State University, Boone, NC 28607, USA
*
Authors to whom correspondence should be addressed.
Atmosphere 2019, 10(5), 289; https://doi.org/10.3390/atmos10050289
Submission received: 26 April 2019 / Revised: 16 May 2019 / Accepted: 22 May 2019 / Published: 24 May 2019

Abstract

:
The hydroclimatology of the southeastern U.S. is changing, with increased precipitation, intensified summer-to-fall rainfall, and prolonged dry periods. However, research has yet to determine whether these trends are present in the southern Appalachian Mountains, which contain the most topographic and hydroclimatic variability across the region and serve as a valuable resource for growing population centers. This study examines warm season hydroclimatic variability and changes from 1950 to 2018 using the Global Historical Climatological Network (GHCN) daily data record. Daily rainfall is classified according to different intensities, ranging from light to heavy, and a Mann-Kendall test is used to determine the trend at each station. Additionally, a Spearman’s rank correlation test is performed to test for significant linkages between precipitation class frequencies and large-scale modes of atmospheric variability (Atlantic Multidecadal Oscillation, Caribbean SST Index, Pacific/North American Pattern). The results suggest that dry days became less common and light precipitation became more common across the southern Appalachian region. Similarly, the length of dry spells became shorter at most elevations. Teleconnection patterns are linked to the variability of precipitation class frequencies, particularly with dry days and light precipitation. In conclusion, this research reveals the unique character of hydroclimatic variability and change across the southern Appalachian region in the context of the broader southeastern U.S.

1. Introduction

The hydroclimatology of mountain regions remains poorly understood, yet it is directly tied to regional water resources, ecosystem services, and the development of water-related natural hazards. While much research has examined the impacts of precipitation extremes, ranging from droughts to floods, putting these events into context with hydroclimatic variability and change remains a challenge [1,2,3,4,5]. The hydroclimate is challenging to study because there are many atmospheric variables, such as humidity, cloud cover, atmospheric pressure, instability, and moisture contributing, which complicates crafting comprehensive generalizations. This is especially true in mountainous regions, where the complexity of terrain-atmospheric interactions is not understood [6]. Provoking these challenges is the lack of long and high temporal coverage climate data in mountainous regions. Weather stations are sparse in the Southern Appalachian Mountains (SAM) region; this limits climate model development and trend detection in this diverse environment [7,8].
Giorgi et al. [4] suggest that the global hydroclimate is intensifying, where extreme precipitation events and elongated dry spells occur in conjunction in select years. Across the southeastern United States (SEUS), warm season (JJA) daily precipitation has intensified since 1900 and annual temperatures have cycled between warming and cooling trends [9]. Research has identified the SEUS as a “warming hole”, causing the region to stand out as an anomaly against larger global trends [9,10]. Previous studies assess the hydroclimate of the SEUS, but it is not clear what change occurs at the daily and regional scale across the SAM and if anomalous precipitation trends exist (Figure 1). Topographic and geographic features, such as slope, aspect, elevation, and exposure are known to play critical roles in the spatial distribution of precipitation events, thus adding regional differences within the SEUS [7,8].
The hydroclimate of the SEUS is changing, with increased precipitation variability and dry spells [2,6,11,12,13,14]. Many changes have occurred during the warm season. Ford and Labosier [15] identified greater precipitation variability. Some observed an increase in the duration and frequency of dry periods along with an increase in heavy and extreme precipitation events, resulting in increased precipitation totals [2,16,17]. Droughts are becoming longer during the SEUS warm season, though multi-decadal droughts and drought persistence are low in the region [12,18]. Seager et al. [11] identified an overall increase in warm season precipitation totals. Although Kunkel et al. [12] and Bishop et al. [19] stated that the regional precipitation has not changed significantly, they identified a seasonal shift with less summer precipitation and more fall precipitation. Tropical cyclones are also a major driver in the warm season hydroclimate of the SEUS [14].
Among those researching the drivers of the SEUS’s hydroclimate, some identified a link between sea surface temperatures and various climate indices and circulation patterns [13,17,20,21,22,23,24]. Much research has also examined the synoptic-scale circulation patterns that are associated with anomalous warm season precipitation totals [16,17,20]. In general, wet periods across the southeast are tied to the eastward displacement of the North Atlantic Subtropical High, while dry periods are tied to its westward displacement. This suggests that the Pacific North American Index (PNA) and the Bermuda High Index (BHI) are drivers of hydroclimatic variability in the SEUS [13,25,26,27].
While most hydroclimate research within the SEUS has focused on the broad regional scale, fewer studies have examined sub-regional variability and change within the SAM. This mid-latitude mountain region is oriented on a southwest to northeast (SW-NE) axis. It contains the most topographic variability in the SEUS, including the highest terrain east of the Mississippi river, which adds to the complexity of characterizing the regional hydroclimate. Synoptic-scale circulation patterns and orographic lifting govern precipitation variability over the SAM [28]. The SAM’s orientation enhances orographic lifting, since the dominant southeasterly moisture flux around the North Atlantic Subtropical High occurs perpendicular to the terrain with the greatest topographic relief [5,24,28]. In fact, topographic exposure and elevation are associated with precipitation intensity in the region [7,29]. These circulation patterns result in precipitation events that change across the topographic regions of the SAM. Precipitation frequencies within the interior valleys and leeward slopes were lower and thus tied to a limited range of circulation patterns. Conversely, precipitation frequencies at high elevations were less associated with specific circulation patterns [24]. Despite the small body of work that examines the synoptic scale precipitation variability, more research is needed to determine whether there are secular changes to these patterns.
This project incorporates time series analysis and statistical tests to determine whether there are significant differences in the occurrence of daily precipitation intensities, change in dry spell length, and association with atmospheric circulation patterns across the different topographic settings of the SAM in the warm season. This research project is guided by the following research questions:
  • Are there changes to the frequency of the daily precipitation regime within the SAM?
  • If there are significant changes to the region’s hydroclimate, where are these changes taking place?
  • What synoptic circulation patterns are linked to these changes?

2. Data and Methods

2.1. Precipitation Data: Parameter-elevation Regressions on Independent Slopes Model (PRISM)

Daily precipitation estimates (AN81d) from the Parameter-elevation Regressions on Independent Slopes Model (PRISM) are used to characterize the short-term hydroclimate of the SAM during the warm season (JJA) from 2002 to 2018 at the 4 km2 scale. PRISM is a knowledge-based interpolated climate dataset for the conterminous United States [30,31,32,33]. The interpolation routine accounts for precipitation differences across elevation and employs a climatologically aided-interpolation (CAI) to produce daily gridded precipitation estimates. PRISM products are advantageous in areas of high topographic complexity, as the SAM, because interpolated values account for precipitation distribution across elevation and have been used in previous hydroclimate research [14,19,24,29]. Since 2002, CAI also includes gauge-corrected radar observations, which improved the estimate of precipitation in PRISM products.

2.2. Precipitation Data: Global Historical Climatological Network (GHCN)

This study uses precipitation observations from the National Center for Environmental Information’s Global Historical Climate Network (GHCN), which provides access to quality daily precipitation records [34]. Although there are 2984 stations within the network across the SAM, only 159 of them met the criteria that were used in this study (Figure 2). First, stations with at least 90% coverage of observations during the warm season were required in order to ensure stations had a consistent record. Second, we only included operational stations that were currently recording observations at the time of analysis. Finally, as this study assesses recent trends in precipitation, all stations used in the study began their observational period of record prior to 1950. After screening for these criteria, only two high elevation stations (i.e., >1000 m) remained. In order to increase the observations from the higher terrain, high elevation stations were not screened for current data collection. These exceptions provide 36 additional stations. In total, 195 stations are used in this analysis. These 36 high elevation stations warrant caution in interpreting the results because their data records are shorter, have more missing values, and therefore may bias some of the high elevation results in this study.
Though the GHCN provides a thorough, quality checked precipitation dataset for the United States, mountainous regions are underrepresented with sparse networks, especially the SAM. The lack of long data records hinders our understanding of mountain climatology.

2.3. Data: Climate Indices

Seasonal averages of the Atlantic Multi-decadal Oscillation (AMO), the Pacific/North American Index (PNA), and the Caribbean Index (CAR) are used to characterize the large-scale atmospheric circulation patterns that are tied to precipitation in the SAM. Each of the indices were collected from the National Oceanic and Atmospheric Administration (NOAA) Physical Sciences Division of the Earth Systems Research Laboratory (ESRL) [35].
First, the Pacific/North American (PNA) pattern is an extratropical, northern hemisphere teleconnection that strongly influences interannual climatic variability in North America [25,36]. Some have reported that the positive mode of the PNA is associated with enhanced ridges near Hawaii and the west coast of North America, a deeper Aleutian Low, and resultant deep troughs in the SEUS, which are tied to increased precipitation [1,37,38]. Negative geopotential height anomalies over western North America and positive anomalies over the North Pacific and SEUS are associated with the reverse mode of the PNA, which are tied to decreased precipitation [1,25,39]. In this study, a time series of PNA daily averages are used to represent the anomalies of geopotential height fields over the eastern and western United States. Daily values are aggregated to the warm season average for the time of the study, for comparison with indices at the monthly scale.
Second, the AMO time series is used to describe sea surface temperature (SST) anomalies in the North Atlantic between 0° N and 60° N. These anomalies strongly influence daily warm season precipitation totals in North America [40,41,42,43]. The positive AMO anomaly is associated with lower daily precipitation over the United States while the negative anomaly is associated with higher daily precipitation totals [43,44,45]. Monthly AMO index values represent these average SST anomalies. While the AMO describes SST anomalies in the North Atlantic and provides insight into atmosphere-ocean interactions, this index does not represent subsurface temperatures and ocean-driven heat fluxes.
Third, the Caribbean index (CAR) is used in this study to measure SST anomalies within the Caribbean and determine how they are linked with the daily occurrence of precipitation during the warm season. The CAR is a part of the Atlantic Warm Pool (AWP), contributing to the AMO index [46]. These anomalies are calculated from the NOAA Extended Reconstructed Sea Surface Temperature (ERSST) V3b dataset [47].

2.4. Method: Precipitation Classification

This study uses daily precipitation observations from NCEI’s GHCN dataset. As shown in Table 1, precipitation observations are classified into the following event types based on the intensity of daily rainfall (1200 UTC to 1200 UTC) at each station: Dry day (<0.254 mm), light (0.254–6.35 mm), moderate (6.35–25.4 mm), and heavy (>25.4 mm). Regional precipitation varies across the complex topography of the SAM. Orographic lifting mechanisms greatly contribute to the regional variability of precipitation in the SAM. Slope, aspect, elevation, and wind direction are known to play critical roles in the spatial distribution of precipitation in mountainous regions [6,7,48]. These spatial differences are visualized in Figure 3. Precipitation bins capture the distribution of daily precipitation events across elevations within the SAM. Various classifications have been used to capture and describe precipitation differences, and this classification is adapted from Wang et al. 2010 and Sugg and Konrad 2017 [17,24]. The dry day classification includes daily precipitation totals less than 0.254 mm to prevent residual fog at observation stations from qualifying as a day witnessing precipitation.

2.5. Short Term Precipitation Climatology

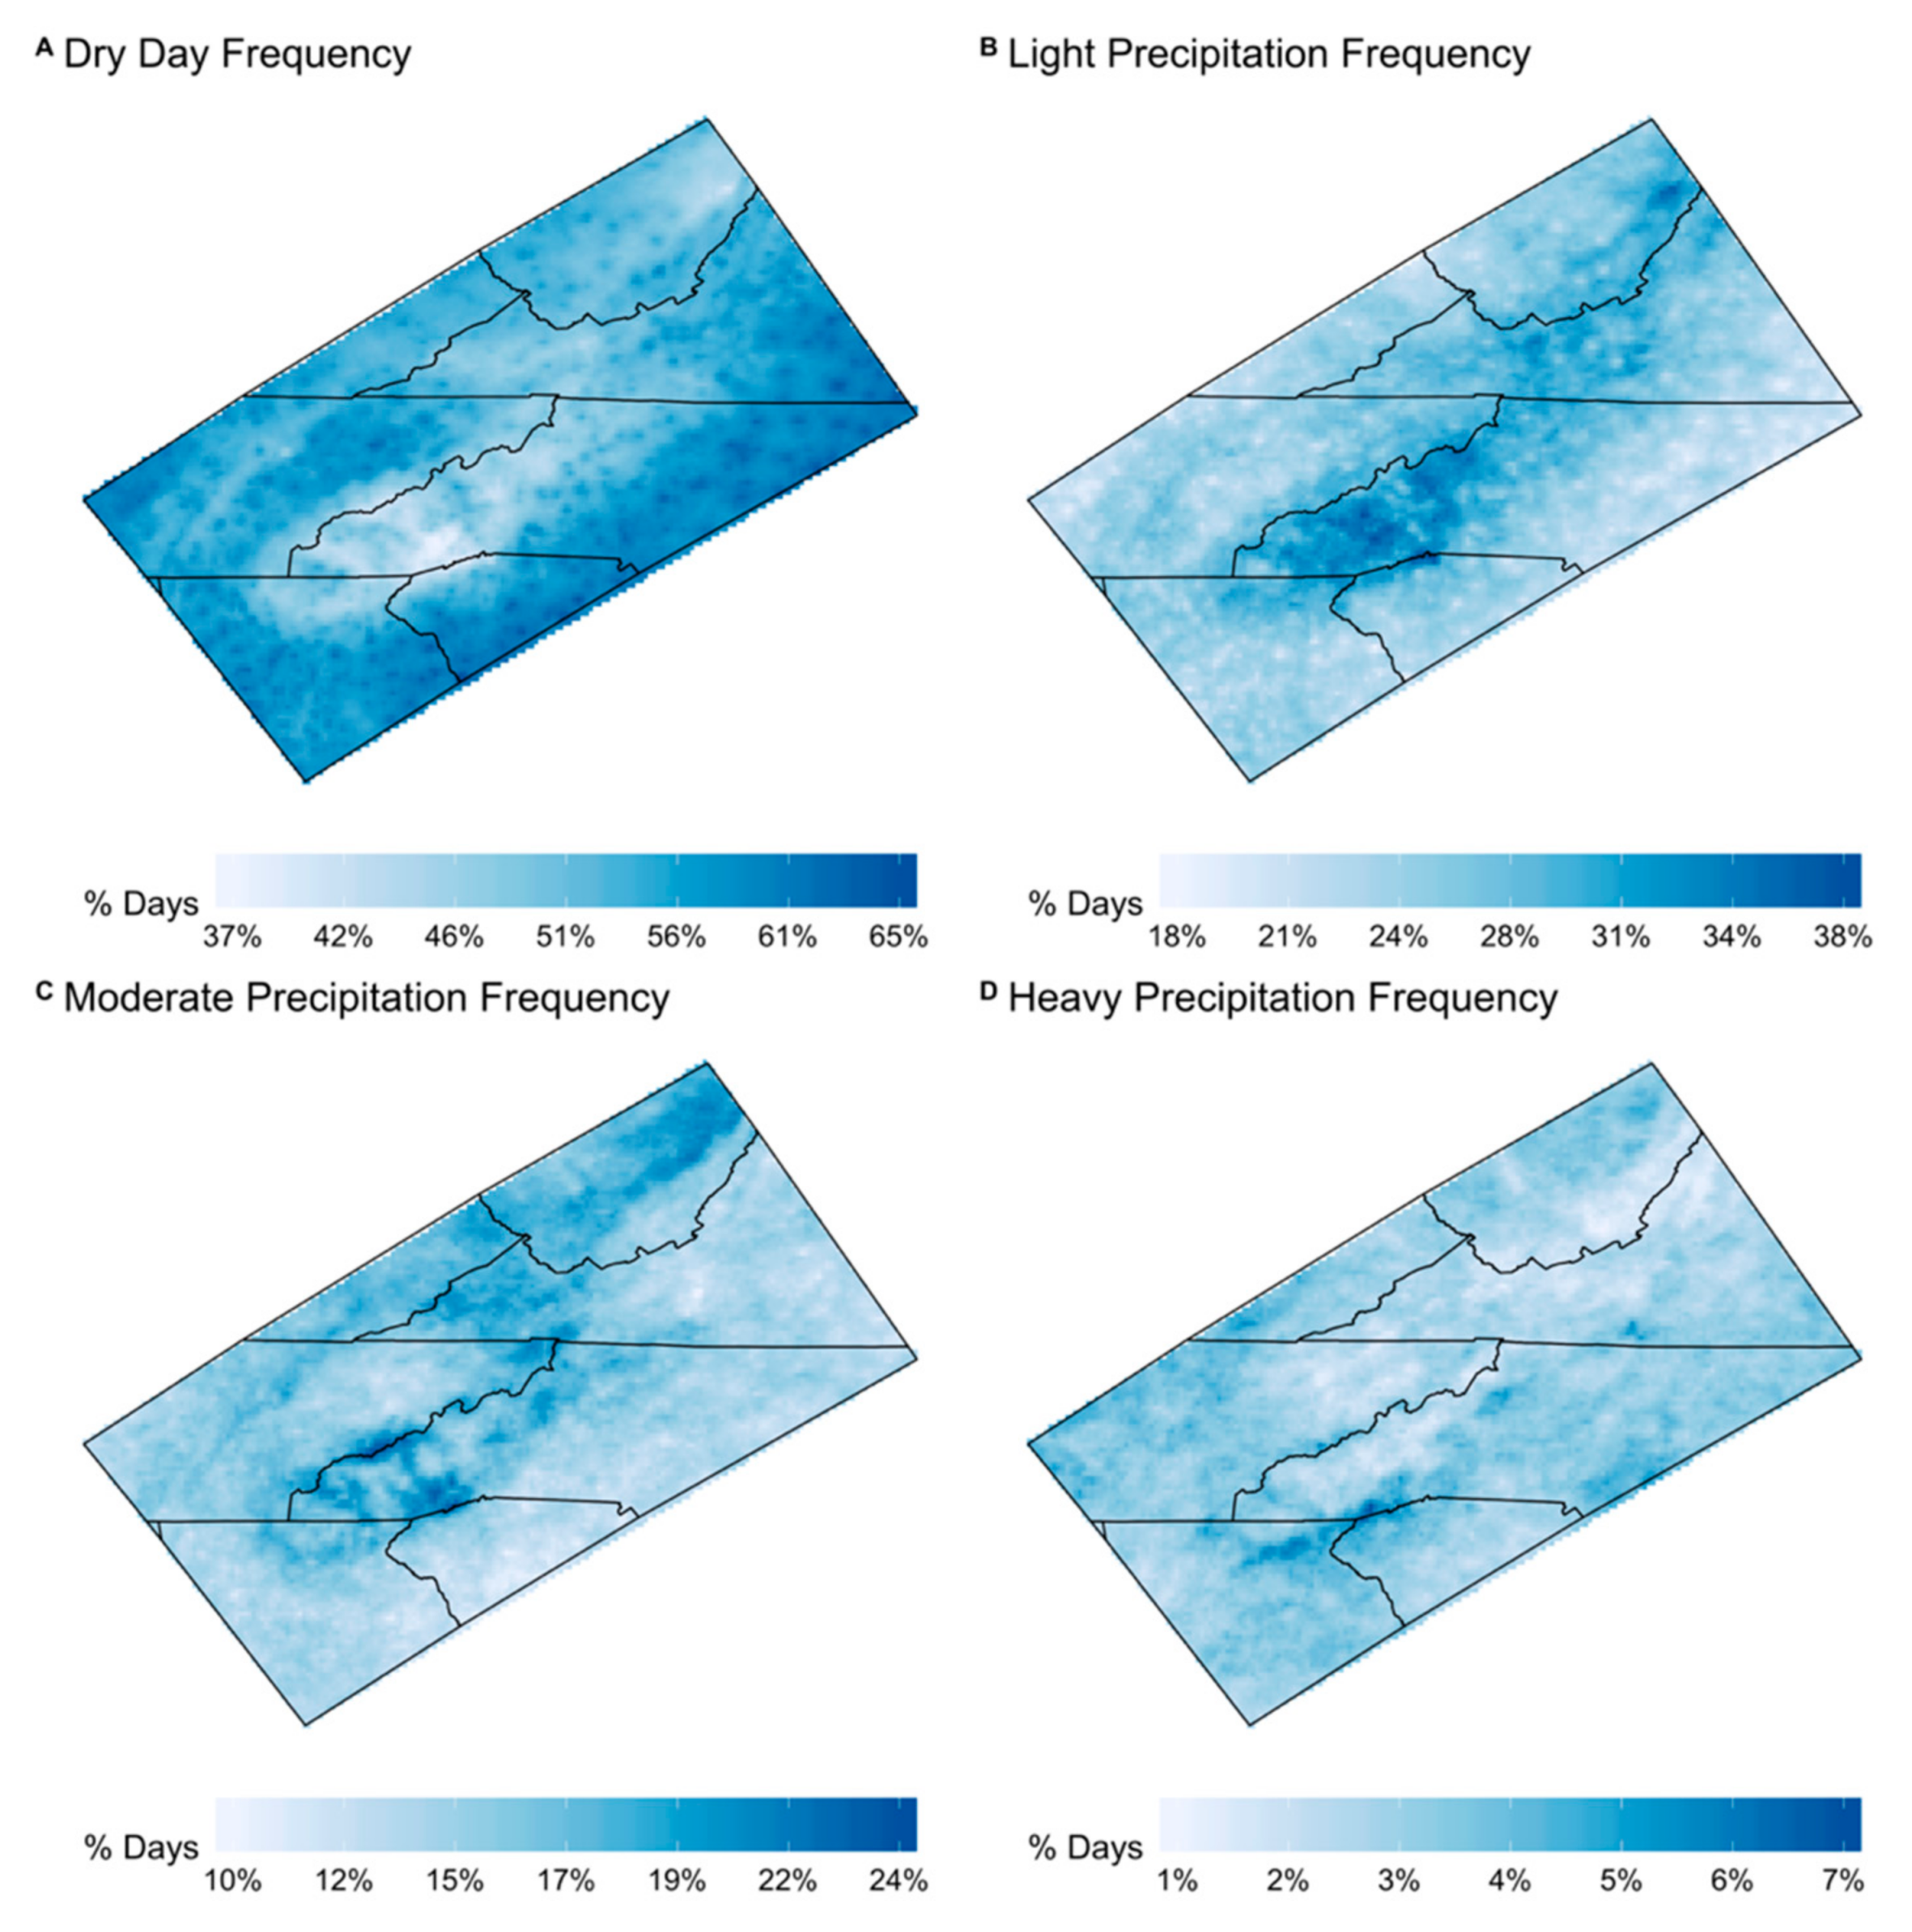
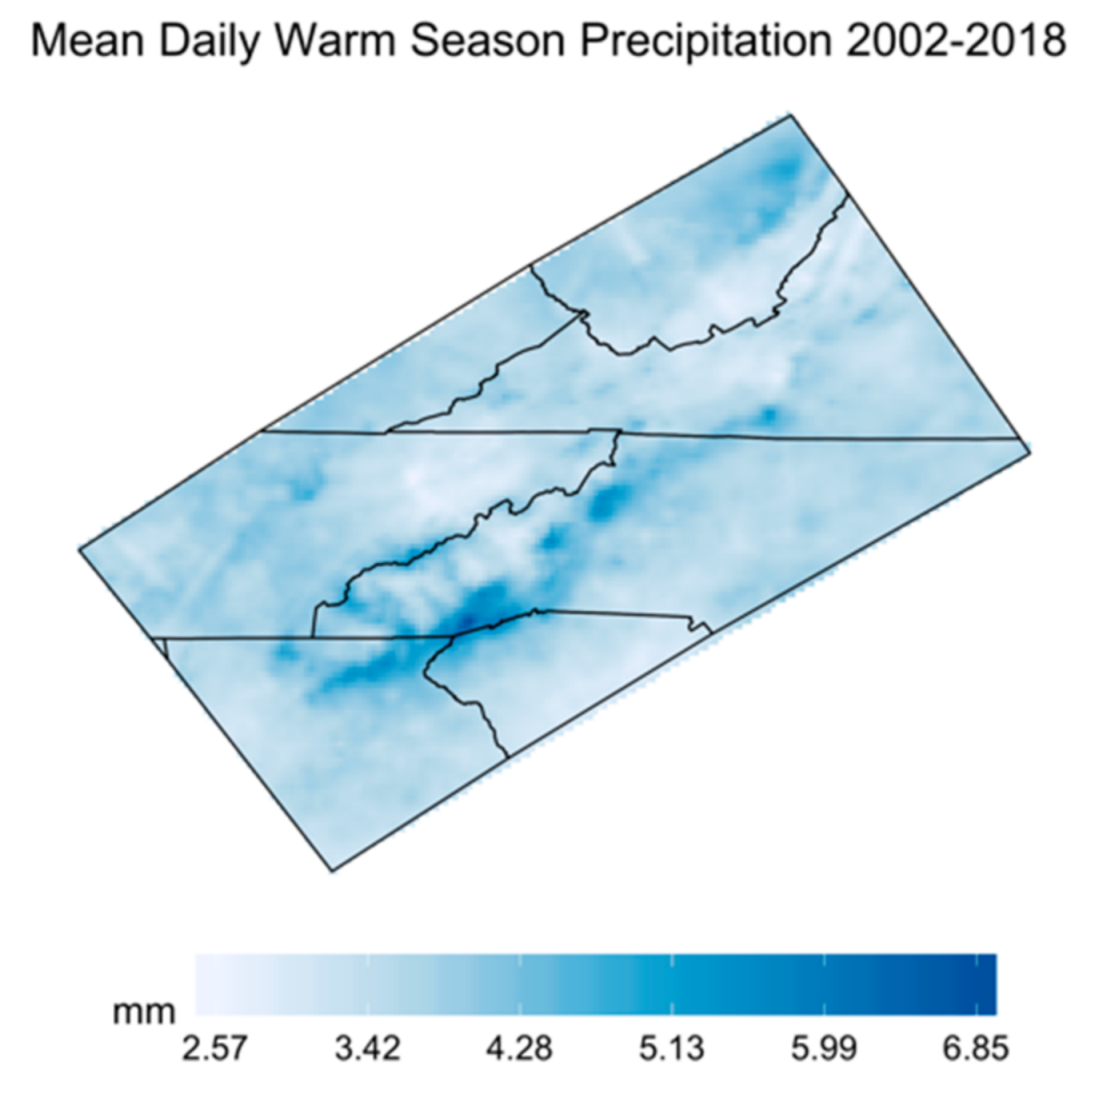
PRISM daily precipitation data in warm seasons from 2002 to 2018 are used to depict the recent hydroclimate of the SAM. Daily precipitation values are classified according to the classes listed in Table 1. Figure 3 visualizes the spatial distribution of precipitation classes across the SAM. Dry days are least common in the southern Appalachian Mountains, are most frequent at lower elevations, and occur between 40% and 65% of warm season days. Light precipitation is most frequent in the high elevations and occurs between 20% and 35% of warm season days. Moderate precipitation follows a similar distribution to light precipitation, yet is less pronounced. Moderate precipitation occurs between 12% and 24% of warm season days. Heavy precipitation occurs most frequently along the Blue ridge escarpment with between 2% and 7% of warm season days. Each daily precipitation type occurs most frequently in the various topographic regions. Figure 3 shows the distinction between topographical features, namely the Blue Ridge Escarpment and Eastern Piedmont. The Blue Ridge Escarpment is noted by the SW-NE linear region of the highest mean precipitation and by its contrast to the drier Eastern Piedmont. Similarly, western North Carolina observes the highest mean daily precipitation. The highest light and moderate precipitation frequency are distributed across the mid-high elevations of the SAM region. This variation demonstrates the complexity of the SAM’s hydroclimate and the impact topography, slope, and aspect have on the spatial distribution of precipitation in mountainous regions. The lowest frequency of dry days in the SAM is seen homogeneously across the middle and high elevations of the SAM. The highest frequency of heavy precipitation is in the SW facing slopes of the southern North Carolina SAM region. Additionally, these heavy precipitation events characterize the distribution of mean daily precipitation across the region (Figure 4).

2.6. Frequency Analysis using Station Observations

The frequency of precipitation days in the SAM is calculated by classifying each stations’ daily record as a dry day, light, moderate, or heavy precipitation day (Table 1). The frequency of precipitation types is calculated at each station through the study period to characterize the observed precipitation regimes across the SAM. The frequency of these daily precipitation types describes the hydroclimate at a fine scale. Understanding daily precipitation can lead to detecting trends aside from monthly and seasonal precipitation totals. Precipitation extremes, drought and flooding, develop from consecutive days of precipitation types. Detecting trends in the daily hydroclimate can reveal how precipitation patterns change, and how precipitation extremes will develop in the future.
In addition to the occurrence of different daily precipitation events, we examine the occurrence of dry spells at each station in order to better characterize the regional hydroclimate. For this study, dry spells are periods of more than three consecutive days without precipitation. Mean dry spell length (DSL) is calculated as the average length of each warm seasons’ dry spells. DSL provides insight into how the frequency of consecutive dry days and precipitation days are changing. Elongated DSL suggest a more intense hydroclimate, with increased extreme dry periods, while shortened DSL suggest a less intense, mild hydroclimate, with fewer extreme dry periods [4]. Specifically, the warm season hydroclimate of the SAM is dominated by dry day and light precipitation regimes (Figure 3). Analyzing changes to the climatology of daily rainfall is important to understanding how mountainous regions respond to a changing global climate. Climate variability can change the configuration of atmospheric circulation patterns, changing the daily distribution of precipitation events. This perspective can reveal how climatic variability might lead to changed hydroclimates in mountainous regions.

2.7. Trend Analysis: Precipitation and DSL

The Mann-Kendall test is used in this study to determine whether there are changes in the frequency of the different precipitation types across the study period. It is widely used in climatic research to identify monotonic trends [49,50]. Trends are given by the τ statistic, which when positive, indicates a positive trend and when negative indicates a negative trend. Data used in this time series analysis have to meet three assumptions. First, data must be non-parametric. Second, data must not have variation from seasonal differences during data collection. Third, the data are stationary. The temporal distribution of stationary data does not have repeated disturbances, which are uncommon in climate data. We used the Box-Pierce test to determine whether the daily precipitation observations met the assumption of stationarity. Daily data from each station that met these assumptions were classified to detect a change in precipitation regimes.
To further characterize the hydroclimate, the Mann-Kendall test is used to identify any changes to DSL across the region. A DSL longer than three consecutive days is analyzed. These τ statistics are calculated at a confidence level of α = 0.05. These trends show the increasing and decreasing frequency of hydroclimatic regimes. Mann-Kendall’s τ statistics indicate the monotonic trend of the data, where a value of 1 indicates a strong positive trend, a value of 0 indicates no trend, and a value of−1 indicates a strong negative trend. The Mann-Kendall analysis relies on three assumptions, which are detailed in Section 2.9.

2.8. Trend Analysis: Box Pierce Test

Like many climate data, these precipitation data are non-parametric and positively skewed. Precipitation data collected in the warm season does not show seasonal variation, since there is little intra-warm season variation. The Box-Pierce test identified ten GHCN stations that did not meet the assumption of stationarity. Eight of these stations are at high elevations, with no longer than four years of record, but are included in the analysis to retain high elevation station data. Williamsville, VA (500 m) and Mt. Pleasant, NC (225 m) did not meet the assumption of stationarity. These two stations were further explored as examples of non-stationary precipitation data. Higher elevation stations that did not meet the assumption of stationarity are still used in the analysis because of their valuable data, and these two lower elevation stations were removed, since there is an abundance of stations at lower elevations. The Box-Pierce test revealed a p-value of 0.096 for the precipitation data from Williamsville, VA, and a p-value of 0.145 at Mt. Pleasant, NC. Autocorrelation and partial autocorrelation values suggest that a relationship between every twentieth day in the warm season at Williamsville, VA and precipitation might exist. These values also suggest that a relationship between every tenth day in the warm season at Mt. Pleasant, NC and precipitation might exist. One hundred and ninety-five GHCN stations are used in the frequency and correlation analyses.

2.9. Correlation: Spearman’s Rank

Spearman’s rank correlation coefficient is calculated to characterize the association of teleconnection patterns with the SAM hydroclimate [2,19,50,51]. Previous studies have identified climate correlations using Spearman’s rank [20,52]. This non-parametric test is used because some precipitation counts are positively skewed (e.g., moderate and heavy precipitation). These one tailed tests have a confidence level of α = 0.05. Spearman’s ρ is commonly used to determine the strength and direction of two monotonic variables, where a value of 1 indicates a perfect positive linear relationship, a value of 0 indicates no linear relationship, and a value of−1 indicates a perfect negative linear relationship. Annual warm season precipitation type counts are calculated at each station and are then correlated with annual warm season AMO, PNA, and CAR averages. We also calculate the annual warm season mean DSL greater than three days. Testing for correlation with teleconnection fluctuations describe the ties between daily hydroclimate variability and the large-scale atmospheric modes of variability. These correlations suggest how positive and negative modes of the climate indices are linked with the variability of daily precipitation across the SAM.

3. Results

3.1. Mann-Kendall: Precipitation and Dry Spell Length

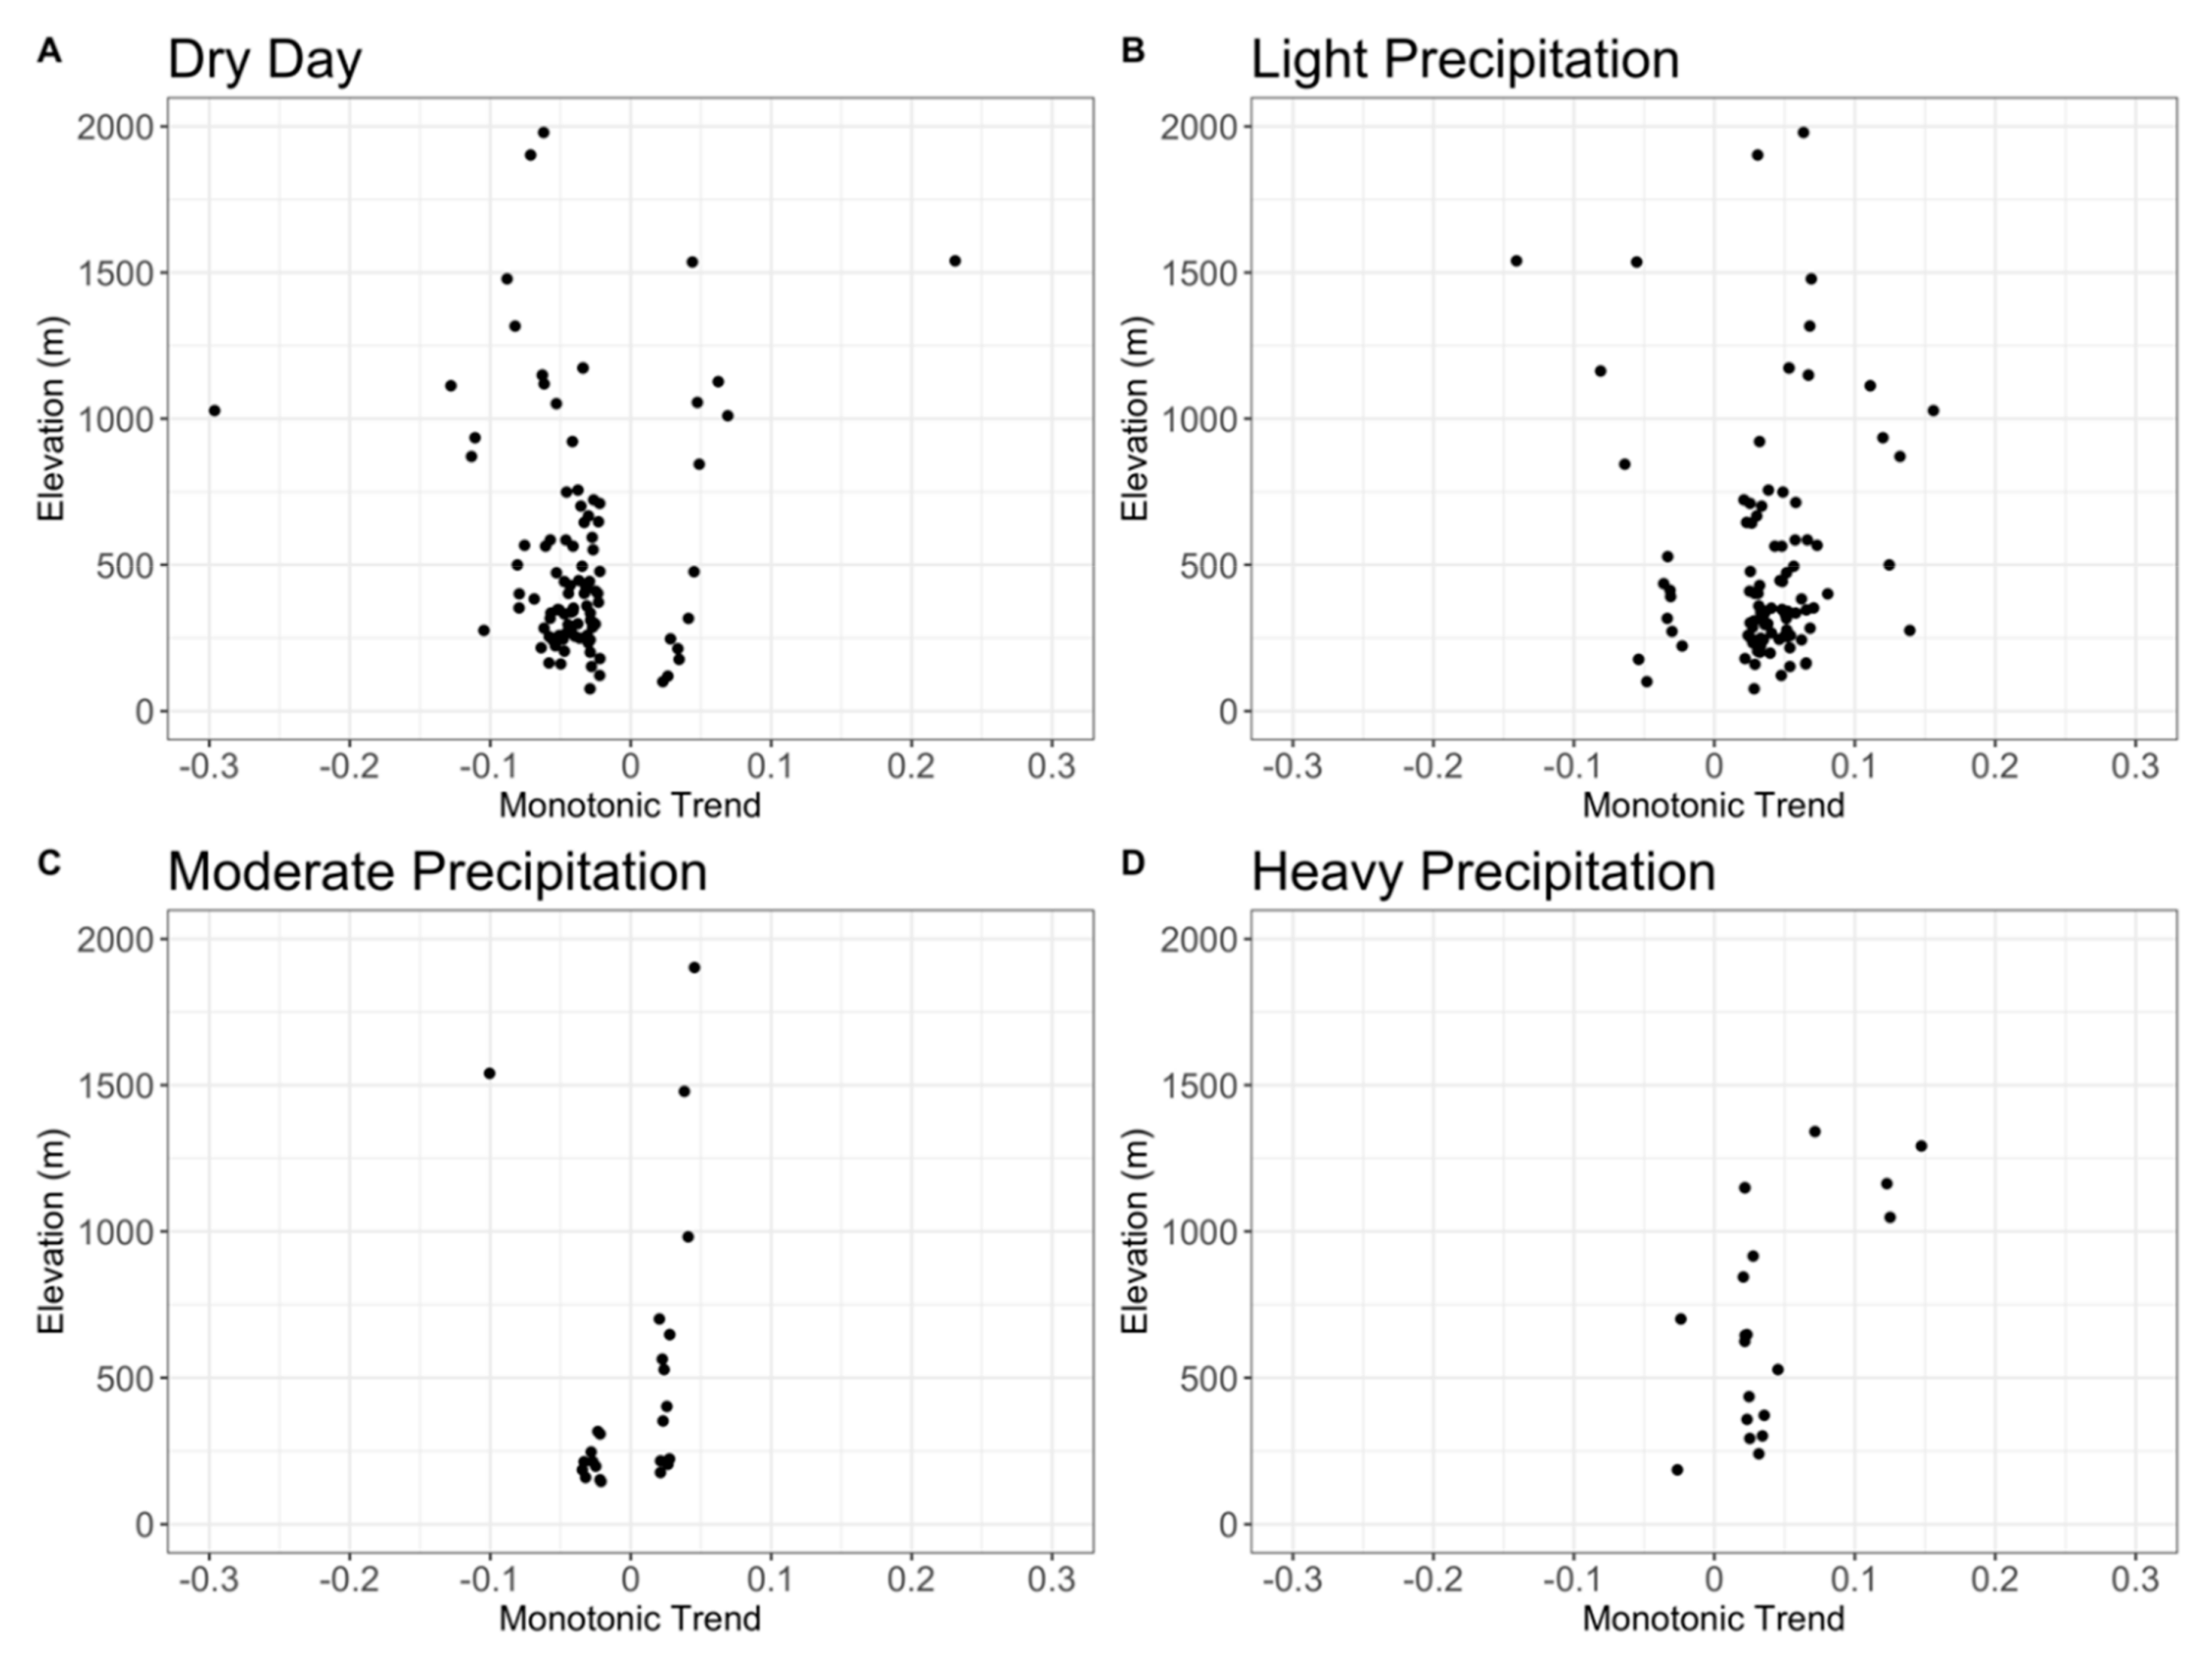
There were several statistically significant changes to the occurrence of the different precipitation event types, which varied according to the elevation and topographic zone (Table 2 and Figure 5). The greatest change occurred in the frequency of dry days, which decreased at a majority of the stations (n = 86) and increased at very few (n = 13). The mean τ statistic for the stations where dry days decreased was −0.050, which indicates a very weak, negative change over the time period. For the few stations in which dry days increased, the change was also very weak, but positive (τ = 0.056). The vast majority of stations (86%) where dry days decreased are situated at lower elevations region-wide (<1000 m). In sum, these results suggest that the hydroclimate of the SAM became slightly wetter over the time period, with fewer individual dry days occurring during the warm season. These results suggest that more days in the warm season have precipitation, not that the precipitation totals have increased. More research is needed to investigate the trends found at high elevation stations given their poor data quality. All results described here and elsewhere are statistically significant ( α = 0.05 ) .
The second greatest change occurred in the frequency of light precipitation. In contrast, light precipitation decreased at very few stations (n = 13) and increased at the majority of stations (n = 84). The mean τ statistic for the stations where light precipitation decreased was −0.051, which indicates a very weak, negative change over the time period. The mean τ of increasing light precipitation frequencies was 0.050, which indicates a very weak, positive change. Most stations (88.1%) where light precipitation frequencies increased are located at lower elevations across the region. These results suggest that the hydroclimate of the SAM at lower elevations became wetter due to increased daily light precipitation frequency.
Moderate and heavy precipitation occurs least frequently across the SAM. However, changes to these precipitation events were different than the dry precipitation regime and similar to the light precipitation regime because their frequency of occurrence increased at a majority of stations (n = 13 and n = 18, respectively) rather than decreased. The mean τ statistic for the stations where moderate and heavy precipitation increased was 0.028 and 0.048 respectively, which indicates a very weak, yet positive change over the time period. In addition, the greatest increases in heavy precipitation frequency occurred at high elevations (>1000 m), which suggests that these event types may be becoming more common across the ridgelines and mountain tops across the SAM.
DSL frequency both significantly increased and decreased at stations across the SAM, depending on location. The frequency of dry spells greater than three consecutive days significantly decreased at 31 stations and increased at two stations. The mean τ of decreasing DSL frequencies is −0.099, which indicates a very weak, negative change. The mean τ of increasing DSL frequencies is 0.1723, which indicates a weak, positive change. A majority (n = 31) of trends are negative, with very few (n = 2) being positive. Changes to DSL suggest that there are fewer days without precipitation.

3.2. Spearman’s Rank: Climate Correlation

Annual warm season hydroclimatic variability is significantly correlated with AMO, PNA, and CAR variability in some stations across the SAM. This correlation is present at all elevations, though most commonly below 500 m. The spatial distribution of GHCN stations limits our coverage of the high elevations. This data set provides more data records from lower elevations and the results do not adequately cover all of the SAM, particularly the high elevations. The following paragraphs describe the results of the Spearman’s rank test and are organized by teleconnection pattern. These results are also summarized in Table 3, Table 4, and Table 5 for the AMO, CAR, and PNA respectively.
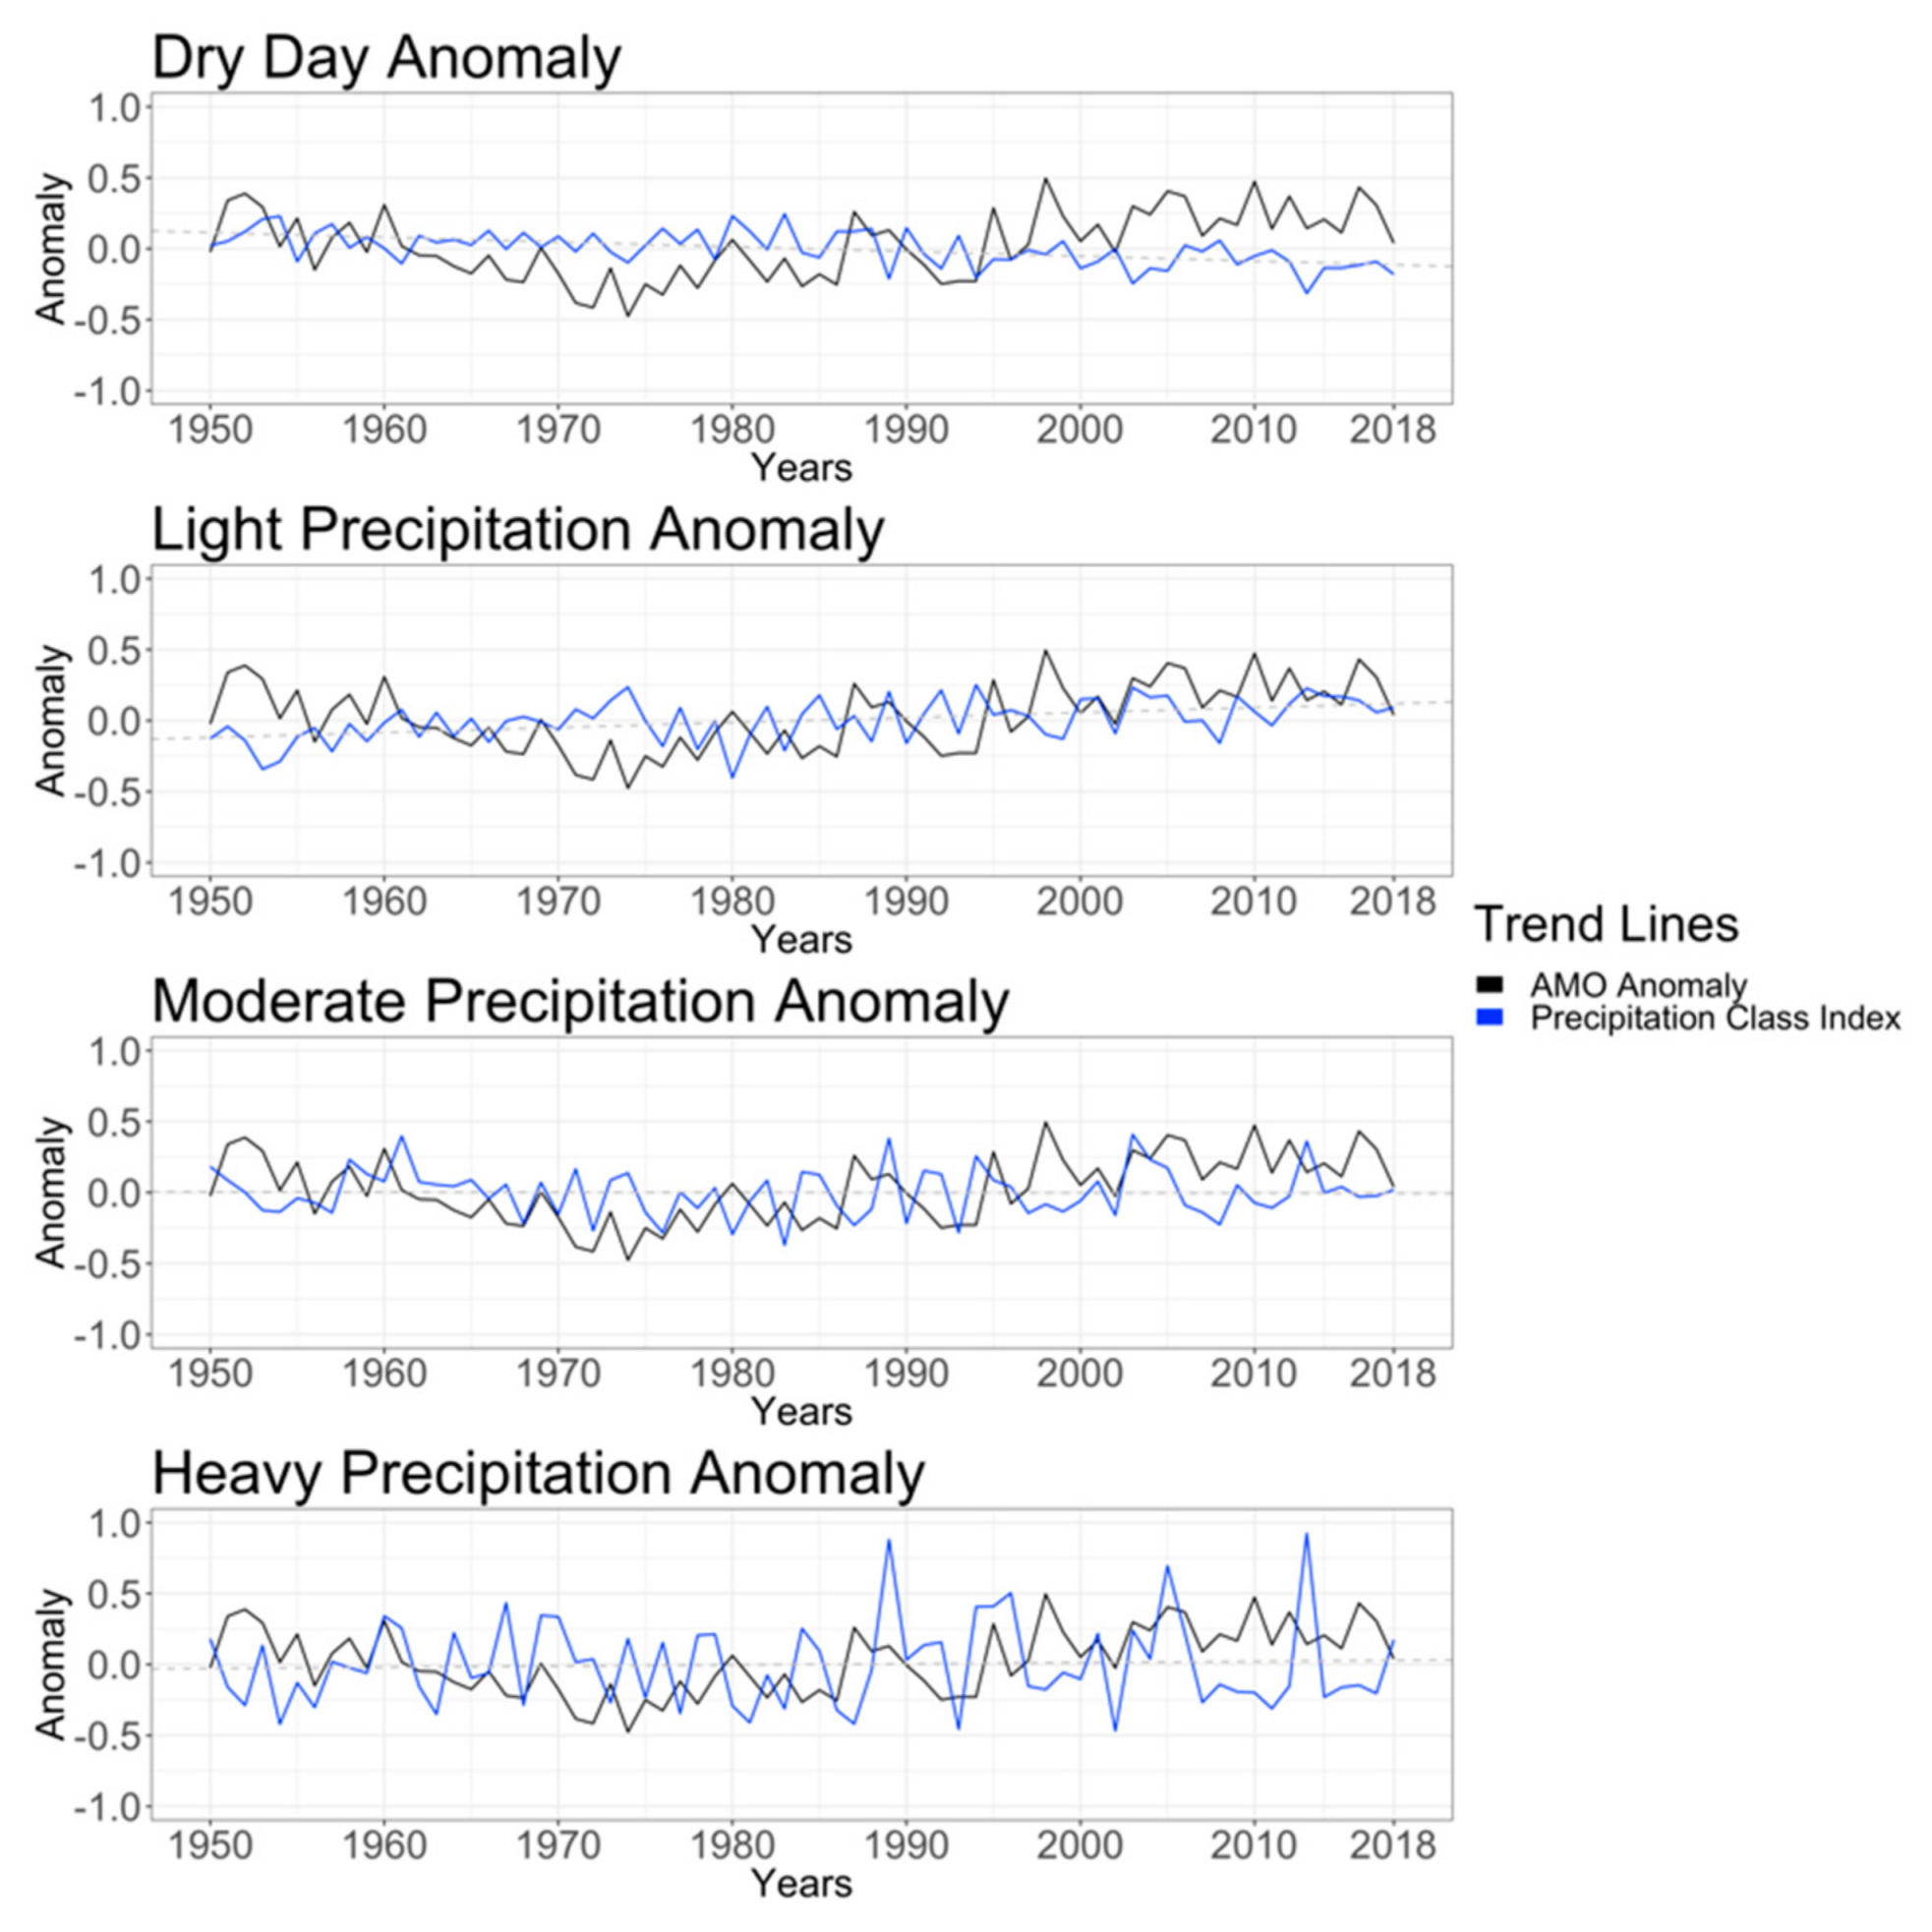
From 1950 to 2018 the AMO has increased (R = 0.34) (Figure 6). Warm season AMO variability is significantly correlated with precipitation type count variability during the warm season (Figure 7). AMO variability is negatively correlated with warm season dry day counts at 22 stations and is positively correlated at seven stations. AMO variability is negatively correlated with warm season light precipitation counts at 19 stations and is positively correlated at 20 stations. AMO variability is negatively correlated with warm season moderate precipitation counts at six stations and is positively correlated at four stations. AMO variability is negatively correlated with heavy precipitation at three stations and is positively correlated at five stations. Lastly, DSL is negatively correlated with the AMO at 13 stations, with a mean ρ value of −0.349, and is positively correlated at five stations, with a ρ value of 0.455.
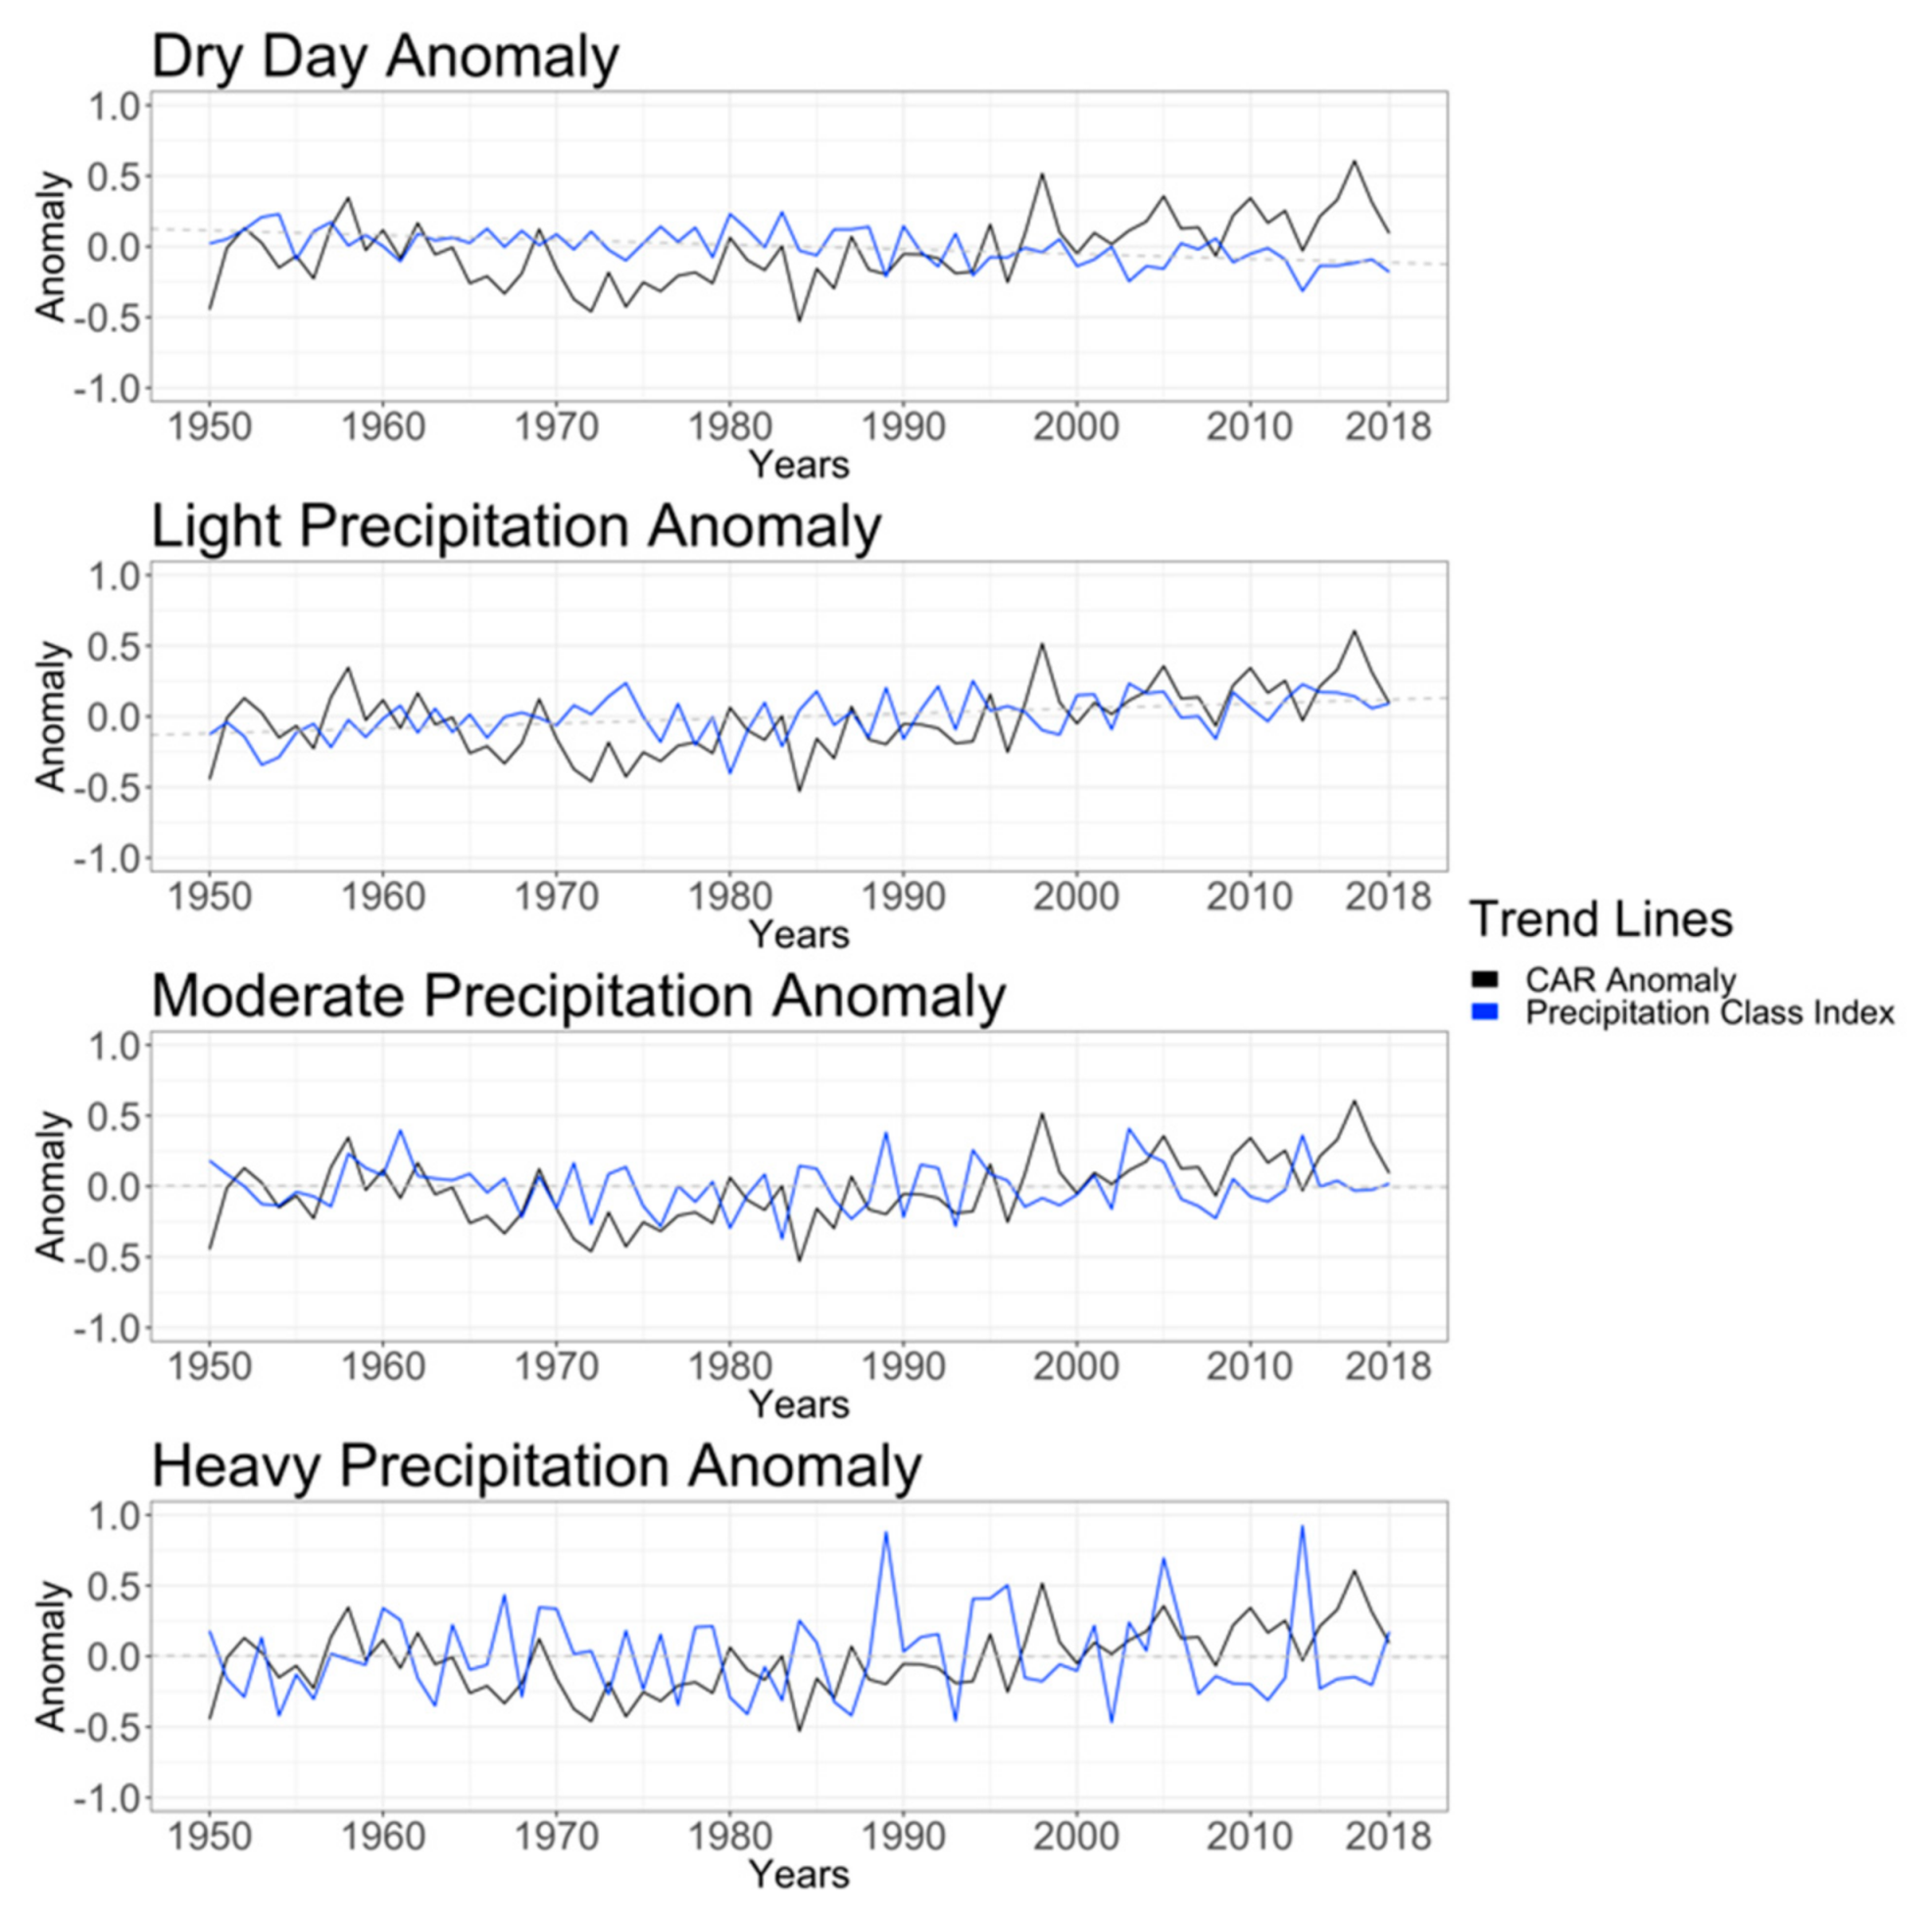
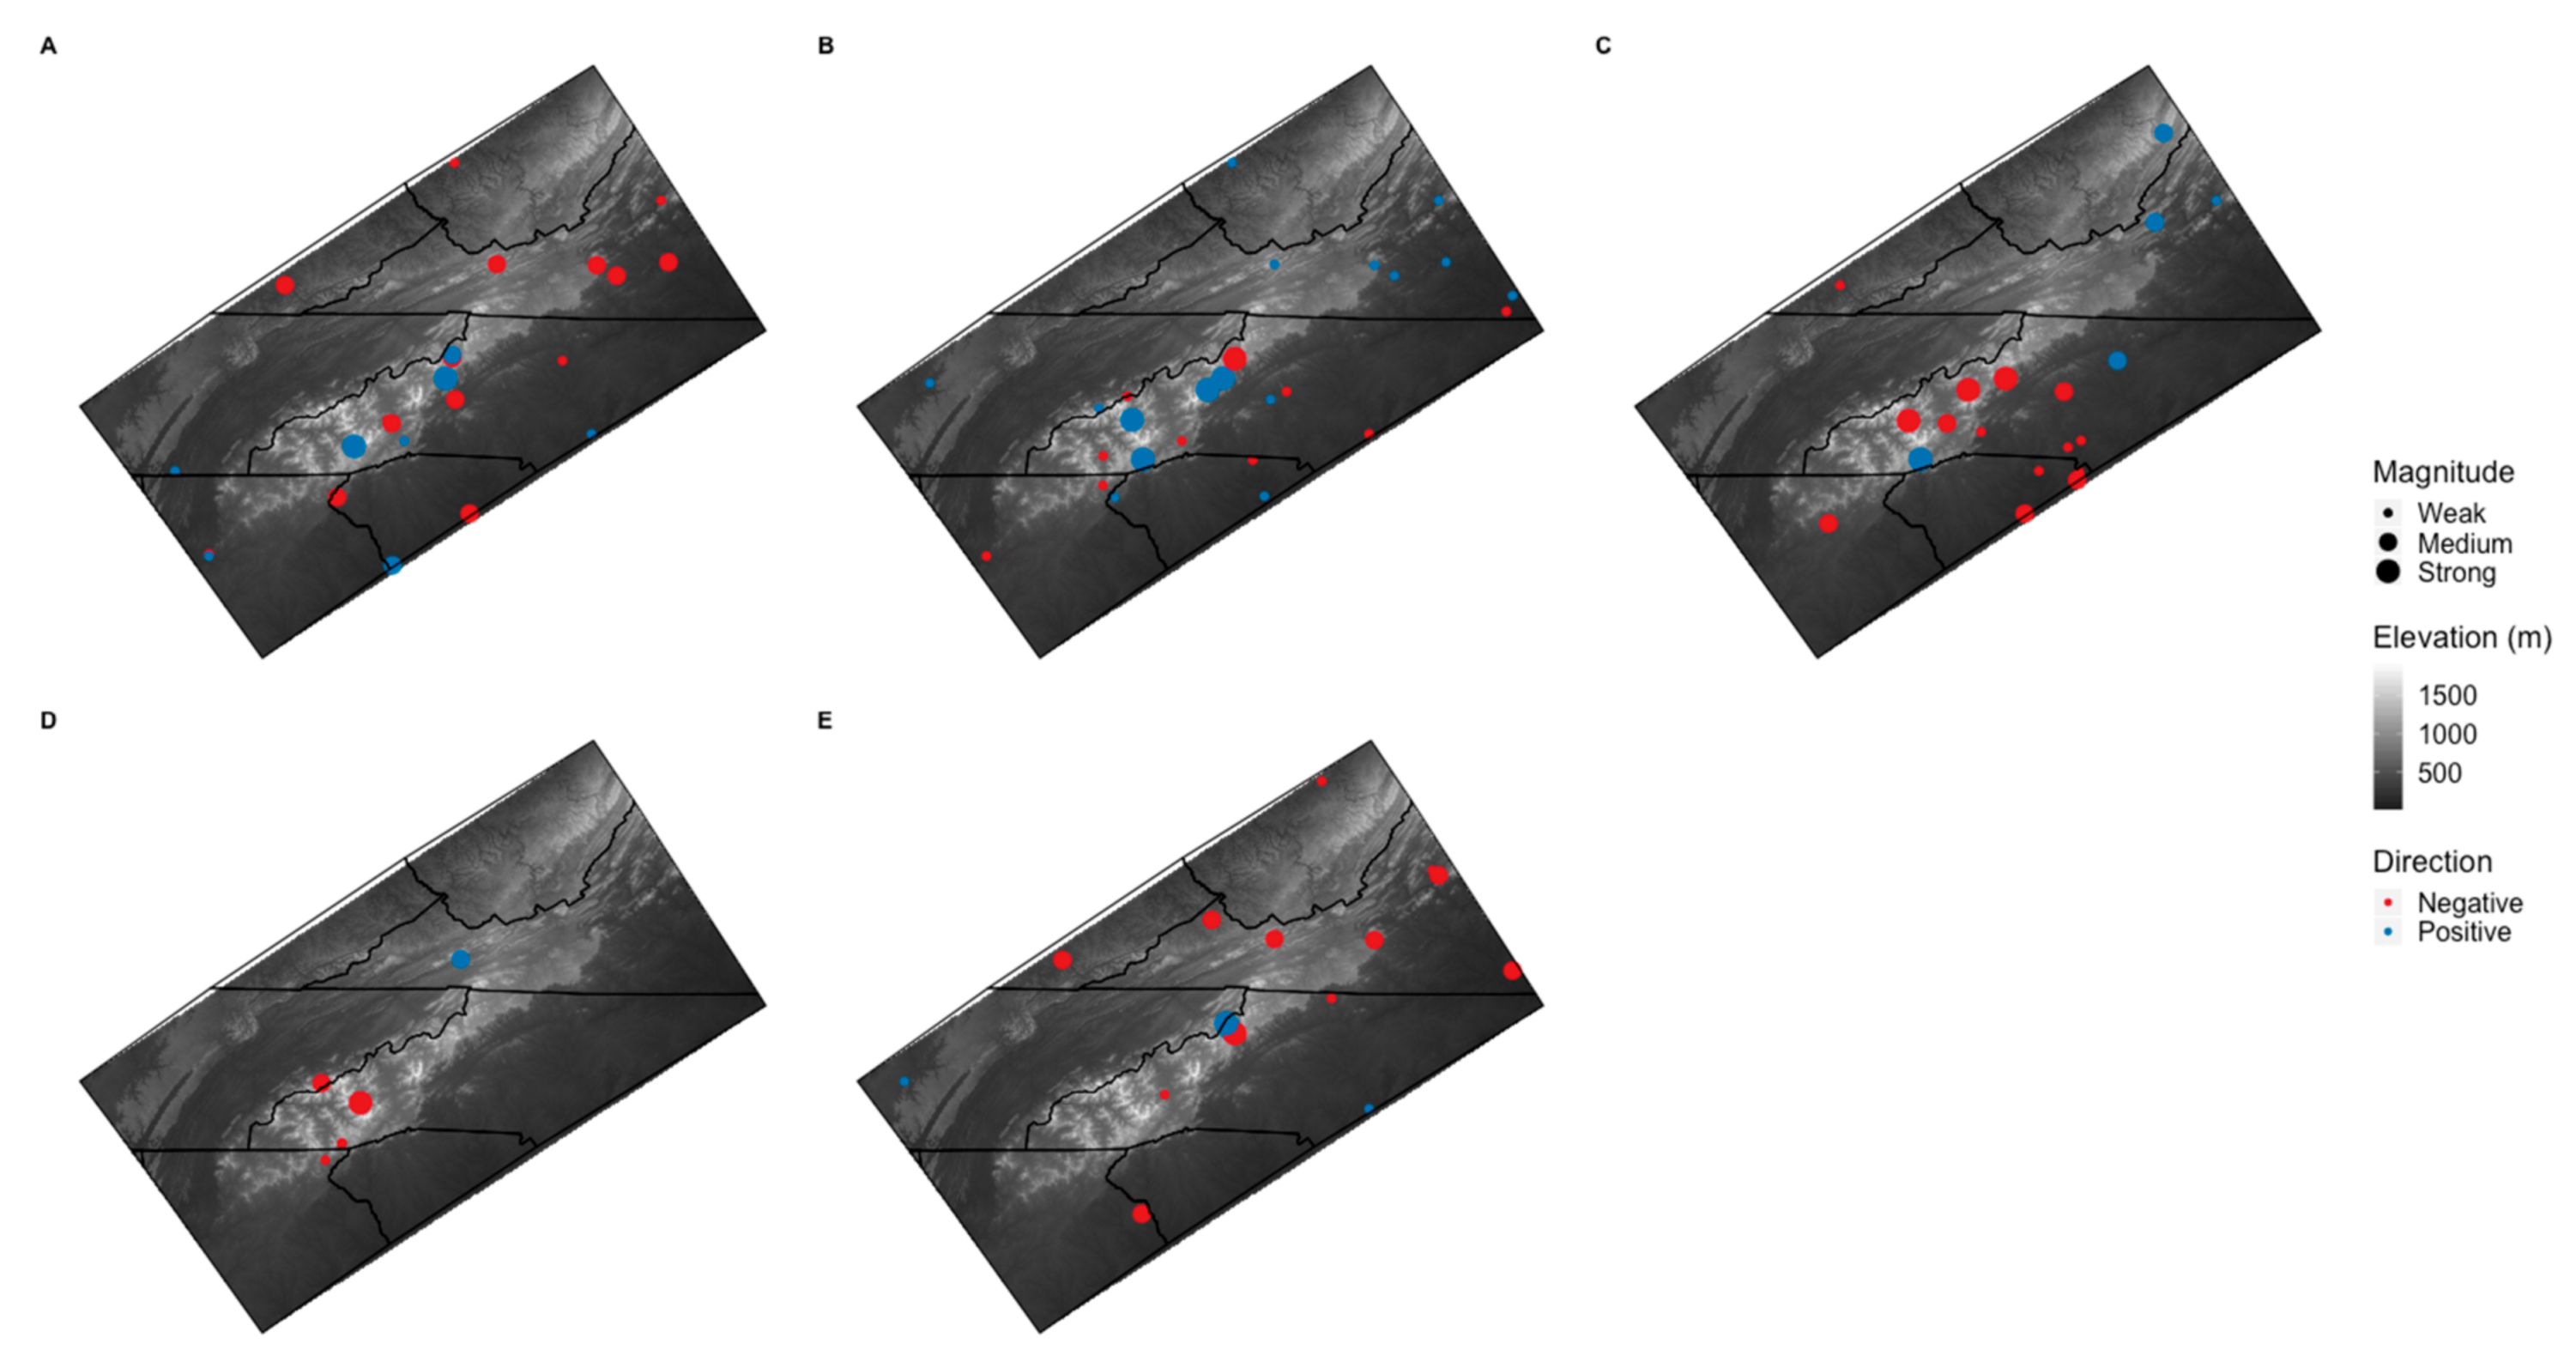
The CAR increased from 1950 to 2018 (R = 0.46) more than the AMO and PNA (Figure 8). Warm season CAR variability is significantly correlated with precipitation type count variability during the warm season (Figure 9). CAR variability is negatively correlated with warm season dry day counts at 16 stations and is positively correlated at eight stations. CAR variability is negatively correlated with warm season light precipitation counts at 18 stations and is positively correlated at 22 stations. CAR variability is negatively correlated with warm season moderate precipitation counts at 14 stations and is positively correlated at five stations. CAR variability is negatively correlated with heavy precipitation at five stations and is positively correlated at one station. Lastly, DSL is negatively correlated with the CAR at 24 stations, with a mean ρ value of −0.393, and is positively correlated at four stations, with a ρ value of 0.469.
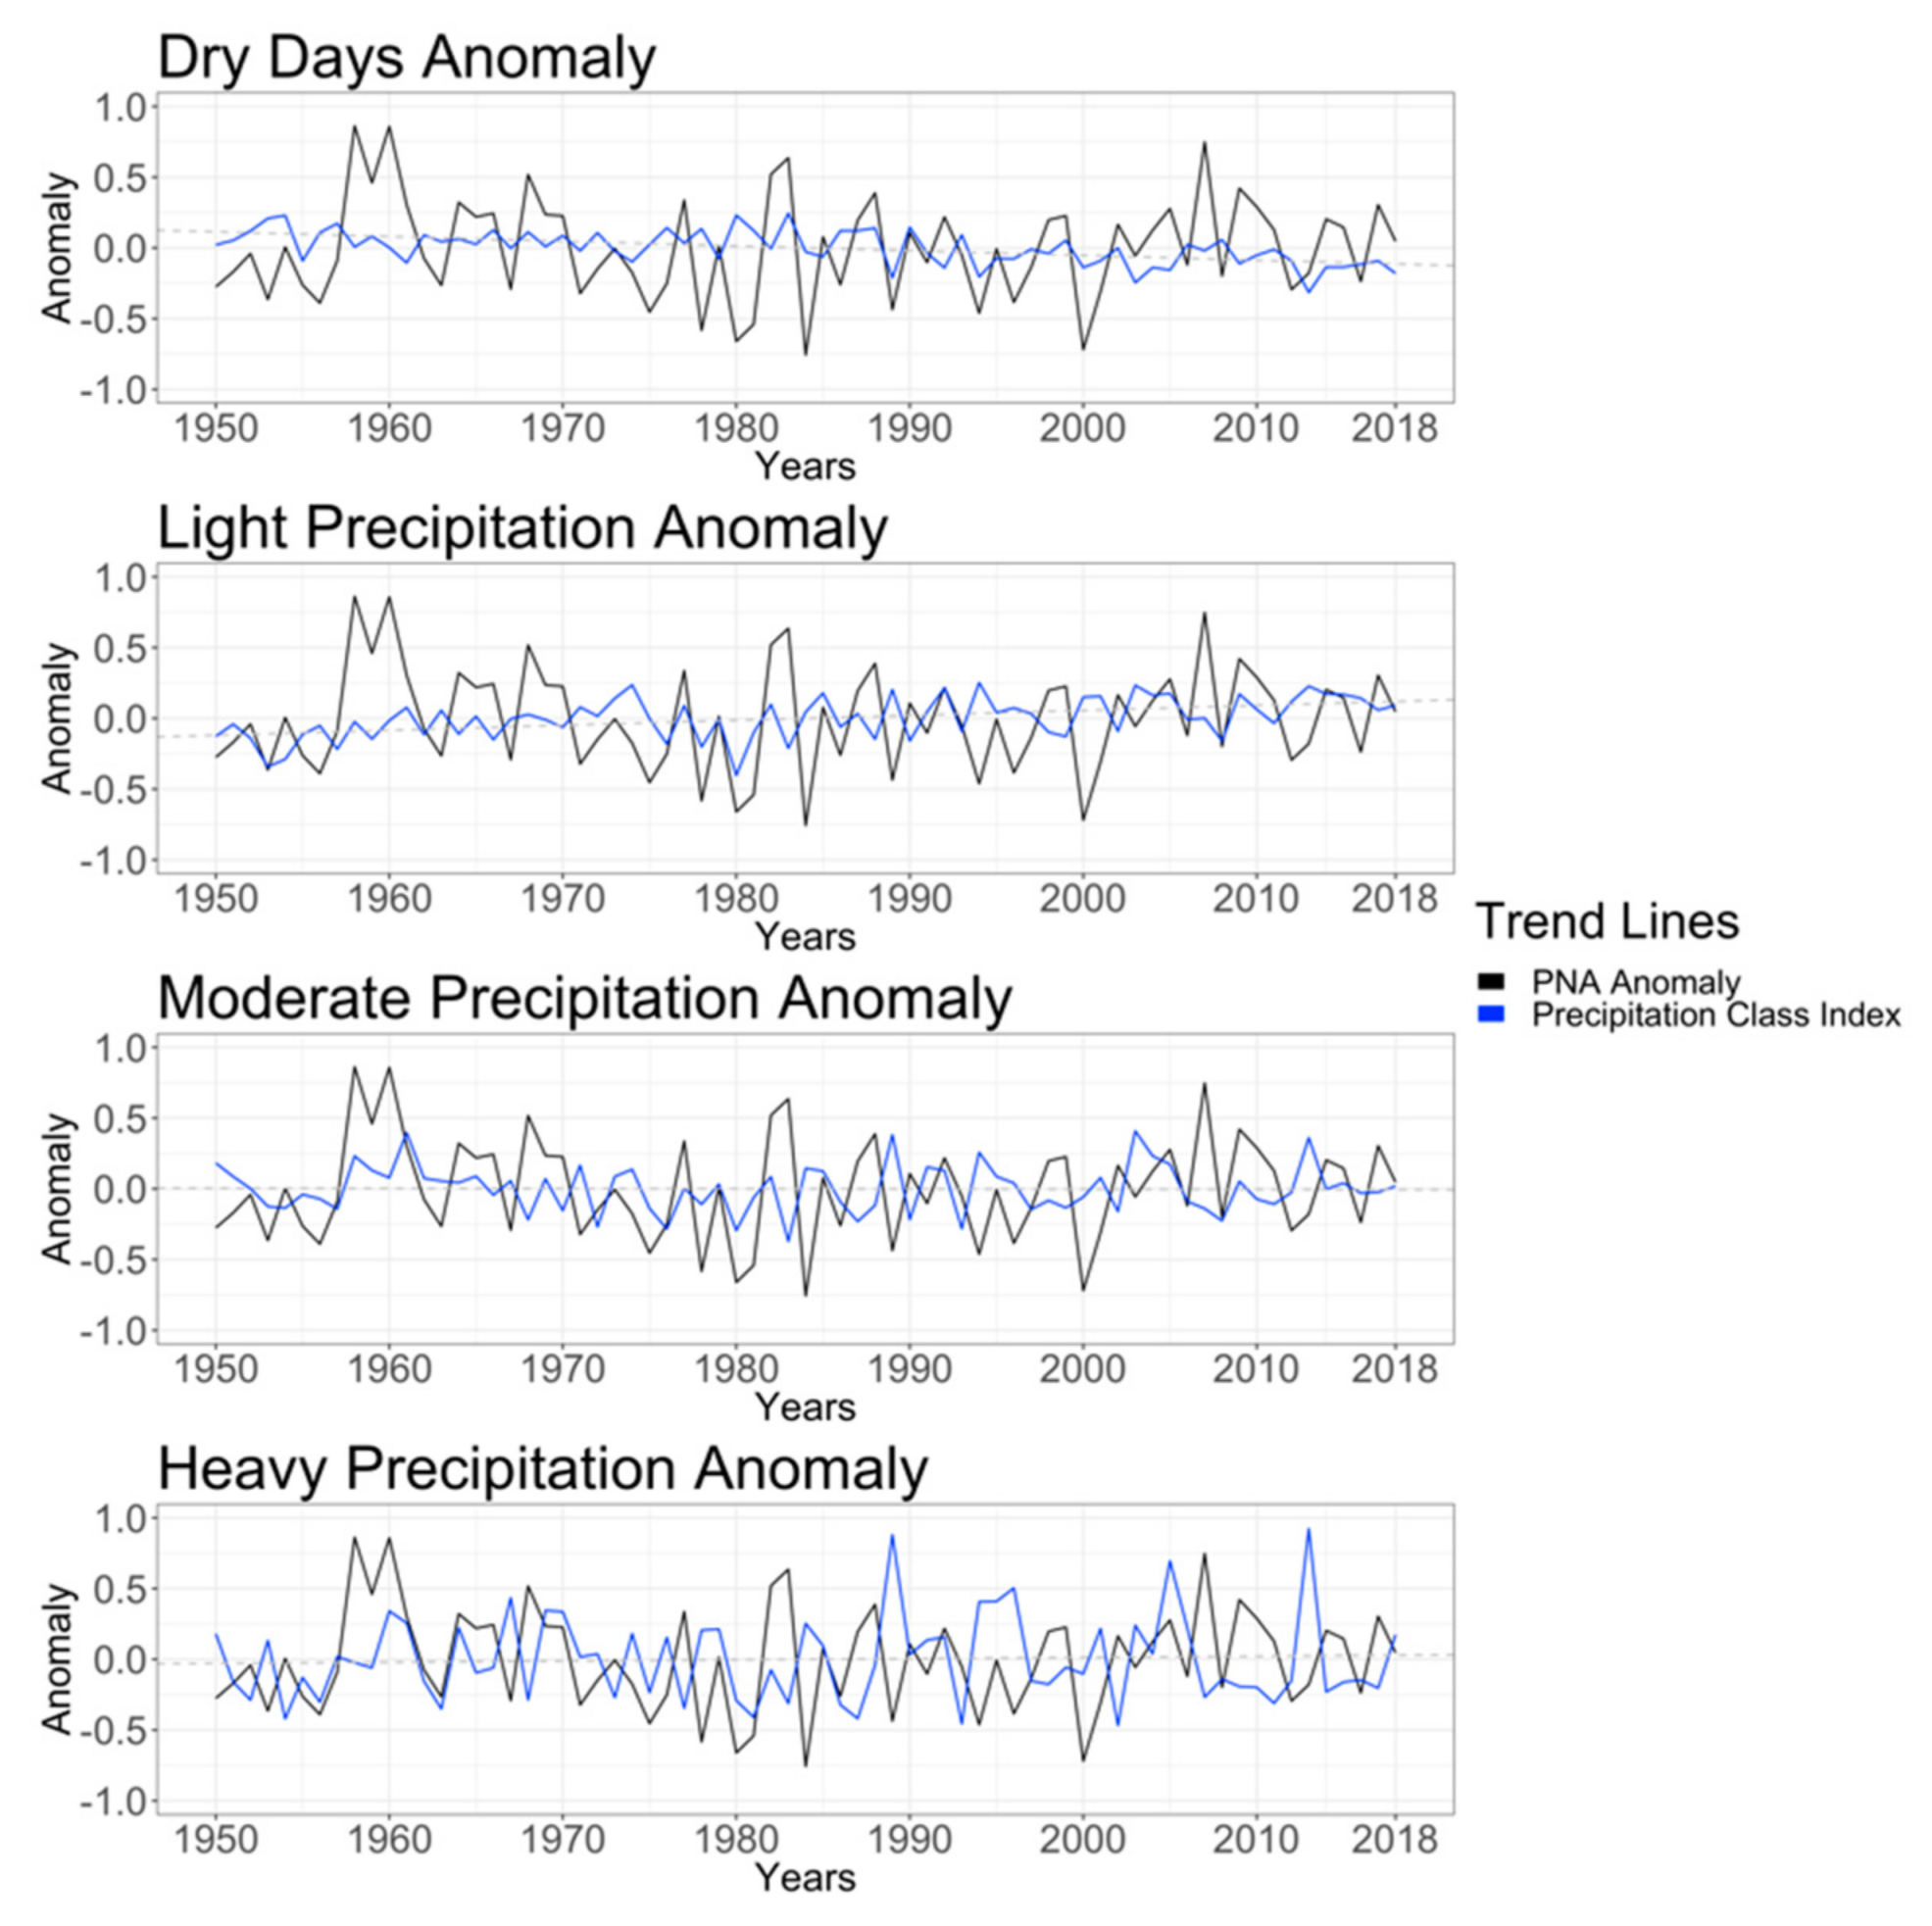
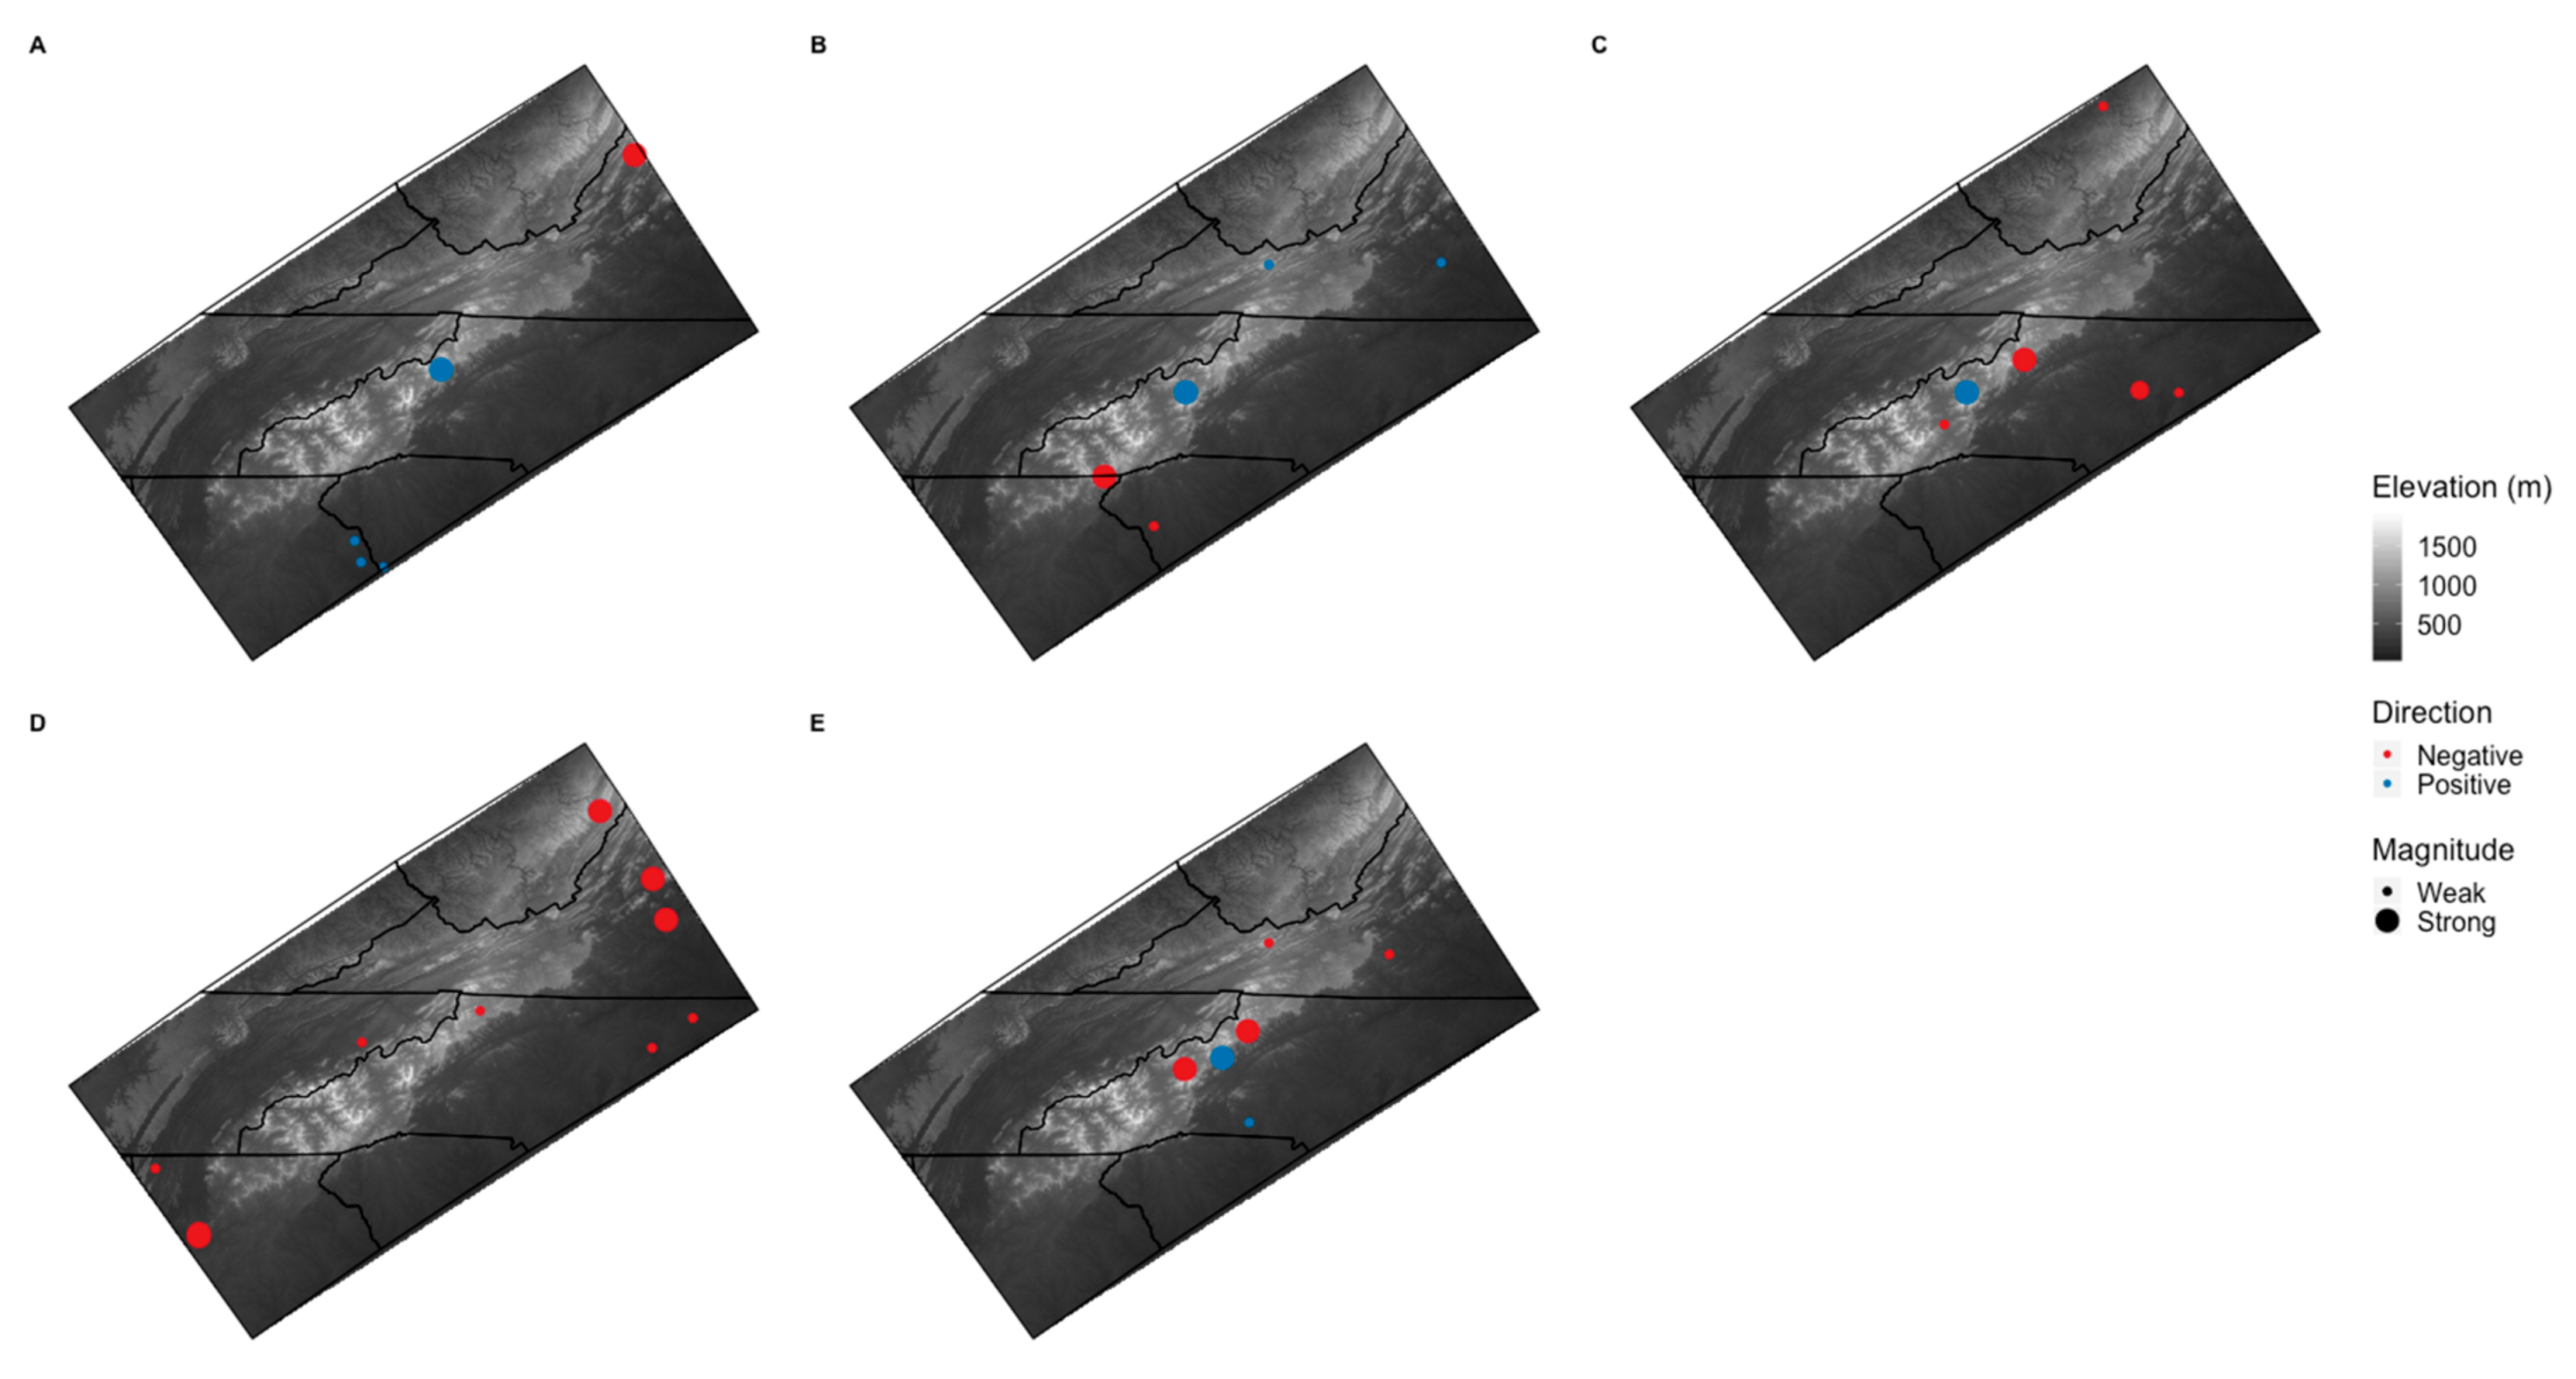
Warm season PNA variability is significantly correlated with precipitation type count variability during the warm season (Figure 10). PNA variability is negatively correlated with warm season dry day counts at one station and is positively correlated at four stations. PNA variability is negatively correlated with warm season light precipitation counts at five stations and is positively correlated at seven stations. PNA variability is negatively correlated with warm season moderate precipitation counts at five stations and is positively correlated at one station. PNA variability is negatively correlated with heavy precipitation at 10 stations and there were no positive correlations. Lastly, DSL is negatively correlated with the PNA at four stations, with a mean ρ value of −0.573, and is positively correlated at two stations, with a ρ value of 0.631. Overall, the PNA gradually increased from 1950 to 2018 (R = 0.017) (Figure 11).

4. Discussion

4.1. Changes to Precipitation Classes and Dry Spell Frequency

Significant changes to precipitation class frequencies from 1950 to 2018 show that the warm season hydroclimate of the SAM region became more mild, as the increase in light precipitation more common and DSL decreased, not following the trend of hydroclimatic intensification in the broader SEUS [17,21,53]. The occurrence of dry days and dry spells became less frequent and the occurrence of light precipitation became more frequent. Moderate and heavy precipitation became more frequent, though not at the magnitude of dry days and light precipitation. Changed frequencies occurred at all elevations. The spatial distribution of increasing and decreasing trends are not homogenous across the SAM, suggesting high regional variability.
These trends do indicate a changed hydroclimate, albeit with fewer dry days, DSL, and more days with light precipitation during the warm season. These results offer some contrast with previous work in the SEUS. For example, the 2014 National Climate Assessment shows that heavy precipitation events have become more common across the continental United States over the past century [9]. Groisman and Knight [2] also found that dry spells greater than one month became more common over the past 40 years in the SEUS. These increased frequencies of hydroclimate extremes characterize a large-scale trend but may misrepresent the changing character of this mountainous region within the SEUS. Our findings, which show subtle, weak changes in frequency suggest that the hydroclimate of the SAM gradually changed over the study period, leading to a slightly wetter warm season in this mountainous region. Additionally, the slightly increased frequency of heavy precipitation at few stations across the SAM also suggests a hydroclimate milder than previous research suggests is present in the context of the broader SEUS region. The strongest trends to changed precipitation frequencies occurred at high elevation stations (>1000 m), which is a unique setting in the SEUS. Very few hydroclimate studies analyze the topographically and climatologically diverse SAM region apart from the larger SEUS.
While the hydroclimate became more extreme in the lower elevations of the SEUS, the higher elevations may have a different character of change. This finding is supported by Sugg and Konrad [24], who found that light precipitation events occurred greater than 50% of the days at the highest elevations during the warm season, and that these events were tied to a wide range of daily circulation patterns. Wilson and Barros [54] documented a similar pattern, in which light precipitation constitutes 30%–50% of total annual precipitation on the ridgelines of the SAM. The unique spatial-temporal distribution of precipitation change across the SAM is linked with a variety of physical mechanisms that promote orographic precipitation development in mountainous terrain during periods when the lowlands remain dry. These include forced lifting, differential advection, convective currents, and atmospheric stability [6,55]. Although hydroclimate extremes documented in other studies do affect the SAM, we suggest that the near-daily occurrence of showers and thundershowers from convection on mountain slopes influence the change to the light precipitation regime identified in this study. The short-term PRISM precipitation climatology in this study shows that the light precipitation regime is most common along the southeastward facing slopes of the Blue Ridge Escarpment and interior high elevations (Figure 3 and Figure 4). Other areas, like the ridgelines along the North Carolina and Tennessee state border also receive high precipitation frequencies and totals, whereas other sub-regions of the SAM receive lower. More research on the spatial-temporal variability of meteorological variables that influence precipitation development is needed to understand why there are increased frequencies of events in these areas.

4.2. Warm Season Event Counts and Climate Index Correlation

The warm season hydroclimate of the SEUS is strongly linked to various teleconnection patterns (e.g., AMO, CAR, and BHI). This analysis suggests that the PNA has a weak linkage to warm season hydroclimatic variability in the SAM region. This finding is supported by Diem [20], who found insignificant correlations between wet and dry periods and the PNA in the Atlanta region of the SEUS. On the other hand, the AMO and CAR are strongly linked to the changing character of the SAM hydroclimate [17,40,41,43]. The linkage between these teleconnection patterns and the changing frequencies of dry days and days with light precipitation suggest that the circulation character associated with modes of the AMO and CAR influence the daily hydroclimate of the SAM during the warm season, and that the PNA is only loosely connected. Additionally, no clear spatial trend appears to explain the character of these correlations. Teleconnection patterns are discussed in the following paragraphs.
Inter-warm season AMO variability has the most linkages to the variability of dry day counts in the warm season (n = 29) and DSL (n = 18) across the SAM. The variability of moderate and heavy precipitation frequencies and their correlation with the AMO are spatially heterogeneous and few. The AMO anomaly has increased over recent decades (Figure 9). Positive AMO anomalies are associated with lower precipitation totals across the continental U.S [43,44,45], and these results may help explain the increase in light precipitation relative to the moderate and heavy events across the SAM. Figure 6 shows the spatial distribution of these correlations. The strongest correlations occur at the high elevations of the SAM region, with some in the Eastern Piedmont. The positive and negative correlations between the AMO and precipitation classes are not spatially collected. No clear spatial pattern exists, suggesting high spatial variability and the strong influence of local topographic features on the physical mechanisms of rainfall distribution. Some areas are thus sensitive to fluctuations in the large-scale circulation variability that is associated with the different modes of the AMO, however more research is needed to better understand these spatial relationships.
Inter-warm season CAR variability has the most linkages to the variability of light (n = 40) and moderate (n = 19) precipitation in the warm season. The variability of the CAR is similar to AMO variability and exhibits similar trends (i.e., light precipitation (n = 39) and DSL (n = 16)). The CAR is most notably linked to moderate precipitation variability (n = 19), whereas the AMO has few linkages (n = 10). These similar linkages are expected, as the CAR is a contributor to the AMO as it is part of the Atlantic Warm Pool (AWP). The CAR anomaly has increased over recent decades, at a stronger rate than the AMO (Figure 10). Significant trends suggest that light and moderate precipitation in the warm season will become more frequent should the CAR continue to anomalously rise. Similar to the AMO, positive and negative correlations between the CAR and precipitation classes are not spatially clustered, suggesting high regional variability in response to teleconnection patterns. The strongest trends occur in the high elevations of the SAM region and in the Eastern Piedmont stations.
Lastly, inter-warm season PNA variability is most closely linked with heavy precipitation variability (n = 10), and least closely linked (n = 39) with other precipitation types. The spatial distribution of the few significant correlations does not suggest that there are areas of similar regional responses to PNA variability, similar to the relationship between warm season precipitation and the PNA for the Atlanta region of the SEUS that Diem found. The warm season PNA has not significantly changed from 1950 to 2018. These results ultimately suggest that the frequency of heavy precipitation events is not strongly influenced by these teleconnection patterns, since very few stations have significant correlations (n = 24).
The response to global climate change in the SAM region is different than the character of change seen in the SEUS. Physical mechanisms of precipitation distribution are more complex in the SAM than in the lower elevations and more homogenous topographic features of the SEUS. The SEUS is characterized by increasing DSL and more frequent heavy precipitation, suggesting a hydroclimatic intensification over the past century [2,9]. Although the SAM hydroclimate may exhibit some of the broad trends documented across the SEUS, it also unique in that it is characterized by decreasing dry day frequencies and dry spells greater than three days. The occurrence of light precipitation has also increased gradually across the region. These trends, coupled with the lack of increasing heavy precipitation show that the hydroclimate of the SAM became milder, not following the trend of the broader SEUS. Additionally, teleconnection patterns likely influence hydroclimatic trends differently in the SAM than in the SEUS due to the added influence of topographic variability and its interaction with the low level moisture flux from the surface to the middle troposphere. Very few stations have significant correlations between these teleconnection patterns and heavy precipitation variability, whereas these teleconnection patterns are known to have a marked influence of hydroclimatic variability in the SEUS [13,17,20,21,22,23].
There are several limitations of the study that should be addressed when considering the identified trends, as well as considerations for future research. First, long data records, consistent station time observation records, and continual station monitoring are three critical attributes of quality weather data that are rare at high elevation stations. Additionally, the influence of topographic features and micro-climates enhance spatial variability of precipitation events. Future research should invest in improving precipitation modelling in mountainous terrain to reduce limitations brought by data quality and spatial coverage. Second, many studies focusing on the SEUS hydroclimate utilize modeled datasets to detect trends (e.g., References [4,11,21]). This difference between observation station and modelled precipitation data may influence the identified difference in trends. Third, the effects of climatic change are not uniform. As identified in previous literature, the SEUS has seen an intensification of hydroclimatic extremes, some events occurring in the SAM region. According to the 2014 National Climate Assessment [9], extreme precipitation events became 27% more frequent in the SEUS and 71% more frequent from 1958 to 2012. These changes are greater than those of the western and intermountain region of the U.S. The results of this study suggest that the most significant change occurs to the dry day, DSL, and light precipitation regimes.

5. Conclusions

This study analyzed the change of the SAM warm season hydroclimate and describes the change in relation to teleconnection patterns across elevation over the past 68 years using observation data. Our results show that the SAM may exhibit a different response when compared to the larger SEUS. Rather than hydroclimatic extremes becoming more frequent, the SAM has experienced a milder hydroclimate, with fewer dry spells and more light rainfall events. These results are in contrast to the SEUS, where dry spells and heavy rainfall are becoming more common. This study also suggests that change to daily precipitation in the warm season is influenced by the AMO and CAR teleconnection patterns though no clear spatial pattern exists, the strongest trends to changing precipitation regimes and teleconnection correlations exist at the high elevations (>1000 m). These findings can be used to promote the need for researching the effects of global climate change on mountainous regions. This study is an example of the complexity of researching mountain climates in a time of global change.
Future research ought to investigate if similar trends exist within the SEUS by removing the influence of extreme precipitation events. The hydroclimate is characterized by more than daily precipitation. Humidity, cloud cover, atmospheric pressure, and several other atmospheric variables constitute a region’s hydroclimate. Future research should also investigate other atmospheric variables, create hydroclimatic intensity metrics, and characterize the potential change in floods and droughts. More research on the meteorological variables associated with daily precipitation development in mountainous regions is necessary to provide a better understanding of the physical processes that are responsible for the changes identified in this study. This research aligns with the research goals listed by the National Climate Assessment 2014 [9], which include a need to improve the understanding of the climate system and its drivers and of climate impacts and vulnerability. Understanding local variability in the context of climate change is critical for preparing for future changes. This research is important to the SAM region because changes to the daily frequency of precipitation types changes bring implications to local ecologies, streamflow, and agriculture.

Author Contributions

Conceptualization, T.K. and J.W.S.; Project administration, T.K. and J.W.S.; Supervision, J.W.S. and L.B.P.; Visualization, T.K.; Writing–original draft, T.K. and J.W.S.; Writing–review and editing, J.W.S. and L.B.P.

Funding

This research received no external funding.

Acknowledgments

We thank the Department of Geography and Planning at Appalachian State University for their support.

Conflicts of Interest

The authors declare no conflict of interest.

References

  1. Doublin, J.K.; Grundstein, A.J. Warm-season soil-moisture deficits in the Southern United States. Phys. Geogr. 2008, 29, 3–18. [Google Scholar] [CrossRef]
  2. Groisman, P.Y.; Knight, R.W. Prolonged dry episodes over the conterminous United States: New tendencies emerging during the last 40 years. J. Clim. 2008, 21, 1850–1862. [Google Scholar] [CrossRef]
  3. Caldwell, P.V.; Sun, G.; McNulty, S.G.; Cohen, E.C.; Moore Myers, J.A. Impacts of impervious cover, water withdrawls, and climate change on river flows in the Conterminous US. Hydrol. Earth Syst. Sci. 2012, 16, 2839–2857. [Google Scholar] [CrossRef]
  4. Giorgi, F.; Im, E.-S.; Coppola, E.; Diffenbaugh, N.S.; Gao, X.J.; Mariotti, L.; Shi, Y. Higher hydroclimatic intensity with global warming. J. Clim. 2011, 24, 5309–5324. [Google Scholar] [CrossRef]
  5. Sun, G.; Arumugam, S.; Caldwell, P.V.; Conrads, P.A.; Covich, A.P.; Cruise, J.; Feldt, J.; Georgakakos, A.P.; McNider, R.T.; McNulty, S.G.; et al. Impacts of Climate Change and Variability on the Water Resources of the Southeast US. Available online: https://www.srs.fs.usda.gov/pubs/ja/2013/ja_2013_sun_002.pdf (accessed on 10 May 2019).
  6. Barros, A.P.; Kuligowski, R.J. Orographic effects during a severe wintertime rainstorm in the Appalachian Mountains. Mon. Weather Rev. 1998, 126, 2648–2672. [Google Scholar] [CrossRef]
  7. Perry, L.B.; Konrad, C.E. Relationships between NW flow snowfall and topography in the Southern Appalachians, USA. Clim. Res. 2006, 32, 35–47. [Google Scholar] [CrossRef]
  8. Perry, L.B.; Konrad, C.E.; Hotz, D.G.; Lee, L.G. Synoptic classification of snowfall events in the great Smoky Mountains, USA. Phys. Geogr. 2010, 31, 156–171. [Google Scholar] [CrossRef]
  9. 2014 National Climate Assessment. Available online: https://nca2014.globalchange.gov/ (accessed on 10 May 2019).
  10. Meehl, G.A.; Arblaster, J.M.; Branstator, G. Mechanisms contributing to the warming hole and the consequent U.S. East-west differential of heat extremes. J. Clim. 2012, 25, 6394–6408. [Google Scholar] [CrossRef]
  11. Seager, R.; Tzanova, A.; Nakamura, J. Drought in the Southeastern United States: Causes, variability over the last millennium, and the potential for future hydroclimate change. J. Clim. 2009, 22, 5021–5045. [Google Scholar] [CrossRef]
  12. Kunkel, K.; Stevens, L.E.; Stevens, S.E.; Sun, L.; Janssen, E.; Wuebbles, D.; Dobson, J.G. Regional climate trends and scenarios for the U. S. National Climate Assessment, Part 9. In Climate of the Contiguous United States; National Oceanic and Atmospheric Administration Technical Report NESDIS 142-9; National Oceanic and Atmospheric Administration: Washington, DC, USA, 2013. [Google Scholar]
  13. Labosier, C.F.; Quiring, S.M. Hydroclimatology of the southeastern USA. Clim. Res. 2013, 57, 157–171. [Google Scholar] [CrossRef]
  14. Engström, J.; Waylen, P. The changing hydroclimatology of Southeastern U.S. J. Hydrol. 2017, 548, 16–23. [Google Scholar] [CrossRef]
  15. Ford, T.; Labosier, C.F. Spatial patterns of drought persistence in the Southeastern United States. Int. J. Clim. 2014, 34, 2229–2240. [Google Scholar] [CrossRef]
  16. Karl, T.R.; Knight, R.W. Secular trends of precipitation amount, frequency, and intensity in the United States. Bull. Am. Meteorol. Soc. 1998, 79, 1921–1924. [Google Scholar] [CrossRef]
  17. Wang, H.; Fu, R.; Kumar, A.; Li, W. Intensification of summer rainfall variability in the Southeastern United States during recent decades. J. Hydrometeorol. 2010, 11, 1007–1018. [Google Scholar] [CrossRef]
  18. Ortegren, J.T.; Knapp, P.A.; Maxwell, J.T.; Tyminski, W.P.; Soulé, P.T. Ocean-atmosphere influences on low-frequency warm-season drought variability in the gulf coast and southeastern United States. J. Appl. Meteorol. Clim. 2011, 50, 1177–1186. [Google Scholar] [CrossRef]
  19. Bishop, D.A.; Williams, A.P.; Seager, R.; Fiore, A.M.; Cook, B.I.; Mankin, J.S.; Singh, D.; Smerdon, J.E.; Rao, M.P. Investigating the causes of increased twentieth-century fall precipitation over the Southeastern United States. J. Clim. 2019, 32, 575–590. [Google Scholar] [CrossRef]
  20. Diem, J.E. Synoptic-scale controls of summer precipitation in the southeastern United States. J. Clim. 2006, 19, 613–621. [Google Scholar] [CrossRef]
  21. Li, W.; Li, L.; Fu, R.; Deng, Y.; Wang, H. Changes to the North Atlantic subtropical high and its role in the intensification of summer rainfall variability in the southeastern United States. J. Clim. 2011, 24, 1499–1506. [Google Scholar] [CrossRef]
  22. Diem, J.E. Response to comments on Influences of the Bermuda High and atmospheric moistening on changes in summer rainfall in the Atlanta, Georgia region, the United States. Int. J. Climatol. 2013, 26, 679–682. [Google Scholar] [CrossRef]
  23. Li, W.; Li, L.; Fu, R.; Deng, Y.; Wang, H. Reply to “Comments on Changes to the North Atlantic Subtropical High and Its Role in the Intensification of Summer Rainfall Variability in the Southeastern United States”. J. Clim. 2012, 26, 683–688. [Google Scholar] [CrossRef]
  24. Sugg, J.W.; Konrad, C.E., II. Relating warm season hydroclimatic variability in the southern Appalachians to synoptic weather patterns using self-organizing maps. Clim. Res. 2017, 74, 145–160. [Google Scholar] [CrossRef]
  25. Leathers, D.J.; Yarnal, B.; Palecki, M.A. The Pacific/North American teleconnection pattern and the United States climate. Part I: Regional temperature and precipitation association. J. Clim. 1991, 4, 517–528. [Google Scholar] [CrossRef]
  26. Stahle, D.W.; Cleaveland, M.K. Reconstructing and analysis of spring rainfall over the southeastern U.S. for the past 1000 years. Bull. Am. Meteorol. Soc. 1992, 73, 1947–1961. [Google Scholar] [CrossRef]
  27. Katz, R.W.; Parlange, M.B.; Tebaldi, C. Stochastic modeling of the effects of large-scale circulation on daily weather in the southeastern U.S. Clim. Chang. 1850, 60, 189–216. [Google Scholar] [CrossRef]
  28. Kelly, G.M.; Perry, L.B.; Taubman, B.F.; Soulé, P.T. Synoptic classification of 2009–2010 precipitation events in the southern Appalachian Mountains, USA. Clim. Res. 2012, 55, 1–15. [Google Scholar] [CrossRef]
  29. Sugg, J.W.; Konrad, C.E. Defining hydroclimatic regions using daily rainfall characteristics in the Southern Appalachian Mountains. Int. J. Digit. Earth 2019, 1–18. [Google Scholar] [CrossRef]
  30. Daly, C.; Neilson, R.P.; Phillips, D.L. A statistical-topographic model for mapping climatological precipitation over Mountainous Terrain. J. Appl. Meteorol. 1994, 33, 140–158. [Google Scholar] [CrossRef]
  31. Daly, C.; Taylor, G.H.; Gibson, W.P.; Parzybok, T.W.; Johnson, G.L.; Pasteris, P.A. High-quality spatial climate data sets for the United States and beyond. Trans. ASAE 2001, 43, 1957–1962. [Google Scholar] [CrossRef]
  32. Daly, C. Variable Influence of Terrain on Precipitation Patterns: Delineation and Use of Effective Terrain Height in PRISM; Oregon State University: Corvallis, OR, USA, September 2002. [Google Scholar]
  33. Daly, C. Guidelines for assessing the suitability of spatial climate data sets. Int. J. Climatol. 2006, 26, 707–721. [Google Scholar] [CrossRef]
  34. Menne, M.J.; Williams, C.N. The United States historical climatology network monthly temperature data. Bull. Am. Meteorol. Soc. 2009, 90, 993–1007. [Google Scholar] [CrossRef]
  35. Earth Systems Research Laboratory: Physical Sciences Division. Available online: https://www.esrl.noaa.gov/psd/ (accessed on 10 May 2019).
  36. Leathers, D.J.; Palecki, M.A. The Pacific/North American Teleconnection Pattern and United States Climate. Part II: Temporal Characteristics and Index Specification. J. Clim. 1992, 5, 707–716. [Google Scholar] [CrossRef] [Green Version]
  37. Barnston, A.G.; Livezey, R.E. Classification, seasonality and persistence of low-frequecy atmospheric circulation patterns. Mon. Weather Rev. 1987, 115, 1083–1126. [Google Scholar] [CrossRef]
  38. Henderson, K.G.; Vega, A.J. Regional precipitation variability in the southern United States. Phys. Geogr. 1996, 17, 93–112. [Google Scholar] [CrossRef]
  39. Trouet, V.; Taylor, A.H. Multi-century variability in the Pacific North American circulation pattern reconstructed from tree rings. Clim. Dyn. 2010, 35, 953–963. [Google Scholar] [CrossRef]
  40. Enfield, D.B.; Mestas-Nuñez, A.M.; Trimble, P.J. The Atlantic multidecadal oscillation and its relation to rainfall and river flows in the continental U.S. Geophys. Res. Lett. 2001, 28, 2077–2080. [Google Scholar] [CrossRef]
  41. McCabe, G.J.; Palecki, M.A.; Betancourt, J.L. Pacific and Atlantic influences on multidecadal drought frequency in the United States. Proc. Natl. Acad. Sci. USA 2004, 101, 4136–4141. [Google Scholar] [CrossRef] [PubMed]
  42. Knight, J.R.; Allan, R.J.; Folland, C.K.; Vellinga, M.; Mann, M.E. A signature of persistent natural thermohaline circulation cycles in observed climate. Geophys. Res. Lett. 2005, 32, L20708. [Google Scholar] [CrossRef]
  43. Sutton, R.T.; Hodson, D.L.R. Atlantic Ocean forcing of North American and European summer climate. Science 2005, 309, 115. [Google Scholar] [CrossRef] [PubMed]
  44. Knight, J.R.; Folland, C.K.; Scaife, A.A. Climate impacts of the Atlantic multidecadal oscillation. Geophys. Res. Lett. 2006, 33, 2–5. [Google Scholar] [CrossRef]
  45. Hu, Q.; Feng, S.; Oglesby, R.J. Variations in North American summer precipitation driven by the Atlantic multidecadal oscillation. J. Clim. 2011, 24, 5555–5570. [Google Scholar] [CrossRef]
  46. Wang, C.; Lee, S.K. Atlantic warm pool, Caribbean low-level jet, and their potential impact on Atlantic hurricanes. Geophys. Res. Lett. 2007, 34, L02703. [Google Scholar] [CrossRef]
  47. Penland, C.; Mastronova, L. Prediction of tropical Atlantic sea surface temperatures using linear inverse modeling. J. Clim. 1998, 11, 483–496. [Google Scholar] [CrossRef]
  48. Konrad, C.E. Relationships between precipitation event types and topography in the southern Blue Ridge Mountains of the Southeastern USA. Int. J. Clim. 1996, 16, 49–62. [Google Scholar] [CrossRef]
  49. Wilkes, D.S. Statistical Methods in the Atmospheric Sciences, 3rd ed.; Academic Press: Amsterdam, The Netherlands, 2013. [Google Scholar]
  50. Eck, M.A.; Perry, L.B.; Soulé, P.T.; Sugg, J.W.; Miller, D.K. Winter climate variability in the southern Appalachian Mountains, 1910–2017. Int. J. Climatol. 2018, 39, 206–217. [Google Scholar] [CrossRef]
  51. Knapp, P.A.; Maxwell, J.T.; Ortegren, J.T.; Soulé, P.T. Spatiotemporal changes in comfortable weather duration in the continental united states and implications for human wellness. Ann. Am. Assoc. Geogr. 2015, 106, 1–18. [Google Scholar] [CrossRef]
  52. Andersen, L.M.; Sugg, M.M. Geographic multi-criteria evaluation and validation: A case study of wildfire vulnerability in Western North Carolina, USA following the 2016 wildfires. Int. J. Disaster Risk Reduct. 2019, 101–123. [Google Scholar] [CrossRef]
  53. Groisman, P.Y.; Knight, R.W.; Easterling, D.R.; Karl, T.R.; Hegerl, G.C.; Razuvaev, V.N. Trends in intense precipitation in the climate record. J. Clim. 2005, 18, 1326–1350. [Google Scholar] [CrossRef]
  54. Wilson, A.M.; Barros, A.P. An investigation of warm rainfall microphysics in the Southern Appalachians: Orographic enhancement via low-level seeder–feeder interactions. J. Atmos. Sci. 2014, 71, 1783–1805. [Google Scholar] [CrossRef]
  55. Bonacina, L.C.W. Orographic rainfall and its place in the hydrology of the globe. Q. J. R. Meteor. Soc. 1945, 71, 41–55. [Google Scholar]
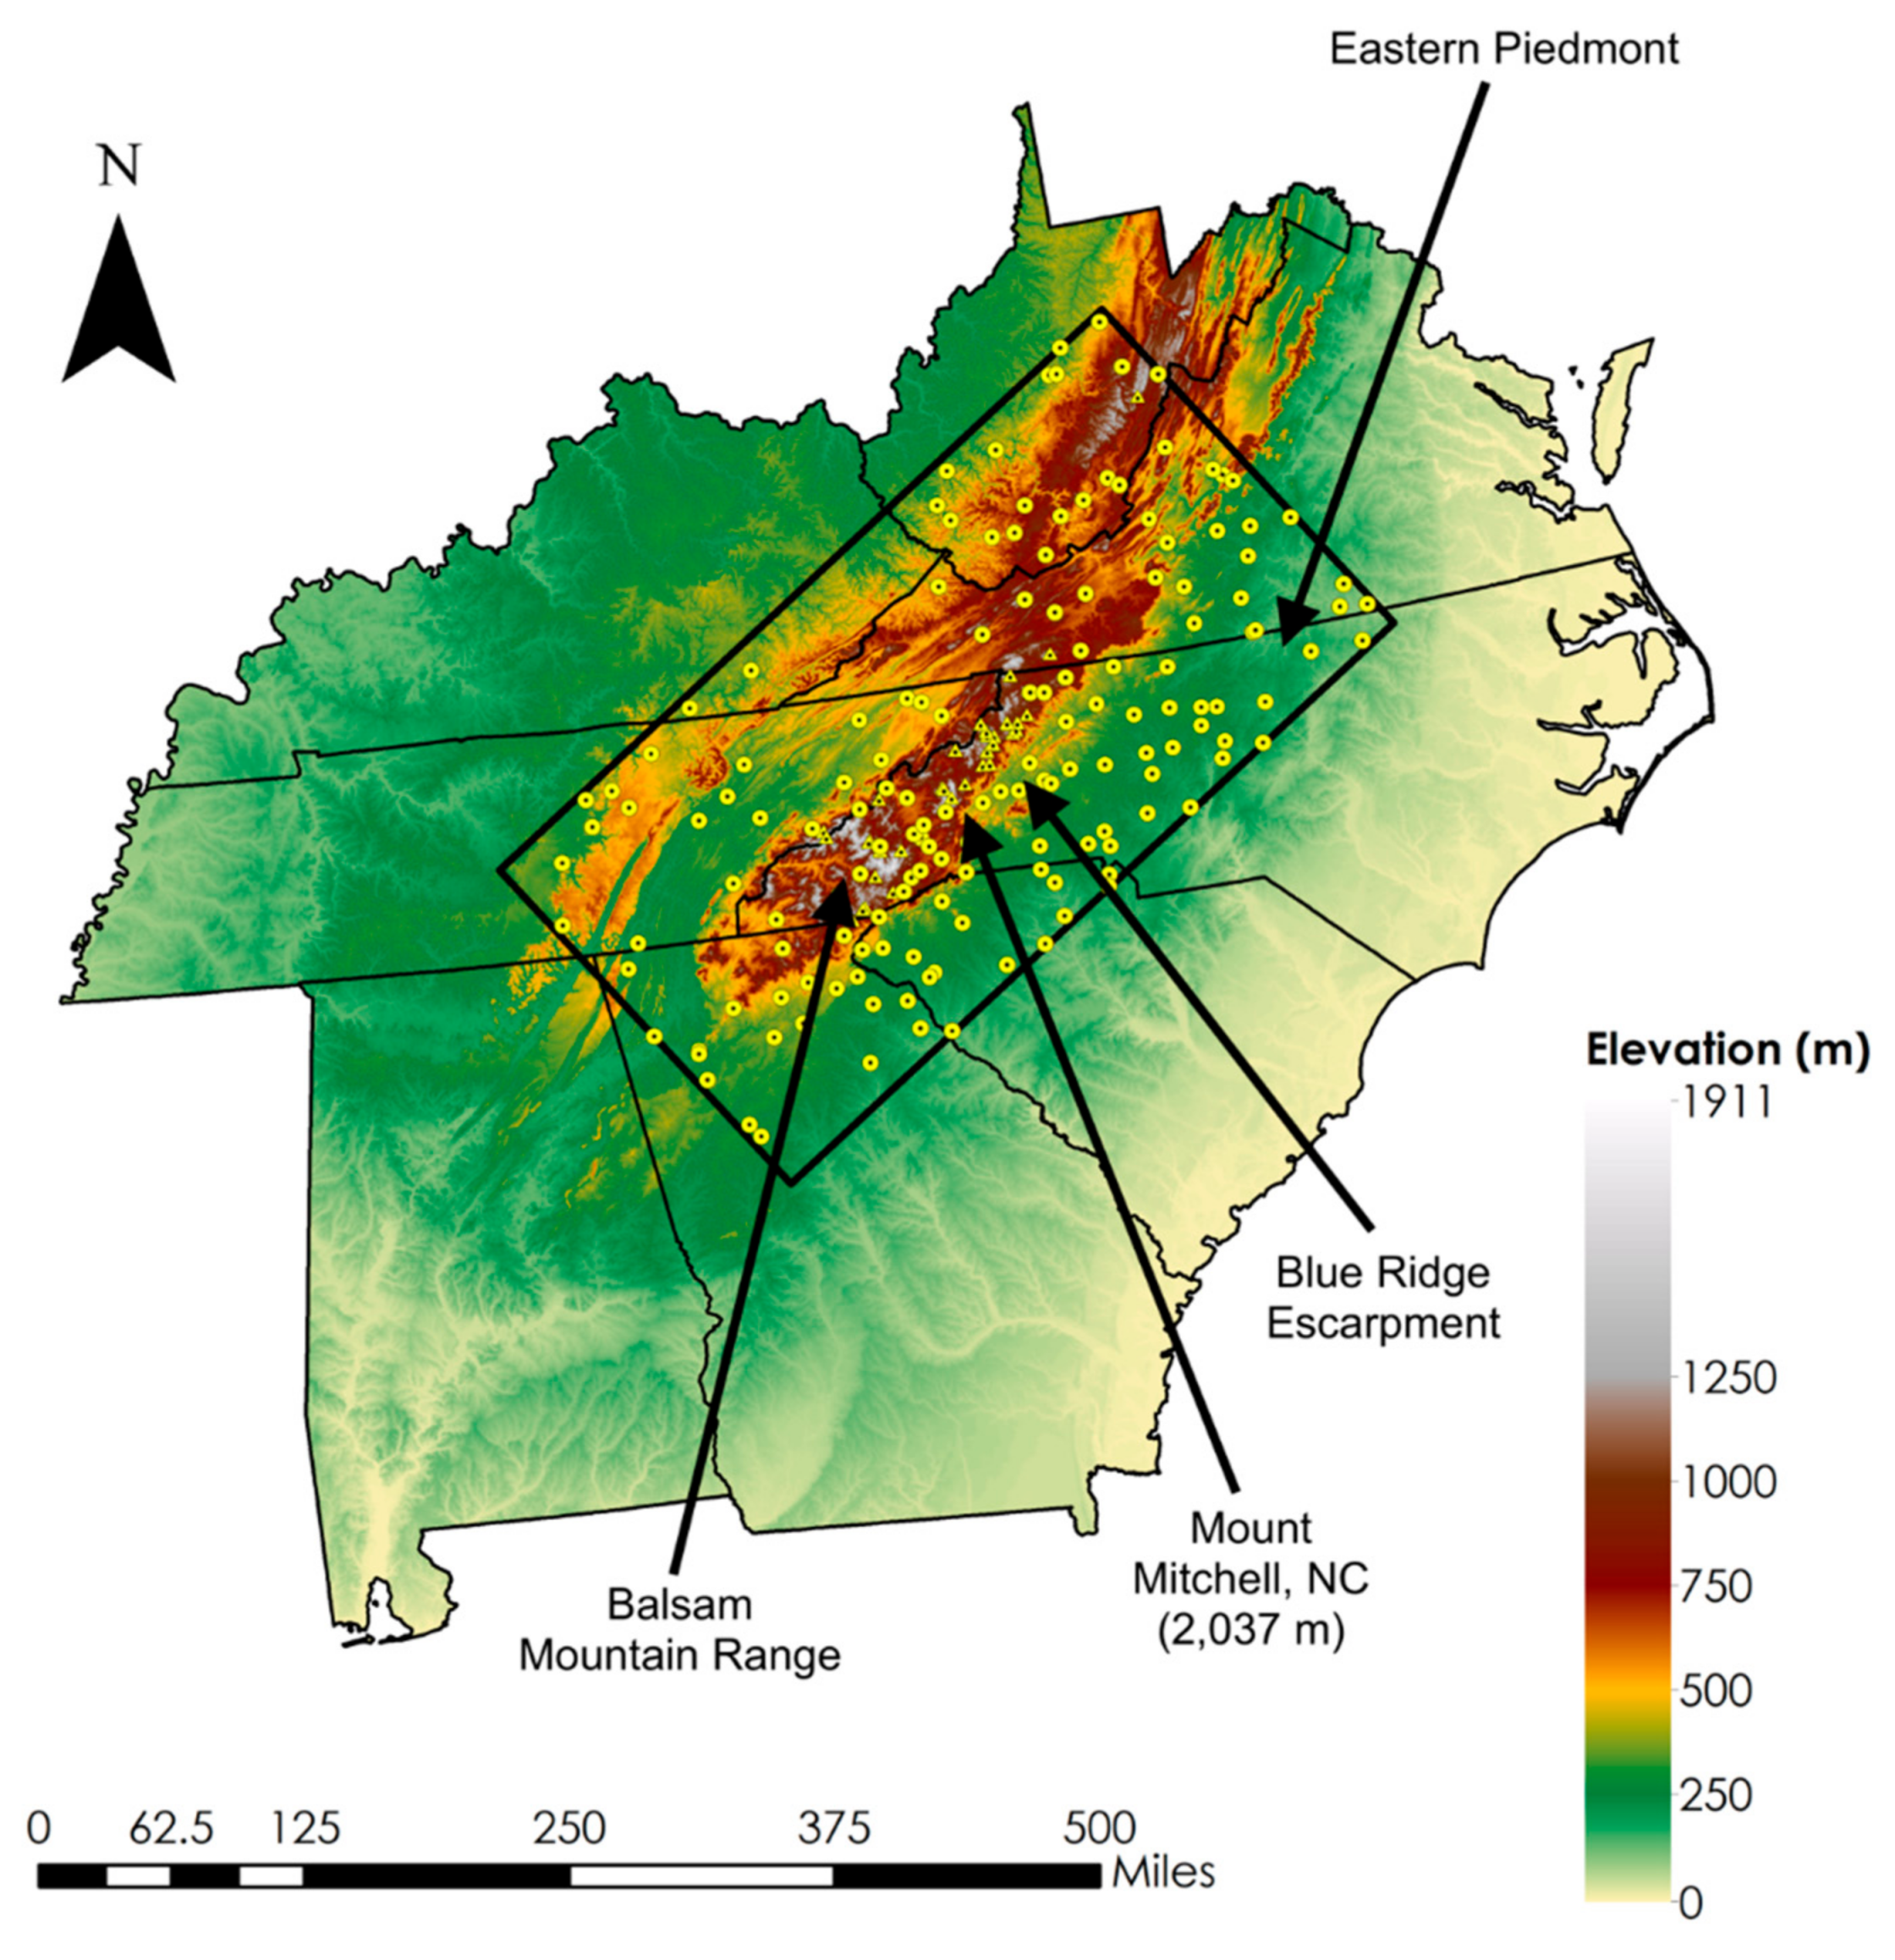
Figure 1. Eastern Piedmont, the Blue Ridge Escarpment, and the Balsam Mountain Range are physiographic regions referenced throughout this study. This study area contains Mount Mitchell, the highest peak east of the Mississippi river (2307 m). Triangles represent high elevation stations (>1000 m) and circles represent those at lower elevations from the Global Historical Climatological Network (GHCN).
Atmosphere 10 00289 g001
Figure 2. (a) This panel visualizes the first year of record in five year aggregates of GHCN stations after the data quality screening. (b) The 195 GHCN stations are distributed across the range of elevations (above mean sea level) in the Southern Appalachian Mountains (SAM). Thirty-six stations are above 1000 m.
Atmosphere 10 00289 g002
Figure 3. (A) The frequency of dry days in the warm season are visualized across the SAM using Parameter-elevation Regressions on Independent Slopes Model (PRISM) data from 2002 to 2018. (B) The frequency of light precipitation days in the SAM warm season. (C) The frequency of moderate precipitation days in the SAM warm season. (D) The frequency of heavy precipitation days in the SAM warm season.
Atmosphere 10 00289 g003
Figure 4. Mean warm season daily precipitation in the SAM varies greatly. The highest daily amounts are found along the Blue Ridge Escarpment.
Atmosphere 10 00289 g004
Figure 5. These plots show the magnitude and direction of statistically significant (α = 0.05) monotonic trends across elevation. Figure 5 indicates that the frequency of dry days and light precipitation is most significantly changing. The frequency of dry days (A) was decreasing and the frequency of light precipitation (B) was increasing, across all elevations. The frequency of moderate (C) and heavy precipitation (D) slightly increased at some elevations.
Atmosphere 10 00289 g005
Figure 6. These time series contrast the Atlantic Multi-decadal Oscillation (AMO) index with indexed precipitation classes. The seasonal variability of each index seen alongside AMO variability.
Atmosphere 10 00289 g006
Figure 7. These maps show the spatial distribution of statistically significant correlations between warm season precipitation type counts and the AMO seasonal average using the Spearman’s Rank correlation coefficient. The panels are arranged as following: Dry day (A), light (B), moderate (C), heavy precipitation (D), and DSL (E).
Atmosphere 10 00289 g007
Figure 8. These time series contrast the CAR index with indexed precipitation classes. The seasonal variability of each index seen alongside CAR variability.
Atmosphere 10 00289 g008
Figure 9. These maps show the spatial distribution of statistically significant correlations between warm season precipitation type counts and the CAR using the Spearman’s Rank correlation coefficient. The panels are arranged as following: Dry day (A), light (B), moderate (C), heavy precipitation (D), and DSL (E).
Atmosphere 10 00289 g009
Figure 10. These time series contrast the PNA index with indexed precipitation classes. The seasonal variability of each index seen alongside PNA variability.
Atmosphere 10 00289 g010
Figure 11. These plots visualize the spatial distribution of statistically significant correlations between warm season precipitation type counts and the PNA using the Spearman’s Rank correlation coefficient. The panels are arranged as following: Dry day (A), light (B), moderate (C), heavy precipitation (D), and DSL (E).
Atmosphere 10 00289 g011
Table 1. The daily precipitation values are categorized into the precipitation regimes below.
DryLightModerateHeavy
<0.254 mm0.254 mm–6.35 mm6.35 mm–25.4 mm>25.4 mm
Table 2. Mean τ statistics of positive and negative trends are listed in the table below to characterize the warm season hydroclimatic change in the SAM from 1950 to 2018.
NegativePositive
Dry 0.050 0.056
Light 0.051 0.050
Moderate 0.033 0.028
Heavy 0.025 0.048
DSL 0.099 0.172
Table 3. The number of statistically significant ( α = 0.05 ) ρ values are listed in the table below to summarize AMO linkages to the precipitation regimes in the SAM from 1950 to 2018.
NegativePositive
Dry 22 7
Light 19 20
Moderate 6 4
Heavy 3 5
DSL 13 5
Table 4. The number of statistically significant ( α = 0.05 ) ρ values are listed in the table below to summarize CAR linkages to the precipitation regimes in the SAM from 1950 to 2018.
NegativePositive
Dry 16 8
Light 18 22
Moderate 14 5
Heavy 5 1
DSL 24 4
Table 5. The number of statistically significant ( α = 0.05 ) ρ values are listed in the table below to summarize PNA linkages to the precipitation regimes in the SAM from 1950 to 2018.
NegativePositive
Dry 1 4
Light 5 7
Moderate 5 1
Heavy 10 0
DSL 4 2