The Southwest China Flood of July 2018 and Its Causes


Abstract
1. Introduction
2. Data
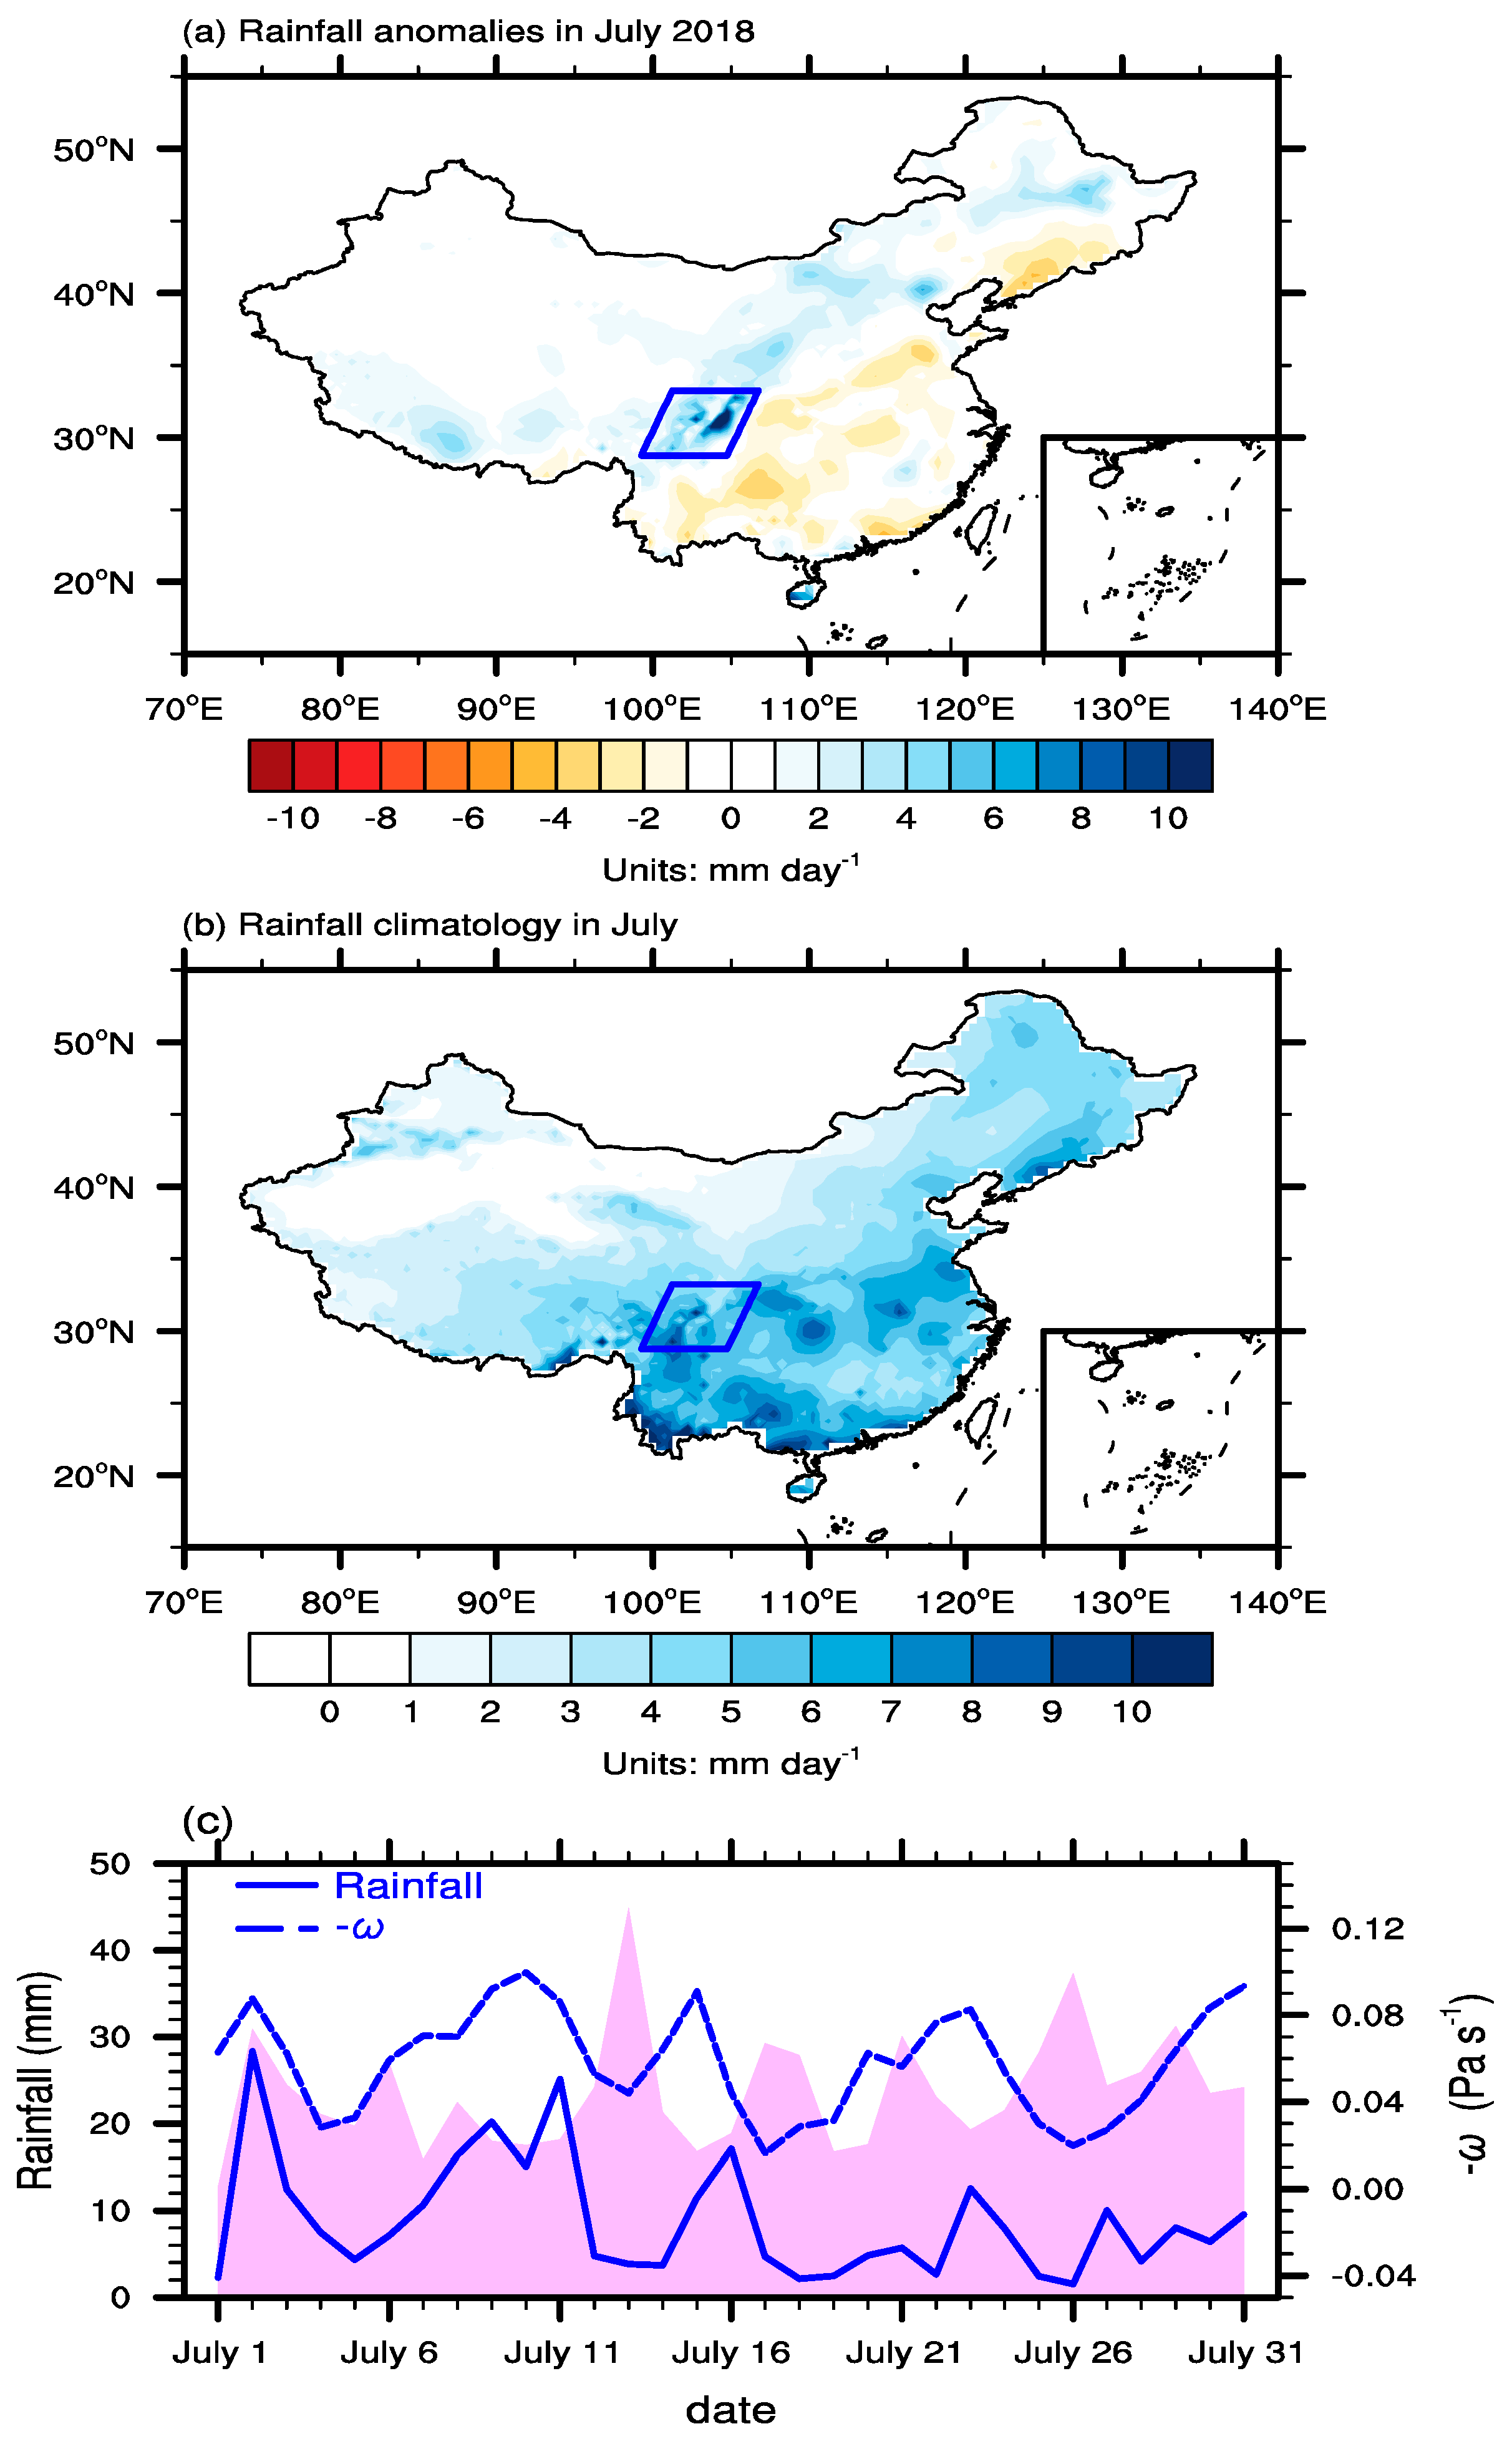
3. Observed Southwest China Flood in July 2018
4. Possible Causes
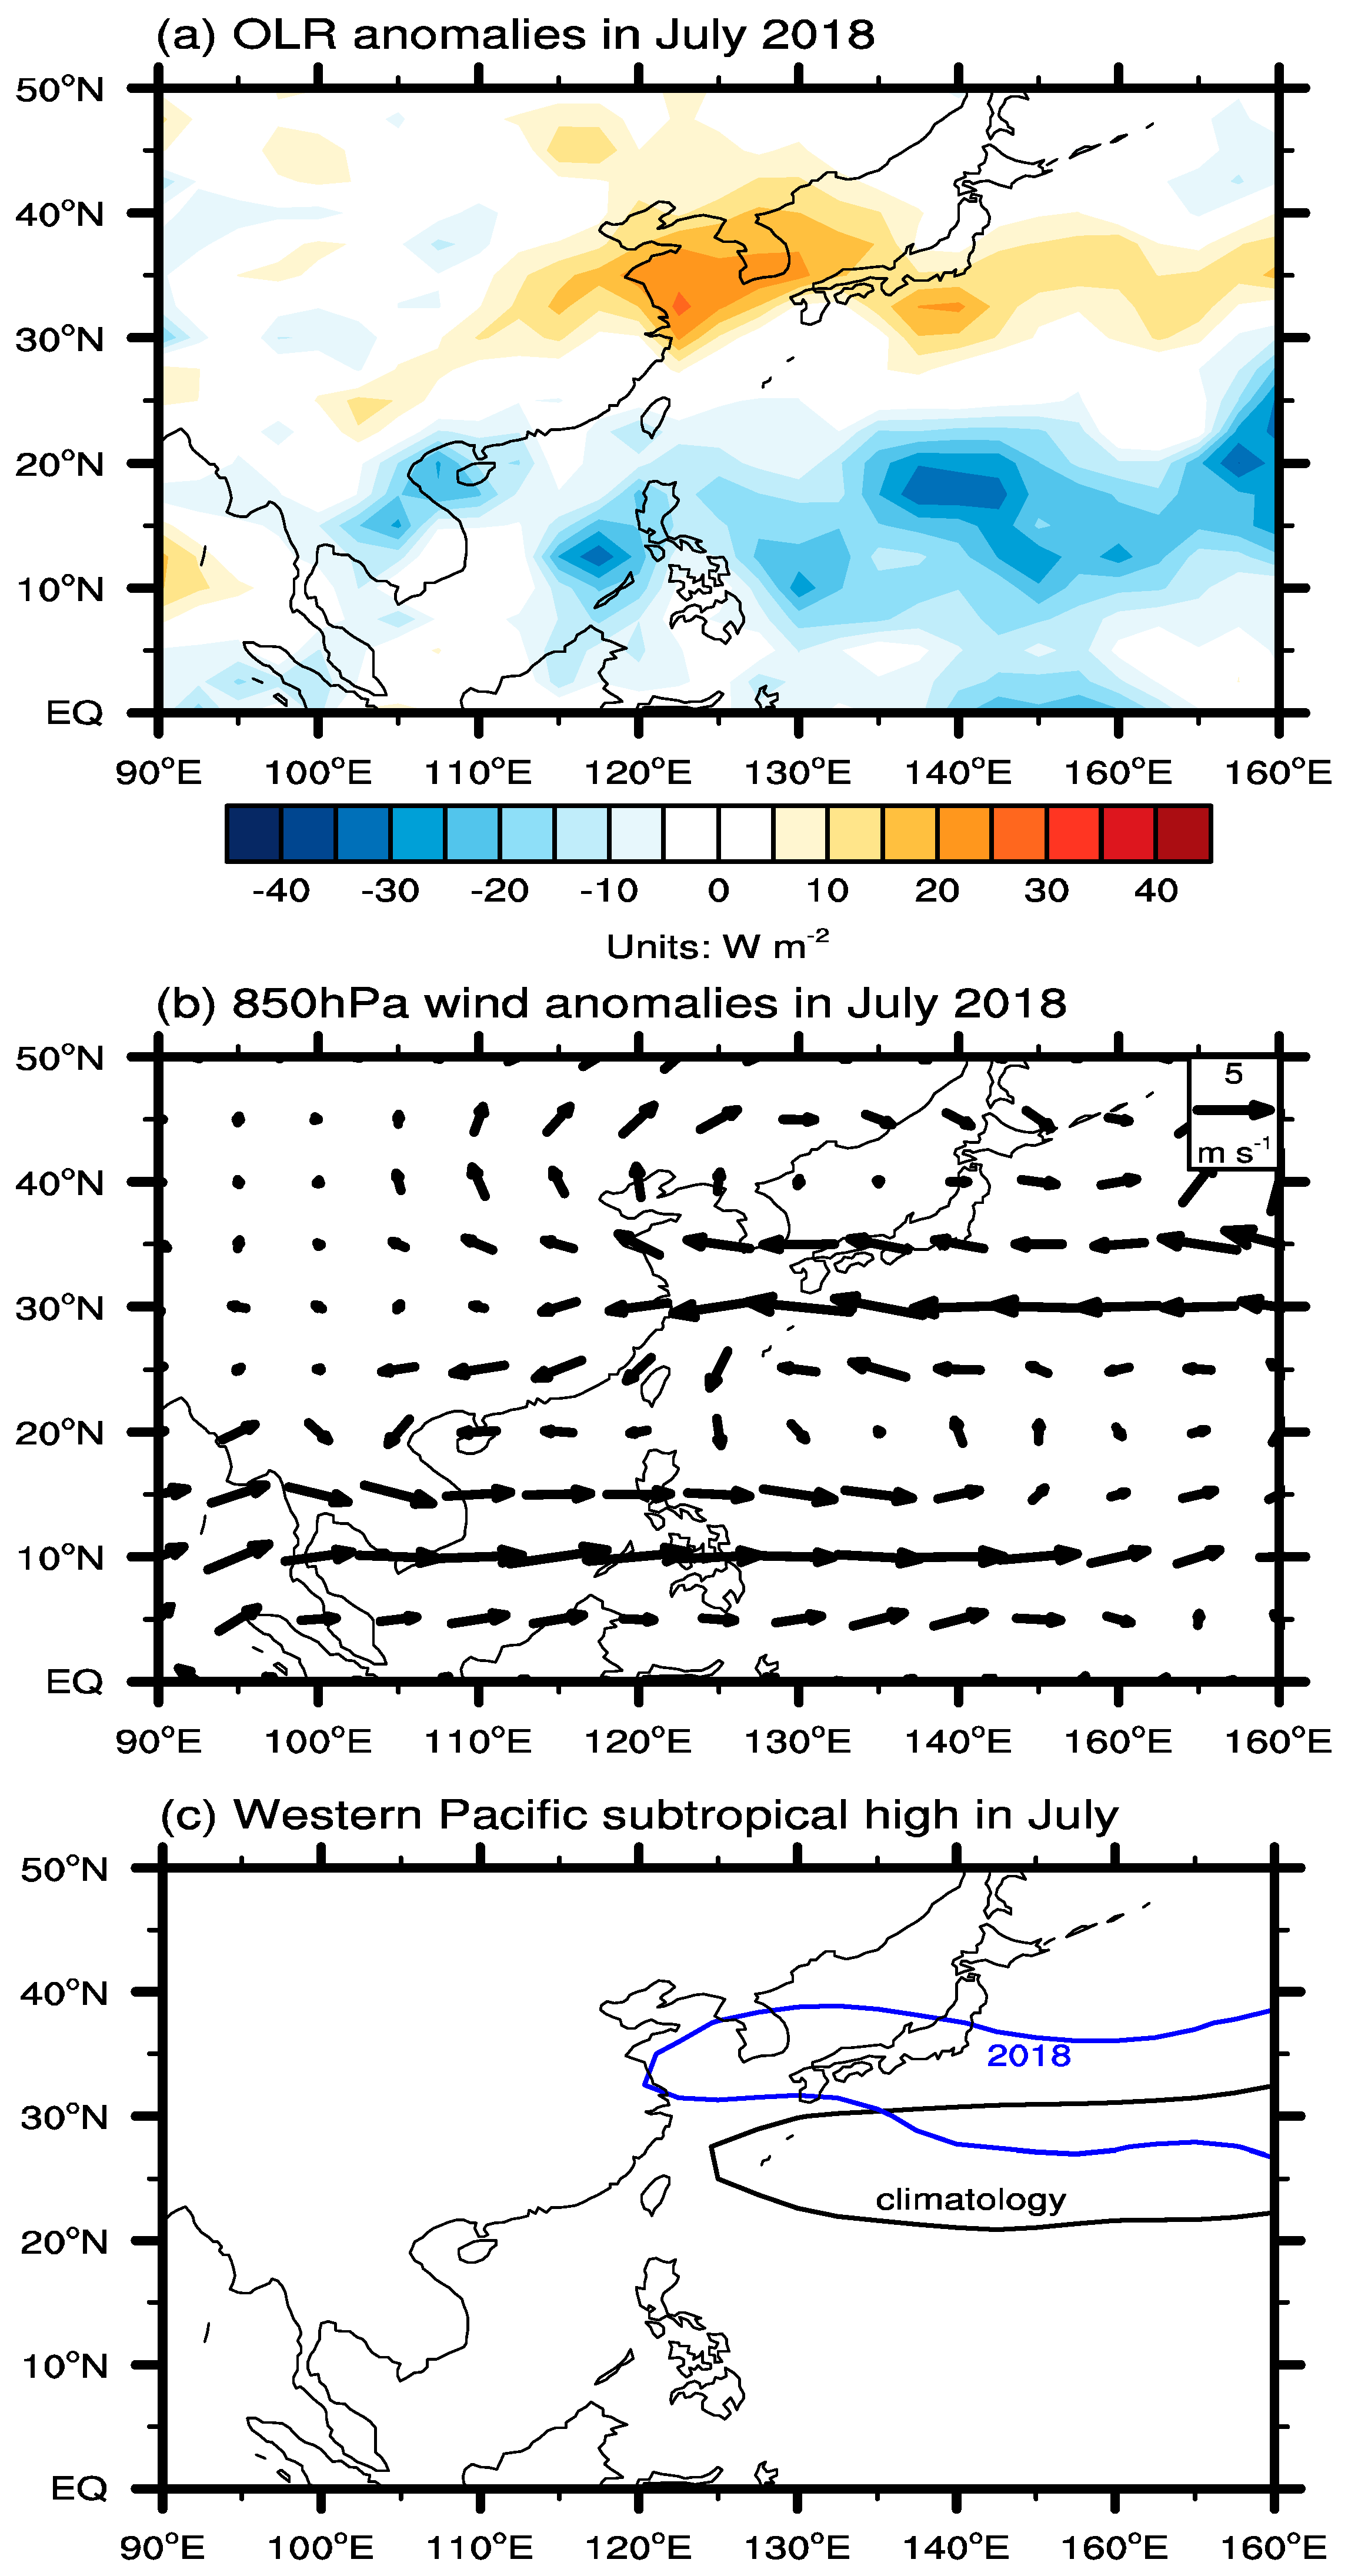
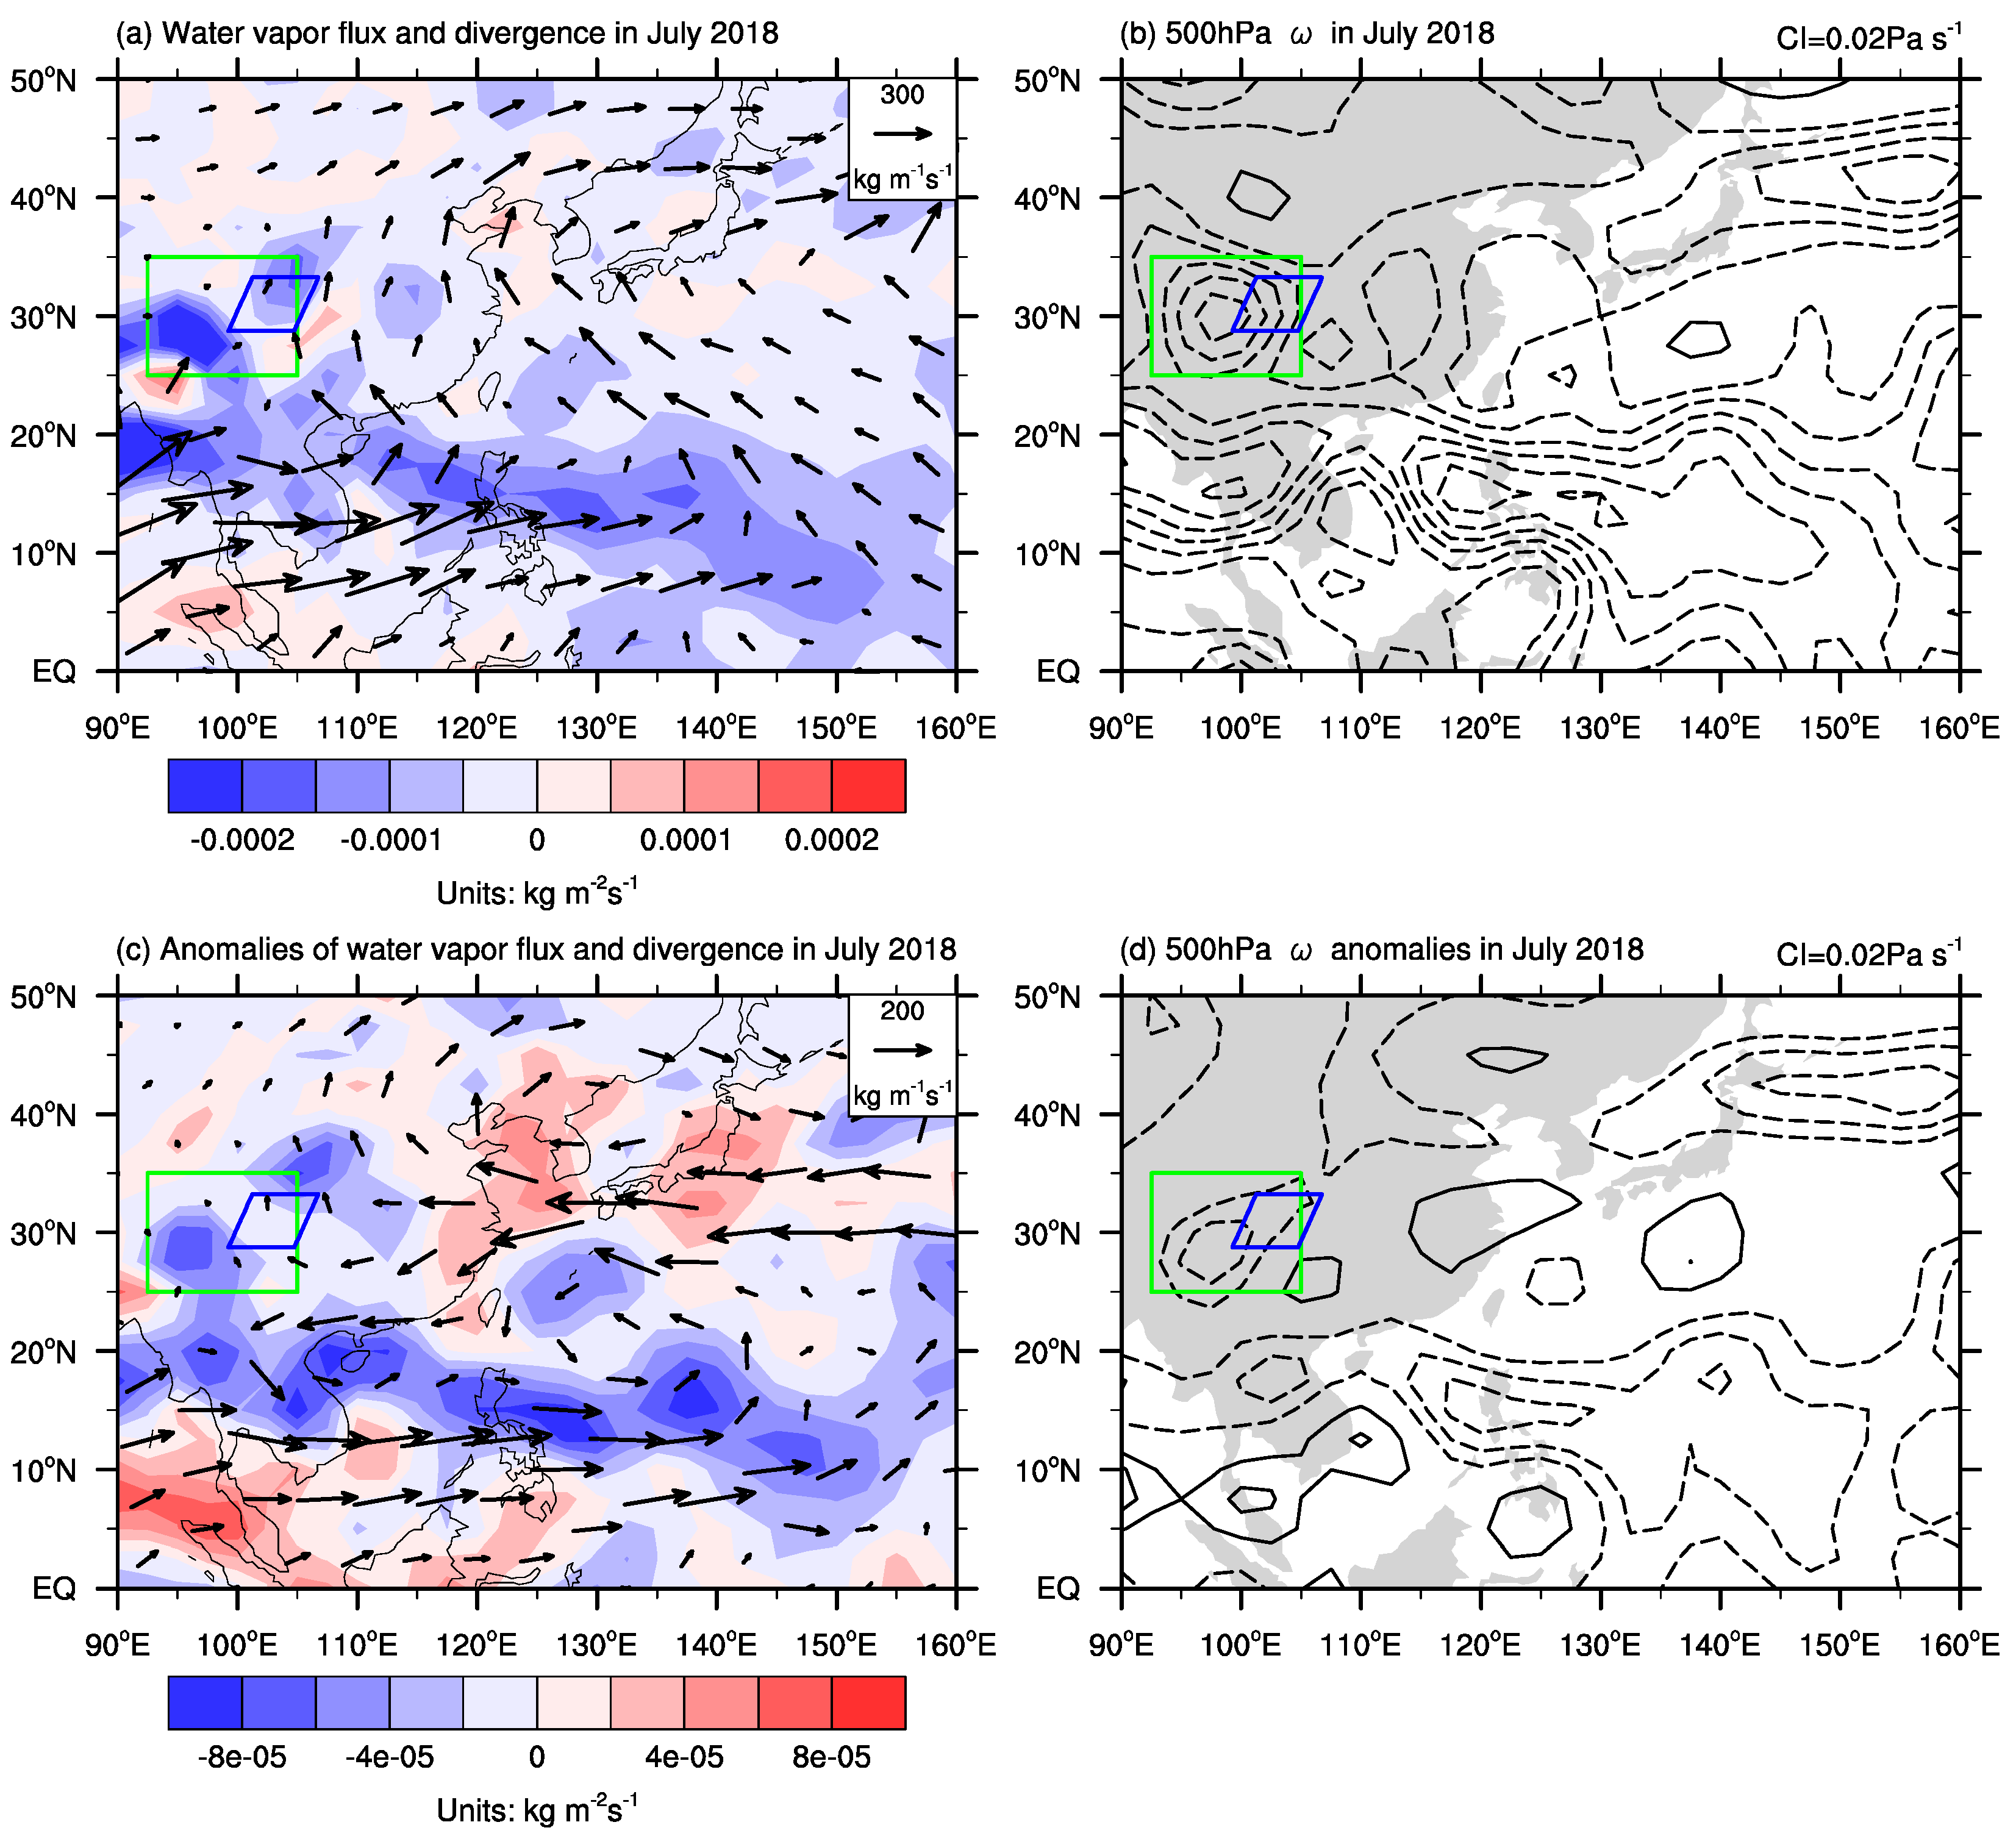
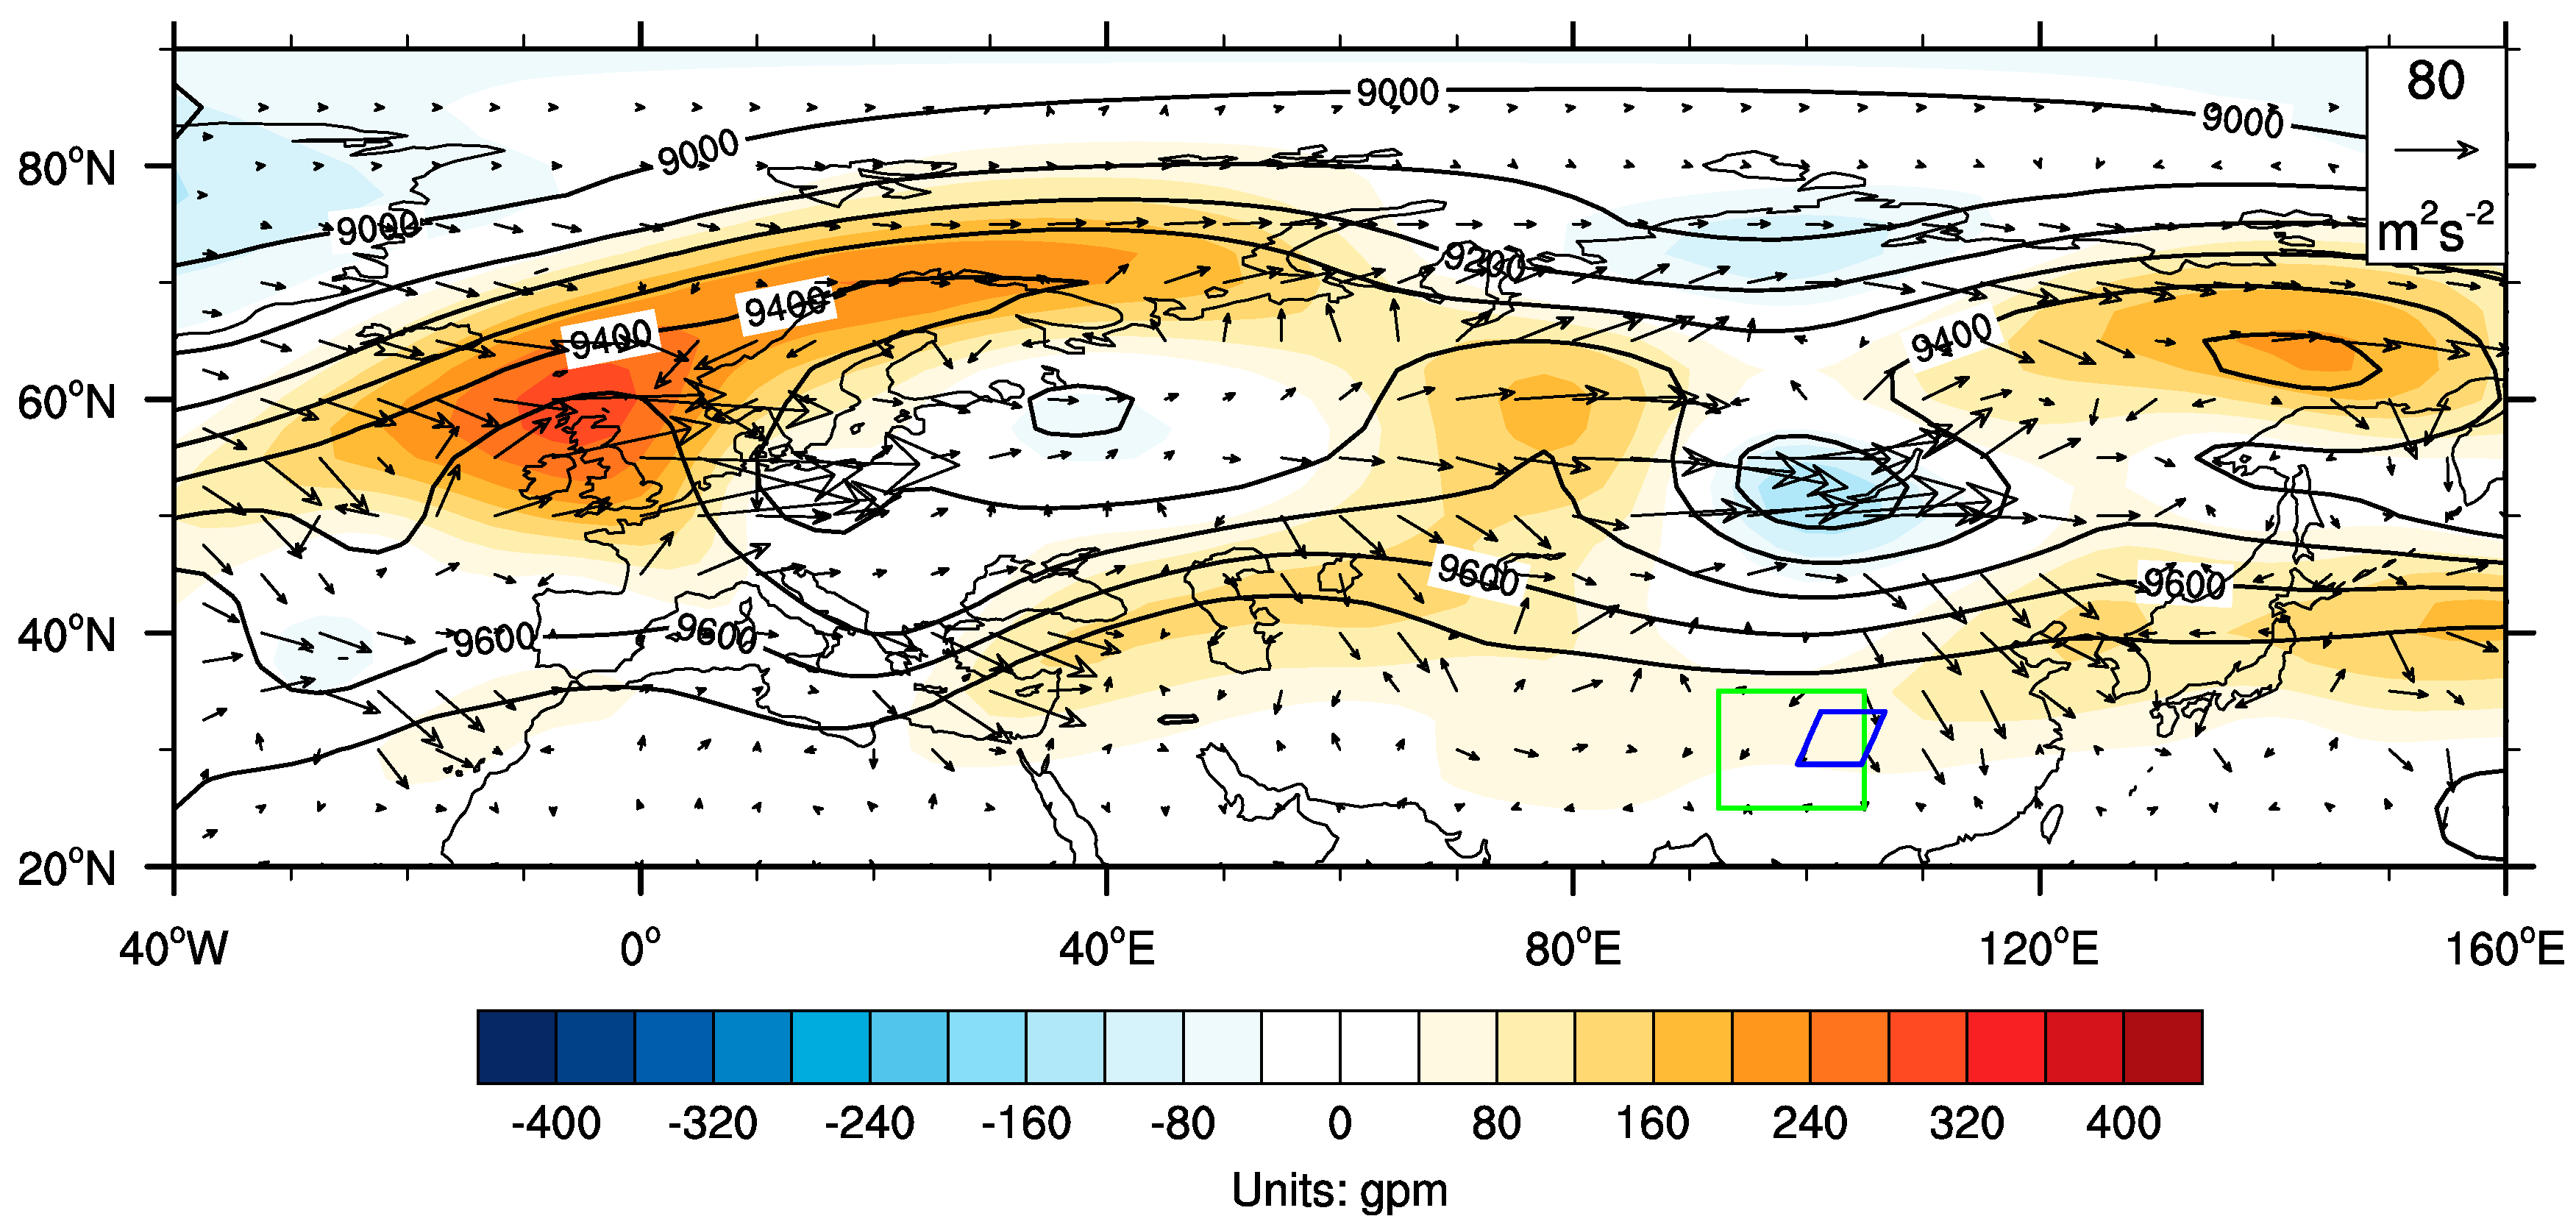
4.1. July Mean
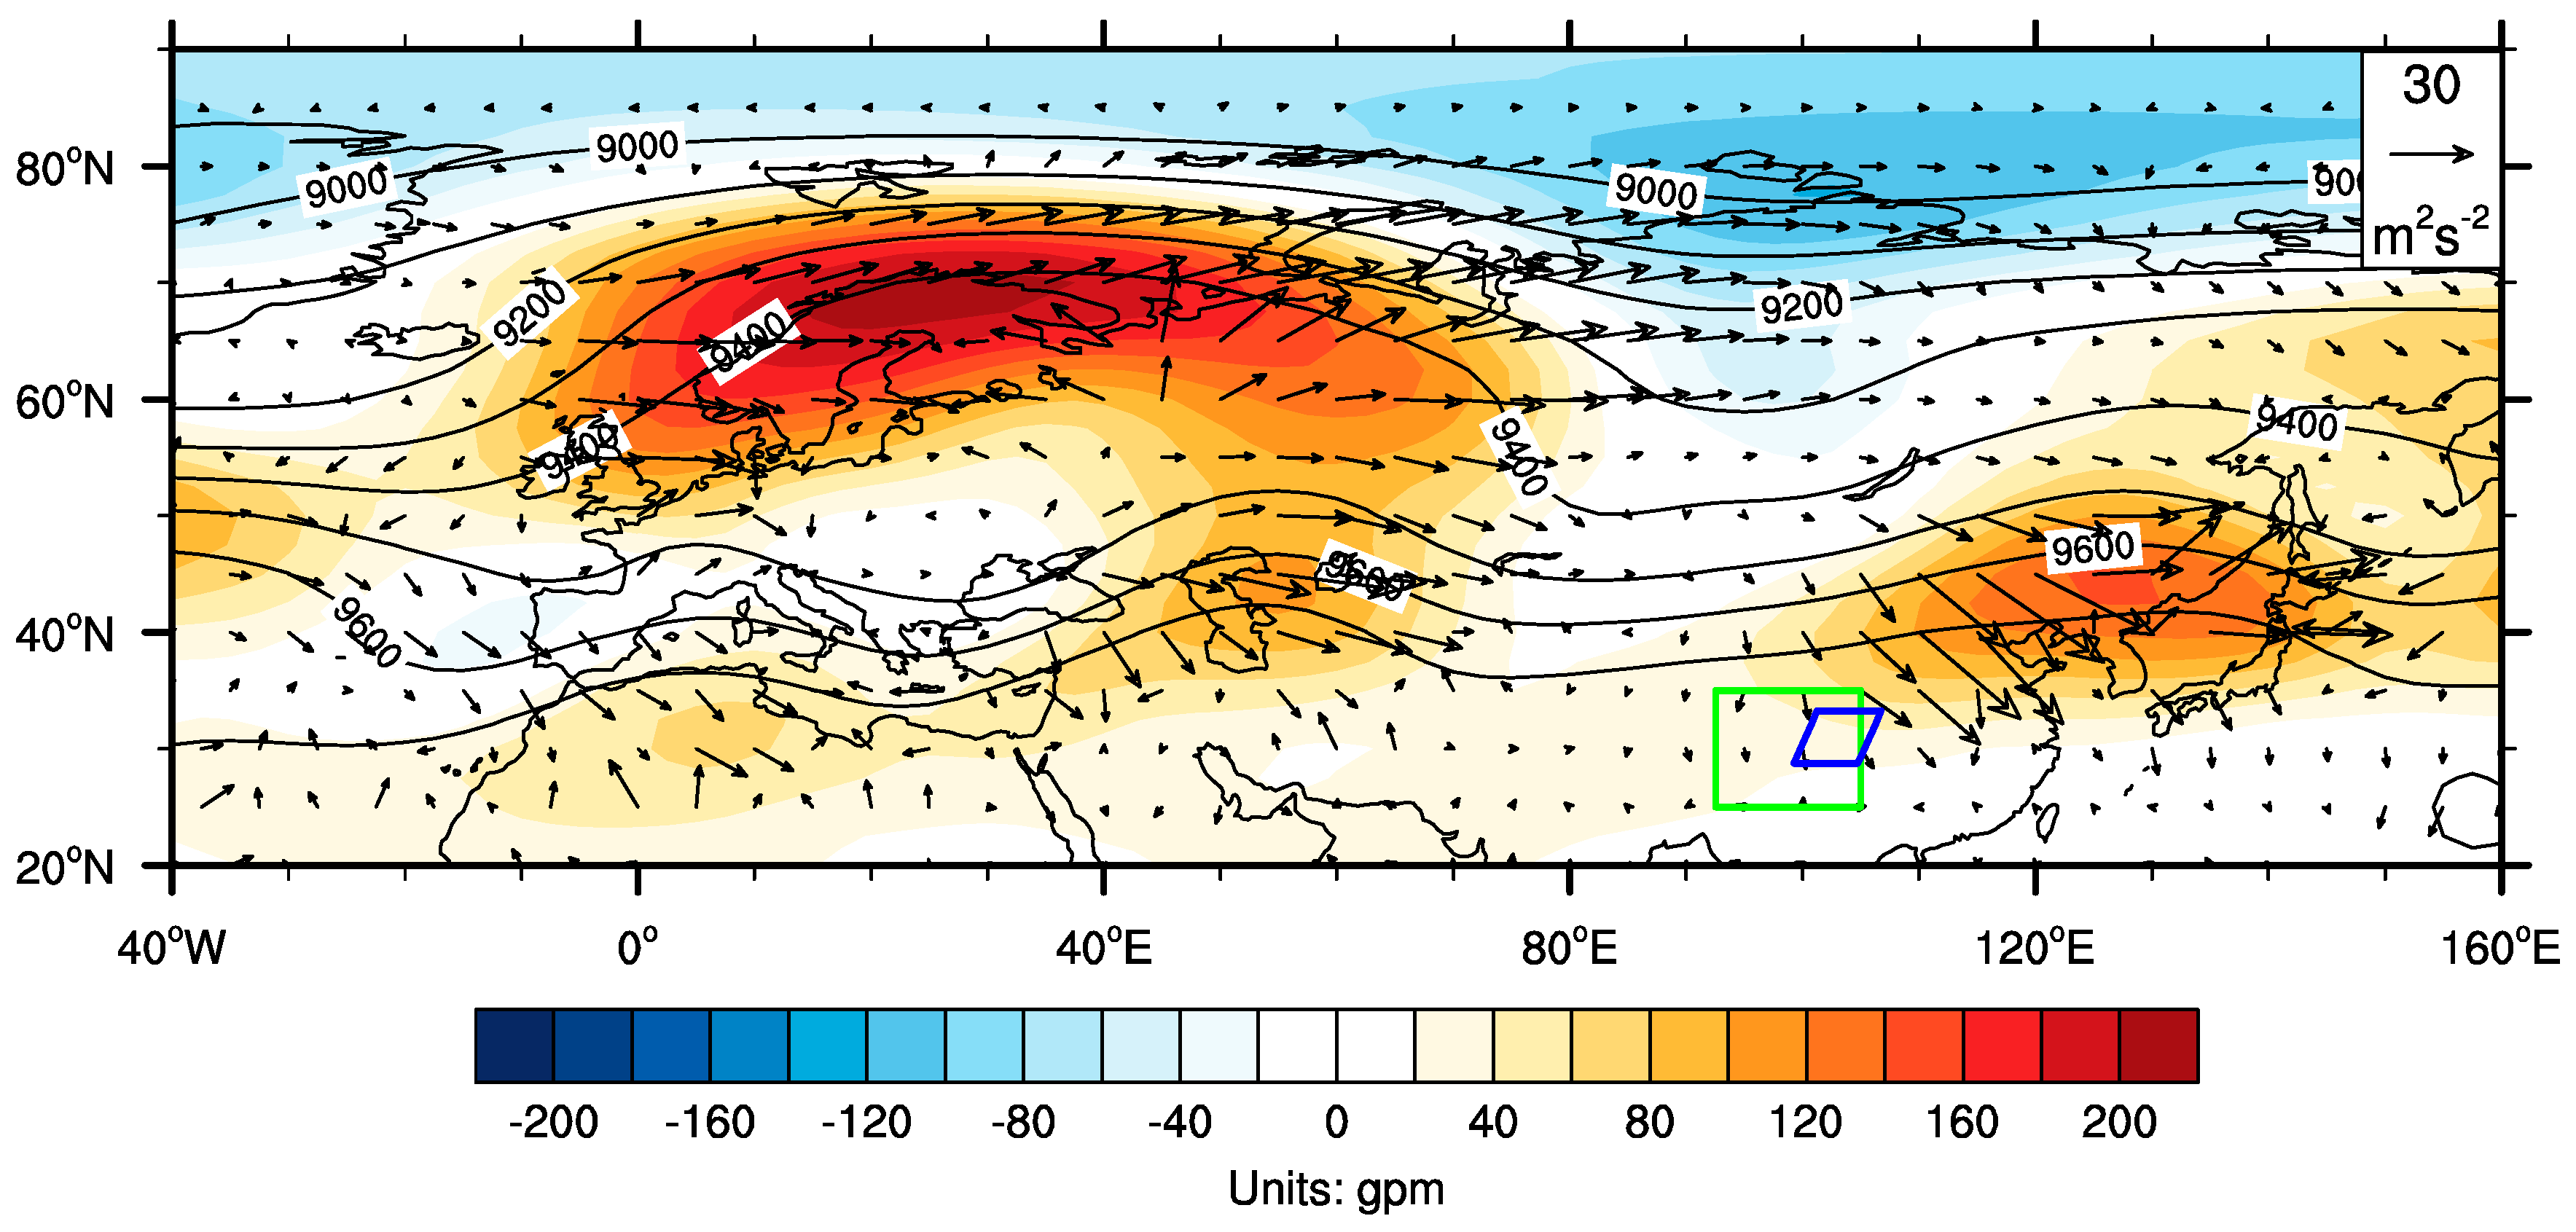
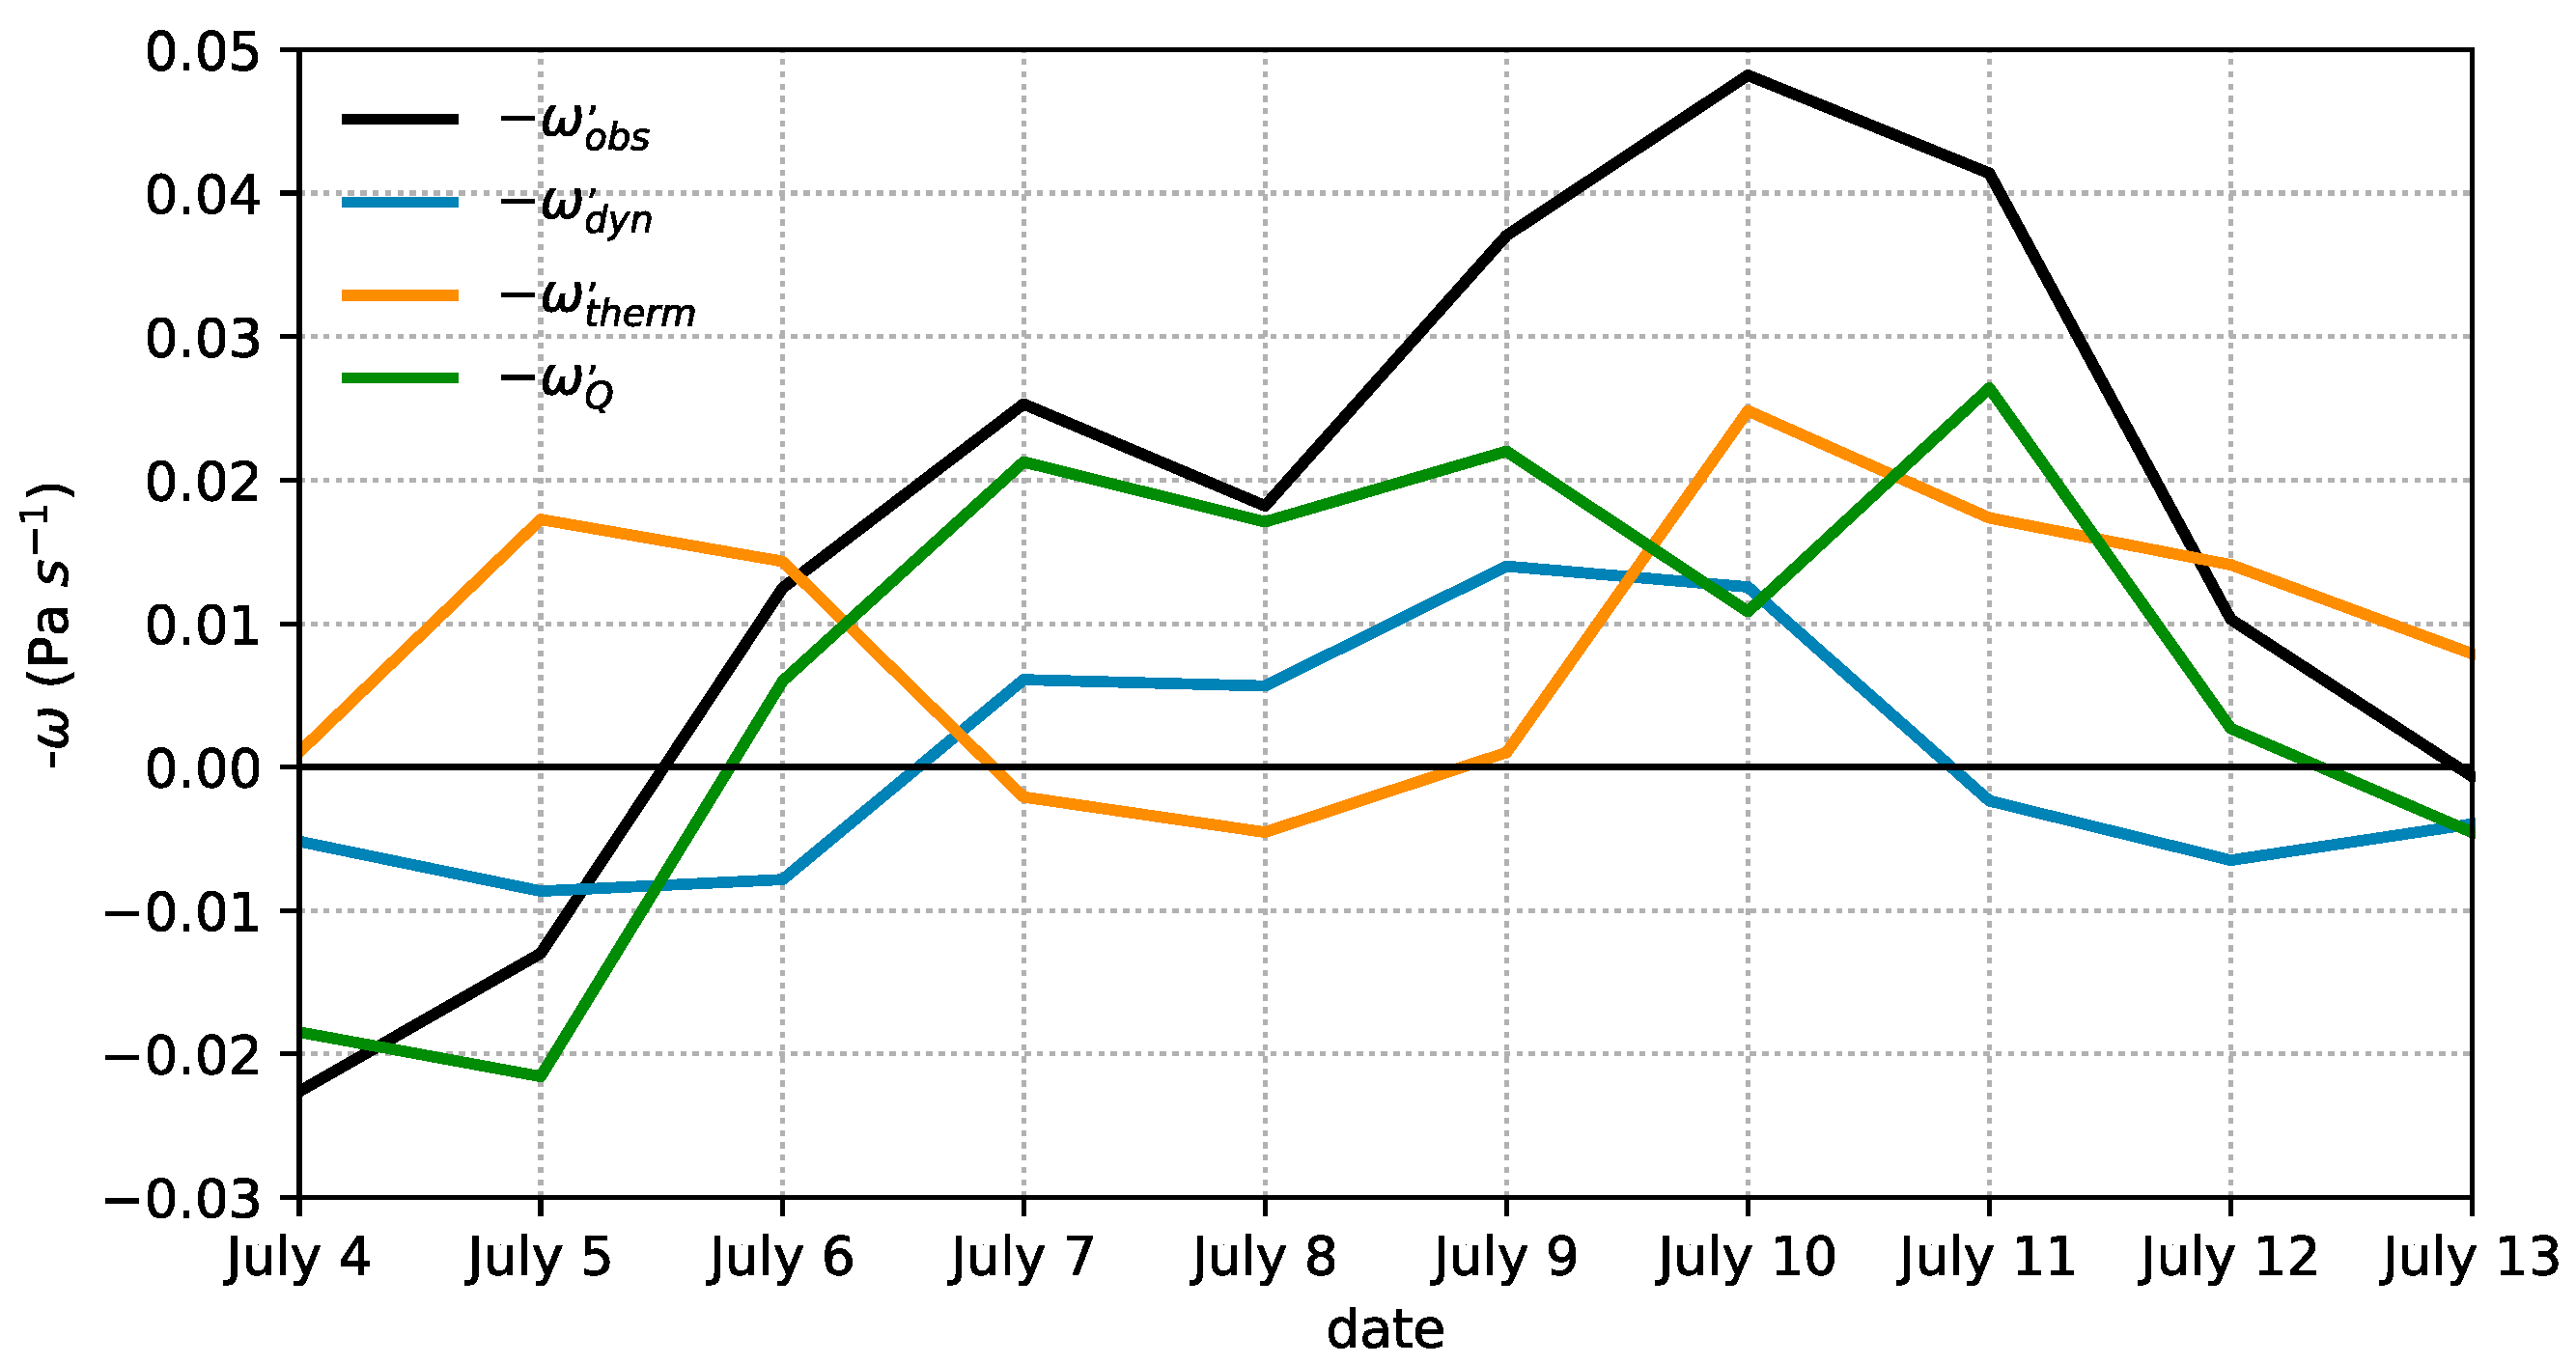
4.2. Flood During 7–11 July
5. Conclusions
Author Contributions
Funding
Acknowledgements
Conflicts of Interest
References
- Ding, Y.H.; Chan, J.C.L. The East Asian summer monsoon: An overview. Meteor. Atmos. Phys. 2005, 89, 117–142. [Google Scholar]
- Huang, R.H.; Chen, J.L.; Wang, L.; Lin, Z.D. Characteristics, processes, and causes of the spatio-temporal variabilities of the East Asian monsoon system. Adv. Atmos. Sci. 2012, 29, 910–942. [Google Scholar] [CrossRef]
- Ding, Y.H.; Hu, G.Q. A study on water vapor budget over China during the 1998 severe flood periods. Acta Meteor. Sinica 2003, 61, 129–145. (in Chinese). [Google Scholar]
- Jiao, M.Y.; Yao, X.X.; Zhou, B.; Yang, K.M. An Analysis on Cause of Formation of Huaihe River Basin Flood in 2003; China Meteorological Press: Beijing, China, 2004; p. 212.
- Cen, S.X.; Gong, Y.F.; Wang, X. The relationship between the atmospheric low-frequency oscillation over Asia and the flood in the Huaihe River valley in the summer of 2007. Chin. J. Atmos. Sci. 2009, 33, 1286–1296. [Google Scholar]
- Gu, W.; Chen, L.J. Characteristics of atmospheric and oceanic condition and their influences on summer climate of China in 2018. Meteor. Mon. 2019, 45, 126–134. [Google Scholar]
- Chen, L.J.; Gu, W.; Gong, Z.S.; Ren, H.L. Precursory signals of the 2018 summer climate in China and evaluation of the real-time prediction. Meteor. Mon. 2019, 45, 548–559. [Google Scholar]
- Chen, L.J.; Gu, W.; Li, W.J. Characteristics of the strong East Asian summer monsoon in 2018 and mechanisms behind. J. Meteor. Res. 2019. [Google Scholar] [CrossRef]
- Zhong, H.L.; Gao, G. China climate impact assessment. National Climate Center, China Meteorological Administration. 17 July 2018. Available online: https://cmdp.ncc-cma.net/upload/upload2/yxpj/ qhpj_m180700.doc (accessed on 16 April 2019).
- Sichuan Provincial Meteorological Bureau. Forecast and service of the heavy rainfall during 8–12 July 2018 in Sichuan Provincial Meteorological Bureau: A summary.
- Huang, R.H.; Wu, Y.F. The influence of ENSO on the summer climate change in China and its mechanism. Adv. Atmos. Sci. 1989, 6, 21–32. [Google Scholar]
- Kosaka, Y.; Xie, S.P.; Lau, N.C.; Vecchi, G.A. Origin of seasonal predictability for summer climate over the Northwestern Pacific. P. Natl. Acad. Sci. 2013, 110, 7574–7579. [Google Scholar] [CrossRef]
- Nitta, T. Convective activities in the tropical western Pacific and their impact on the Northern-hemisphere summer circulation. J. Meteor. Soc. Jpn. 1987, 65, 373–390. [Google Scholar] [CrossRef]
- Huang, R.H.; Li, W.J. Influence of the heat source anomaly over the western tropical Pacific on the subtropical high over East Asia. In Proceedings of the International Conference on the General Circulation of East Asia, Chengdu, China, 10–15 April 1987; pp. 40–51. [Google Scholar]
- Yang, R.W.; Tao, Y.; Cao, J. A mechanism for the interannual variation of the early summer East Asia-Pacific teleconnection wave train. Acta Meteor. Sinica 2010, 24, 452–458. [Google Scholar]
- Xu, P.Q.; Wang, L.; Chen, W.; Feng, J.; Liu, Y.Y. Structural changes in the Pacific-Japan pattern in the late 1990s. J. Clim. 2019, 32, 607–621. [Google Scholar] [CrossRef]
- Yang, R.W.; Xie, Z.A.; Cao, J. A dynamic index for the westward ridge point variability of the western Pacific subtropical high during summer. J. Clim. 2017, 30, 3325–3341. [Google Scholar] [CrossRef]
- Yang, R.W.; Gui, S.; Cao, J. Bay of Bengal–East Asia–Pacific teleconnection in Boreal summer. J. Geophys. Res. Atmos. 2019, 124. [Google Scholar] [CrossRef]
- Gu, W.; Li, C.Y.; Wang, X.; Zhou, W.; Li, W.J. Linkage between mei-yu precipitation and North Atlantic SST on the decadal timescale. Adv. Atmos. Sci. 2009, 26, 101–108. [Google Scholar] [CrossRef]
- Li, F.; Lin, J.; He, L.F. The abnormal activity of the westerlies system and its impacts on 2003 summer heavy rainfall over Huaihe basins. J. Appl. Meteor. Sci. 2006, 17, 303–309. [Google Scholar]
- Zhang, Q.Y.; Tao, S.Y. Influence of Asian mid-high latitude circulation on East Asian summer rainfall. Acta Meteor. Sinica 1998, 56, 199–211. [Google Scholar]
- Wang, L.; Gu, W. The Eastern China flood of June 2015 and its causes. Sci. Bull. 2016, 61, 178–184. [Google Scholar] [CrossRef]
- Kosaka, Y.; Chowdary, J.S.; Xie, S.P.; Min, Y.M.; Lee, J.Y. Limitations of seasonal predictability for summer climate over East Asia and the Northwestern Pacific. J. Clim. 2012, 25, 7574–7589. [Google Scholar] [CrossRef]
- Xu, P.Q.; Wang, L.; Chen, W. The British-Baikal Corridor: A teleconnection pattern along the summertime polar front jet over Eurasia. J. Clim. 2019, 32, 877–896. [Google Scholar] [CrossRef]
- Yang, R.W.; Wang, J. Interannual variability of the seesaw mode of the interface between the Indian and East Asian summer monsoons. Clim. Dyn. 2019. [Google Scholar] [CrossRef]
- Kalnay, E.; Kanamitsu, M.; Kistler, R.; Collins, W.; Deaven, D.; Gandin, L.; Iredell, M.; Saha, S.; White, G.; Woollen, J.; et al. The NCEP/NCAR 40-year reanalysis project. Bull. Amer. Meteor. Soc. 1996, 77, 437–471. [Google Scholar] [CrossRef]
- Wang, L.J.; Wang, L.; Liu, Y.Y.; Chen, W. The 2017-2018 winter drought in North China and its causes. Atmosphere 2019, 10, 60. [Google Scholar] [CrossRef]
- Gu, W.; Wang, L.; Hu, Z.Z.; Hu, K.M.; Li, Y. Interannual variations of the first rainy season precipitation over South China. J. Clim. 2018, 31, 623–640. [Google Scholar] [CrossRef]
- Liebmann, B.; Smith, C.A. Description of a complete (interpolated) outgoing longwave radiation dataset. Bull. Amer. Meteor. Soc. 1996, 77, 1275–1277. [Google Scholar]
- Cao, J.; Yao, P.; Wang, L.; Liu, K. Summer rainfall variability in low-latitude highlands of China and subtropical Indian ocean dipole. J. Clim. 2014, 27, 880–892. [Google Scholar] [CrossRef]
- Zhang, R.H.; Min, Q.Y.; Su, J.Z. Impact of El Niño on atmospheric circulations over East Asia and rainfall in China: Role of the anomalous western North Pacific anticyclone. Sci. China Earth Sci. 2017, 60, 1124–1132. [Google Scholar] [CrossRef]
- Xie, S.P.; Kosaka, Y.; Du, Y.; Hu, K.M.; Chowdary, J.; Huang, G. Indo-Western Pacific Ocean capacitor and coherent climate anomalies in post-ENSO summer: A review. Adv. Atmos. Sci. 2016, 33, 411–432. [Google Scholar] [CrossRef]
- Li, T.; Wang, B.; Wu, B.; Zhou, T.J.; Chang, C.P.; Zhang, R.H. Theories on formation of an anomalous anticyclone in western north Pacific during El Niño: A review. J. Meteor. Res. 2017, 31, 987–1006. [Google Scholar] [CrossRef]
- Holton, J.R. An Introduction to Dynamic Meteorology; 4th Edition; Academic Press: San Diego, CA, USA, 2004; p. 535. [Google Scholar]
- Takaya, K.; Nakamura, H. A formulation of a phase-independent wave-activity flux for stationary and migratory quasigeostrophic eddies on a zonally varying basic flow. J. Atmos. Sci. 2001, 58, 608–627. [Google Scholar] [CrossRef]
- Hu, K.M.; Xie, S.P.; Huang, G. Orographically anchored El Niño effect on summer rainfall in Central China. J. Clim. 2017, 30, 10037–10045. [Google Scholar] [CrossRef]


© 2019 by the authors. Licensee MDPI, Basel, Switzerland. This article is an open access article distributed under the terms and conditions of the Creative Commons Attribution (CC BY) license (http://creativecommons.org/licenses/by/4.0/).
Share and Cite
Wang, L.; Wang, L.; Liu, Y.; Gu, W.; Xu, P.; Chen, W. The Southwest China Flood of July 2018 and Its Causes. Atmosphere 2019, 10, 247. https://doi.org/10.3390/atmos10050247
Wang L, Wang L, Liu Y, Gu W, Xu P, Chen W. The Southwest China Flood of July 2018 and Its Causes. Atmosphere. 2019; 10(5):247. https://doi.org/10.3390/atmos10050247
Chicago/Turabian StyleWang, Lijuan, Lin Wang, Yuyun Liu, Wei Gu, Peiqiang Xu, and Wen Chen. 2019. "The Southwest China Flood of July 2018 and Its Causes" Atmosphere 10, no. 5: 247. https://doi.org/10.3390/atmos10050247
APA StyleWang, L., Wang, L., Liu, Y., Gu, W., Xu, P., & Chen, W. (2019). The Southwest China Flood of July 2018 and Its Causes. Atmosphere, 10(5), 247. https://doi.org/10.3390/atmos10050247