Article

Structural Characteristics of the Yangtze-Huaihe Cold Shear Line over Eastern China in Summer

1
Chinese Academy of Meteorological Sciences, Beijing 100081, China
2
China Meteorological Administration Training Centre, Beijing 100081, China
*
Author to whom correspondence should be addressed.
Atmosphere 2019, 10(4), 207; https://doi.org/10.3390/atmos10040207
Submission received: 8 April 2019 / Revised: 15 April 2019 / Accepted: 17 April 2019 / Published: 19 April 2019
(This article belongs to the Section Meteorology)

Abstract

:
Based on ERA-Interim data from June to July during 1981–2016 and daily meteorological dataset of China Surface Meteorological Stations (V3.0), 10 typical Yangtze-Huaihe cold shear lines (YCSL) over eastern China (28°~34° N, 110°~122° E) in summer are selected, and the structural characteristics of the YCSL during the evolution process are investigated by the composite analysis. The results indicate that the YCSL is horizontally in a northeast–southwest direction and vertically inclines northward from the lower layer to the upper layer. The vertical extension of the YCSL can reach 750 hPa, and its life time is about 54 h. The evolution process of the YCSL is affected by the comprehensive configuration of the high-level, medium-level, and low-level weather systems. The southward advancement, strengthening, and eastward movement of the north branch low-pressure trough over the Yangtze-Huaihe region at 850 hPa is a key factor for the evolution of the YCSL. Because the structural characteristics of the YCSL have obvious changes in the evolution process, the evolution process can be divided into the development stage, strong stage, and weakening stage. In terms of dynamic structures, the YCSL corresponds well with the axis of the positive vorticity belt, whose center is located at 850 hPa, and reaches the maximum in the strong stage. The YCSL is located in the non-divergence zone, and there are strong convergence centers located on its south side. The YCSL also locates in the ascending motion zone between two secondary circulations on the north and south sides, with the maximum ascending velocity in the strong stage, and its large-value area presents an upright structure. In the development stage, there is an ascending motion along the YCSL, but in the strong and weakening stages there are an ascending motion below 800 hPa and a descending motion above 800 hPa along the YCSL. In terms of thermal structures, the YCSL is located in the low temperature zone of the lower layer, and there is a high temperature zone around 500 hPa. Due to the dominant role of dry and cold airflow from the north, the YCSL locates in the dry and cold air during the development and strong stages, and then the warm and moist airflow from the south invades, resulting in the weakening of the YCSL. There is a convective unstable layer on the south side of the YCSL and a neutral layer on the north side. The water vapor gathers near the YCSL, and there are two water vapor convergence centers on the east and west sides of the YCSL, respectively. The water vapor convergence zone is mainly below 600 hPa in the low troposphere and the convergence center is located at around 900 hPa. The atmospheric baroclinicity is one of the reasons for the northward inclination of the YCSL.

1. Introduction

Every summer from mid-June to mid-July, continuous rain often appears over the Yangtze-Huaihe region (28°~34° N, 110°~122° E) of eastern China. It is called the Yangtze-Huaihe Meiyu period [1,2,3,4,5]. In the same period, Japan and Korea also have similar weather to the Meiyu in China, which are called Baiu [6,7,8] and Chang-ma [9,10], respectively. As early as the 1950s, Tao [11] and Ye et al. [12] have pointed out that the seasonal rainy season in East Asia in late spring and early summer is associated with the East Asian atmospheric circulation and is one of the East Asian monsoon phenomena. As the summer monsoon moves northward, the Meiyu rain belt establishes successively in South China, Taiwan, the Yangtze-Huaihe River basin, Japan, and the Korean Peninsula since the end of May, which is called the Yangtze-Huaihe Meiyu by Chinese scholars [13,14,15,16]. Baiu, Chang-ma, and Meiyu are only regionally different in location, time and duration [17], whereas the nature of the precipitation is essentially the same [18,19,20,21,22]. Subsequently, studies not only focus on the spatio-temporal structure of the Meiyu rainband [23,24], but also on the close relationship between the East Asian monsoon and the Yangtze-Huaihe Meiyu [25,26,27,28,29]. As one of the most striking characteristics of the East Asia monsoon climate, the study of the Yangtze-Huaihe Meiyu can not only provide a basis for the forecast of Meiyu rainstorms in China, but also could deepen the understanding of the whole East Asian monsoon system and reduce the disasters caused by monsoon anomalies in East Asian countries [30].
Yangtze-Huaihe shear line is a representative weather system that causes rainstorms in the Meiyu period [31]. The shear line is a discontinuous line of winds with the cyclone shear in the lower troposphere (700 hPa or 850 hPa) [32]. According to the stream field and moving direction, it can be divided into three kinds, that is, warm shear line, cold shear line, and quasi-static shear line. A special case is that when the shear line is accompanied by a vortex, it can be called “vortex shear line” [33]. It is found that because the Yangtze-Huaihe shear line can cause a wide-range horizontal convergence of low-altitude airflows and form a continuous uplift movement, so it plays an important role in the formation of cloud and precipitation [34]. There are mesoscale systems occurring and developing in the vicinity of Yangtze-Huaihe shear lines, and some of them can cause heavy rainstorms [35,36]. The stagnation, strengthening, and movement of the Yangtze-Huaihe shear line in the Yangtze-Huaihe region tend to result in a long-term and continuous rainstorm [37].
Ma [38,39] studied the Yangtze-Huaihe shear line and rainstorms from June to July of 1981–2013 and found that the contribution of rainstorm precipitation caused by Yangtze-Huaihe cold shear lines (YCSL) to the total rainstorm precipitation caused by Yangtze-Huaihe shear lines reaches 25%. Moreover, since the first half of the vortex shear line is a warm shear line and the second half is a cold shear line, the rainstorm caused by the Yangtze-Huaihe vortex shear line is also related to the YCSL in essence. Therefore, in general, the Yangtze-Huaihe rainstorm precipitation related to the YCSL exceeds 50%. As a kind of important shear line causing the Yangtze-Huaihe Meiyu, it is necessary to deeply understand the evolution and mechanism of the rainstorms caused by the YCSL through exploring its structural characteristics and evolution process. The research of the YCSL showed that it is a shear between the northeasterly wind and the southwesterly wind. The cold air is strong while the warm air is weak, and the cold air pushes the warm air southward, often accompanied by high- and low-level fronts and the ground-rushing cold front [40]. The lower layer of YCSL has obvious northeasterly airflow cold cushion, and its physical quantity field slopes northward from lower layer to upper layer [41]. At the same time, the maintenance and development of the YCSL is closely related to the latent heat of condensation produced by precipitation in the Meiyu period [42,43].
In summary, the previous research on the YCSL mainly adopted the method of individual case analysis, which is limited to a typical case of the Yangtze-Huaihe Meiyu. It is inevitable that there were limitations in the cognition of the YCSL. Moreover, the identification of YCSL was mainly based on subjective identification and there were relatively few studies on the structural characteristics of the YCSL in different evolution processes. Therefore, this paper uses objective identification to select typical cases of YCSL during the Meiyu period from June to July of 1981–2016, and the structural characteristics of the composited YCSL are analyzed by composite analyses. As a consequence, a more universal conclusion different from the individual case analysis is given. It can not only provide a reference for the forecast of Meiyu rainstorms caused by the YCSL, but also helps more deeply understand the East Asian monsoon system.

2. Data and Methods

2.1. Data

The data used in this paper is the ECMWF reanalysis Interim data (ERA-Interim) [44] from June to July of 1989–2016 with a time resolution of four times daily and a spatial resolution of 1° × 1°, which includes wind, geopotential height, temperature, and relative humidity fields. The precipitation data from daily meteorological dataset of China Surface Meteorological Stations (V3.0) is also adopted, which is the cumulative precipitation of 24 h at 12:00 (UTC, the same as below).

2.2. Methods

2.2.1. Objective Identification of the YCSL

The identification of the YCSL is based on the objective identification method proposed by Ma [38]. The three parameters at 850 hPa used to determine the shear line are the meridional shear of zonal wind, the relative vorticity, and the zonal zero wind speed line.
u y < 0 ,   ς > 0 ,   u = 0
where u is the zonal wind speed, y is the north-south coordinate, and ς = v x u y is the relative vorticity.

2.2.2. Composite Analysis of the YCSL

The YCSLs used for composite analyses need to meet the following conditions:
(1) The YCSL is a shear between the northeasterly wind and the southwesterly wind;
(2) The YCSL is located in the Yangtze-Huaihe region (28°~34° N, 110°~122° E) and its east-west span is at least three longitudes;
(3) In the Yangtze-Huaihe region, rainstorms (cumulative precipitation in 24 h ≥ 50 mm) occur in at least 5 stations, and the YCSL is located near the rainstorm zone.
According to the above requirements, 10 cases of YCSLs with similar locations were selected. The occurrence date and the number of rainstorm stations are shown in Table 1. Based on these cases, their basic physical quantities were averaged arithmetically, and finally the composited YSCL was obtained based on the arithmetic averaged data. All the pictures drawn below are the composited YSCL.

3. Evolution Process of the YCSL

Using the composited data and based on the conditions in Section 2.2.2, we finally determined that the composited YSCL lasted 10 times. Because the time interval of every two times is 6 h, the life history of the YSCL is 54 h. In addition, the relative vorticity at 850 hPa is used to characterize the intensity of the YCSL. Figure 1 shows the variation of the area average relative vorticity at 850 hPa in the Yangtze-Huaihe region (28°~34° N, 110°~122° E, box in Figure 2a). The interval between each time is 6 h. The first to the fourth times are the development stage of the YCSL, the fifth time is the strong stage, and the sixth to the tenth times are the weakening stage.
Seen from Figure 2a, the YCSL is northeast-southwest and horizontally moves from north to south over time. At the beginning, the YCSL is located north of 30° N and west of 116° E, and at the ending time it has moved southward to the south of 30° N. In the strong stage, the YCSL is located between 110°~121° E and 29°~34° N, with an east-west span of 21 longitudes and a north-south span of 5 latitudes.
Seen from the spatial evolution diagram in the vertical direction (Figure 2b), the maximum extension height of the YCSL reaches near 750 hPa, corresponding to the seventh time. Furthermore, the YCSL is inclined northward from lower layer to upper layer, which is consistent with previous case studies [41].
In order to facilitate the analysis, the first time, fifth time, and ninth time are selected as the representative time of the development stage, the strong stage and the weakening stage of the YCSL, and the interval is 24 h.

4. Circulation Characteristics of the YCSL

4.1. Circulation Characteristics at 850 hPa

Because 850 hPa is the characteristic height of the YCSL, the circulation situation at 850 hPa is firstly considered. As shown in Figure 3a, in the development stage, there is a north branch low-pressure trough (referred to as north branch trough, the same as below) around 113° E, 32° N. The YCSL is the shear between the strong southwesterly airflow and the east wind on the north side of the north branch trough. In this stage, the east wind is weak. While in the strong stage (Figure 3b), the east wind turns into a strong northeasterly wind, and the YCSL consisted of it and the southwesterly airflow is also enhanced accordingly. The YCSL extends from the cold low vortex on the northeast side, and the low-pressure trough moves northeastward and becomes narrower and longer. Due to the strong cold air from the north, the YCSL is pushed southward. It can also be seen from the figure that there is a low-level jet stream parallel to the YCSL on the south side.
In the weakening stage (Figure 3c), the north branch trough weakens, while the southwesterly airflow retreats southward. Most regions in the Yangtze-Huaihe region is controlled by the northeasterly wind, and the YCSL weakens and moves southward accordingly.

4.2. Circulation Characteristics at 500 hPa and 200 hPa

The 500 hPa circulation situation can be seen from Figure 4a1, in the development stage, the West Pacific subtropical high (WPSH) is east–west zonally distributed, and the 588 dagpm line edge reaches the southern China. The Lake Baikal is controlled by the high-pressure ridge and there is a low-pressure trough in Northeast China. In the strong stage (Figure 4a2), the WPSH is stable and lack of movement, while the high-pressure ridge in the Baikal region strengthens and moves eastward. There is an obvious blocking situation in the upper layer, and the southern section of the trough is blocked and rotates clockwise gradually, resulting in the low-pressure trough extending from the northeastern China to the Yangtze-Huaihe region. At this time, the meridional circulation strengthens, and the angle between the isoheight line and the isotherm line becomes larger. Therefore, the cold air behind the low-pressure trough is continuously transported from north to the south by the northerly wind, and converges with the warm and humid air from the southwest of the WPSH, resulting rainstorms in the Yangtze-Huaihe region. The increase of the meridional circulation at 500 hPa also corresponds to the increase of the north wind component at 850 hPa on the north side of the YCSL. In the weakening stage (Figure 4a3), the temperature and pressure fields are close to coincidence, so the dynamic and thermal factors are rapidly weakened, which is not conducive to the development of the system. Generally speaking, the development of the YCSL appears in the background of the WPSH stabilization and the deepening of upper-level trough and ridge.
Previous studies have shown that the East Asian summer upper-level jet stream is an important weather system affecting East Asia, especially its interaction with the low-level jet stream is related to the heavy rainfall [45,46]. Figure 4b shows the distribution of the upper-level jet stream, wind, and divergence fields at 200 hPa. The axis of the upper-level jet stream shows an east–west trend, the upper air over the Yangtze-Huaihe region is basically controlled by the westerly wind. The westerly wind strengthens from south to north and shows a divergent structure. In the development stage of the YCSL (Figure 4b1), the upper-level jet stream core is located in the Bohai region, and it is divergent over most of the Yangtze-Huaihe region. In the strong stage (Figure 4b2), the upper-level jet stream core moves eastward to the Korean peninsula, and the maximum wind speed in the center of the jet stream increases over 45 m/s. The divergent zone moves to the south side of the YSCL. Referring to Figure 3b, the low-level jet stream on 850 hPa also locates close to the position. The convergence zone caused by the low-level jet stream overlaps with the upper level divergent zone, so that the vertical motion of the synoptic scale can be continuously developed.
Studies have shown that the coupling of high-level and low-level jet streams is closely related to rainstorm. Generally speaking, in the south of the YSCL, the right side of the high-level jet stream entrance area and the left front side of the low-level jet stream exit area are prone to forming heavy rainstorms [47]. By analyzing the precipitation of 10 cases in Table 1, it is found that the rainstorm caused by the YSCL has the following characteristics: the rainstorm belt distributes along the YSCL, and the rainstorm area moves southward with the YSCL (not shown). Because the composited precipitation is very complex, we will not discuss it in depth in this article.
Based on the above analysis, the 850 hPa north branch trough is the key factor for the evolution of the YCSL. The YCSL increases with the strengthening and southward movement of the north branch trough, and decreases with its weakening. At the same time, the rational allocation and interaction among the low-level, middle-level, and high-level weather systems promote the development of the YCSL. Coupling of the upper-level and low-level jet stream provides dynamic conditions conducive to ascent. The increasing meridional pressure gradient at 500 hPa is more favorable for the reinforcement of the lower layer (850 hPa) northeasterly wind and the north branch low-pressure trough. The combination of these factors leads to the strengthening of the YCSL.
Therefore, the evolution of the YCSL is not only related to the weather systems near the YCSL, but also related to the middle-level and high-level weather systems. The appropriate configuration of weather systems in different levels has a comprehensive impact on the evolution of the YCSL.

5. Evolution Characteristics of the YCSL’s Dynamic Structure

5.1. Horizontal Direction

Studies on the Yangtze-Huaihe shear line’s dynamic structure mainly focus on vorticity and divergence. By individual case analysis, it is found that the positive vorticity zone in the middle and lower troposphere is matched with the Yangtze-Huaihe shear line, and there are distributions of high-level divergence and low-level convergence [48,49]. Figure 5a shows the vertical component of relative vorticity at 850 hPa. In the development stage (Figure 5a1), the YCSL is located in the positive vorticity zone, showing a northeast–southwest direction, and there are two maximum vorticity centers located at 113° E, 31° N and 118° E, 33° N. In the strong stage (Figure 5a2), the positive vorticity centers move to the northeast and strengthen. The maximum vorticity reaches 6 × 10 5 s 1 . In the weakening stage (Figure 5a3), the vorticity center on the right side moves out of the Yangtze-Huaihe region, the maximum vorticity in the Yangtze-Huaihe region weakens to 4 × 10 5 s 1 .
Meanwhile, the YCSL is located in the non-divergence zone (Figure 5b), with a convergence belt on the south side of the YCSL. There is a strong convergence center on the west side of the YCSL, which reaches −25 × 10 6 s 1 in the strong stage (Figure 5b2).

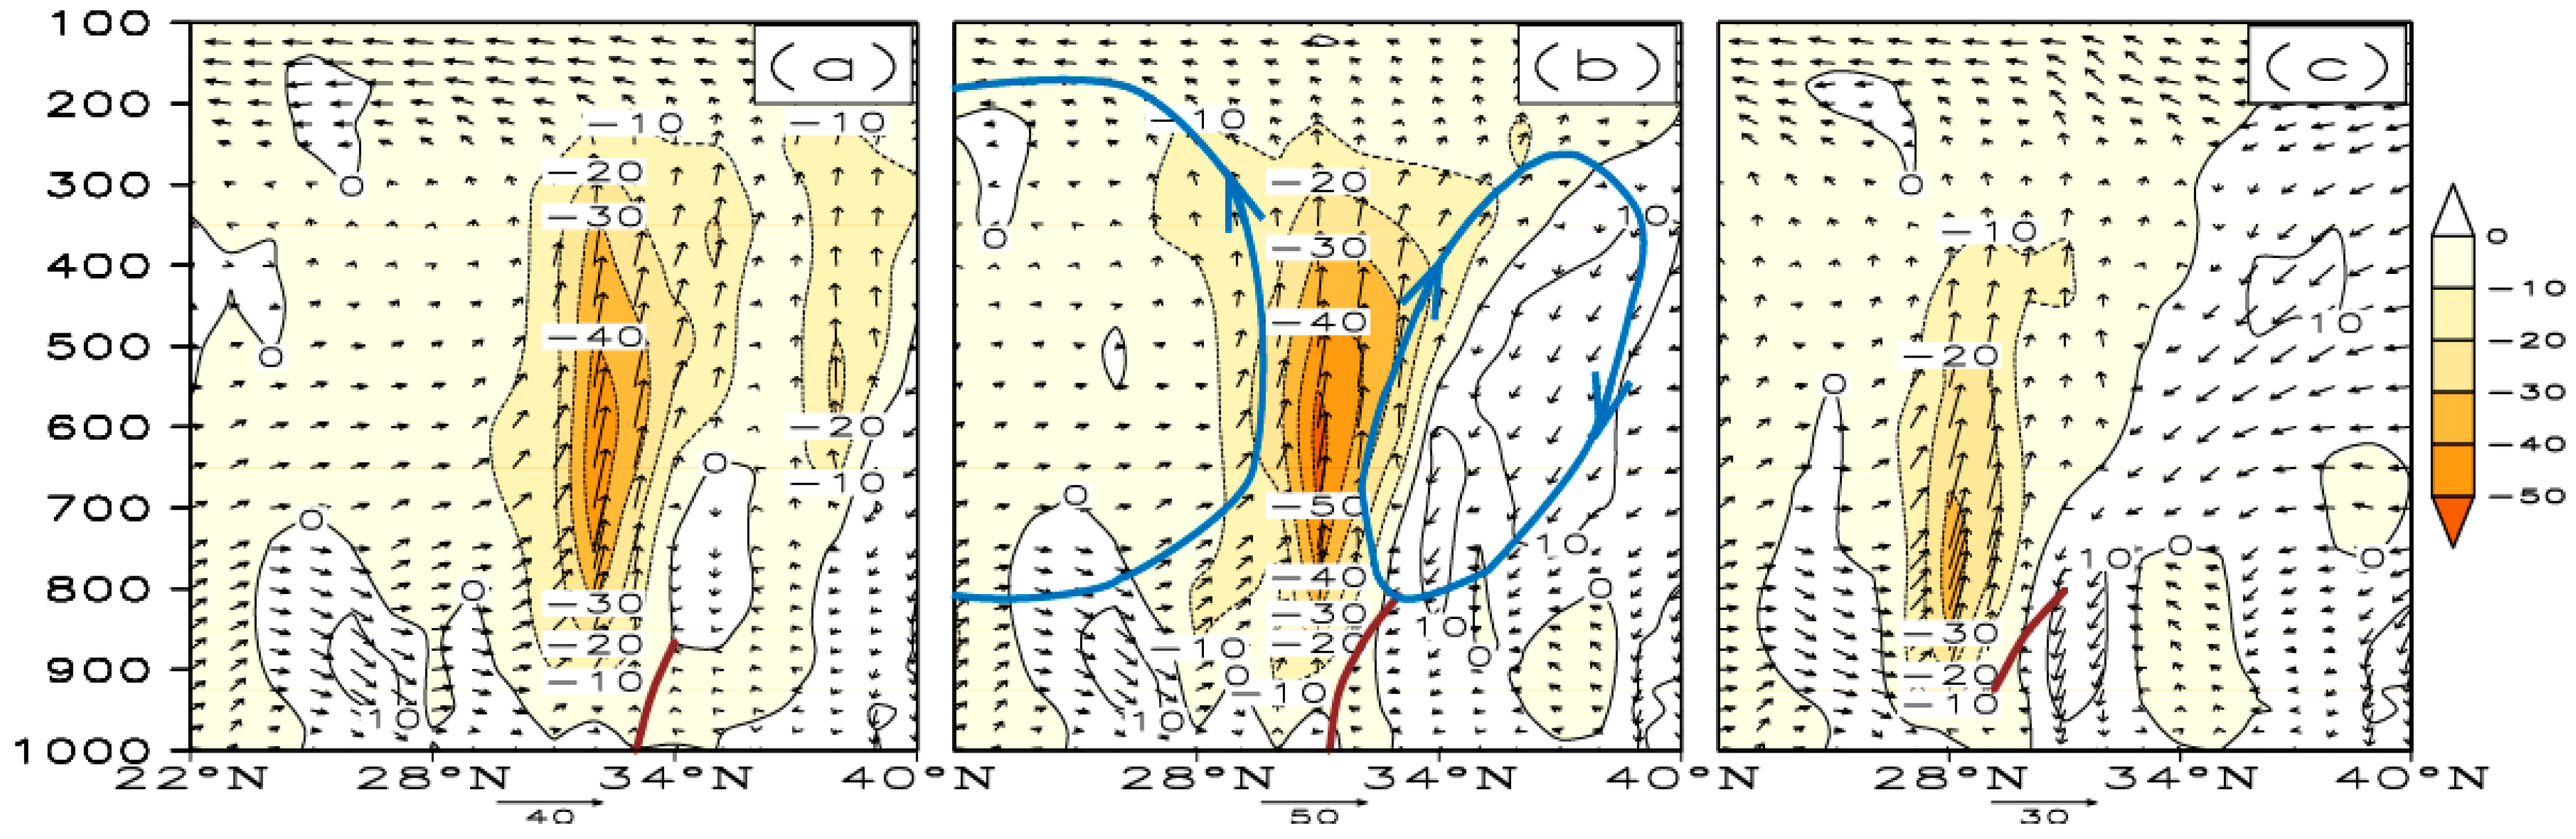
5.2. Vertical Direction

Figure 6a shows the relative vorticity along the vertical section of 115° E. The YCSL corresponds well with the positive vorticity belt, which inclines northward along the YCSL from lower layer to upper layer. The vertical vorticity belt reaches its maximum in the strong stage (Figure 6a2), with the maximum center of 6 × 10 5 s 1 at 850 hPa. Meanwhile, the upper level above 500 hPa is the negative vorticity zone.
The divergence field in the vertical direction is showed in Figure 6b. The YCSL is close to the divergence zero line. The upper layer above 500 hPa over the YCSL is divergent, and it is cooperated with the convergence field in the middle and lower layers, providing dynamic conditions conducive to the upward movement.
According to the vertical wind field near the YCSL (Figure 7), there is an indirect thermal circulation above 700 hPa on the south side of the YCSL, and a direct thermal circulation on the north side. The YCSL is located in the ascending motion zone between the two secondary circulations. The center of ascending velocity is located at around 600 hPa and reaches its maximum in the strong stage, reaching −50 × 10 2 Pa   s 1 . The positive vertical velocity zone presents an upright structure. However, in different stages, the vertical motion along the YCSL is different. In the development stage (Figure 7a), there is an ascending motion along the YCSL. In the strong stage (Figure 7b), there is still an ascending motion below 800 hPa along the YCSL, while between 800~750 hPa there is a descending motion. In the weakening stage (Figure 7c), a sinking motion occurs above 850 hPa.
To summarize, the YCSL corresponds to the positive vorticity belt, which inclines northward from the lower level to the upper level and is in northeast–southwest direction horizontally. The positive vorticity center is located near 850 hPa and reaches its maximum in the strong stage. At the same time, the YCSL is located near the non-divergence zone, and the strong convergence center is on the south side of the YCSL. The YCSL is between the indirect thermal circulation on the north side and the direct thermal circulation circle on the south side. The vertical motion center is at 600 hPa above the YCSL, and the rising speed reaches its maximum in the strong stage. In the development stage, the vertical upward movement is along the YCSL. In the strong and weakening stages, there is an upward movement below 800 hPa and a downward movement above 800 hPa along the YCSL.

6. Evolution Characteristics of the YCSL’s Thermal Structure

6.1. Thermal Structure

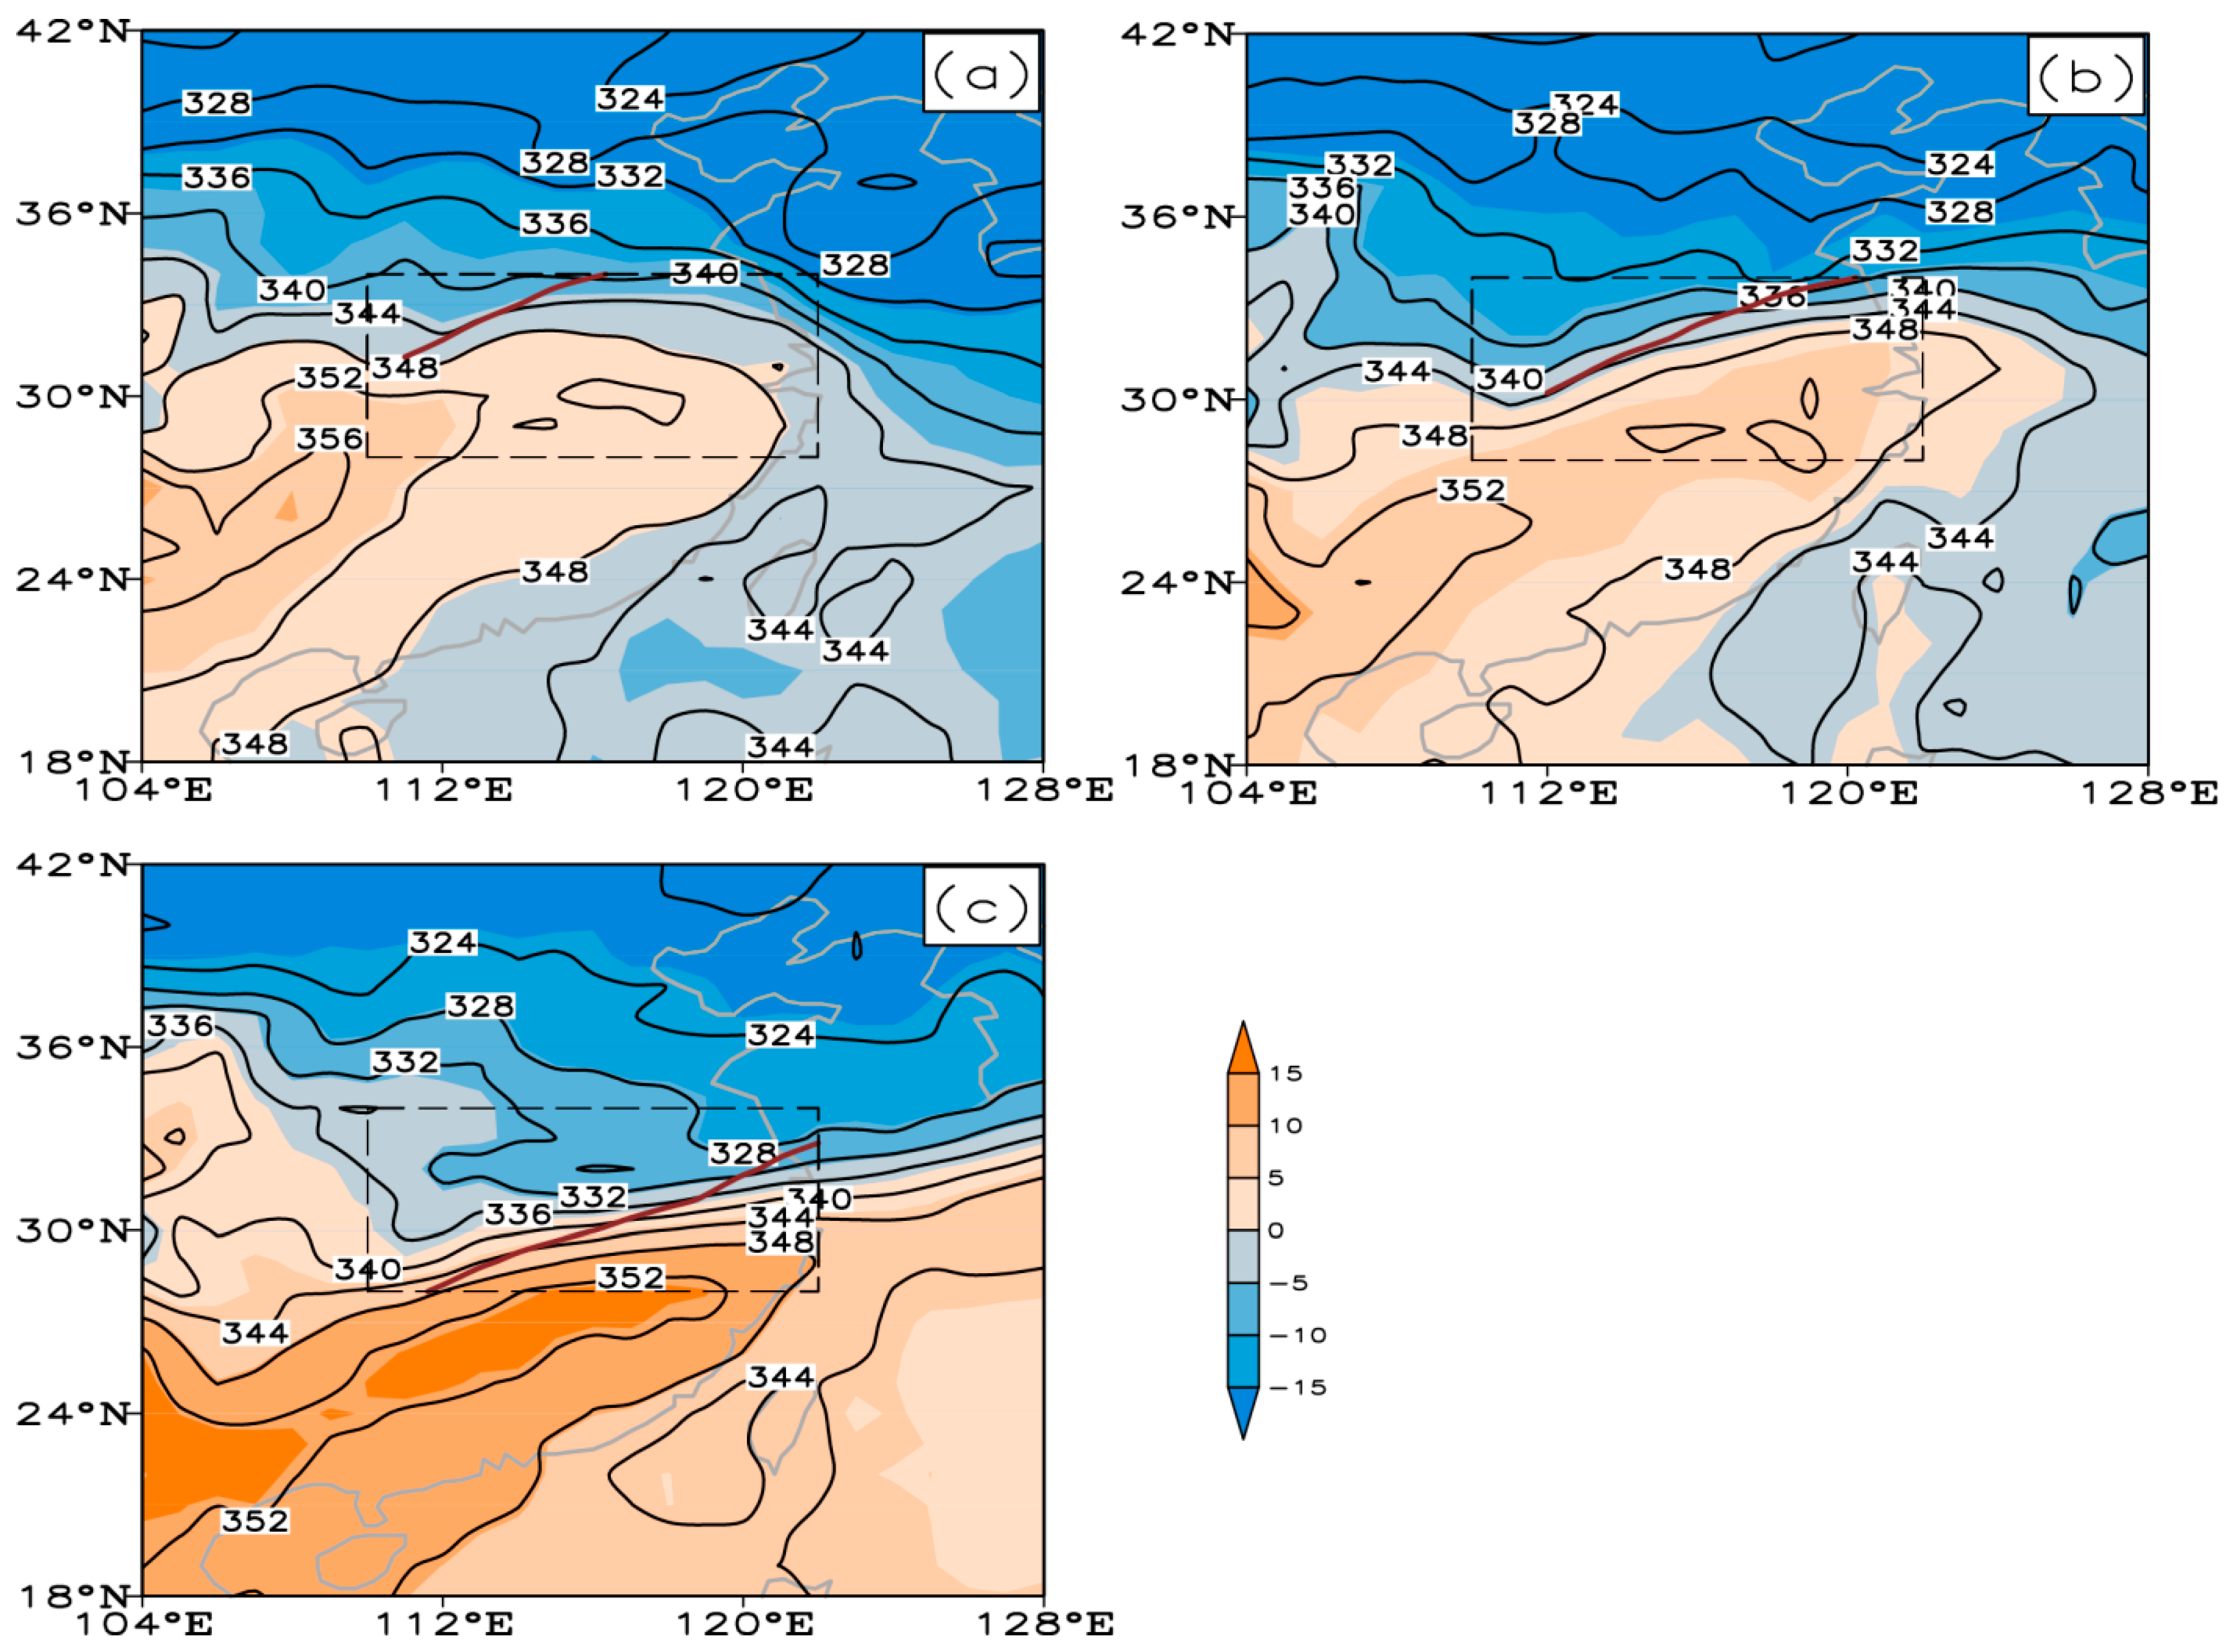
6.1.1. Horizontal Direction

The pseudo-equivalent potential temperature ( θ s e ) can synthetically represent the characteristics of temperature and humidity, and it is generally used to characterize the thermal characteristics of the Meiyu Front. Studies have shown that the front zone appears as a dense zone of θ s e on both the isobaric surface and vertical profiles. The slope of the Meiyu Front has a very steep profile, and sometimes it approaches the vertical direction or even inclines southward [50,51].
As shown in Figure 8, the YCSL is located in the area with a large meridional gradient of θ s e , where the temperature and humidity change rapidly. The shaded area represents the difference between θ s e and the average pseudo-equivalent potential temperature ( θ ¯ s e ) of the Yangtze-Huaihe region (28°~34° N, 110°~122° E). Bounded by 116° E, compared to the θ ¯ s e of the Yangtze-Huaihe region, the western section of the YCSL is located in the relatively warm and humid area on the south side and the east section is located in the relatively dry and cold area on the north side. As the warm, moist air from the south moves northward and strengthens and the dry, cold air from the north weakens (Figure 8c), the YCSL enters the weakening stage.

6.1.2. Vertical Direction

Figure 9 shows the temperature and the θ s e distribution of the YCSL in the vertical direction. It can be seen that there is an isothermal surface concave area in the lower layer (below 800 hPa), and the YCSL is located in this relatively low temperature zone. At about 500 hPa, the temperature is relatively high. Comparing the three evolution stages of the YCSL, the concave feature is the most prominent in the strong stage (Figure 9b).
According to the distribution of θ s e in the vertical direction and the difference between it and θ ¯ s e of the Yangtze-Huaihe region ( θ s e θ ¯ s e ), it can be seen that the air over the south side of the YCSL is relatively warm and moist, and the air over the north side is relatively dry and cold. In the development stage (Figure 9a), the YCSL is located in the dry and cold air; in the strong stage (Figure 9b), the dry and cold air from the north moves southward, playing a leading role in the evolution of the YCSL; in the weakening stage (Figure 9c), the YCSL is already located in the warm and moist air below 800 hPa. It is caused by the invasion of warm and moist air in the south, resulting in the weakening of the YCSL. At the same time, the confrontation between dry, cold air and warm, wet air is the most obvious between 900 hPa and 800 hPa in the lower troposphere.
The distribution of θ s e in the vertical direction can further reveal the stability of the atmosphere. Figure 9 shows that on the south side of the YCSL is θ s e p > 0 , so the atmosphere is convectively unstable. On the north side, the contours of θ s e tend to be steep and the atmosphere is neutral. In the development stage (Figure 9a), the YCSL is located in the unstable layer, while in the strong and weakening stages (Figure 9b,c), it is located in the neutral layer on the north side.

6.2. Water Vapor Characteristics

Since the cases used for composite analysis are the shear lines producing rainstorms, there must be sufficient water vapor supplements near the YCSL. It can be seen from the distribution of water vapor flux divergence at 850 hPa in Figure 10 that the water vapor flux divergence over most of the Yangtze-Huaihe region is less than zero, and the water vapor convergence zone is located on the south side of the YCSL. There are two water vapor convergence centers on the east and west sides of the YCSL. In the development and strong stages, the intensity of the water vapor convergence center on the west side is 30 × 10 6   g / ( cm 2 hPa s ) , and the other on the east side is 20 × 10 6   g / ( cm 2 hPa s ) . Due to the active cold air, the water vapor convergence zone moves southward obviously with the southward movement of the YCSL. Correspondingly, the water vapor convergence also weakens with the cold air weakening.
Figure 11 shows the water vapor flux divergence in the vertical direction. The water vapor convergence near the YCSL is mainly below 600 hPa, and the strongest convergence is located at around 900 hPa. It can be seen that in the development and strong stage, the center of water vapor flux divergence is 20 × 10 6   g / ( cm 2 hPa s ) , and the value increases to 30 × 10 6   g / ( cm 2 hPa s ) in the weakening phase. This corresponds to the northward movement of the warm, moist air from the south shown in Figure 8 and Figure 9.
To summarize, the YCSL is located in a low temperature zone below 800 hPa. The south side of the YCSL is relatively warm and wet, and the north side is relatively dry and cold. Due to the dominant role of dry, cold air from the north, the YCSL is located in the dry, cold air during the development and strong stages, and then the southern warm, moist air invades, resulting in the weakening of the YCSL. Meanwhile, a convective unstable layer is on the south side of the YCSL, and it is neutral on the north side. The water vapor gathers near the YCSL and there is a water vapor convergence center on the east and west sides of the YCSL, respectively. The water vapor convergence zone is mainly located below 600 hPa and the convergence center locates at around 900 hPa.

7. Causes of the YCSL’s Northward-Inclined Structure

In practice, the air movement meets the quasi-geostrophic approximation and the actual wind can be replaced by the geostrophic wind for weather analyses. In the perspective of thermal wind, the reason why the YCSL inclines northward with the increase of height is explained.
According to the definition of thermal wind ( V T ), its expression is
V T = V g 2 V g 1 = g f k × ( z 2 z 1 ) = g f k × h = R f ln p 1 p 2 k × T ¯
where V g is geostrophic wind, g is the gravitational acceleration, f is the Coriolis parameter, k is the unit vector in the vertical direction, z is height, h is thickness, and T ¯ is average temperature. A value of 1 represents low-level isobaric surface and 2 represents high-level isobaric surface.
The variation of geostrophic wind with height can be obtained from the thermal wind relationship.
v g p = g f 2 z p x = R f p ( T x ) p
u g p = g f 2 z p y = R f p ( T y ) p
It can be seen from Equation (4) that the change of the zonal wind with height is proportional to the meridional change of temperature ( T y ). According to the thermal characteristics near the YCSL in Section 6.1, the temperature distribution on the isobaric surface is warm in the south and cold in the north ( T y < 0 ), then the zonal wind increases with the altitude ( u g p < 0 ).
As shown in Figure 12, on the low-level isobaric surface p 1 , the zonal wind speed at point A on the YCSL is zero ( u = 0 ). Since it is satisfied u g p < 0 , on the isobaric surface p 2 the zonal wind speed at point B directly above the YCSL should be greater than zero. The zonal wind on the south side of the YCSL is positive ( u > 0 ), and on the north side it is negative ( u < 0 ). Therefore, with the increase of height, the wind right above the YCSL should be southwesterly wind, that is, the YCSL has a northward-inclined structure in the vertical direction.

8. Conclusion and Discussion

In this paper, based on ERA-Interim reanalysis data and 10 cases of YCSLs from June to July of 1981–2016 for composite analysis, the characteristics of the YCSL’s dynamic and thermal structures in the development stage, strong stage, and weakening stage were revealed. The main conclusions are as follows.
(1) The YCSL is in the northeast–southwest direction horizontally, and inclines northward from the lower layer to the upper layer in the vertical direction. The life history of the YCSL is about 54 h and it moves from north to south during the evolution process. In the strong stage, the east–west span of the YCSL is 21° longitude, the north–south span is 5° latitude, and the maximum extension height is at about 750 hPa.
(2) The evolution of the YCSL is affected by the comprehensive configuration of the high-level, medium-level, and low-level weather systems. The development of the YCSL is promoted by the strengthening of the westerly airflow in the upper layer, the development of long-wave trough in the middle layer, the southward advancement of the north branch trough in the lower layer, and the southwesterly airflow belt. In particular, the north branch trough over the Yangtze-Huaihe region has played a key role.
(3) In the different stages of the evolution process, the dynamic structure of the YCSL shows different characteristics. The YCSL corresponds well with the positive vorticity belt, which inclines northward along the YCSL from lower layer to upper layer. The center of the positive vorticity belt is at 850 hPa, which reaches its maximum in the strong stage. The YCSL is located in the non-divergence zone, and the strong convergence centers are on the south side of the YCSL. The YCSL is located in the ascending motion zone between the two secondary circulations on the north side and south side. The ascending velocity center is at 600 hPa, which reaches its maximum in the strong stage. In the development stage, there is an ascending motion along the YCSL, but in the strong stage and weakening stage, there is an ascending motion below 800 hPa and a descending motion above 800 hPa along the YCSL.
(4) Due to the dominant role of cold, dry air from the north, the YCSL is located in relatively dry and cold air. As the southern warm air northwardly invades, the YCSL weakens. A convective unstable layer is on the south side of the YCSL, and it is a neutral layer on the north side. The frontal zone is obvious near the YCSL at 850 hPa. The west section of the YCSL is in the warm and humid zone, and the east section is in the dry and cold zone.
(5) The water vapor gathering zone is near the YCSL. At 850 hPa, there is a water vapor convergence center on east and west sides of the YCSL, respectively. In the vertical direction, the water vapor convergence is mainly below 600 hPa and the convergence center locates at around 900 hPa.
(6) The baroclinity of the atmosphere is one of the reasons for the northward inclination of the YCSL.
By the composite analysis, the universal structural characteristics of the YCSL were obtained, which is helpful for understanding the YCSL. Compared with different cases of YCSL, although the weather background of each case is different, there dynamic and thermal structures have a lot in common. Composite analysis summarizes their universal characteristics, and the dynamic and thermal characteristics are consistent with previous studies, which is also the reason why this method is used in this paper. In addition, the structural characteristics in the evolution progress of other types of Yangtze-Huaihe shear lines still need to be explored, and the differences among different types of Yangtze-Huaihe shear lines are also a direction for future research.

Author Contributions

Conceptualization, X.Y.; Data curation, L.Y.; Formal analysis, L.Y.; Funding acquisition, X.Y.; Methodology, X.Y.; Software, L.Y.; Supervision, X.Y.; Visualization, L.Y.; Writing—original draft, L.Y.; Writing—review and editing, X.Y.

Funding

This study was supported by the National Natural Science Foundation of China (91637105, 41475041 and 41775048), the National Key R and D Program of China (2018YFC1507800), the National Science and Technology Support Program of China (2015BAC03B06).

Acknowledgments

This study was benefited from the ERA-Interim datasets provided online at https://apps.ecmwf.int/datasets/, and the daily meteorological dataset of China Surface Meteorological Stations (V3.0) provided online at http://data.cma.cn/data/cdcdetail/dataCode/SURF_CLI_CHN_MUL_DAY_V3.0.html.

Conflicts of Interest

The authors declare no conflicts of interest.

References

  1. Gao, S.T.; Zhou, Y.S.; Lei, T. Structural features of the Meiyu front system. Acta Meteorol. Sin. 2002, 16, 195–204. [Google Scholar]
  2. Sun, J.H.; Zhang, F.Q. Impacts of mountain–plains solenoid on diurnal variations of rainfalls along the Meiyu front over the East China Plains. Mon. Weather Rev. 2012, 140, 379–397. [Google Scholar] [CrossRef]
  3. Yang, S.; Gao, S.T.; Lu, C.G. A generalized frontogenesis function and its application. Adv. Atmos. Sci. 2014, 31, 1065–1078. [Google Scholar] [CrossRef]
  4. Luo, X.; Xue, M.; Fei, J.F. Simulation and Analysis of the Initiation of a Squall Line within a Meiyu Frontal System in East China. Atmosphere 2018, 9, 183. [Google Scholar] [CrossRef]
  5. Wu, C.H.; Huang, W.R.; Wang, S.Y. Role of Indochina Peninsula Topography in Precipitation Seasonality over East Asia. Atmosphere 2018, 9, 255. [Google Scholar] [CrossRef]
  6. Saito, N. Quasi-stationary waves in mid-latitudes and Baiu in Japan. J. Meteorol. Soc. Jpn. 1985, 63, 983–995. [Google Scholar] [CrossRef]
  7. Ninomiya, K.; Muraki, H. Large- scale circulation over East Asia during Baiu period of 1979. J. Meteorol. Soc. Jpn. 1986, 64, 409–429. [Google Scholar] [CrossRef]
  8. Okada, Y.; Yamazaki, K. Climatological evolution of the Okinawa Baiu and differences in large-scale features during May and June. J. Clim. 2012, 25, 6287–6303. [Google Scholar] [CrossRef]
  9. Oh, J.H.; Kwon, W.T.; Ryoo, S.B. Review of the researches on Changma and future observational Study(KORMEX). Adv. Atmos. Sci. 1997, 14, 207–222. [Google Scholar] [CrossRef]
  10. Riyu, L.; Oh, J.H.; Kim, B.J.; Baek, H.J. Associations with the interannual variations of onset and withdrawal of the Changma. Adv. Atmos. Sci. 2001, 18, 1066–1080. [Google Scholar] [CrossRef]
  11. Tao, S.Y. The relation between Mei-Yu in Far East and the behaviour of circulation over Asia. Acta Meteorol. Sin. 1958, 29, 119–134. [Google Scholar]
  12. Ye, D.Z.; Tao, S.Y.; Li, M.C. The abrupt change of circulation over Northern Hemisphere during June and October. Acta Meteorol. Sin. 1958, 29, 249–263. [Google Scholar]
  13. Tao, S.Y.; Chen, L.X. A review of recent research on the East Asian summer monsoon in China. In Monsoon Meteorology; Chang, C.P., Krishnamurti, T.N., Eds.; Oxford University Press: New York, NY, USA, 1987; pp. 60–92. [Google Scholar]
  14. Ding, Y.H. Summer monsoon rainfalls in China. J. Meteorol. Soc. Jpn. 1992, 70, 373–396. [Google Scholar] [CrossRef]
  15. Ding, Y.H. Seasonal March of the East Asian Summer Monsoon. In East Asian Monsoon; Chang, C.P., Ed.; World Scientific: Singapore, 2004; pp. 3–53. [Google Scholar]
  16. Wu, C.H.; Chou, M.D.; Fong, Y.H. Impact of the Himalayas on the Meiyu-Baiu migration. Clim. Dyn. 2017, 50, 1307–1319. [Google Scholar] [CrossRef]
  17. Ding, Y.H.; Chan, C.L. The East Asian summer monsoon: An overview. Meteorol. Atmos. Phys. 2005, 89, 117–142. [Google Scholar] [CrossRef]
  18. Chen, T.J. Research on the phenomena of Meiyu during the past quarter century: An overview. East Asian Monsoon; Chang, C.P., Ed.; World Scientific: Singapore, 2004; p. 564. [Google Scholar]
  19. Zheng, Y.G.; Chen, J.; Ge, G.Q.; Huang, Y.F.; Zhang, C.X. Review on the synoptic scale Meiyu Front system and its synopticsdefinition. Acta Sci. Nat. Univ. Pekin. 2008, 44, 157–164. [Google Scholar] [CrossRef]
  20. LinHo; Wang, B. The time–space structure of the Asian-Pacific summer monsoon: A fast annual cycle view. J. Clim. 2002, 15, 2001–2019. [Google Scholar]
  21. Shin, C.-S.; Huang, B. Slow and fast annual cycles of the Asian Summer Monsoon in the NCEP CFSv2. Clim. Dyn. 2016, 47, 529–553. [Google Scholar] [CrossRef]
  22. Lee, J.-Y.; Kwon, M.; Yun, K.-S.; Min, S.-K.; Park, I.-H.; Ham, Y.-G.; Jin, E.K.; Kim, J.H.; Seo, K.-H.; Kim, W.; et al. The long-term variability of Changma in the East Asian summer monsoon system: A review and revisit. Asia-Pac. J. Atmos. Sci. 2017, 53, 257–272. [Google Scholar] [CrossRef]
  23. Luo, X.; Fei, J.; Huang, X.; Ding, J.; Ma, Z. Relative roles of dry intrusion, latent heat and instabilities in the Mei-yu rainband life cycle: A case study. Atmos. Res. 2018, 214, 10–20. [Google Scholar] [CrossRef]
  24. Sampe, T.; Xie, S.-P. Large-scale dynamics of the Meiyu-Baiu rainband: Environmental forcing by the westerly jet. J. Clim. 2010, 23, 113–134. [Google Scholar] [CrossRef]
  25. Wu, R.; Wang, B. Multi-stage onset of the summer monsoon over the western North Pacific. Clim. Dyn. 2001, 17, 277–289. [Google Scholar] [CrossRef]
  26. Wang, B.; Lin, H. Rainy season of the Asian-Pacific summer monsoon. J. Clim. 2002, 15, 386–396. [Google Scholar] [CrossRef]
  27. Wang, Y.F.; Gao, Q.L.; Rong, Y.S. Decadal climate variability of rainfall around the middle and lower reaches of the Yangte River and atmospheric circulation. J. Trop. Meteorol. 2005, 11, 169–177. [Google Scholar]
  28. Si, D.; Ding, Y.H.; Liu, Y.J. Decadal northward shift of the Meiyu belt and the possible cause. Chin. Sci. Bull. 2009, 54, 4742–4748. [Google Scholar] [CrossRef]
  29. Zhu, Y.L.; Wang, H.J.; Zhou, W.; Ma, J.H. Recent changes in the summer precipitation pattern in East China and the background circulation. Clim. Dyn. 2011, 36, 1463–1473. [Google Scholar] [CrossRef]
  30. Ding, Y.H.; Si, D.; Liu, Y.J.; Fan, K. On the characteristics, driving forces and inter-decadal variability of the East Asian summer monsoon. Chin. J. Atmos. Sci. 2018, 42, 533–558. [Google Scholar]
  31. Shou, S.W.; Li, S.S.; Zhang, C.Z.; Fan, K. The dynamical structure of a mesoscale shear-line rain belt on Meiyu front. Acta Meteorol. Sin. 2001, 59, 405–413. [Google Scholar]
  32. Wu, R.S. The Principle of Modern Weather; Advanced Education Press: Beijing, China, 1999; p. 319. [Google Scholar]
  33. Yao, X.P.; Sun, J.Y.; Ma, J.L. Advances on research of Yangtze-Huaihe shear line. Plateau Meteorol. 2017, 36, 1138–1151. (In Chinese) [Google Scholar] [CrossRef]
  34. Wen, S.G. The synoptic background and trigger mechanism of shear line heavy rain. Meteorl. Mon. 1999, 25, 44–48. [Google Scholar] [CrossRef]
  35. Sun, J.H.; Zhang, X.L.; Qi, L.L.; Zhang, G.Y.; Zhao, S.X.; Tao, S.Y. A study of vortex and its mesoscale convective system during China heavy rainfall experiment and study in 2002. J. Atmos. Sci. 2004, 28, 675–691. (In Chinese) [Google Scholar]
  36. Zhao, S.X.; Tao, Z.Y.; Sun, J.H.; Bei, N.F. Study on Mechanism of Formation and Development of Heavy Rainfalls on Meiyu Front in Yangtze River; Meteorological Press: Beijing, China, 2004; p. 69. [Google Scholar]
  37. Zhang, J.; Wang, Y.; Xu, L.R. Synoptic analysis and numerical simulation of heavy rainstorm process caused by a Meiyu Front. Plateau Meteorol. 2012, 31, 170–1710. [Google Scholar]
  38. Ma, J.L. Climatic Stastistical Ananlysis and Composite Analysis of Shear Line Over Yangtze-Huaihe River Region during Meiyu Period; M.S., Chinese Academy of Meteorological Sciences: Beijing, China, 2016. [Google Scholar]
  39. Ma, J.; Yao, X.P. Statistical analysis of the shear lines and torrential rains over the Yangtze-Huaihe river region during June–July in 1981–2013. Acta Meteorol. Sin. 2015, 73, 883–894. [Google Scholar] [CrossRef]
  40. Zhou, Y.H.; Huang, X.Y.; Li, Z.X.; Wu, X.Y.; Xia, Z.L. Analysis of doppler radar echo feature of heavy rain events at the edge of west Pacific subtropical high. Meteorl. Mon. 2006, 32, 12–17. [Google Scholar] [CrossRef]
  41. Zhang, J.Y.; Zhu, S.L.; Wang, H.Q.; Wu, J.; Pei, H.Q. A radar comparison analysis of two rainstorms for cold and worm shear-line. Sci. Meteorol. Sin. 2007, 27, 44–51. [Google Scholar] [CrossRef]
  42. Ding, Y.H.; Wang, X.F. An analysis of the distribution of apparent heat sources and sinks over the middle reaches of the Yangtze River during the Meiyu season in 1983. J. Trop. Meteorol. 1988, 4, 134–145. [Google Scholar]
  43. Wang, C.M.; Wu, R.S.; Wang, Y. Interaction of diabatic frontogenesis and moisture processes in cold-frontal rain-band. Adv. Atmos. Sci. 2002, 19, 554–561. [Google Scholar] [CrossRef]
  44. Dee, D.P.; Uppala, S.M.; Simmons, A.J.; Berrisford, P.; Poli, P.; Kobayashi, S.; Andrae, U.; Balmaseda, M.A.; Balsamo, G.; Bauer, P. The ERA-Interim reanalysis: Configuration and performance of the data assimilation system. Q. J. R. Meteorol. Soc. 2011, 137, 553–597. [Google Scholar] [CrossRef]
  45. Chen, Q.S. The Instability of the Gravity-inertia wave and its Relation to Low-level Jet and Heavy Rainfall. J. Meteorol. Soc. Jpn. 1982, 60, 1041–1057. [Google Scholar] [CrossRef] [Green Version]
  46. Shin, C.-S.; Lee, T.Y. Development mechanism for the heavy rainfalls of 6–7 August 2002 over the middle of the Korean peninsula. J. Meteorol. Soc. Jpn. 2005, 83, 683–709. [Google Scholar] [CrossRef]
  47. Zhang, H.H.; Yao, X.P.; Gao, Y.; Guan, Q.; Wang, G.C. Preliminary analysis on the causes of the first persistent heavy rainfall in Yangtze-Huaihe river valley in 2016. J. Trop. Meteorol. 2018, 34, 674–684. [Google Scholar] [CrossRef]
  48. Zhang, R.P.; Ma, X.L.; Sheng, W.B.; Xu, R.G. Characteristics of the main influential system of Jianghuai Meiyu Storm in June 2011. Trans. Atmos. Sci. 2014, 37, 366–377. [Google Scholar] [CrossRef]
  49. Li, X.R.; Zhang, X.R.; Pu, M.J. Composite analysis of the evolving of Yangtze River and Huaihe River shear line with heavy rain and without heavy rain in Meiyu period. Plateau Meteorol. 2014, 33, 199–209. [Google Scholar]
  50. Liu, J.J.; Ding, Y.H.; He, J.H. The structure analysis of a typical Meiyu Front. Acta Meteorol. Sin. 2003, 61, 291–302. [Google Scholar] [CrossRef]
  51. Zheg, Y.G.; Chen, J.; Ge, G.Q.; Zhu, P.J. Typical structure diversity and multi-scale characteristics of Meiyu Front. Acta Meteorol. Sin. 2007, 65, 760–772. [Google Scholar] [CrossRef]
Figure 1. Variation of the average relative vorticity at 850 hPa in the Yangtze-Huaihe region (28°~34° N, 110°~122° E), unit: 10−5 s−1.
Atmosphere 10 00207 g001
Figure 2. Spatial evolutions of the Yangtze-Huaihe cold shear lines (YCSL). (a) At 850 hPa in the horizontal direction and (b) in the vertical section along 115° E. Long dashed line represents the development stage, solid line represents the strong stage, long-short line represents the weakening stage, and the wireframe range is the Yangtze-Huaihe region.
Atmosphere 10 00207 g002
Figure 3. A value of 850 hPa geopotential height and wind fields in the (a) development stage, (b) strong stage, and (c) weakening stage. Black solid line is potential height, vector is horizontal wind, red line is the boundary of low-level jet stream (wind speed > 12 m s−1), brown line represents the 850 hPa YCSL, and wireframe range is the Yangtze-Huaihe region. (Unit: geopotential height: gpm, wind speed: m s−1).
Atmosphere 10 00207 g003
Figure 4. Geopotential height field, wind field, temperature field, and divergence field at 500 hPa (a) and 200 hPa (b), panels 1, 2, 3 correspond to the development stage, strong stage, and weakening stage of the YCSL, respectively. In (a), black solid line is potential height, red line is temperature, and the wireframe range is the Yangtze-Huaihe region; in (b), vector is horizontal wind, red line is horizontal wind speed, and the shading denotes divergence, brown line represents the 850 hPa YCSL, and the wireframe range is the Yangtze-Huaihe region. (Unit: geopotential height: dagpm, temperature: K, wind speed: m s−1, divergence: 10−6 s−1).
Atmosphere 10 00207 g004
Figure 5. Relative vorticity (a) and divergence (b) at 850 hPa, lines 1, 2, 3 correspond to the development stage, strong stage, and weakening stage of the YCSL, respectively. In (a), the shading denotes positive vorticity, and wireframe range is the Yangtze-Huaihe region; in (b), the shading denotes convergence, brown solid line represents the 850 hPa YCSL, and wireframe range is the Yangtze-Huaihe region. (Unit: relative vorticity: 10−5 s−1, divergence: 10−6 s−1).
Atmosphere 10 00207 g005
Figure 6. Relative vorticity (a) and divergence (b) along the vertical section of 115° E, lines 1, 2, 3 correspond to the development stage, strong stage, and weakening stage of the YCSL, respectively. In (a), the shading denotes positive vorticity; in (b), the shading denotes convergence, brown line represents the YCSL (Unit: relative vorticity: 10−5 s−1, divergence: 10−6 s−1).
Atmosphere 10 00207 g006
Figure 7. The meridional circulation and vertical velocity along the vertical section of 115 °E in the (a) development stage, (b) strong stage, and (c) weakening stage. Shaded area and contour line are the vertical velocity, vector is the superimposed wind field of v, and 100 × ω (v is the meridional wind speed, ω is the vertical wind speed). Brown line represents the YCSL, and blue line represents the circulation. (Unit: vertical velocity: 10−2 Pa s−1, wind speed: m s−1).
Atmosphere 10 00207 g007
Figure 8. Pseudo-equivalent potential temperature ( θ s e ), and the difference between pseudo-equivalent potential temperature and the average pseudo-equivalent potential temperature ( θ s e θ ¯ s e ) in the (a) development stage, (b) strong stage, and (c) weakening stage. Solid line is θ s e , the shading denotes θ s e θ ¯ s e , brown line represents the YCSL, and wireframe range is the Yangtze-Huaihe region. (Unit: θ s e : K, θ s e θ ¯ s e : K).
Atmosphere 10 00207 g008
Figure 9. Temperature, pseudo-equivalent potential temperature ( θ s e ), and the difference between pseudo-equivalent potential temperature and the average pseudo-equivalent potential temperature ( θ s e θ ¯ s e ) along the vertical section of 115 °E in the (a) development stage, (b) strong stage, and (c) weakening stage. Dotted line is the temperature, solid line is θ s e , the shading denotes θ s e θ ¯ s e , and solid brown line represents the YCSL. (Unit: temperature: K, θ s e : K, θ s e θ ¯ s e : K).
Atmosphere 10 00207 g009
Figure 10. Water vapor flux divergence distribution at 850 hPa in the (a) development stage, (b) strong stage, and (c) weakening stage. Shaded area and contour line are the water vapor flux divergence, vector is horizontal wind, brown line represents the 850 hPa YCSL, and wireframe is the Yangtze-Huaihe region. (Unit: water vapor flux divergence: 10 6   g / ( cm 2 hPa s ) , wind speed: m s−1).
Atmosphere 10 00207 g010
Figure 11. Water vapor flux divergence distribution along the vertical section of 115 ° E in the (a) development stage, (b) strong stage, and (c) weakening stage. The shading and contour line are the water vapor flux divergence, and brown line represents the 850 hPa YCSL. (Unit: water vapor flux divergence: 10 6   g / ( cm 2 hPa s ) ).
Atmosphere 10 00207 g011
Figure 12. Schematic diagram of the YCSL on different isobaric surfaces, brown solid line represents the YCSL.
Atmosphere 10 00207 g012
Table 1. Ten cases of the Yangtze-Huaihe cold shear lines (YCSL).
Date1991.
6.16
1999.
6.16
2002.
7.24
2003.
6.27
2009.
6.30
2011.
6.10
2014.
6.20
2014.
7.12
2015.
6.17
2016.
6.24
Number of rainstorm stations328247321185731498432

