Article

Impact of Boreal Summer Intra-Seasonal Oscillations on the Heavy Rainfall Events in Taiwan during the 2017 Meiyu Season

1
Department of Earth Sciences, National Taiwan Normal University, Taipei 11677, Taiwan
2
Meteorological Information Center, Central Weather Bureau, Taipei 10048, Taiwan
3
College of Ocean and Meteorology, Guangdong Ocean University, Zhanjiang 524088, China
*
Author to whom correspondence should be addressed.
Atmosphere 2019, 10(4), 205; https://doi.org/10.3390/atmos10040205
Submission received: 25 March 2019 / Revised: 11 April 2019 / Accepted: 16 April 2019 / Published: 18 April 2019
(This article belongs to the Special Issue Convection and Its Impact on Weather)

Abstract

:
During May and June (the Meiyu season) of 2017, Taiwan was affected by three heavy frontal rainfall events, which led to large economic losses. Using satellite observations and reanalysis data, this study investigates the impact of boreal summer intra-seasonal oscillations (BSISOs, including a 30–60 day ISO mode named BSISO1 and a 10–30 day ISO mode named BSISO2) on the heavy rainfall events in Taiwan during the 2017 Meiyu season. Our examinations show that BSISO2 is more important than BSISO1 in determining the formation of heavy rainfall events in Taiwan during the 2017 Meiyu season. The heavy rainfall events generally formed in Taiwan at phases 4–6 of BSISO2, when the enhanced southwesterly wind and moisture flux convergence center propagate northward into the Taiwan area. In addition, we examined the forecast rainfall data (at lead times of one day to 16 days) obtained from the National Centers for Environmental Prediction Global Forecast System (NCEPgfs) and the Taiwan Central Weather Bureau Global Forecast System (CWBgfs). Our results show that the better the model’s capability in forecasting the BSISO2 index is, the better the model’s capability in forecasting the timing of rainfall formation in Taiwan during the 2017 Meiyu season is. These findings highlight the importance of BSISO2 in affecting the rainfall characteristics in East Asia during the Meiyu season.

1. Introduction

During May and June (i.e., MJ, the so-called Meiyu season in Taiwan), one of the most frequently observed weather systems affecting rainfall formation in Taiwan is the frontal event [1,2]. In general, the Meiyu frontal systems can bring heavy rainfall formations in Taiwan, which have a high potential to cause severe property damage [3]. For example, during the Meiyu season of 2017, three frontal rainfall events (Figure 1) brought continuous heavy rainfall to Taiwan and led to severe crop damage and large economic losses. Among these three frontal rainfall events (named FR1~FR3; Figure 1), the most intense rainfall occurred from June 2 to June 4 (i.e., FR2) of 2017. In this natural disaster, there were approximately 6,000 hectares of cropland destroyed, and local economic losses reached approximately $9 million USD, according to the estimations of agricultural disaster reports from the Food Agency Council of Agriculture, Executive Yuan in Taiwan (https://eng.coa.gov.tw). Therefore, understanding what might affect the formation of heavy Meiyu rainfall events, as well as what might affect the capability of models to predict the Meiyu rainfall formation, is one of the most important research subjects for the local community in Taiwan [4,5,6,7,8,9].
The weather systems occurring over the East Asian summer monsoon region during the warm seasons (May to October, MJJASO) are known to be under the modulation of atmospheric circulation changes related to the 30–60 day and 10–30 day boreal summer intra-seasonal oscillations (BSISOs) [10,11,12,13]. Lee et al. [10] have proposed a specific metric for better characterizing the intra-seasonal variability of Asian summer monsoon circulation related to the 30–60 day ISO (named BSISO1) and 10–30 day ISO (named BSISO2) from observations. Using the index of BSISOs proposed by Lee et al. [10], more recent observational studies have examined the impact of changes in atmospheric circulations related to BSISOs (hereafter refers to the impact of BSISOs) in affecting rainfall characteristics over various areas of the East Asian summer monsoon region [13,14,15,16,17,18,19]. Among these studies, the impact of BSISOs in affecting the typhoon type of rainfall [17] and the diurnal type of rainfall [13] in Taiwan have been examined in detail. Chen et al. [20] pointed out that the MJJASO rainfall in Taiwan is mainly modulated by different types of weather systems in different months. In MJ, the heavy rainfall in Taiwan is mainly contributed to the frontal type of rainfall, while the typhoon type of rainfall is the major contributor of heavy rainfall in Taiwan during JAS [20]. However, compared to issues related to other types of rainfall, the issue of how the circulation changes associated with BSISOs can modulate the formation of frontal rainfall (or the heavy rainfall) in Taiwan during the Meiyu season has been rarely discussed. This will be examined in detail herein.
On the other hand, besides the observational studies, other studies have focused on the predictive skill of BSISOs in the models [11] and have studied the sub-seasonal prediction of extreme precipitation over Asia using the perspective of BSISOs [12]. Overall, it seems that the predictions of BSISOs are important for the predictions of heavy rainfall formation over Asia [12,21,22]. However, whether or not this is also true for the prediction of local rainfall formation in Taiwan is still unknown and deserves research attention.
In summary of the above, underexplored issues, the main objective of this study is to examine the possible impacts of BSISOs in affecting the formation of heavy Meiyu rainfall events in Taiwan from the observational data. In addition, this study aims to understand whether the model’s capability in forecasting the BSISOs has some insight on its capability in forecasting the Meiyu rainfall formation in Taiwan. We mainly use the rainfall events during the 2017 Meiyu season as examples to examine the above scientific issues. For the models, we use the forecast data at lead times of 1 day to 16 days (i.e., LT1~16) obtained from the National Centers for the Environmental Prediction Global Forecast System (i.e., NCEPgfs) and the Taiwan Central Weather Bureau Global Forecast System (i.e., CWBgfs). Notably, the impact of BSISOs on various research subjects have been documented in many journal articles [13,15,16,17,18,23,24,25], but not in only the technical reports. The importance of this kind of study [13,15,16,17,18,23,24,25] is that they can provide useful information for understanding how the local weather can be affected by the intra-seasonal variability of large-scale atmospheric circulations. Since the current study is the first to document the relationship between the phases of BSISO2 and the occurrence frequency of heavy Meiyu rainfall in Taiwan (including the related circulation changes, explained later), we believe that the findings of this study can provide lots of useful information for the research communities interested in studying or in predicting the Meiyu rainfall formation in Taiwan.
The remainder of this paper is organized as follows. Details of the observational data and the forecast data used for the analyses are provided in Section 2. Results of the observational evidence of BSISOs in modulating the rainfall formation in Taiwan are presented in Section 3, which is followed by a discussion of the model forecasts in Section 4. A conclusion is given in Section 5.

2. Data and Methodology

2.1. Data

For the examinations of the observational features, we use the daily mean of atmospheric circulation data provided by the NCEP-DOE Reanalysis 2 (NCEP-R2) [26] (available at https://www.esrl.noaa.gov/psd/data/gridded/data.ncep.reanalysis2.pressure.html), the daily non-interpolated Outgoing Longwave Radiation (OLR) data provided by the National Oceanic and Atmospheric Administration (available at http://www.esrl.noaa.gov/psd/), and the daily precipitation estimation data provided by the Global Precipitation Measurement (GPM) Integrated Multi-satellitE Retrievals for GPM (IMERG) “final run” version 5 product [27]. The capability of GPM IMERG in depicting the multiple timescale rainfall characteristics in Taiwan has been recently clarified by Huang et al. [28]. For the model forecast, we use the 16-day forecasts of precipitation from the GFS data provided by (1) the NCEP (i.e., NCEPgfs; http://www.emc.ncep.noaa.gov/GFS/doc.php) and (2) the Central Weather Bureau in Taiwan (i.e., CWBgfs; https://npd.cwb.gov.tw/). Information of the model setting of NCEPgfs and CWBgfs is given in Table 1. For comparison purposes, the model forecast of precipitation data used in the present study is linearly interpolated into the same horizontal scale with IMERG observation (i.e., 0.1° × 0.1°).

2.2. Calculation of the BSISO Index

Lee et al. [10] provided a detailed procedure for the index calculation of BSISOs in the observation and in the forecast. In this study, we generate the index of BSISOs following the method and program provided in the website http://iprc.soest.hawaii.edu/users/jylee/bsiso/. Following Lee et al. [10], we use the multivariate empirical orthogonal function (MV-EOF) analysis [39] of daily anomalies of OLR and 850-hPa zonal wind (U850) over (10° S–40° N, 40°–160° E) from the NCEP-R2, as well as NCEPgfs and CWBgfs, to obtain the index of BSISOs. The MV-EOF analysis was applied for the extended boreal summer (MJJASO) like Lee et al. [10], but was extended up to 2017. The index of BSISO1 (BSISO2), which represents the 30 to 60 day ISO (10–30 day ISO), was constructed from the principal component (PC) of the first two (third and fourth) EOF modes, i.e., PC1 and PC2 (PC3 and PC4). Both the observed and forecasted index of BSISOs was normalized by the standard deviation of the observed index of BSISOs. For more details on how to obtain the index of BSISOs, please refer to Lee et al. [10].
Notably, by comparing the EOF patterns provided by Lee et al. [10] (see their Figures 2 and 3) and those generated by this study (see Supplementary Figure S1), we note that our EOF patterns are similar to those presented in Lee et al. [10]. Regarding the PCs, since it is not possible to clarify our generated index for the 2017 Meiyu season by comparing with Lee et al. [10], who only provided the index for the year of 1981–2013, we compare our generated PCs with the PCs provided by the APEC Climate Center (hereafter APCC) in Korea. The result (see Supplementary Figure S2) shows a high similarity between them, which suggests that the PCs used in this study are reasonably generated.
In addition, it should be clarified that, to be able to compare with the observed PCs, the forecasted PCs are obtained by projecting data on to the same EOF patterns used for the observation (i.e., Supplementary Figure S1). APCC recommends this method for generating forecasted PCs (http://apcc21.org/images/eng/bsiso/LetterToOpCentres_BSISO_20130508.pdf). By doing this, only the time series of PCs are different between the observations (Supplementary Figure S2) and the forecasts (Supplementary Figure S3).
The forecast skill of index of BSISOs is assessed in terms of bivariate correlation, as listed below [12].
Corr ( τ ) = i = 1 N [ a 1 ( t ) b 1 i ( t , τ ) + a 2 ( t ) b 1 i ( t , τ ) ] i = 1 N [ a 1 2 ( t ) + a 2 2 ( t ) ] i = 1 N [ b 1 i 2 ( t , τ ) + b 2 i 2 ( t , τ ) ]
where N is the number of forecasts, a 1 ( t ) and a 2 ( t ) are the observed PC1 and PC2 (or PC3 and PC4) of BSISO at day t, and b 1 i ( t , τ ) and b 2 i ( t , τ ) are their respective forecasts at day t for a lead time of τ days. Statistically, the bivariate correlation measures the linear relationship between PC pairs [40,41].

2.3. Potential Function of the Vertically Integrated Moisture Flux

Following Huang and Chang [13], we use Equation (2) to calculate the vertically integrated moisture flux (Q) shown below.
Q = 1 g ( 300 p s Vq dp )
where g is gravity, V denotes the horizontal wind vectors, q is the specific humidity, and p is the pressure level. Furthermore, Q can be divided into divergent (QD) and rotational (QR) components, which can be further expressed in terms of the potential function (χQ) and stream function (ψQ) of the moisture flux.
Q = Q D + Q R = χ Q + k ^ × ψ Q ,
2χQ = ∇·Q.
2 ψ Q = k ^ × Q .
The fields of χQ and ψQ can be obtained by solving the Poisson Equation for Equations (4)–(5).

3. Results

Various distinct features revealed from the observational data regarding the potential impact of BSISOs in modulating the rainfall formation over Taiwan are documented in this section, and discussed as follows.
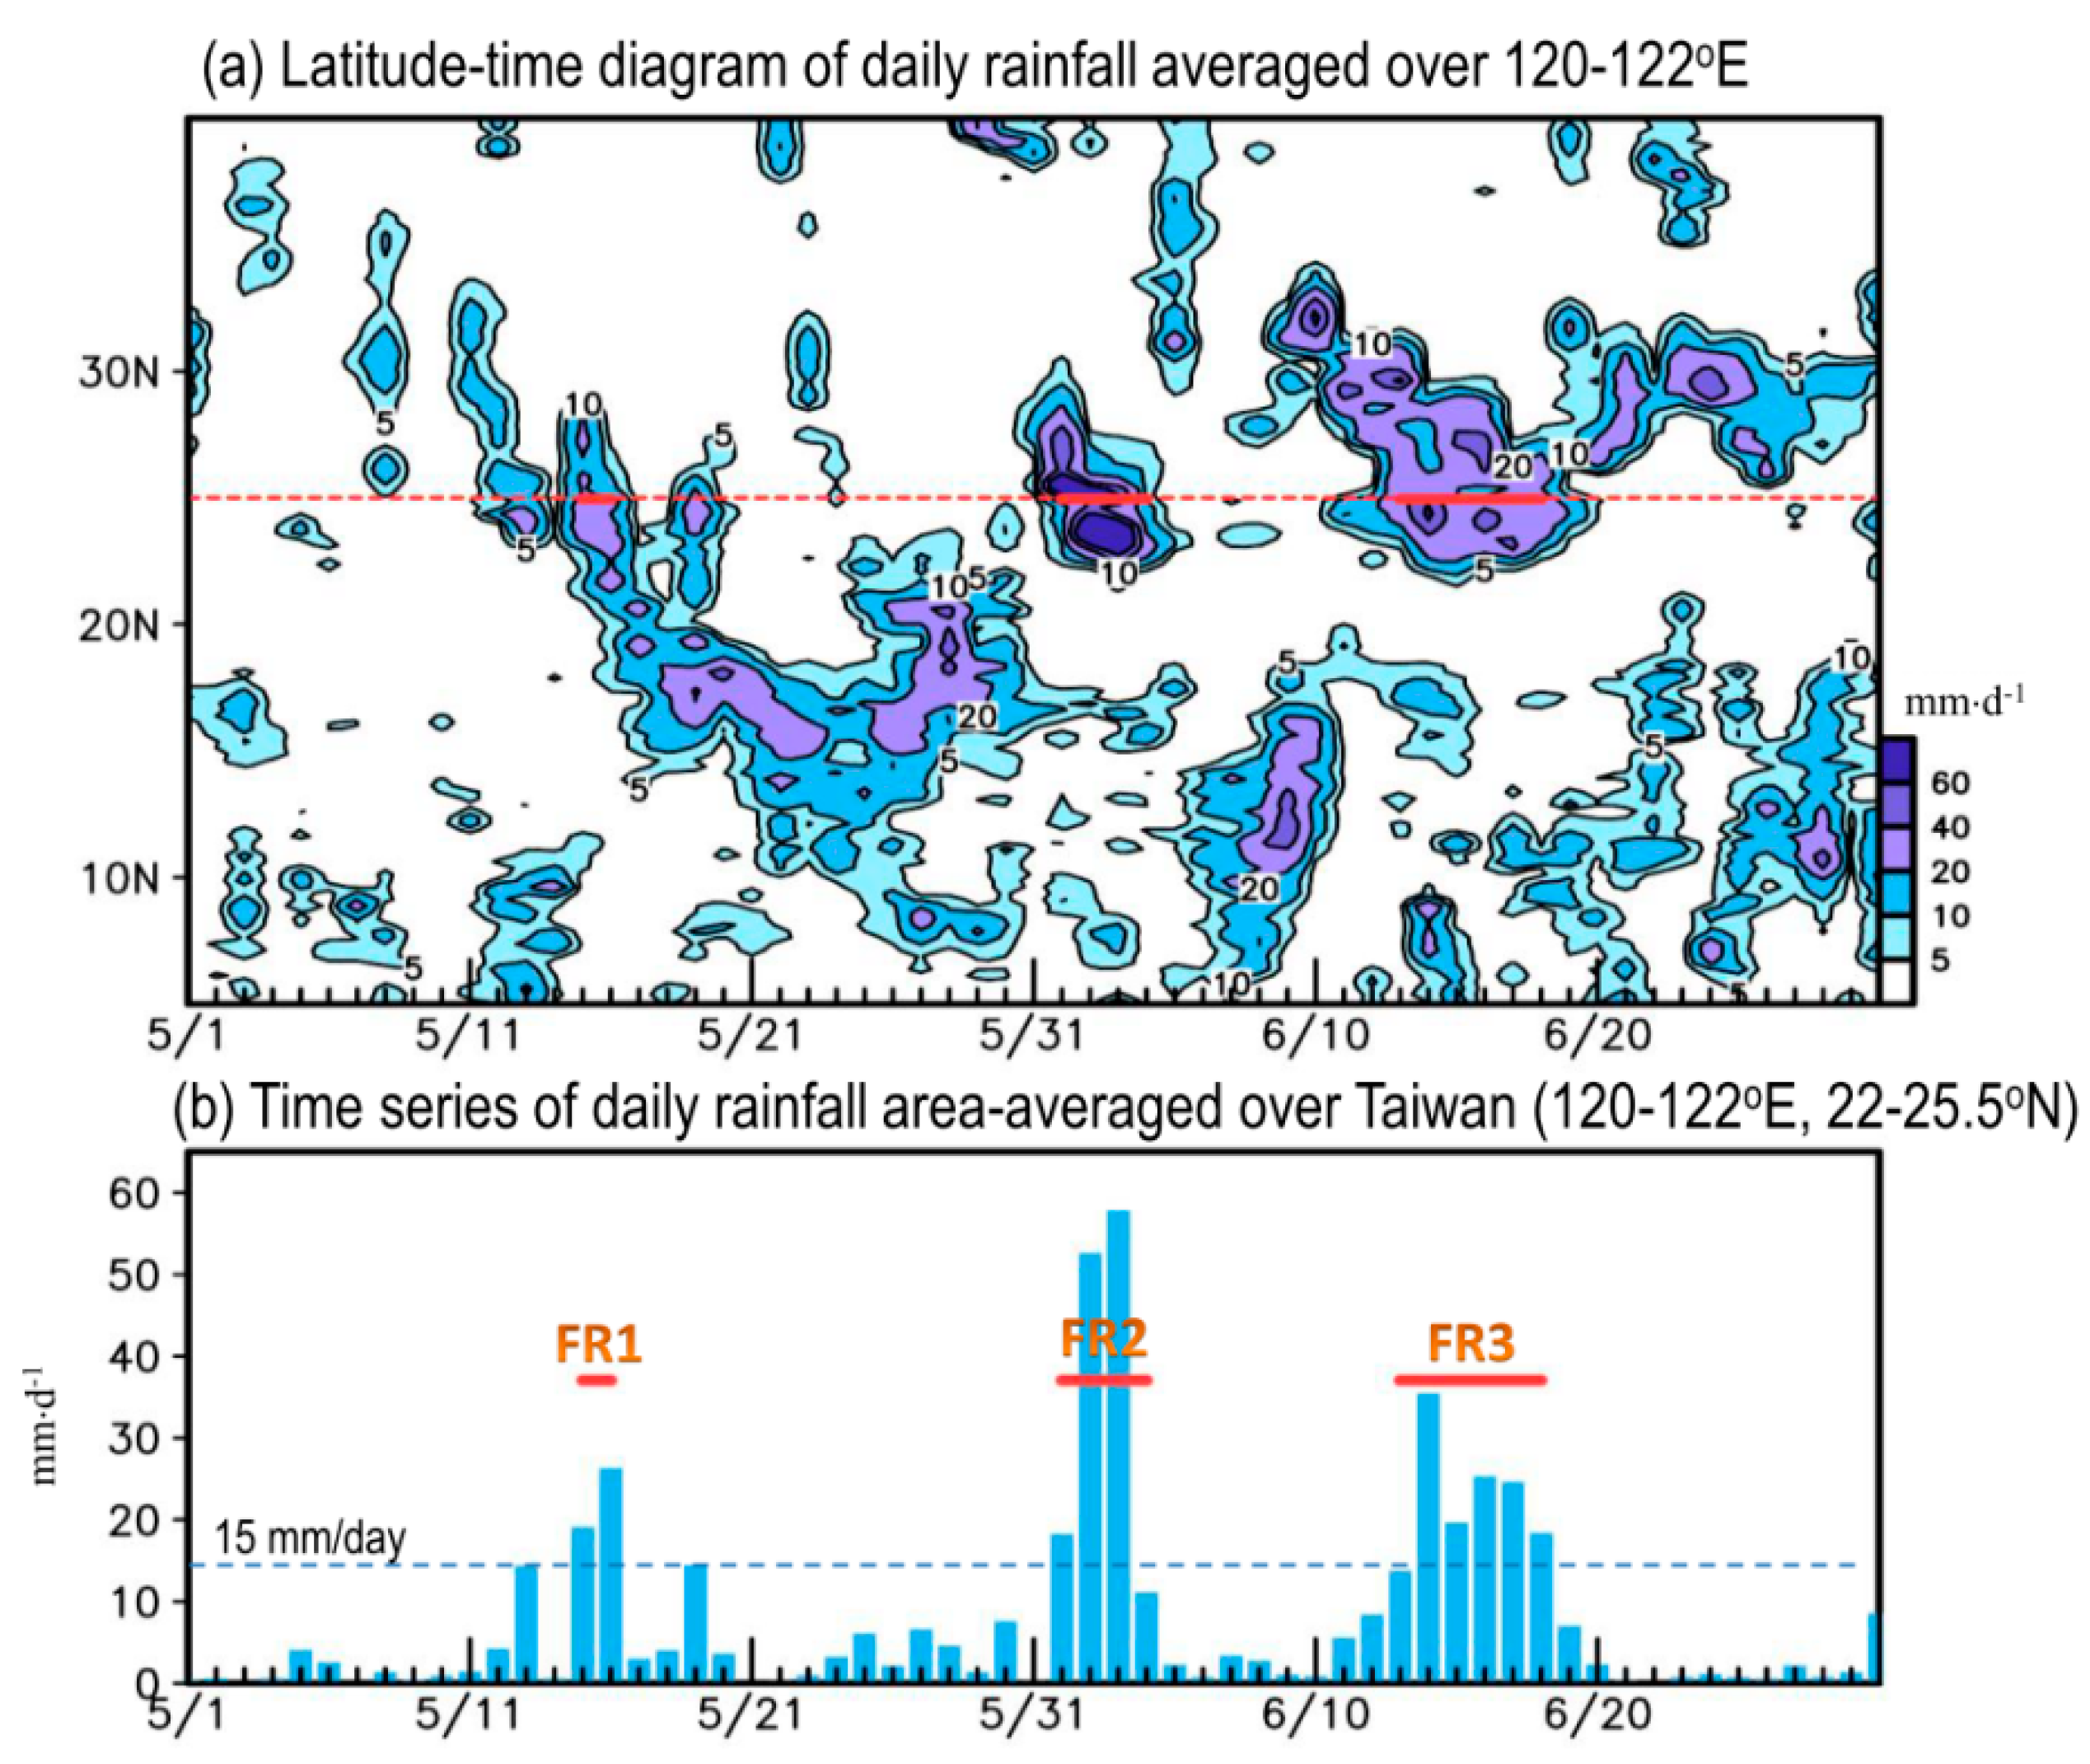
First, we examine the north-south propagating behavior of the rainfall formation over the longitudinal zone of Taiwan (120–122° E) during May and June 2017, based on the latitude-time diagram shown in Figure 1a. According to Figure 1a, Taiwan (located around 25° N, indicated by the dashed orange line) is mainly under the modulation of southward propagating rainfall systems from north of 25° N and northward propagating rainfall systems from south of 25° N during three different time periods: 15–16 May (FR1 in Figure 1b), 1–3 June (FR2), and 14–18 June (FR3). In this case, the heavy rainfall events (FR1~FR3) are selected based on the criterion that the daily rainfall amount of >15 mm/day has continued for at least two days (see 
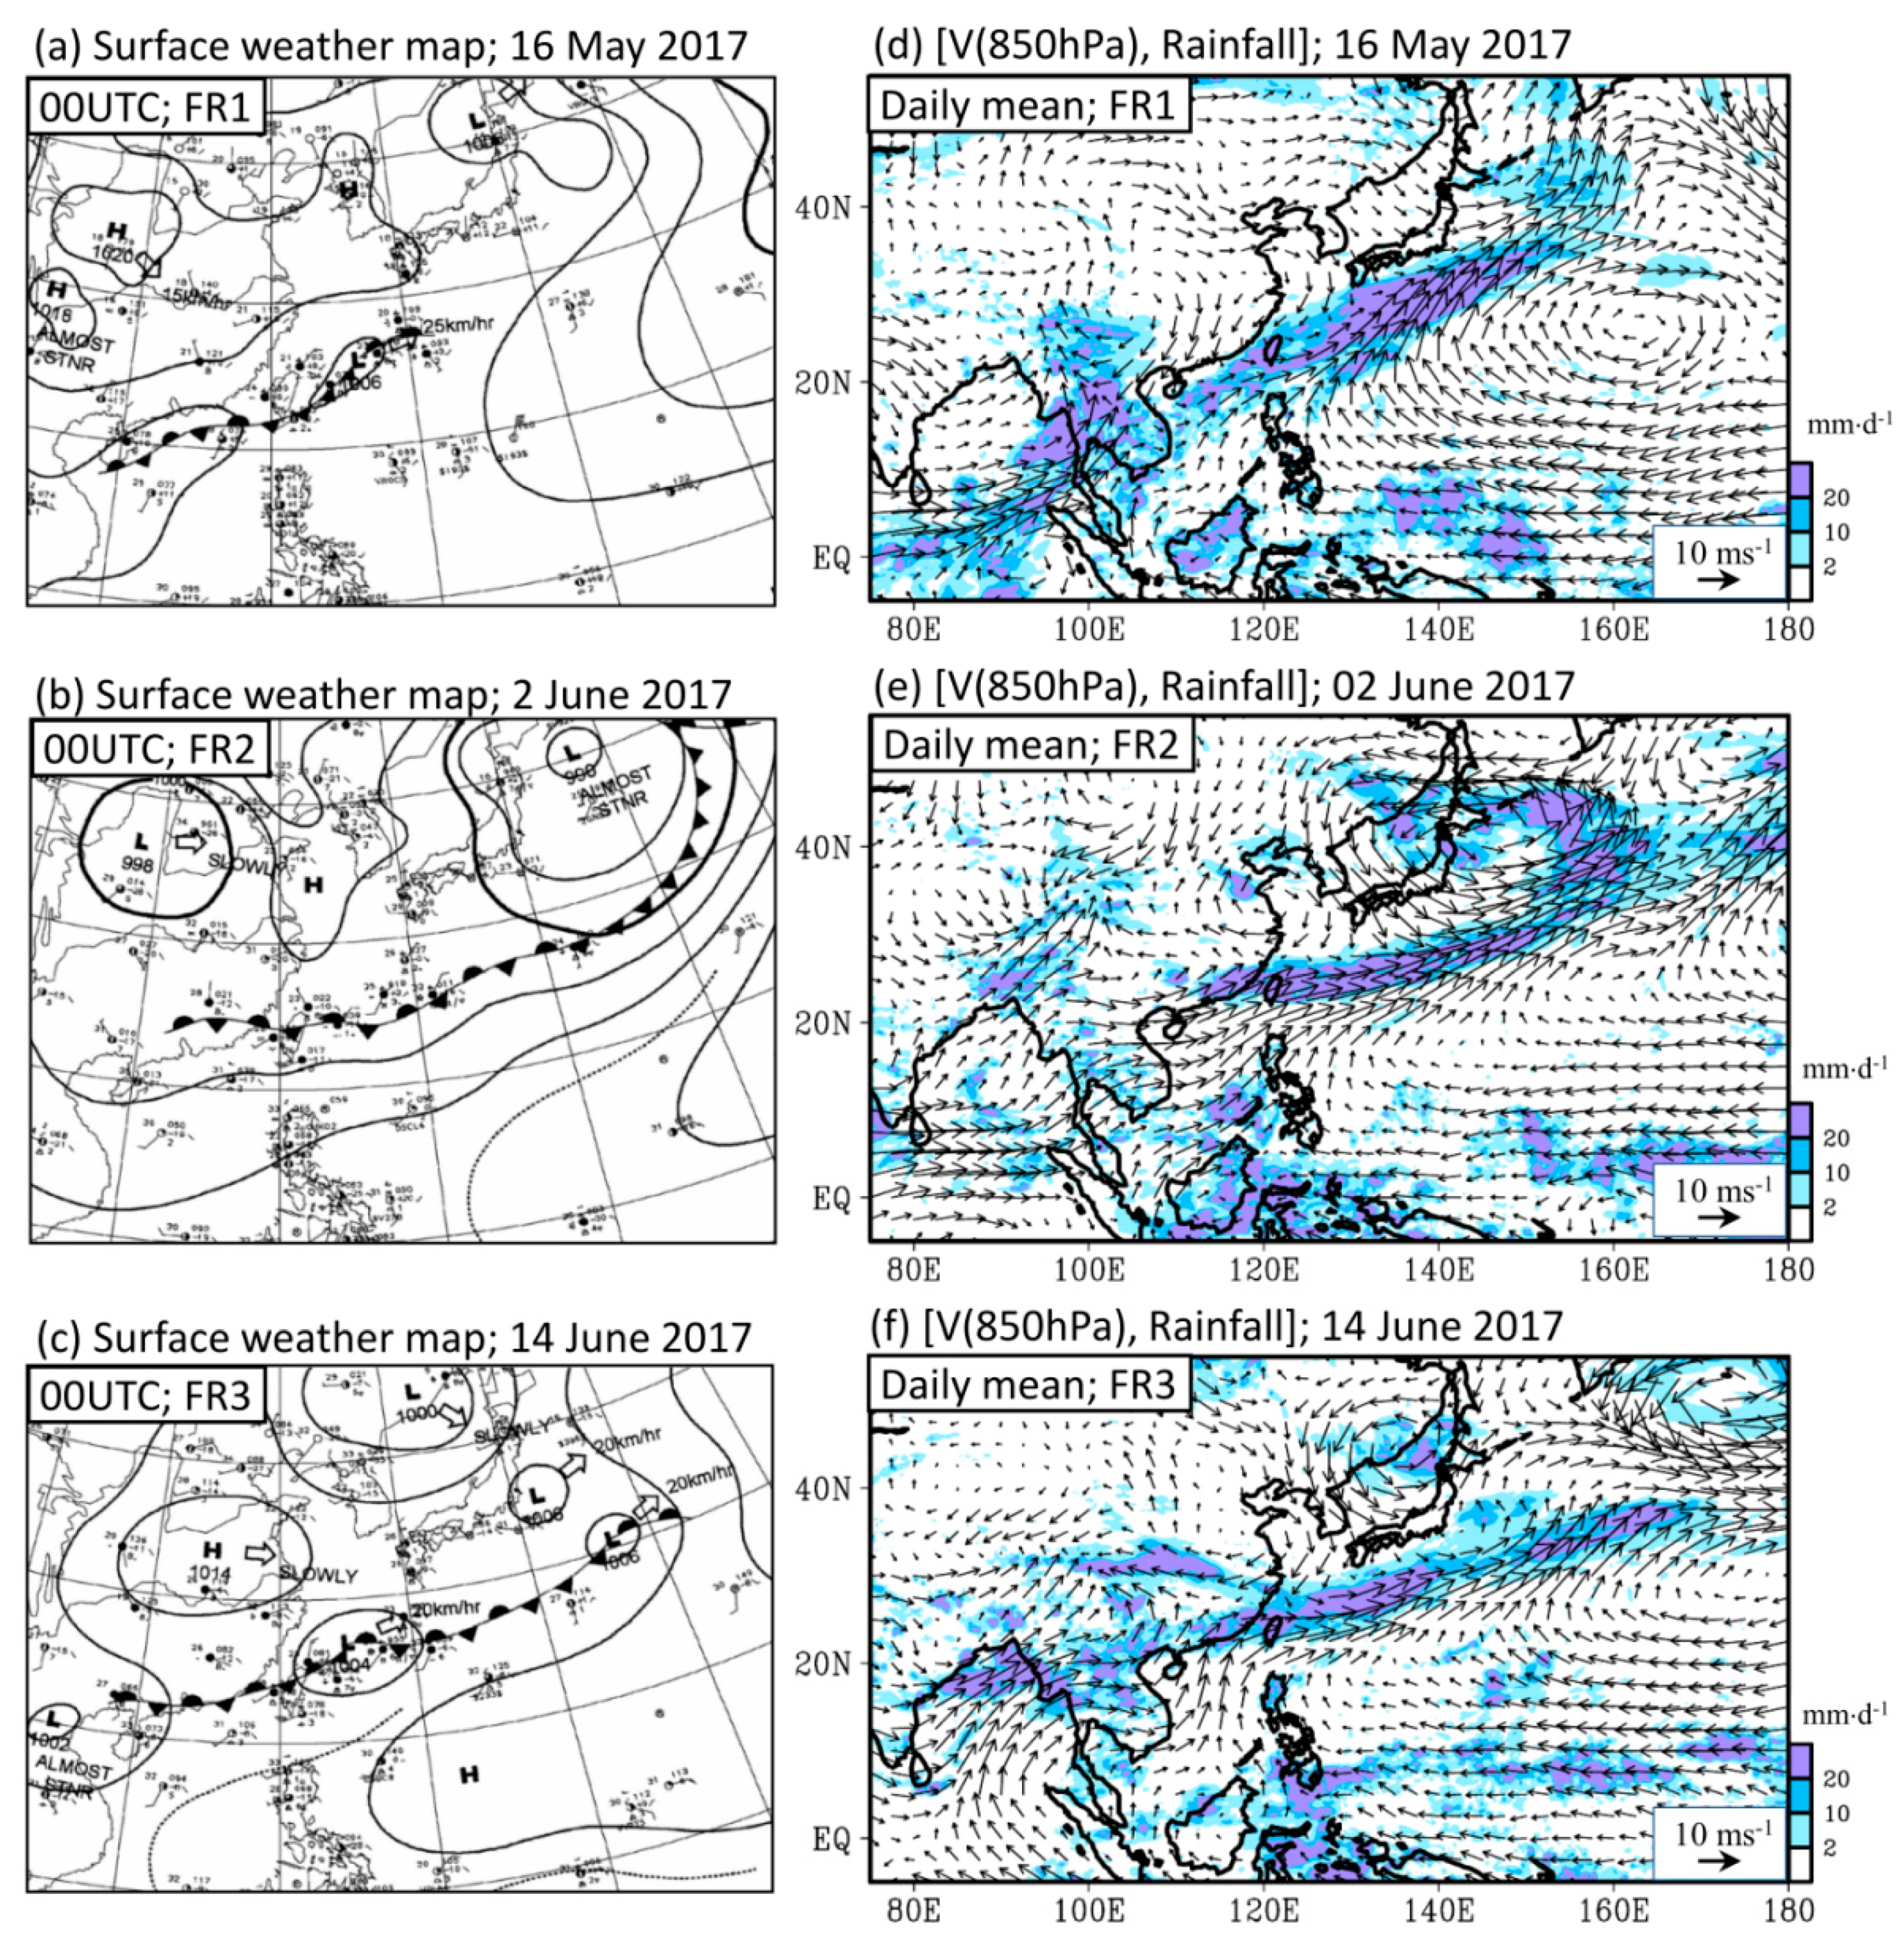
Figure 1b). It can be seen from the synoptic weather maps provided by the Central Weather Bureau of Taiwan (Figure 2a,c) that the rainfall formation over Taiwan during these three periods is caused by the passage of frontal events. By examining the daily mean fields of low-level atmospheric circulation changes at 850 hPa (Figure 2d,f), it is further noted that each of these three heavy rainfall events are modulated by the enhanced southwesterly winds over the South China Sea. Previous studies have noted that the enhancement of southwesterly winds over the South China Sea is important in bringing the moisture supply from the lower latitude regions to the area of Taiwan to support the heavy rainfall formation in Taiwan [1,2]. Recently, Huang and Chang [13] noted that, under the modulation of BSISOs, a northward propagation of moisture supply was revealed over the domain covering 115° E–130° E to 5° N–35° N to support the warm season diurnal rainfall formation in Taiwan. Focusing on Figure 1a, it seems that the rainfall over the domain south of 25° N also consists of some northward propagation signals. As inferred from these documented features of Figure 1 and Figure 2 and the findings of Huang and Chang [13], we hypothesize that the evolution of atmospheric conditions (including the movement of southwesterly wind and moisture supply) related to BSISOs, might be important in modulating the formation of the Meiyu rainfall in Taiwan. This hypothesis will be clarified in later examinations.
Also noted from Figure 1 and 
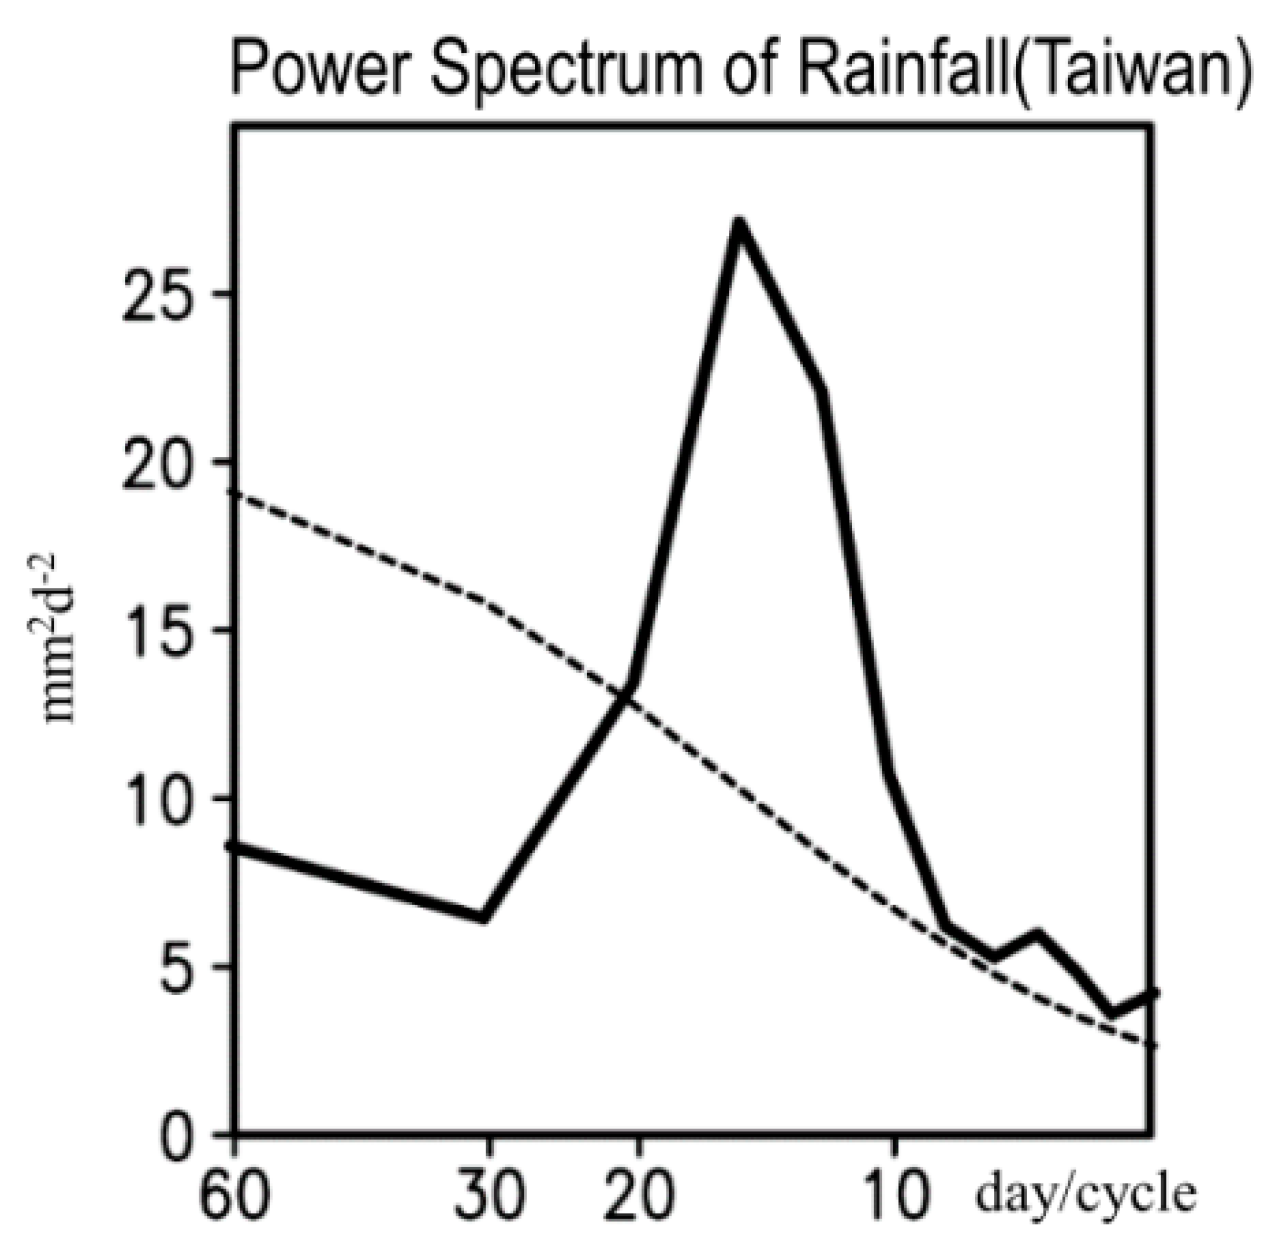
Figure 2, the difference between the appearance times of the three heavy rainfall events is approximately 12 to 17 days. This implies that the rainfall formation over Taiwan during the 2017 Meiyu season might be modulated by the BSISO2 (i.e., 10 to 30 day ISO) more than the BSISO1 (i.e., 30 to 60 day ISO). By applying a power spectrum analysis on daily rainfall over Taiwan during the 2017 Meiyu season, the result shown in Figure 3 confirms that the variation of rainfall is mainly dominated by an ISO mode within the 10 to 30 day range. This suggests that the rainfall variation in Figure 1b is mainly regulated by the evolution of BSISO2, and the influence of BSISO1 is less.
One might question that the lack of 30 to 60 day ISO mode in Figure 3 is because only 61-day data is used for the analysis. To clarify this, we have tested Figure 3 using a longer period (i.e., MJJASO) of 2017. The result also points out that the 10 to 30 day ISO mode is more important than the 30 to 60 day ISO mode (Supplementary Figure S4). In addition, from our tests for other years, we note that although only 61-day rainfall data in Taiwan are used for the power spectrum analysis, we can find a clear signal of 30 to 60 day ISO mode in some years (e.g., 2008, 2009, 2012, Supplementary Figure S5). In other words, the lack of 30 to 60 day ISO mode in Figure 3 is not because a 61-day data is used. Regarding why a longer period is not focused on (e.g., MJJASO, as in MV-EOF analysis), but only on MJ, this is related to the fact that the rainfall in Taiwan is mainly contributed by different types of rainfall in different months [20]. Because the focus of this study is to understand how the atmospheric circulation changes related to BSISOs can impact the heavy Meiyu rainfall in Taiwan, we only examine the changes in MJ, but not in other months.
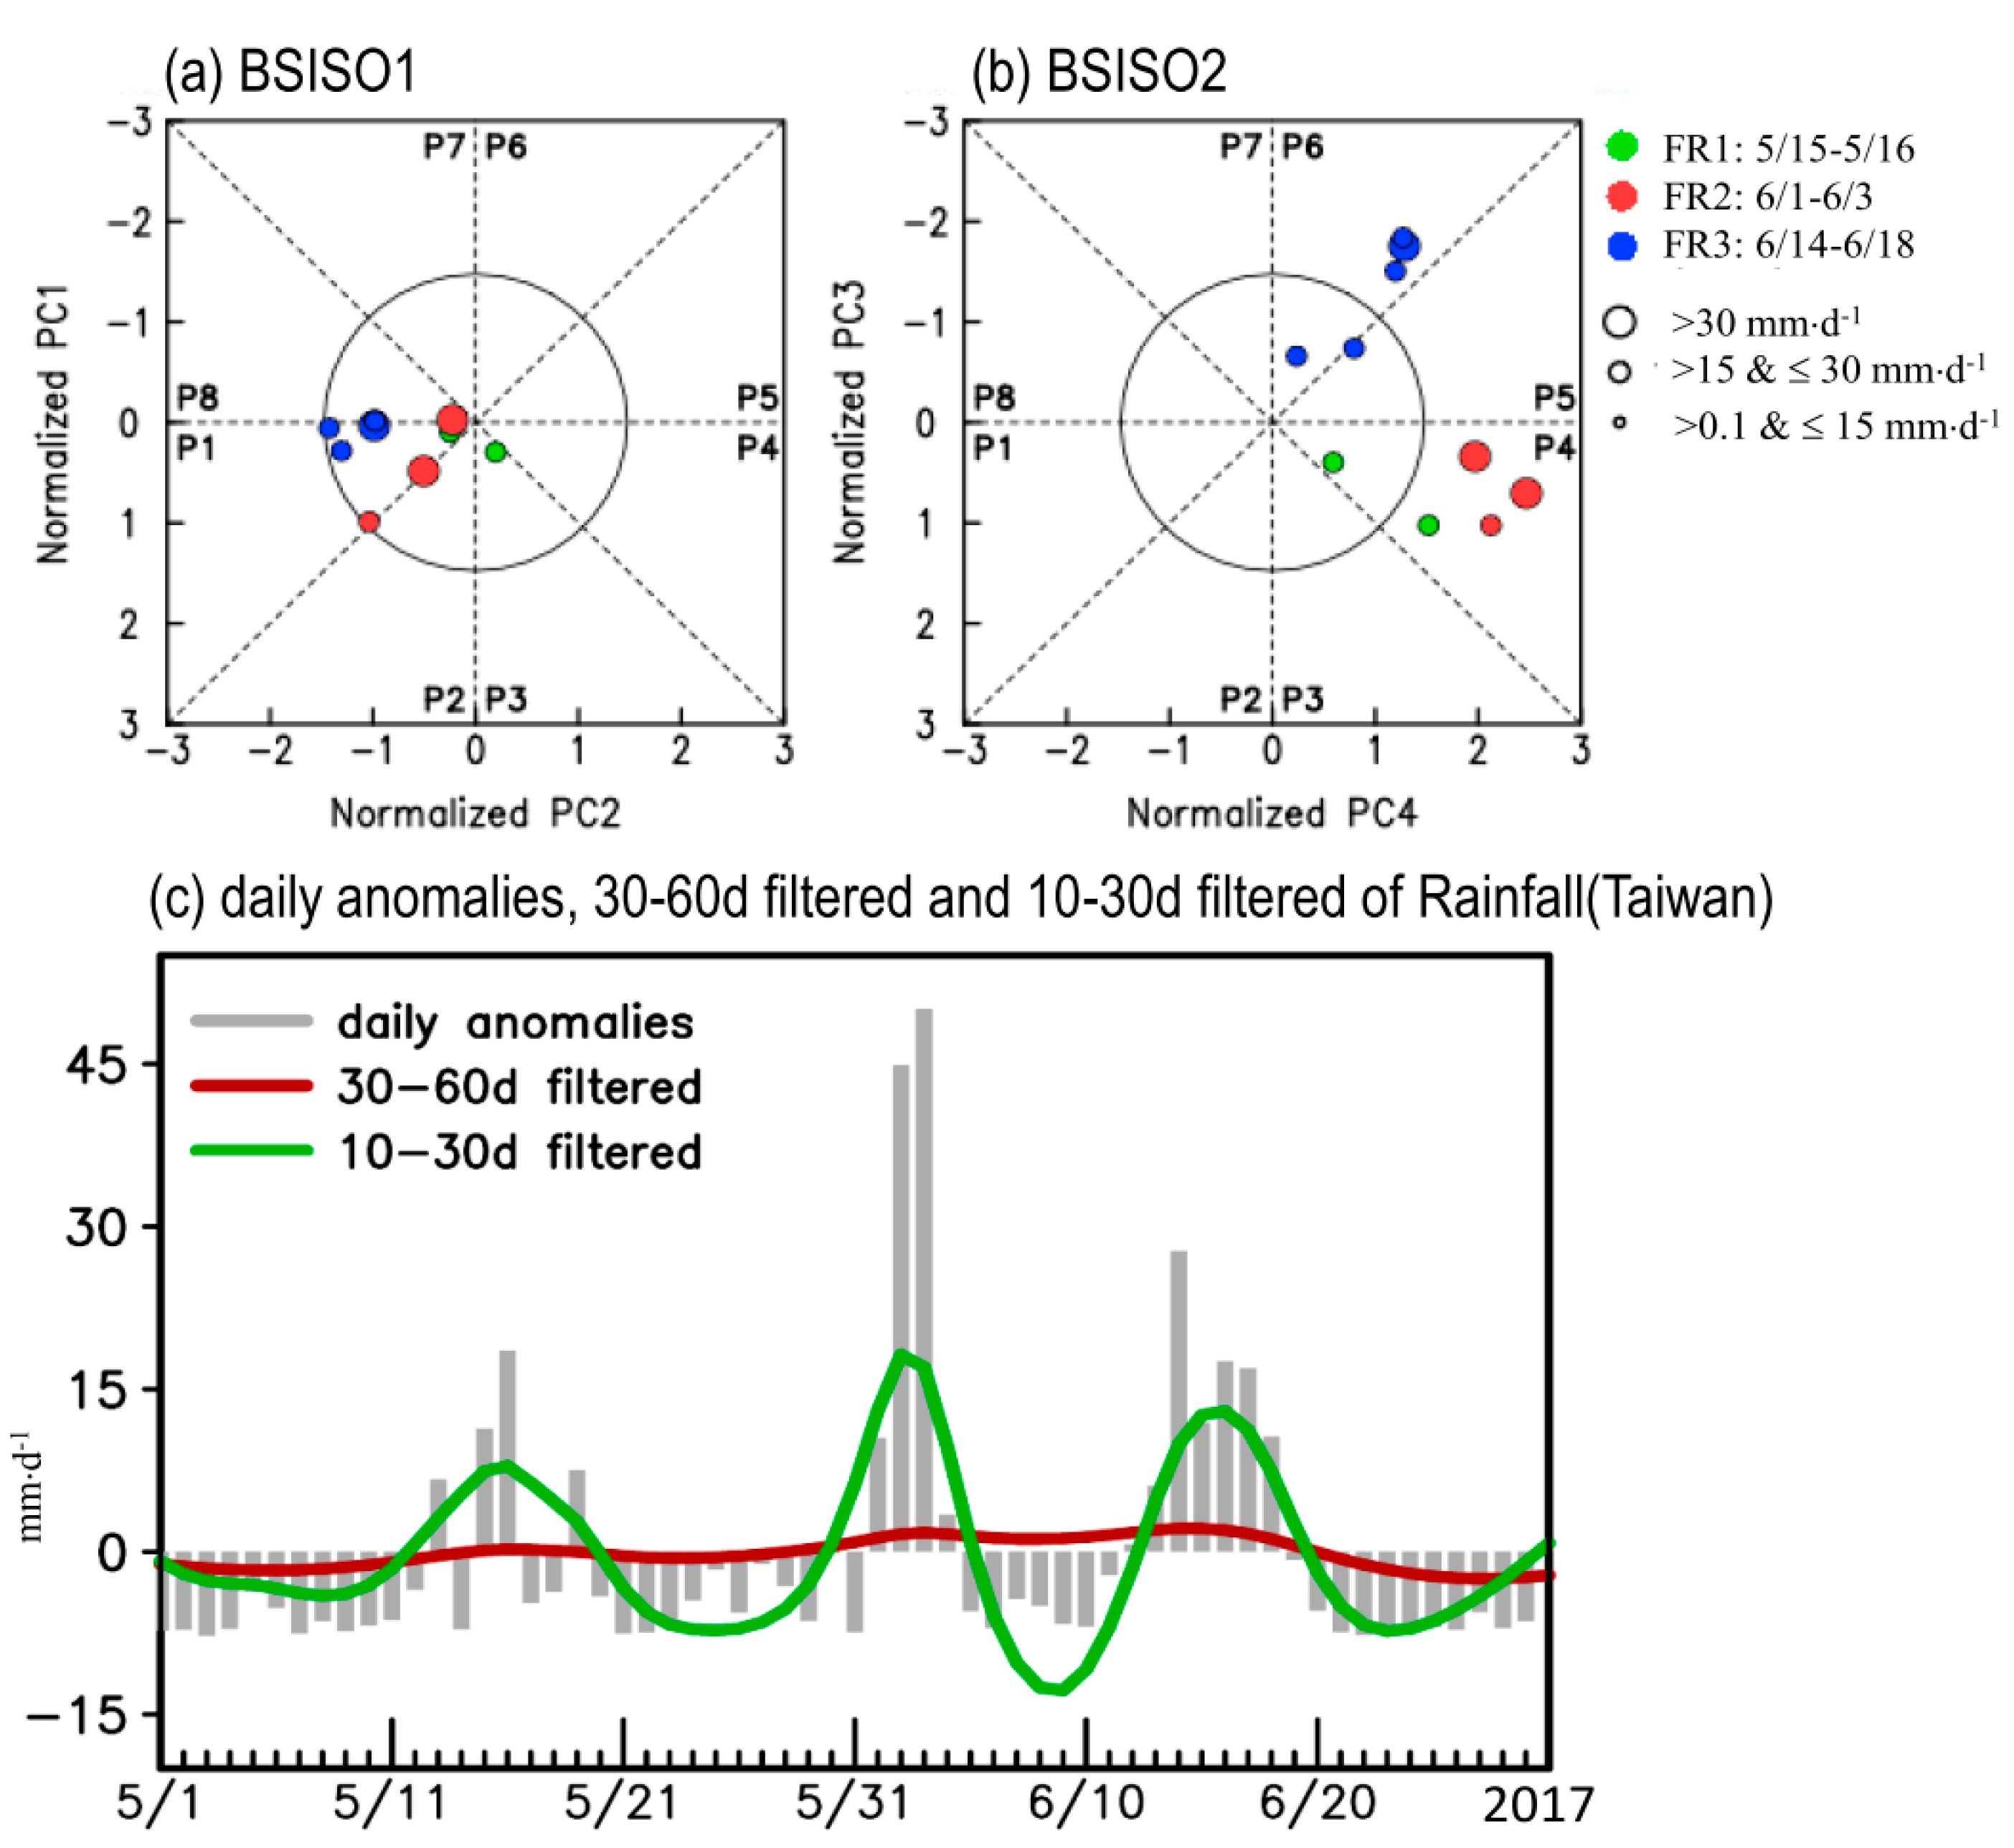
To further understand the potential linkage between the evolution of BSISOs and the occurrence of heavy rainfall events in Taiwan during the 2017 Meiyu season, we construct the phase diagram of BSISOs and mark the dates with daily rainfall amounts over Taiwan to be larger than 15 mm/day in the related phase of BSISOs. The method used to construct the phase diagram of Figure 4a,b follows the procedure described in Lee et al. [10]. As seen from Figure 4b (Figure 4a), most of the heavy rainfall days occurred when the BSISO2 (BSISO1) was in phases 4–6 (phase 8-1). In addition, it seems that, when the amplitude of BSISO2 is larger (i.e., >1.5; strong BSISO2 event), the rainfall amount in Taiwan is also larger (i.e., more chance to have daily rainfall amount >30 mm/day). In contrast, it is noted from Figure 4a that all the heavy rainfall days occur when the amplitude of BSISO1 is smaller than 1.5 (i.e., weak BSISO1 event). Such a difference between the amplitude of BSISO1 (Figure 4a) and BSISO2 (Figure 4b), suggests that BSISO2 might have stronger influence than BSISO1 in modulating the heavy rainfall formation in Taiwan during the 2017 Meiyu season. By comparing several types of time series [including the anomalies (i.e., remove the mean of rainfall during May and June 2017) of daily rainfall (gray bars in Figure 4c), 30 to 60 day band pass filtered daily rainfall (red line in Figure 4c) and 10 to 30 day band pass filtered daily rainfall (green line in Figure 4c)] in Taiwan, we clarify that the variation of rainfall is mainly dominated by BSISO2, rather than by BSISO1.
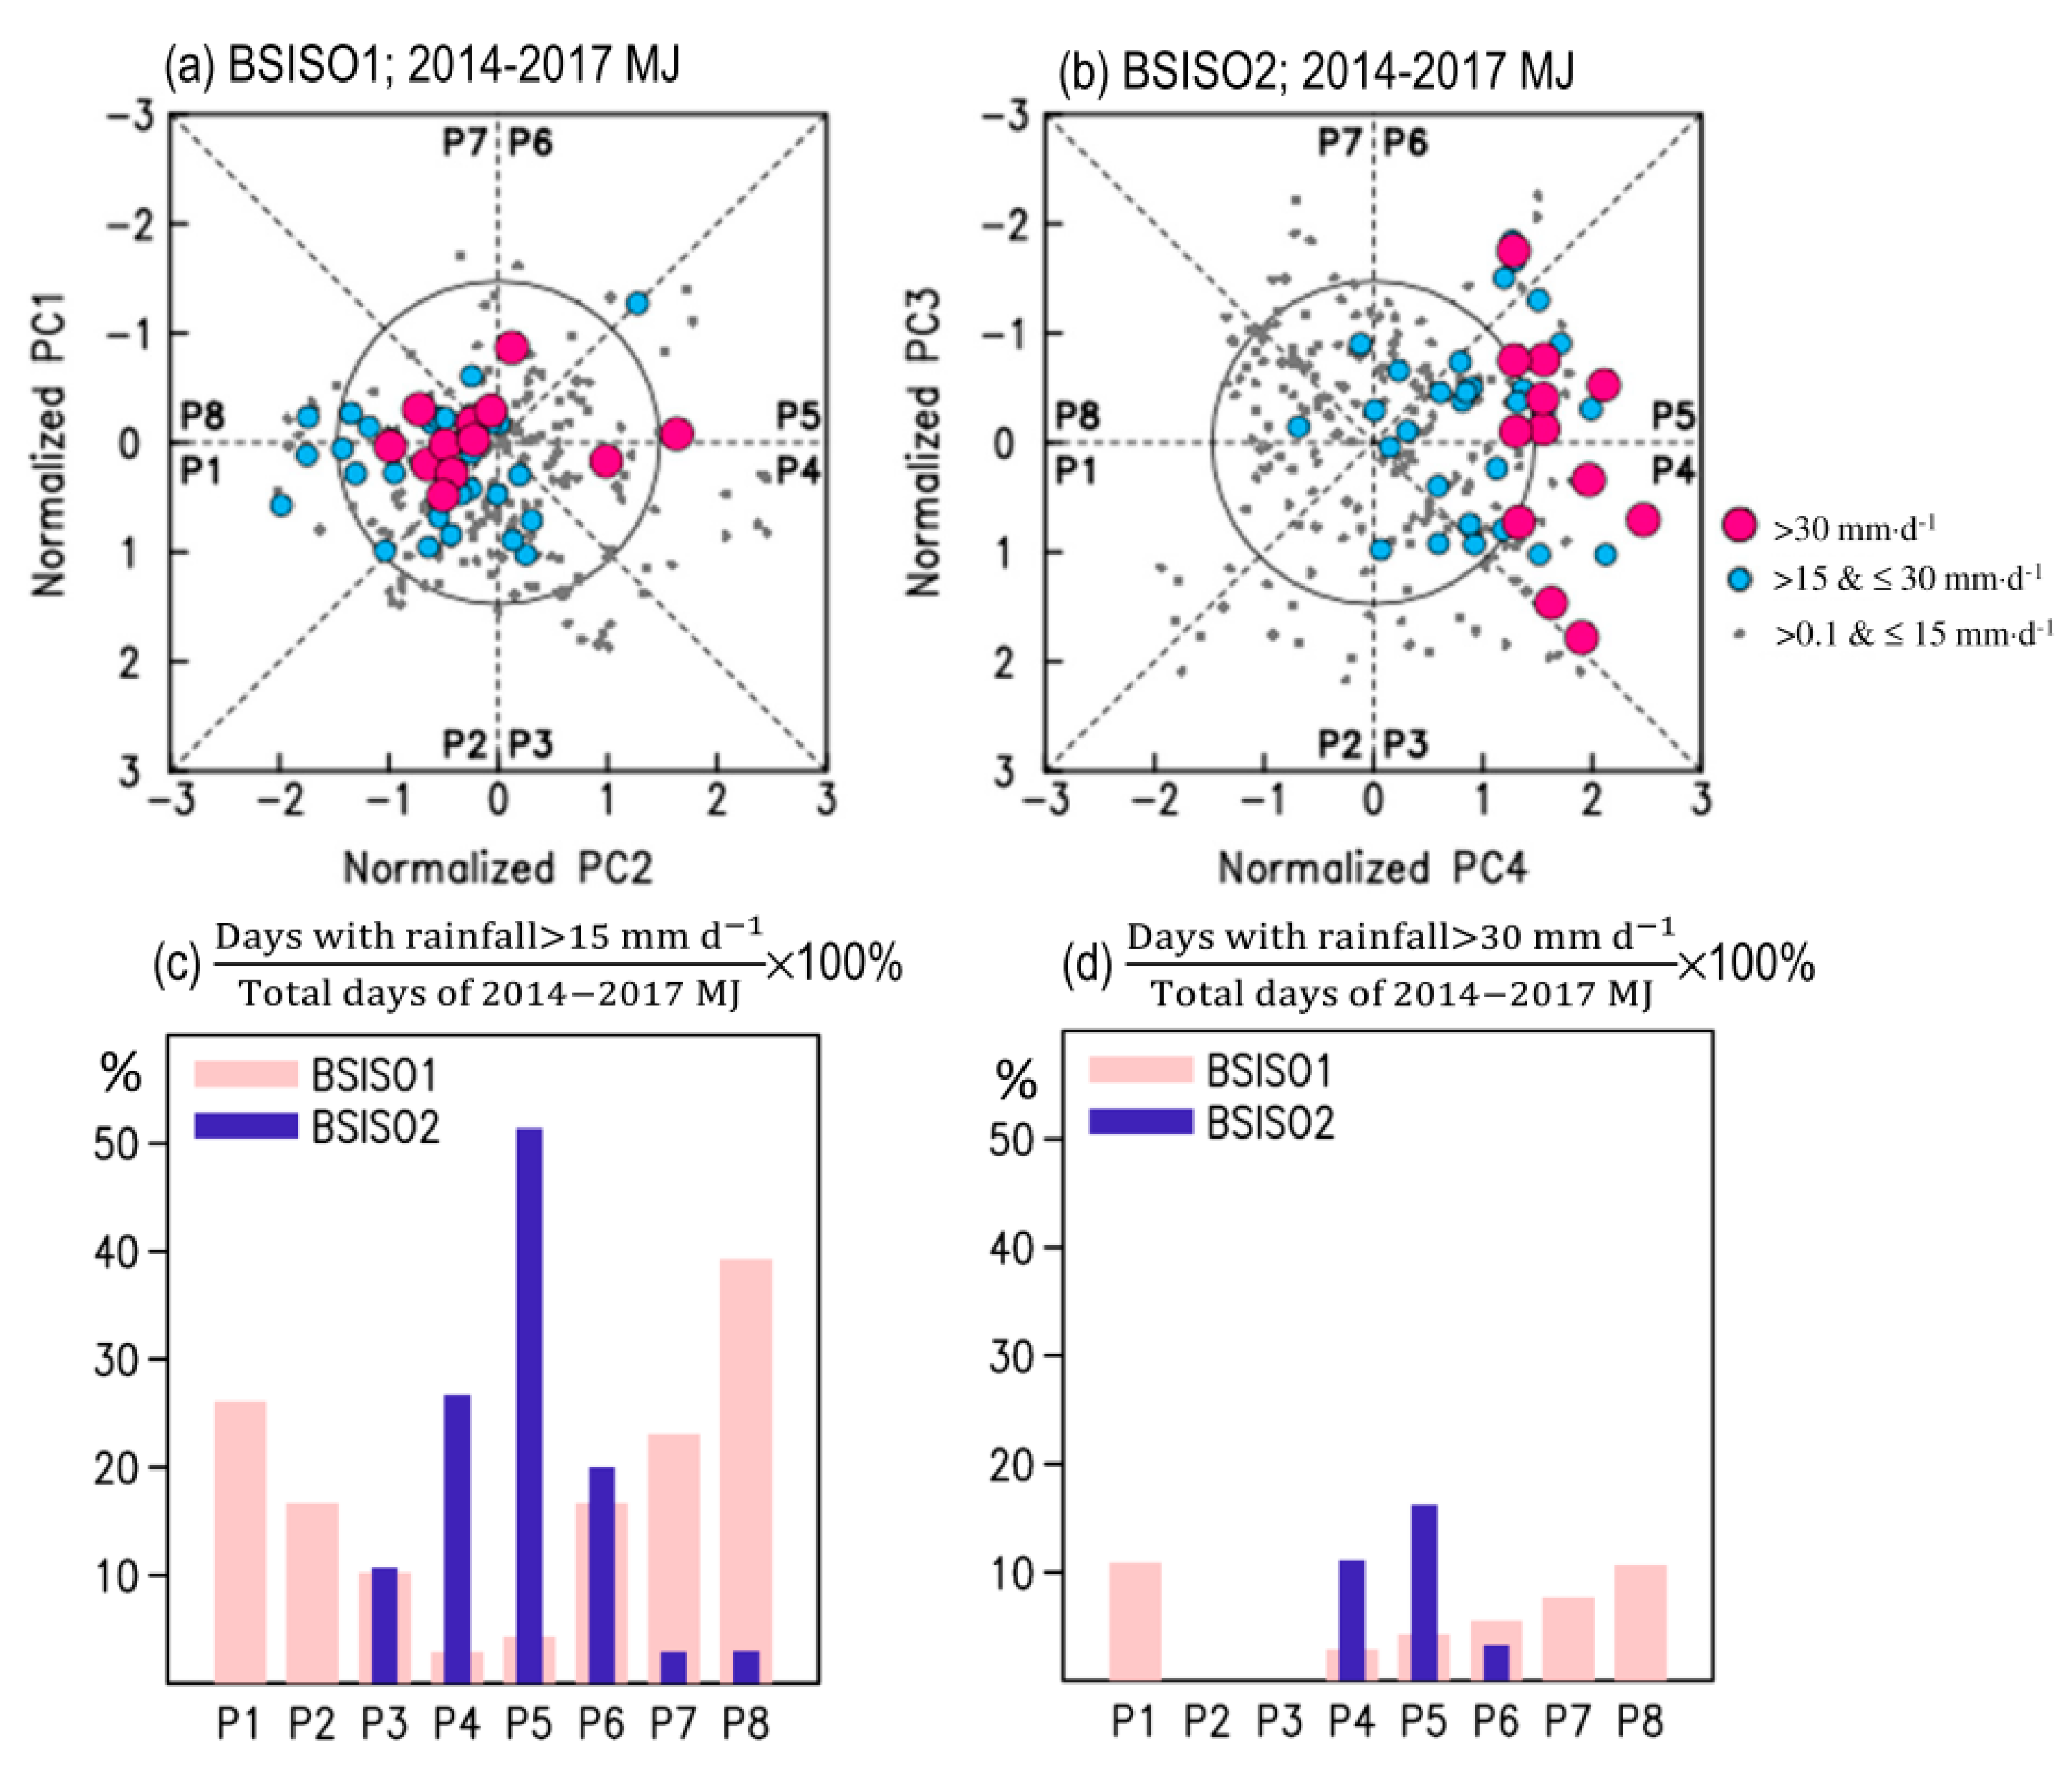
The question remains of whether the above documented features are only revealed in the Meiyu season of 2017. To clarify this, we further examine the rainfall events for the Meiyu seasons of 2014–2017. The selection of the starting year of 2014 is because GPM IMERG data are only available after March 2014. It is noted from Figure 5a,c,d (pink bar) that most of the heavy rainfall events (>15 mm/day) occurred in phase 8 to 1 of BSISO1, with an amplitude of BSISO1 smaller than 1.5 (i.e., weak BSISO1 case). This is similar to what was revealed in Figure 4a for the 2017 Meiyu season. In contrast, it is noted from Figure 5b,c,d (blue bar) that most of the heavy rainfall events (>15 mm/day) occurred in phases 4-6 of BSISO2. Focusing on Figure 5b, it is further noted that not all of the heavy rainfall events (>15 mm/day, blue and red dots) occur when the BSISO2 is strong (i.e., amplitude >1.5). However, when the BSISO2 is stronger, it has a higher chance to have a larger amount of Meiyu rainfall formed in Taiwan (i.e., red dots mostly occur when the amplitude of BSISO2 > 1.5). This is consistent with what was revealed in Figure 4b.
In a summary of Figure 4 and Figure 5, we find that BSISO2 is more important than BSISO1 in determining the occurrence of heavy rainfall events in Taiwan during the 2014–2017 Meiyu seasons. Huang et al. [28] have applied the power spectrum analysis on the Taiwan rainfall during the entire period of March 2014 to February 2017, and it can be seen in their result that the 30 to 60 day ISO mode is not as important as the 10 to 30 day ISO mode. This is consistent with our findings of Figure 4 and Figure 5. Therefore, the following analyses will be focused only on issues related to BSISO2.
It can be inferred from (1) the similarity between the EOF patterns used in the current study (Supplementary Figure S1) and those used in Lee et al. [10] and (2) the similarity between the time series of PCs used in the current study and those provided by APCC (Supplementary Figure S2) that the phase-space patterns in Figure 4a,b and Figure 5a,b should correspond to those shown in Figure 8 of Lee et al. [10]. This inference is confirmed by the figure provided in the Supplementary Information (Figure S6), which consists of northward moving signals. Further examinations and discussions for the northward propagating signals of atmospheric circulations related to BSISO2 are given next to help understand why the heavy rainfall events tend to occur in phases 4–6 of BSISO2.
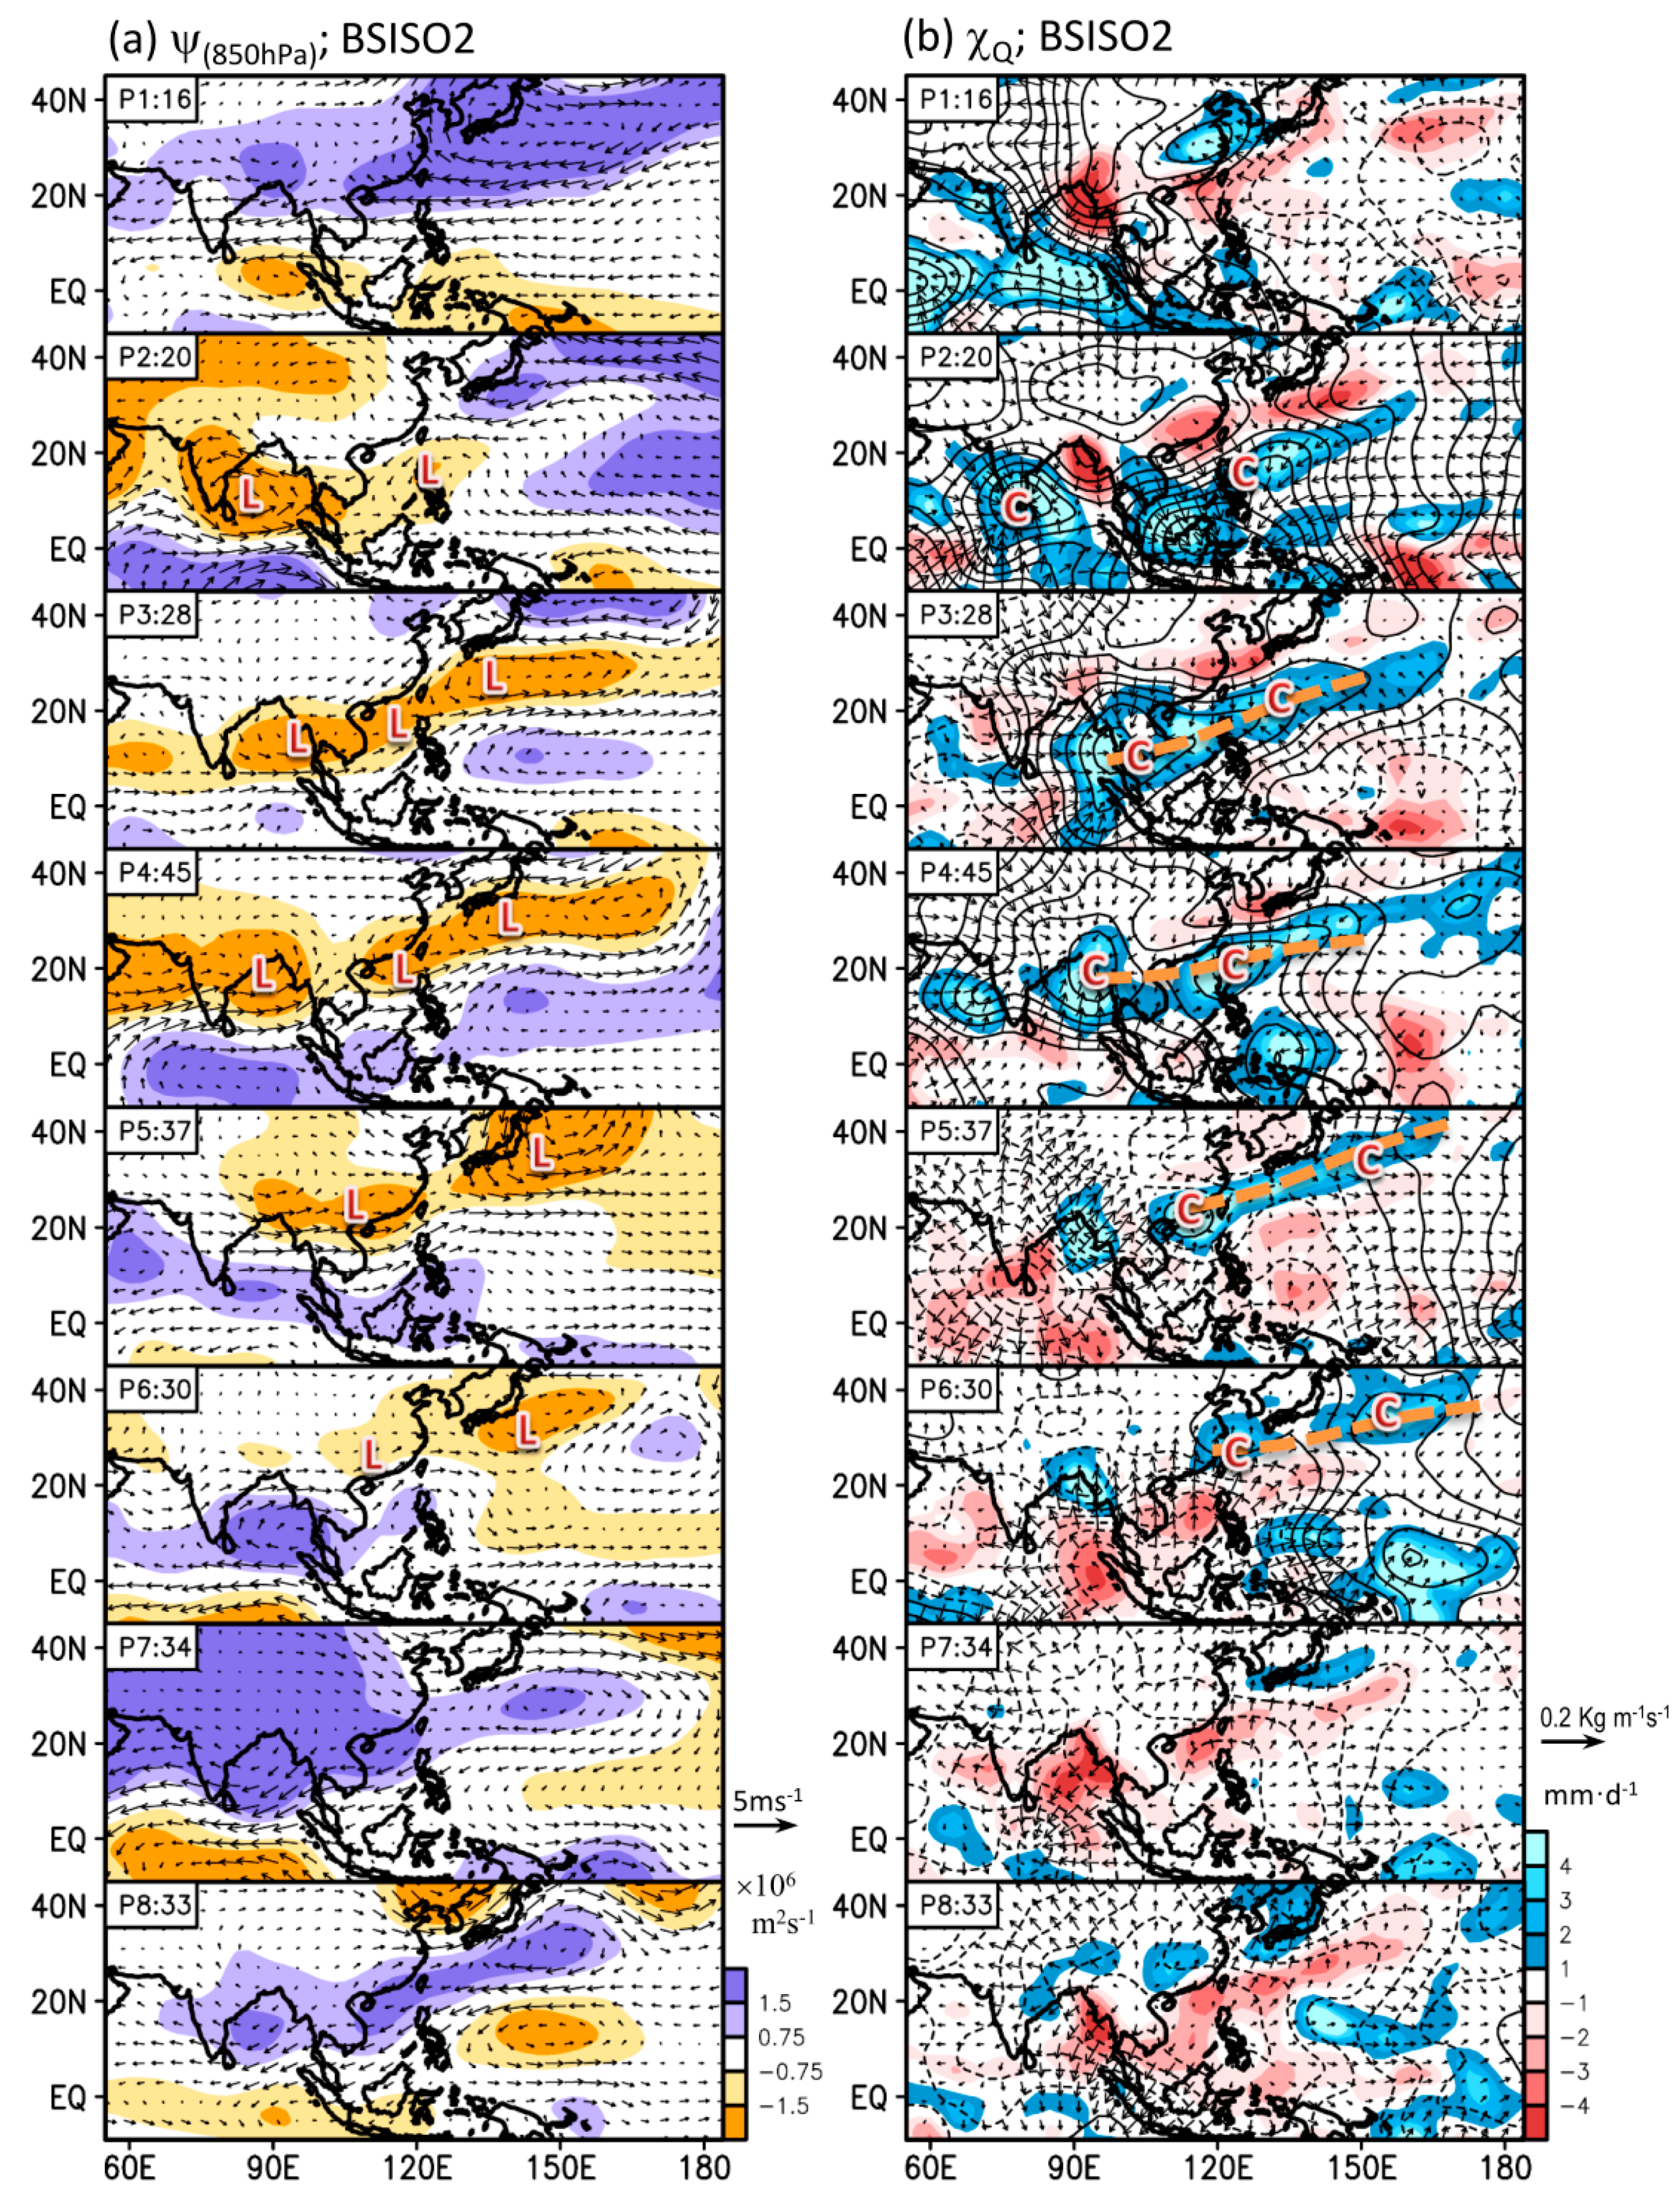
First, we make composites of low-level wind circulation at 850 hPa superimposed with the related stream function for the 8 phases of BSISO2 during the Meiyu seasons of 2014 to 2017 (Figure 6a). Notably, to help make a difference among the 8 phases of BSISO2 clearer, Figure 6 is constructed using the daily anomalies. In addition, because only data of 2014–2017 MJ is used for the composites in Figure 6, the daily anomalies are obtained by removing the mean value of 2014–2017 MJ, instead of the seasonal mean of the whole period used for the MV-EOF analysis (i.e., 2014–2017 MJJASO). By doing this, we can ensure that the average of 8 phases in Figure 6 is close to zero, and the differences between phases can be more clearly represented. In contrast, if Figure 6a is constructed by removing the mean value of 2014–2017 MJJASO (see Supplementary Figure S7b), a high system pattern will be revealed over the western North Pacific region in all phases of BSISO2. This high system pattern is induced because of the difference between the MJ mean and the MJJASO mean of 2014–2017 (see Supplementary Figure S8).
Notably, even though months and years used in this study for the composites of circulations are different to those used in Lee et al. [10], we do find that our phase-space patterns for the composites of circulations in Figure 6a are similar to those in Figure 10 of Lee et al. [10], which both show the northward moving signal of atmospheric circulations. The propagating signal of Figure 6a is described below. As seen from Figure 6a, the low-pressure system (i.e., cyclonic flow) first appears over the Bay of Bengal in phases 1–2 and then propagates north and expands westward to cover the area of the South China Sea during phases 2–3. At phase 3, the low system is located south of Taiwan, and Taiwan is under the modulation of northerly wind anomalies, which implies a decrease in monsoon southwesterly wind. The low system over southern Taiwan keeps propagating northward during phases 4–6. During this period, Taiwan is mainly under the modulation of southwesterly wind anomalies (i.e., increase in the southwesterly monsoon). During phases 7-1 of BSISO2, the low system closes to Taiwan disappeared and Taiwan is under the modulation of a high system (i.e., anti-cyclonic flow).
Overall, the enhancement of monsoon southwesterly wind appears over Taiwan at phases 4–6 of BSISO2. Such enhancement of monsoon southwesterly wind can generally bring more moisture supply to support rainfall formation in Taiwan [1,2]. It can be seen in 
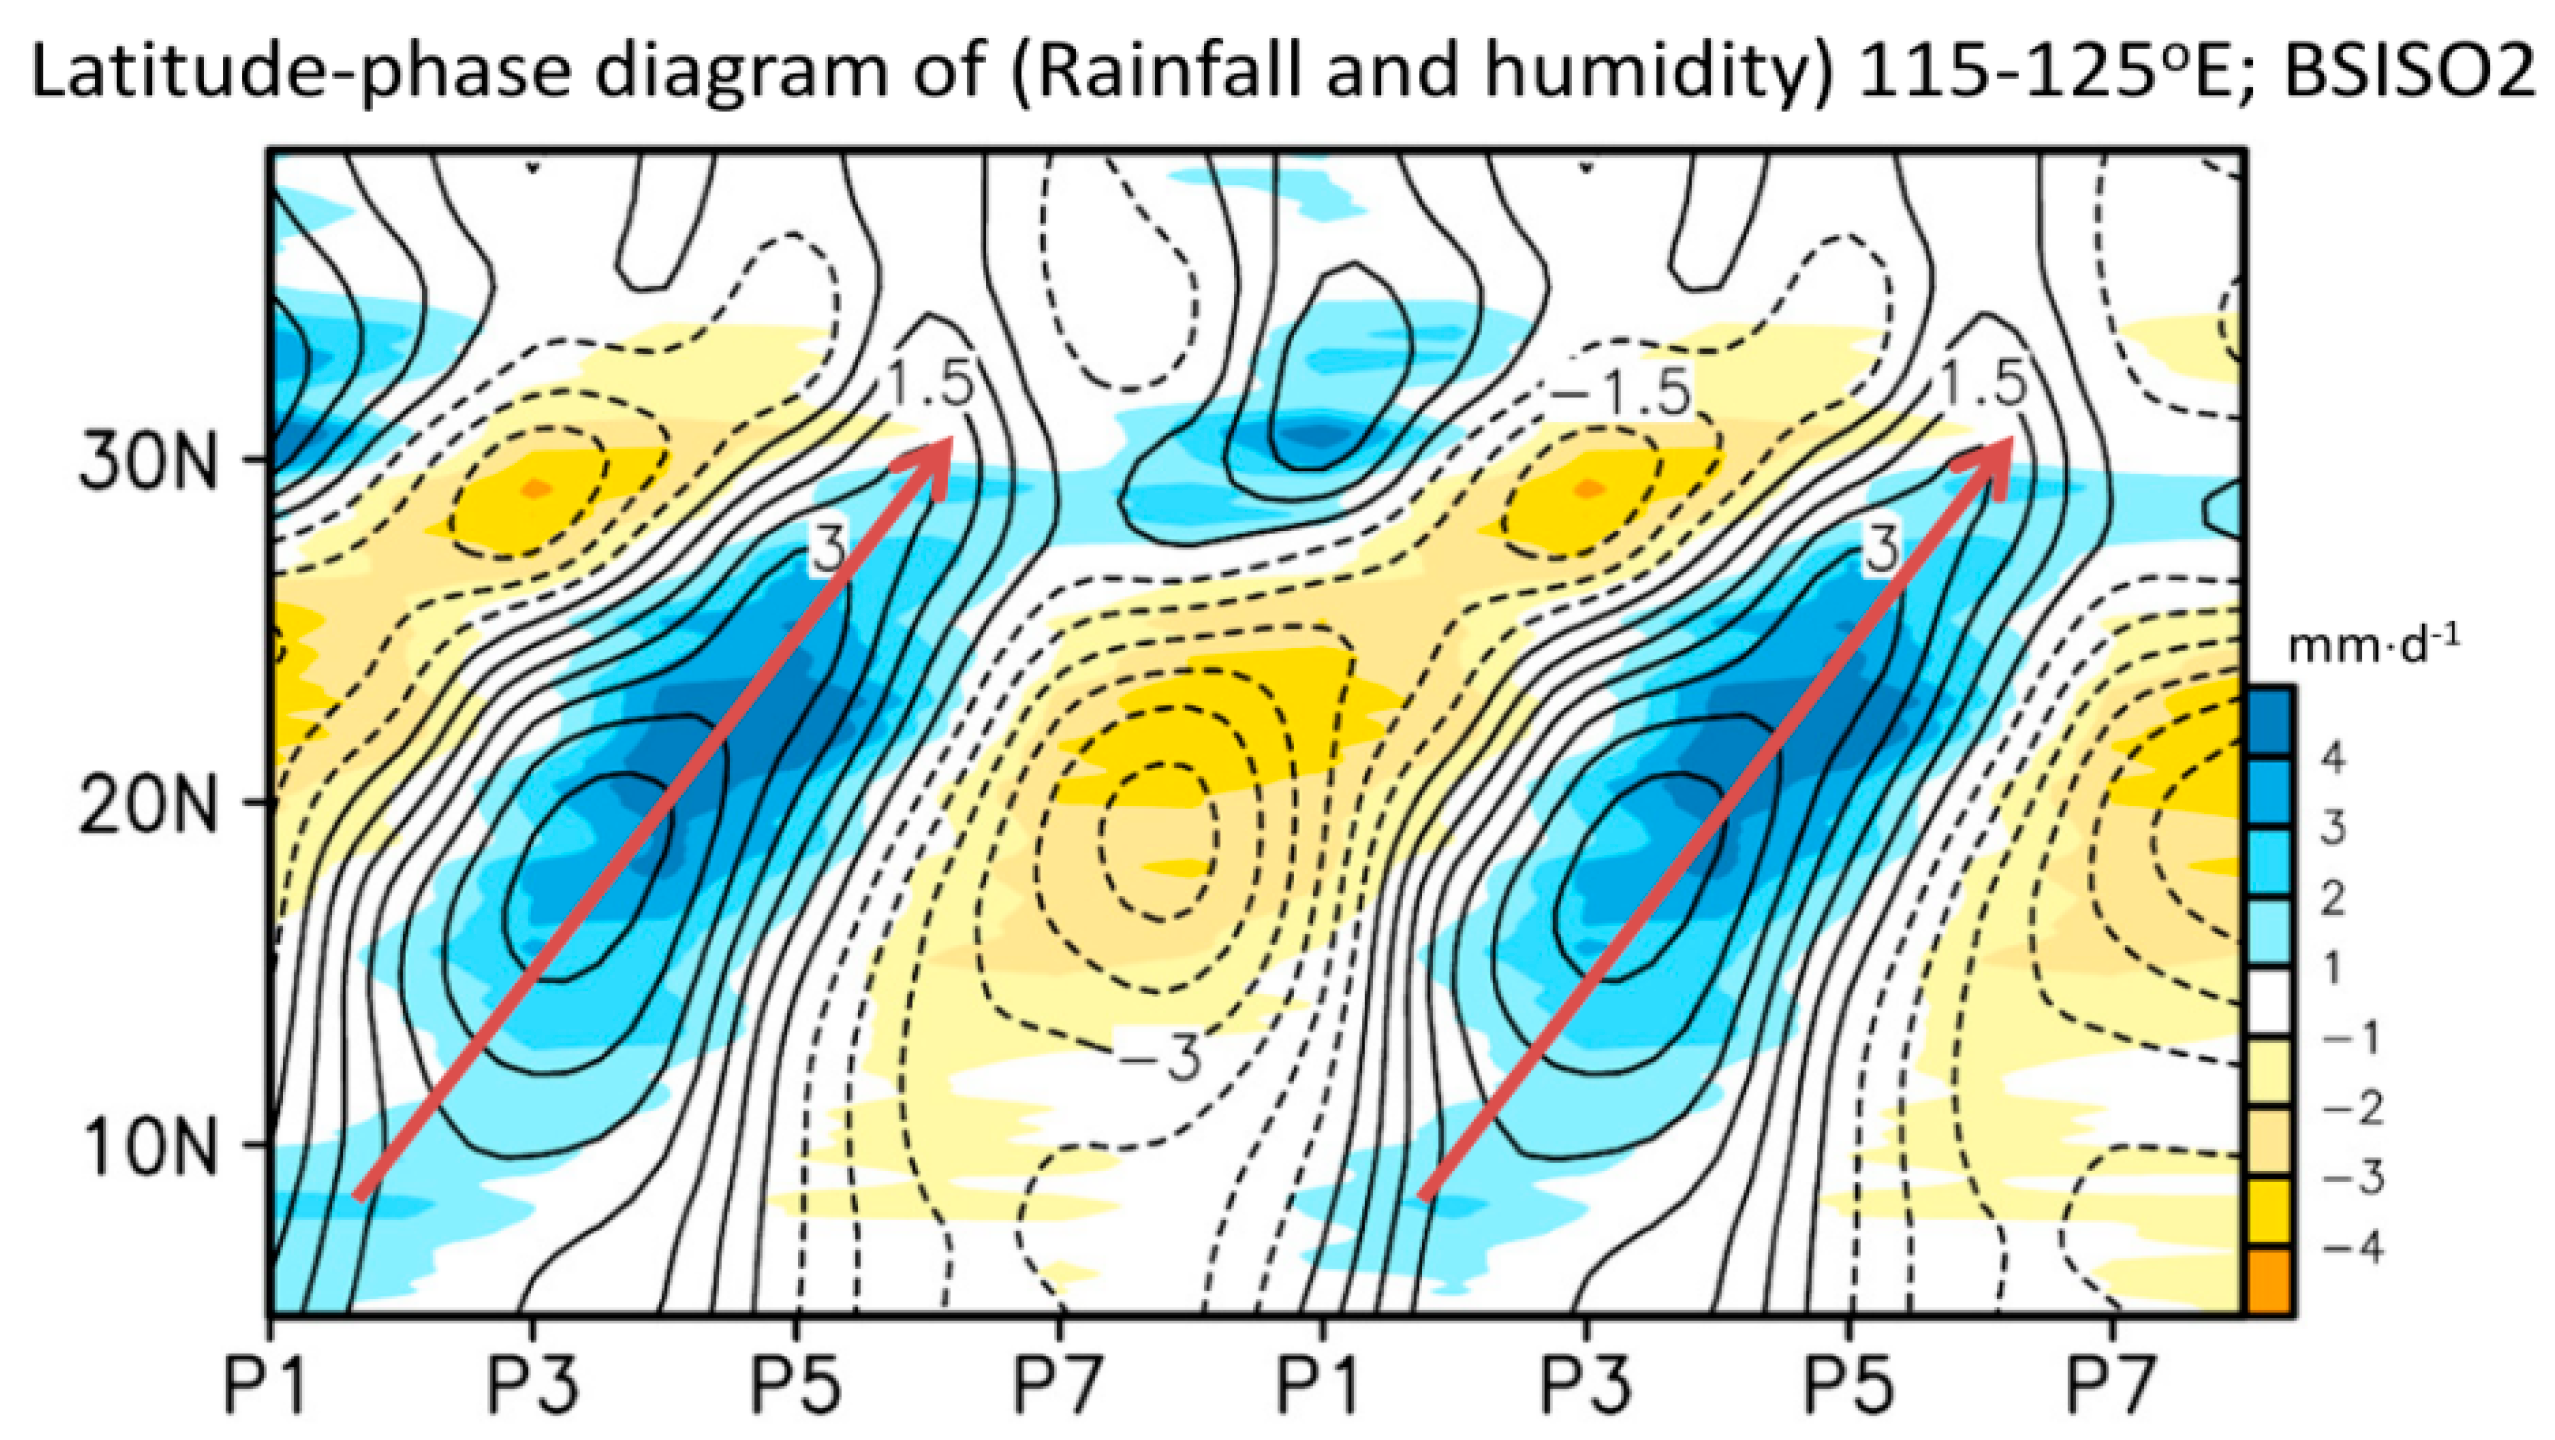
Figure 6b, which is the composite daily rainfall superimposed with the potential function of vertically integrated moisture flux convergence for the 8 phases of BSISO2, that the moisture flux convergence center is located over Taiwan during phases 4–6 of BSISO2. If we backtrack the movement of the moisture flux convergence center, it can be found that the convergence is actually propagating from the lower latitude regions to Taiwan. Such a feature can be further clarified by Figure 7, which shows a good match between the northward propagation of rainfall (shaded) and vertically integrated specific humidity (contoured) averaged over 115–125° E under the modulation of 8 phases of BSISO2. Notably, the data used to construct Figure 7 are extracted from the related composites for 8 phases of BSISO2 during the Meiyu seasons of 2014–2017 (e.g., Figure 6b).
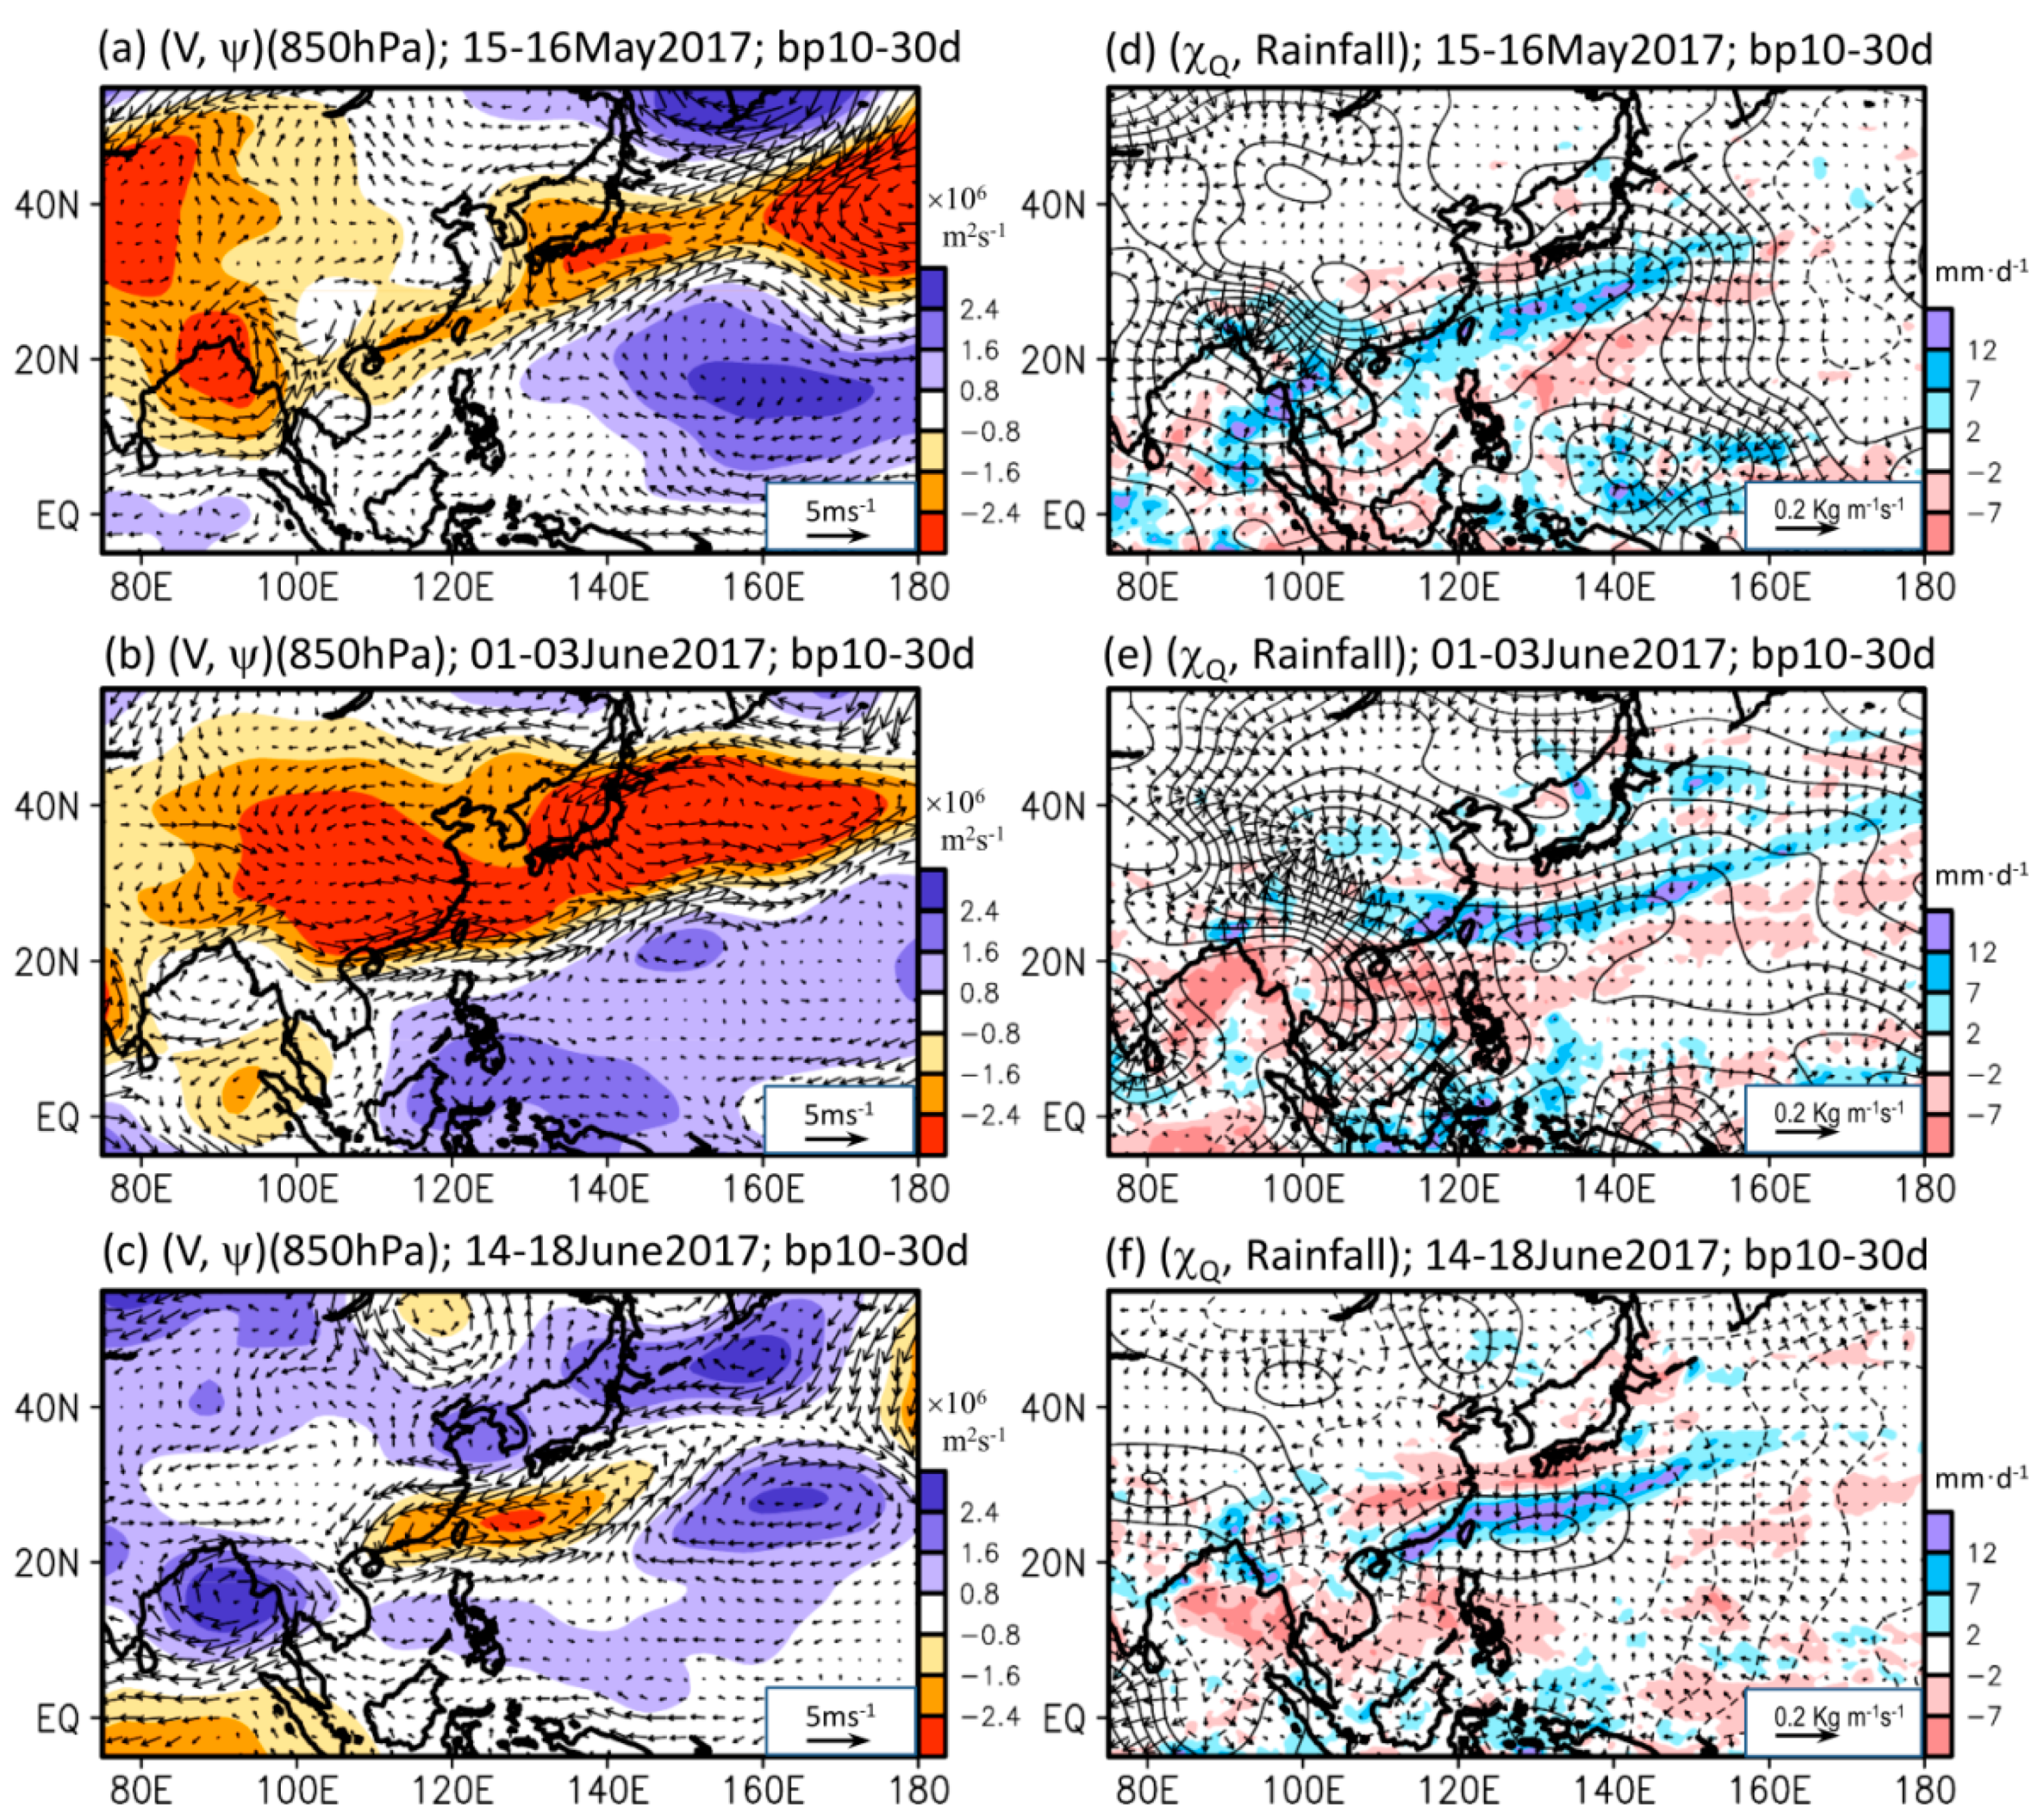
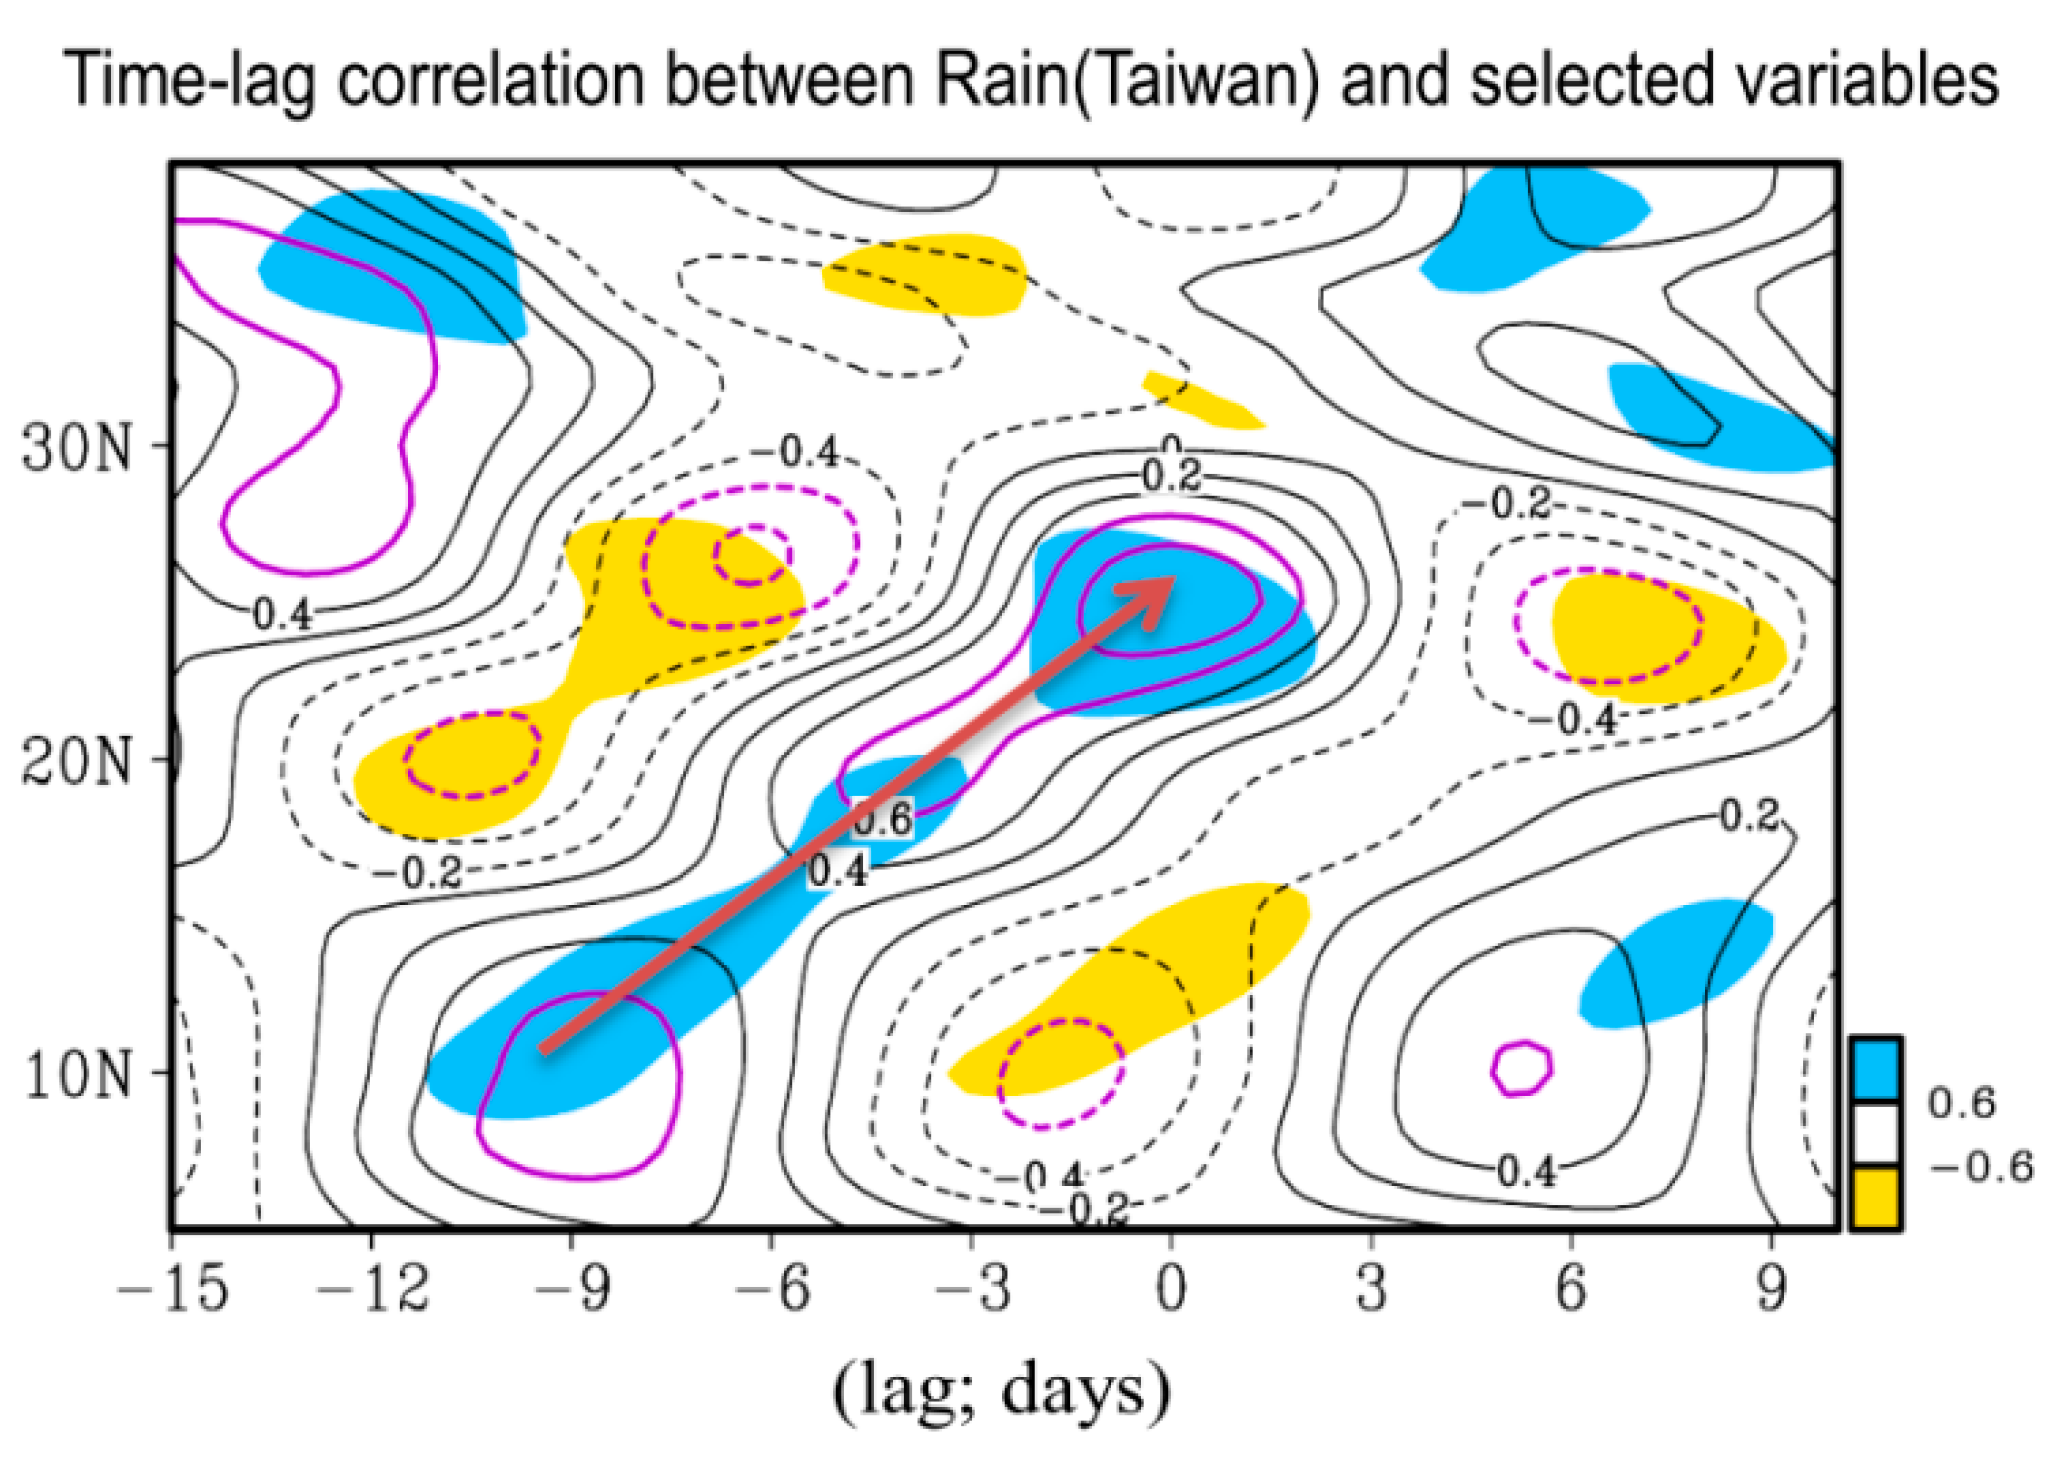
On the other hand, focusing on 2017, it can be seen from the examinations of 10-to-30 day band pass filtered (i.e., related to BSISO2) low-level circulation and moisture flux convergence for cases FR1, FR2, and FR3, that Taiwan was under the modulation of enhanced monsoon southwesterly wind (Figure 8a–c) and enhanced moisture flux convergence (Figure 8d,f) when the heavy rainfall occurred. Moreover, to further clarify that, under the modulation of BSISO2 (i.e., 10 to 30 day ISO), the moisture supply propagates from the lower latitude regions to Taiwan to support the heavy rainfall formation in Taiwan during the 2017 Meiyu season, we construct a time lagged correlation between the 10 to 30 day bandpass filtered rainfall formation in Taiwan (green line in Figure 4c), the related latitude time diagram of rainfall (shaded in Figure 9), and the moisture supply (contoured in Figure 9) for the 2017 Meiyu season. As seen from Figure 9, a clear northward propagation feature is revealed for both the rainfall and moisture supply over 10–25° N. These features (Figure 6, Figure 7, Figure 8 and Figure 9), which are summarized by a schematic diagram given in 
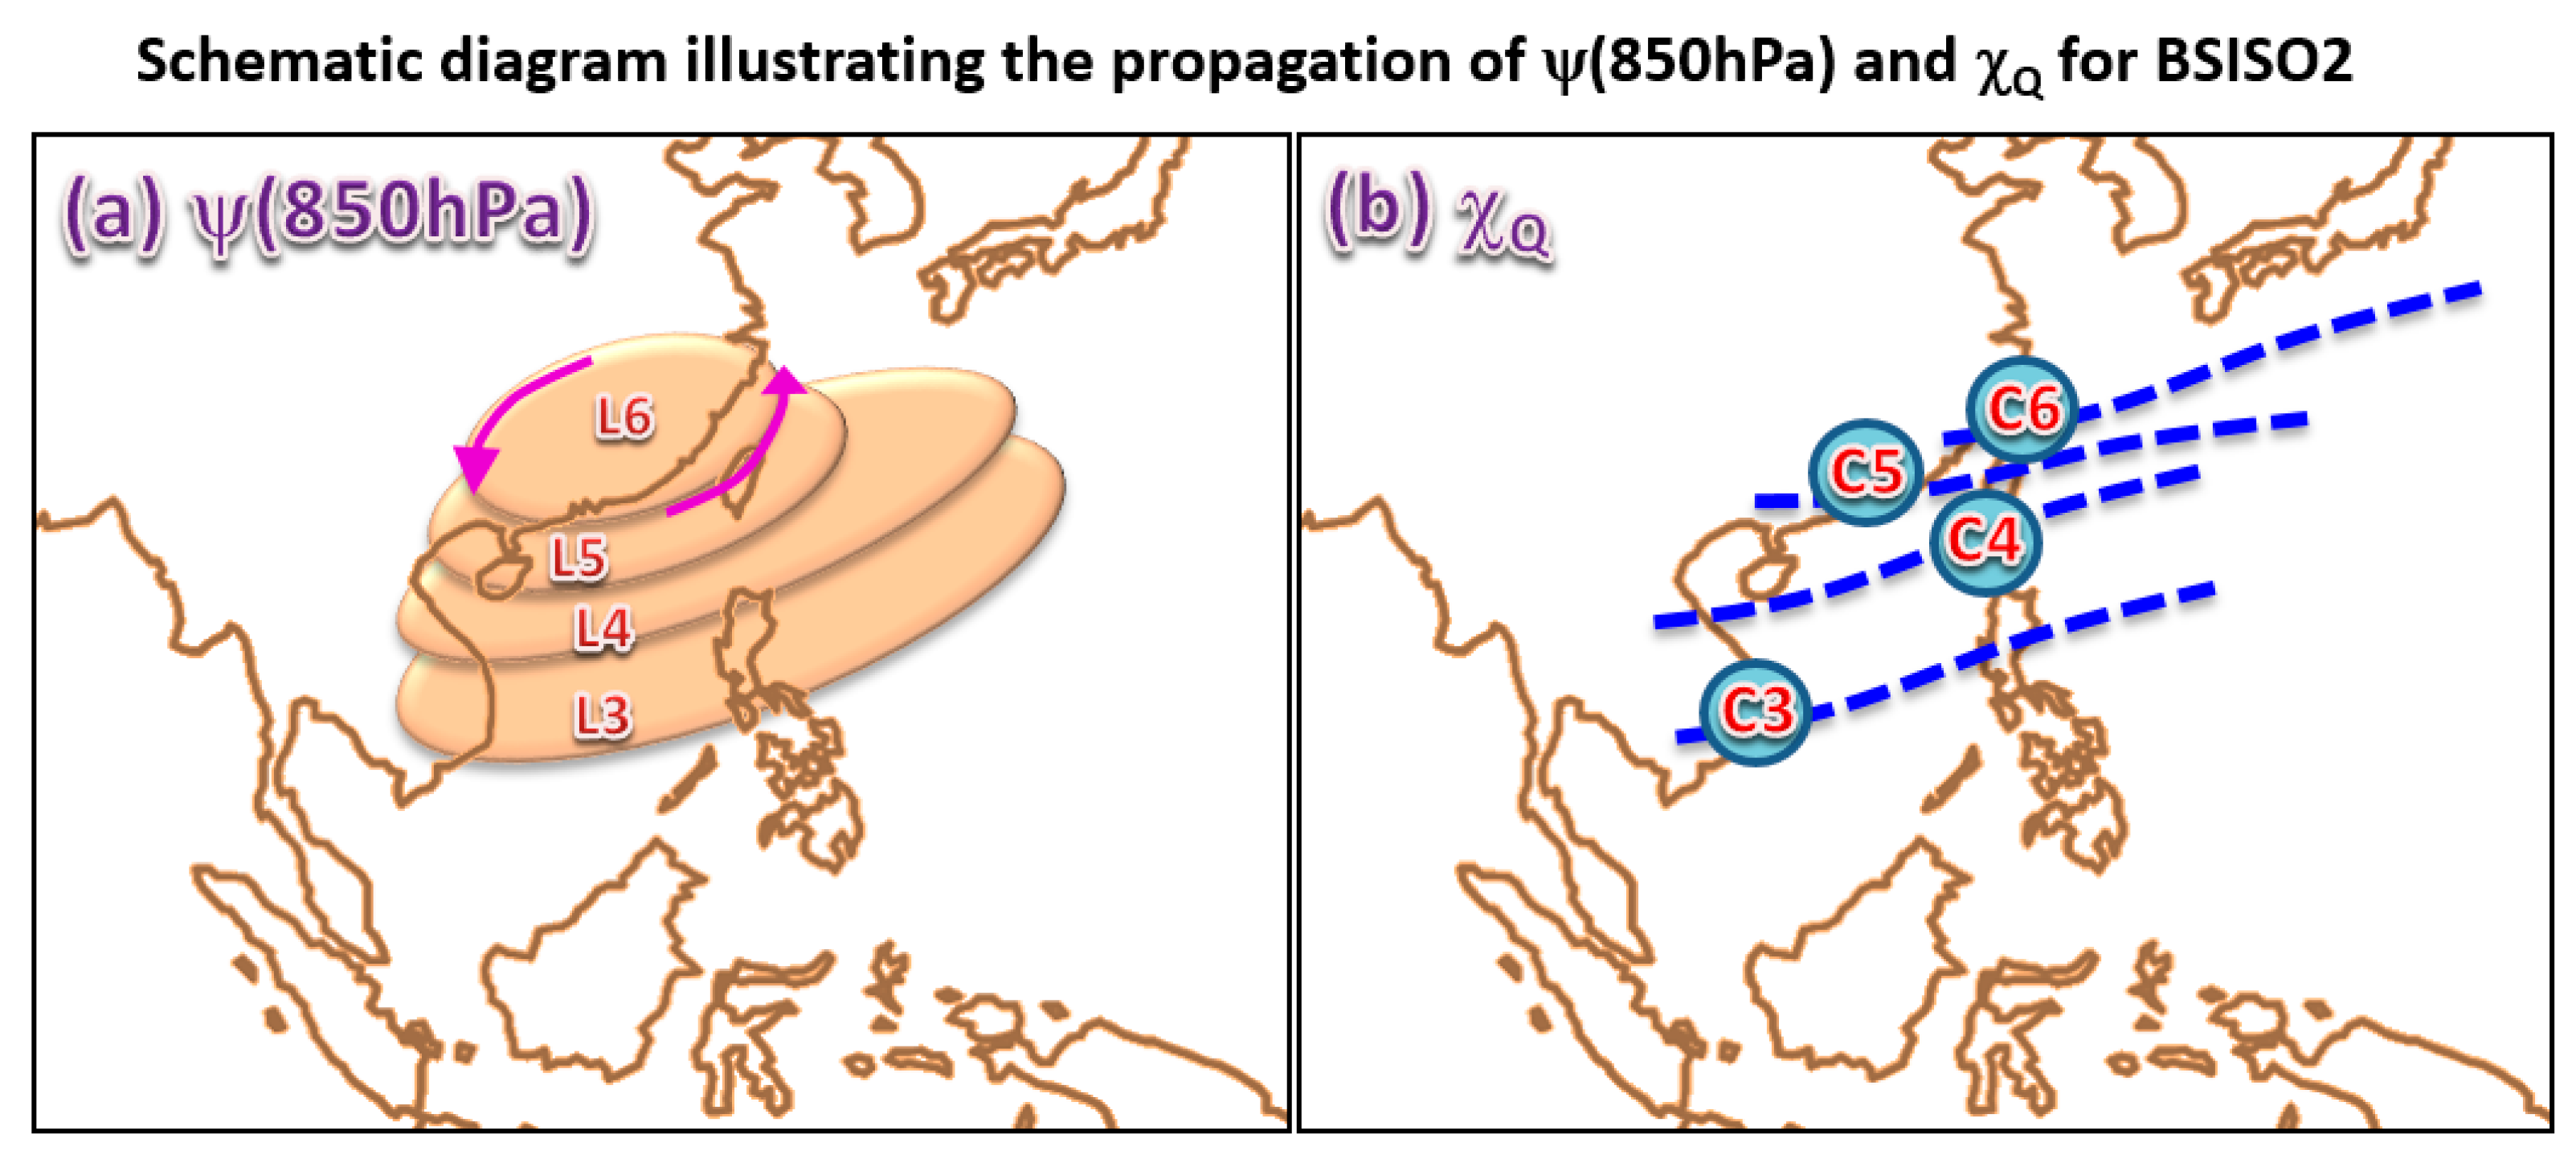
Figure 10, explain how the BSISO2 can impact the atmospheric conditions (including the enhancement of southwesterly winds and moisture flux convergence) that are favorable for the formation of heavy rainfall events in Taiwan during the Meiyu seasons of 2014 to 2017.

4. Discussion

Since the rainfall formation in Taiwan during the 2017 Meiyu season has been demonstrated to be greatly modulated by the atmospheric circulation and moisture flux convergence related to BSISO2 (see Section 3), this section discusses whether a better performance of the model in predicting the index of BSISO2, is related to a better performance of the model in forecasting the timing of rainfall formation in Taiwan during the 2017 Meiyu season.
First, we evaluate the model’s performance in depicting the BSISO indices by examining the bivariate correlation coefficients following Lee et al. [12]. 
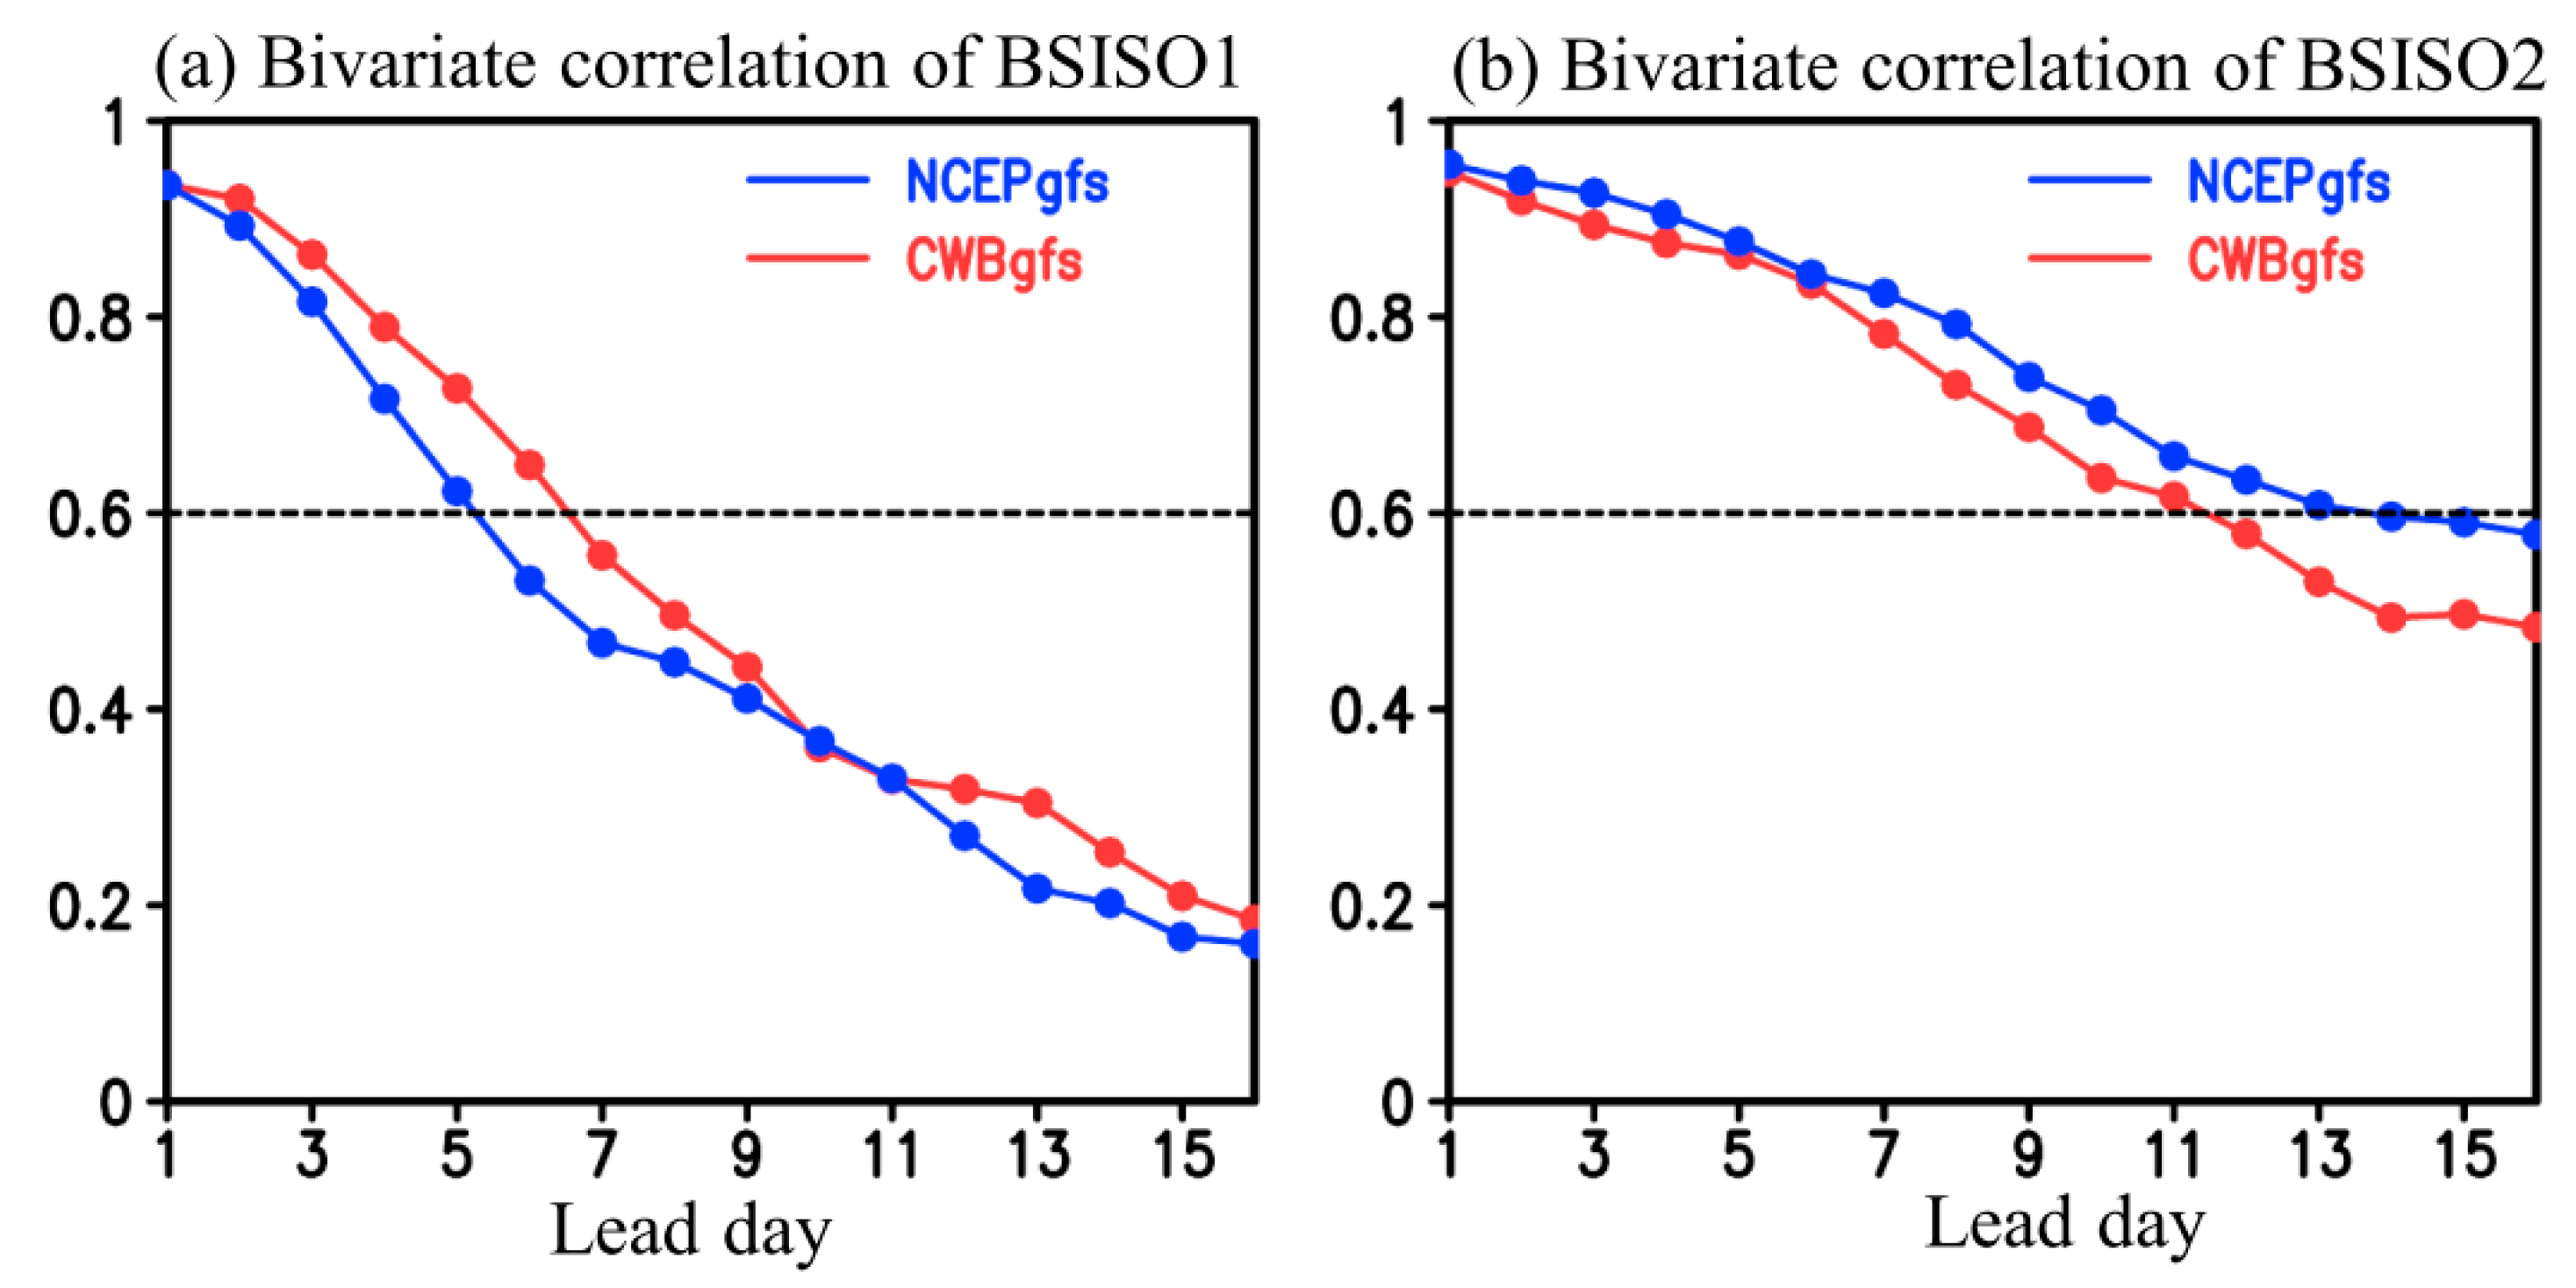
Figure 11 shows the bivariate correlation coefficients for the index of BSISOs during the 2017 Meiyu season forecasted by NCEPgfs (blue line) and CWBgfs (red line) at lead times of 1 day to 16 days. The calculation of bivariate correlation coefficients is based on Equation (2) using the PCs from the two sets of forecasts, as documented in the Supplementary Information (Figure S3). Overall, it shows that both NCEPgfs and CWBgfs have better performance in evaluating the index of BSISO2 (Figure 11b) than the index of BSISO1 (Figure 11a). Using the value of 0.6 as the criterion of good forecast skill, the NCEPgfs has a good forecast skill of BSISO2 (BSISO1) at lead times of 1 day to 14 days (1 day to 5 days), while CWBgfs has a good forecast skill of BSISO2 (BSISO1) at lead times of 1 day to 11 day (1 day to 6 days).
Notably, by using the same criterion of 0.6, it can be inferred from Figure 8 of Lee et al. [12] that CFS (Climate Forecast System) and ECM (ECMWF Ensemble Prediction System) models also perform better in forecasting the index of BSISO2 than the index of BSISO1 in the months of May and June, but not in the months of July to October, during 2013 to 2015. In contrast, BOM (the model provided by the Australian Bureau of Meteorology) shows a better performance in predicting the index of BSISO1 than the index of BSISO2 for all months of May to October, during 2013 to 2015 [12]. Based on above discussions, it is clear that the prediction skill for the index of BSISOs can vary by the selection of months and by the selection of models. However, because the focus of this study is on the Meiyu season (i.e., MJ), no further discussions are provided for the performance of NCEPgfs and CWBgfs in forecasting the index of BSISOs in the other months of 2017.
On the other hand, by comparing Figure 11a with Figure 11b, it seems that CWBgfs has a better skill than NCEPgfs in forecasting the BSISO1, and the reverse situation is true for the forecast of BSISO2 during the 2017 Meiyu season. Since the BSISO2 is more important than BSISO1 in affecting the rainfall formation in Taiwan during the 2017 Meiyu season (see 
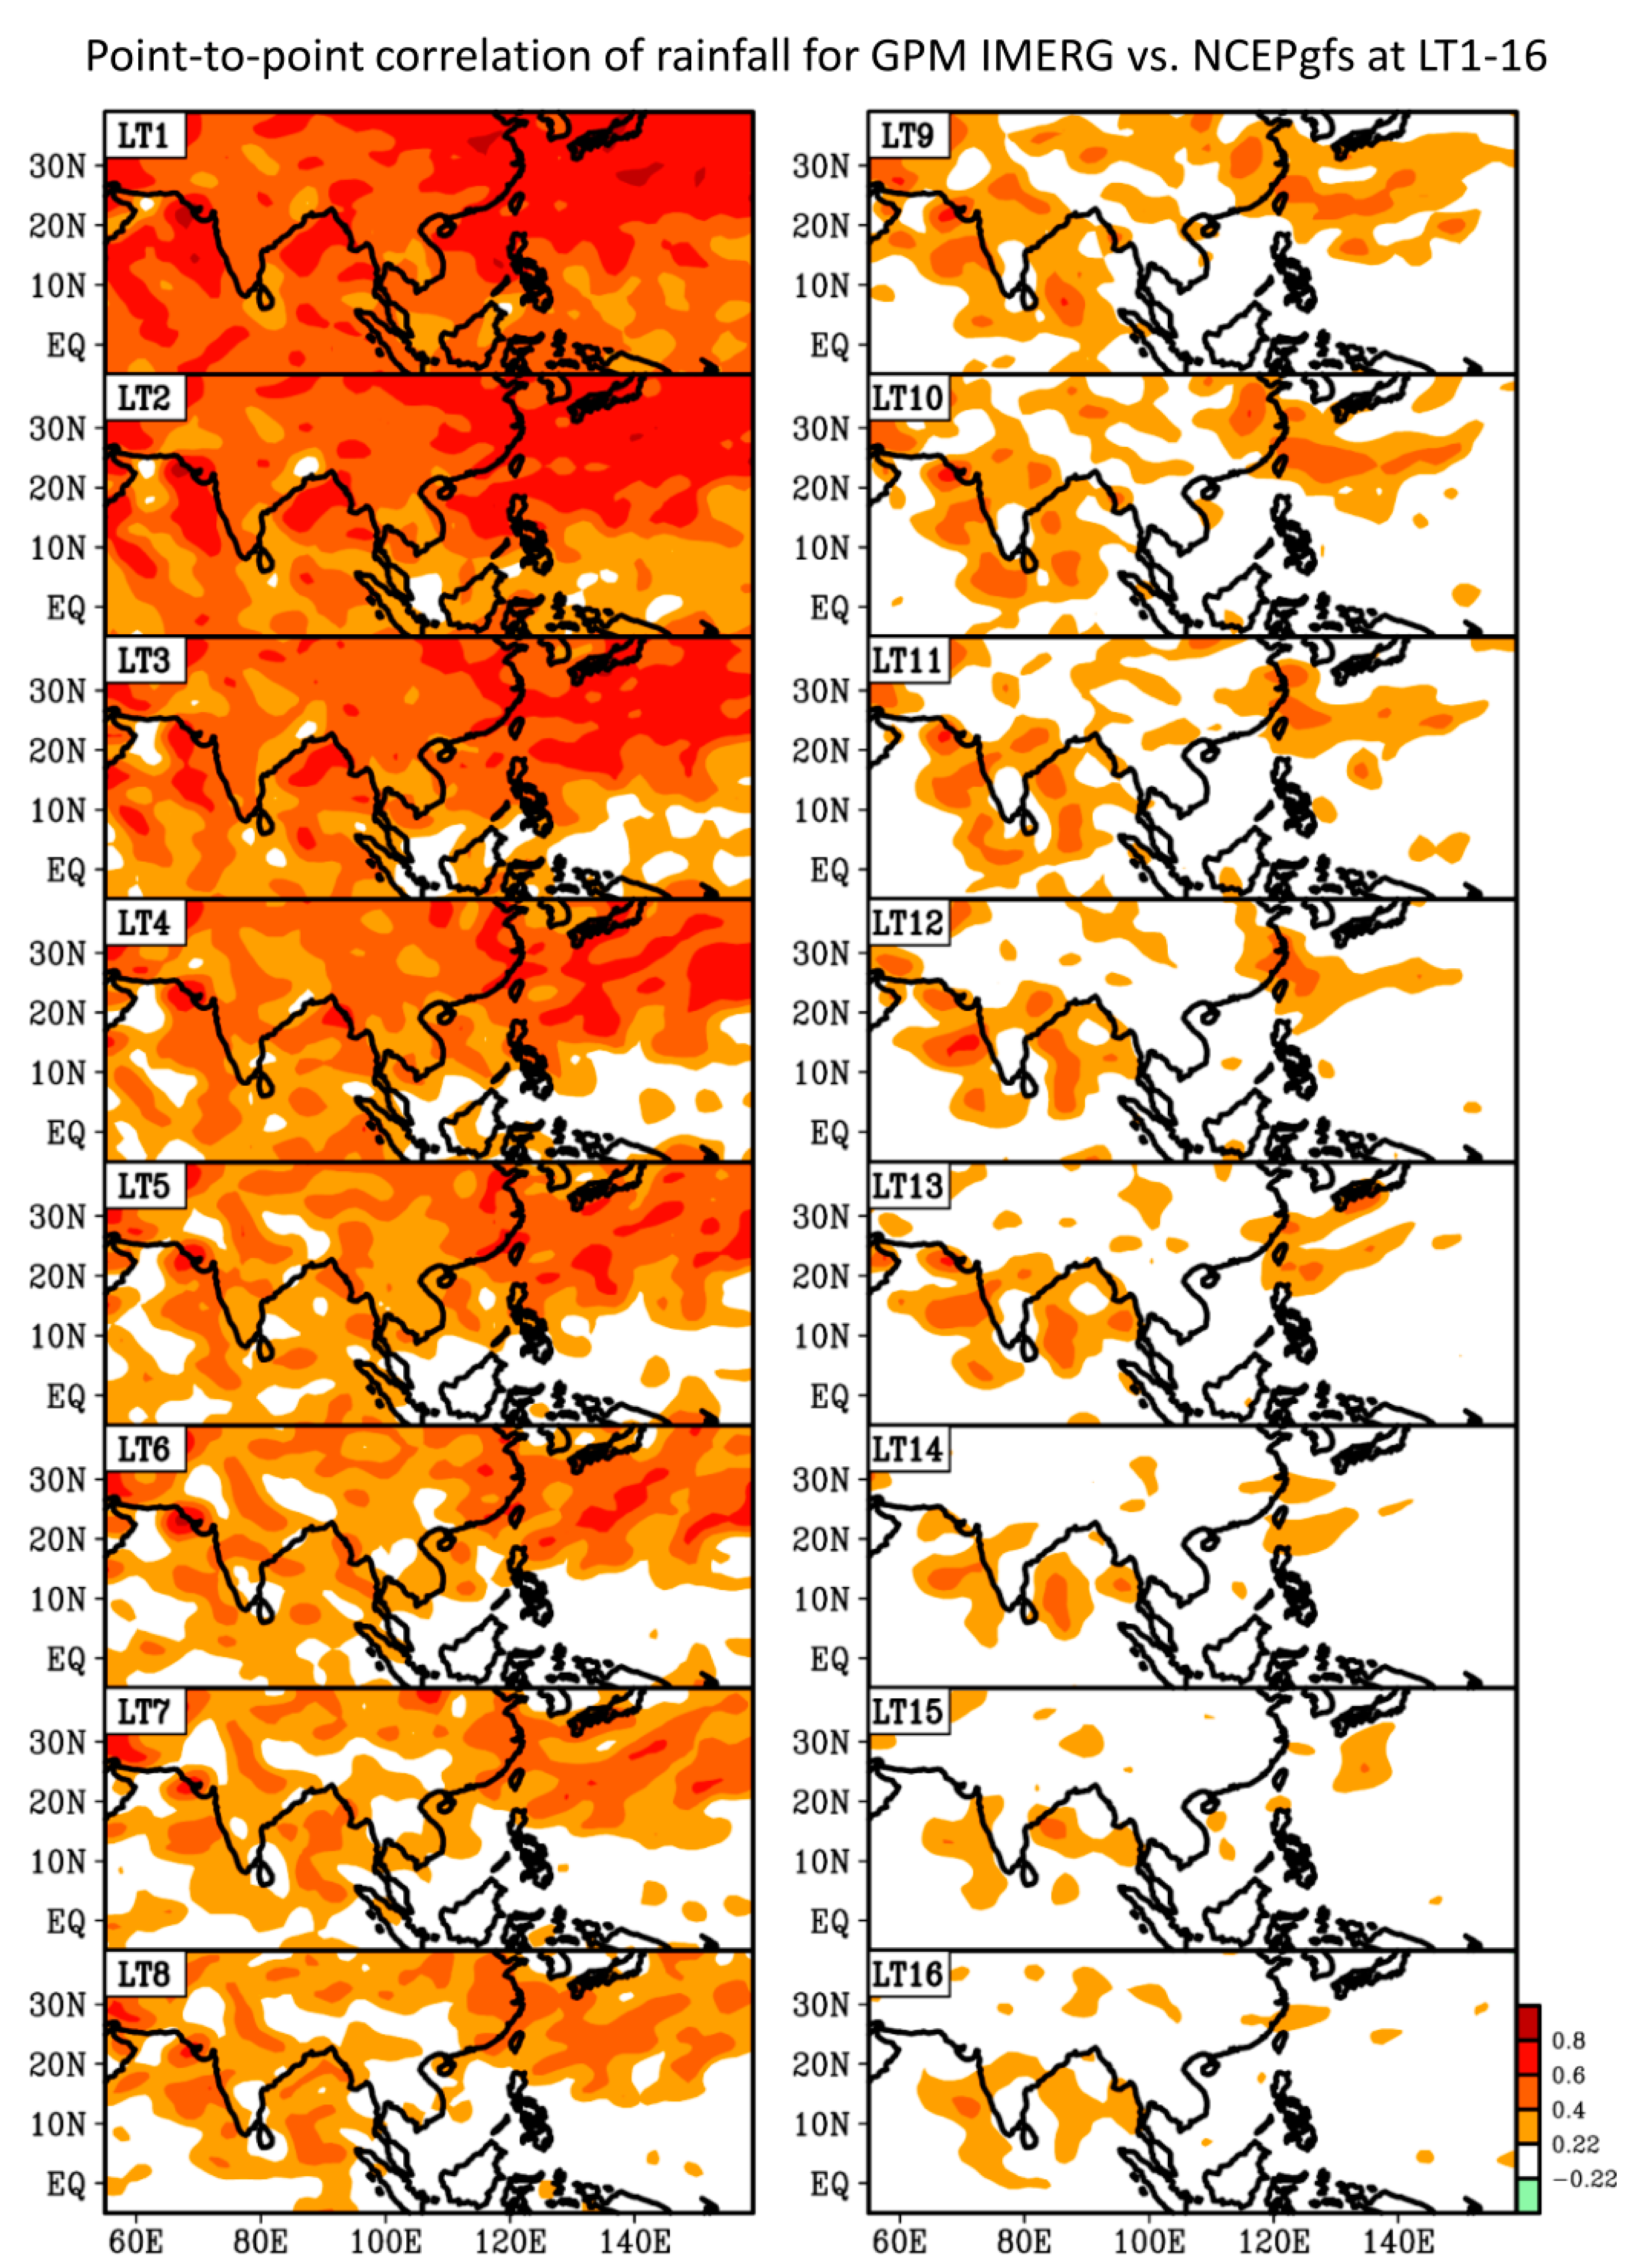
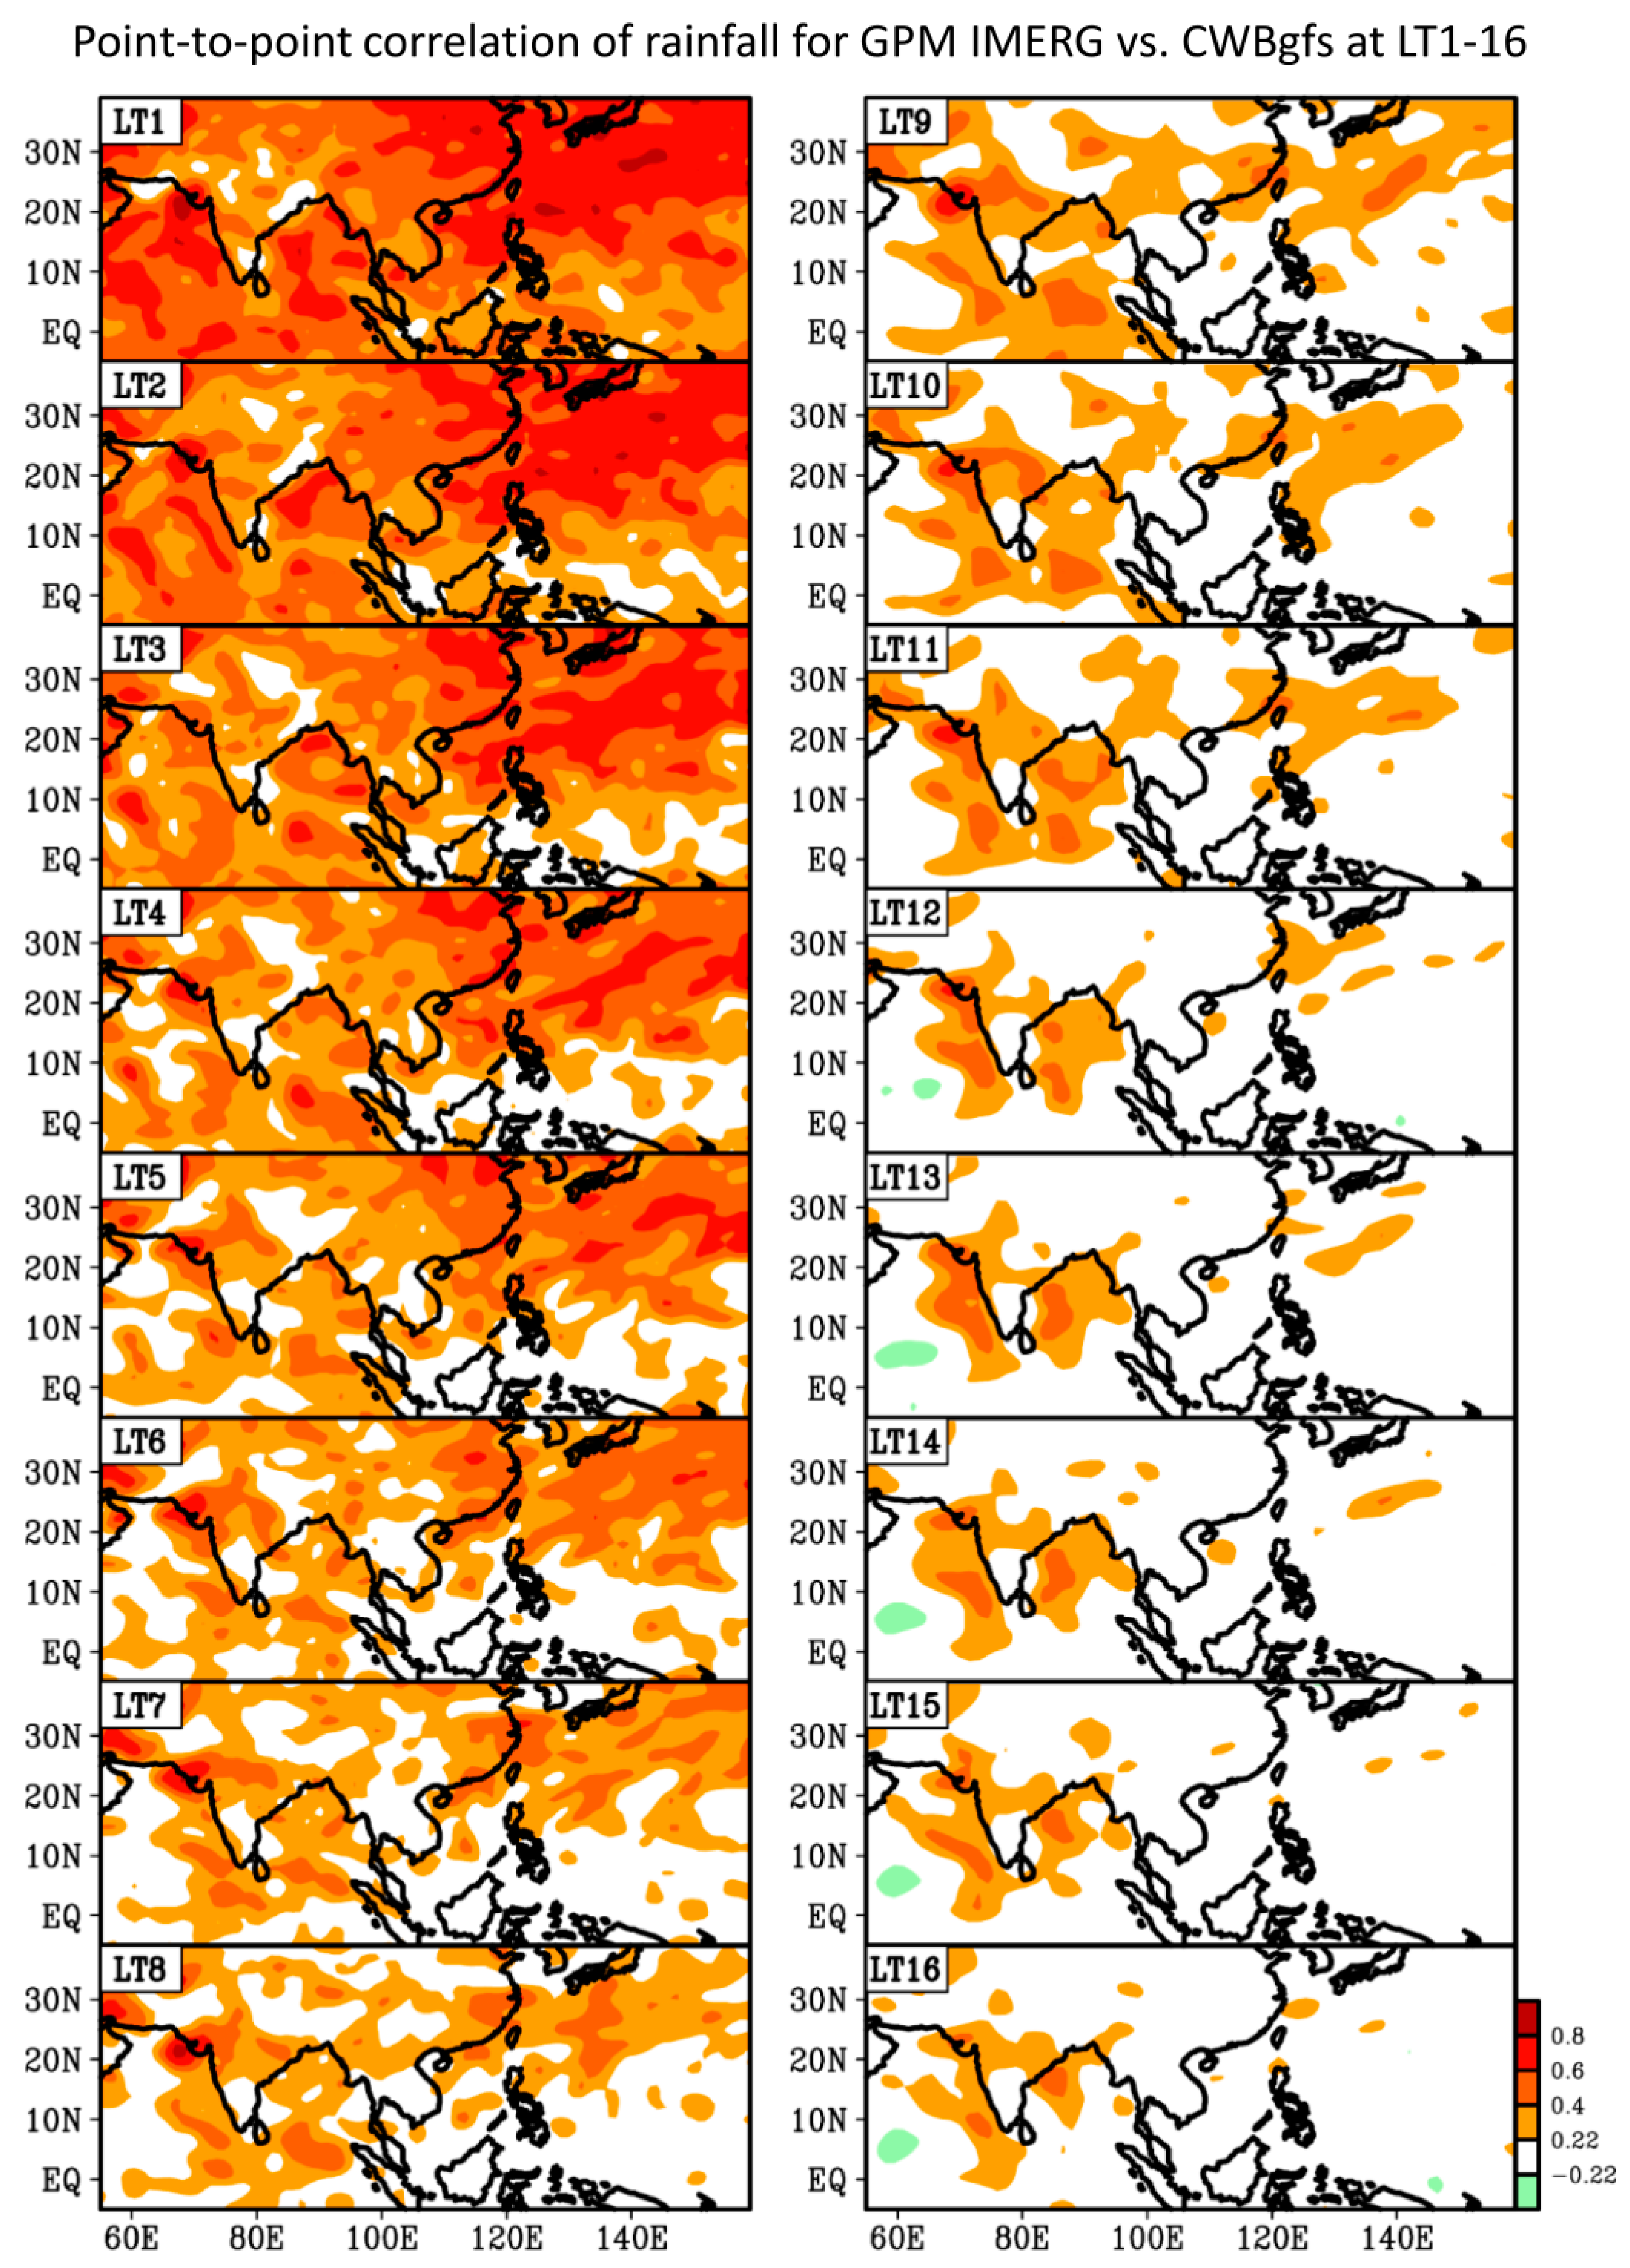
Section 3), it is important to understand if the NCEPgfs also performs better than CWBgfs in rainfall prediction over the areas near Taiwan during the 2017 Meiyu season. To clarify this question, we plot the point-to-point temporal correlation of daily rainfall between the observation (i.e., time series in Figure 1b) and the model forecasts at each of the lead time up to 16 days (i.e., LT1~LT16) during the 2017 Meiyu season. Shown in Figure 12 (Figure 13) is the result for NCEPgfs (CWBgfs). In Figurs 12–13, only the areas with the correlation coefficients passing the significance test at the 90% confidence interval are shaded.
Overall, it can be seen from Figure 12 and Figure 13 that the model’s performance in predicting the temporal variation of rainfall during the 2017 Meiyu season is location-dependent. For the areas near Taiwan, the temporal correlation between the observation of GPM IMERG and the forecast of NCEPgfs has passed the significance test at lead times of 1 day to 14 days (see Figure 12). This is better than the forecast of CWBgfs, which has passed the significance test at lead times of 1 day to approximately 12 days (see Figure 13). Many studies have demonstrated that the higher the resolution of the model is, the better the predictive skill of the GFS forecast data is [42,43,44]. Likely, the better the skill of NCEPgfs, compared to that of CWBgfs, in forecasting the timing of rainfall formation during the 2017 Meiyu season is, also partly attributed to a fact that both spatial and vertical resolutions of NCEPgfs are higher than those of CWBgfs (see Table 1).
Most importantly, it can be seen from Figure 12 and Figure 13 that the model with better simulation of BSISO2 (i.e., NCEPgfs) has a better forecast skill in predicting the rainfall formation in Taiwan during the 2017 Meiyu season. This suggestion is consistent with the finding of Lee et al. [12], which focuses on a larger domain of Asia but not specifically on Taiwan. However, we would like to mention that the discussion in this study only gives some insights for the possible relationship between the forecast skill of BSISOs and the forecast skill of rainfall variation in Taiwan during the 2017 Meiyu season. To clarify whether or not the above finding related to the relationship between the forecast skill of BSISOs and the forecast skill of rainfall formation in Taiwan is also true for other months and other years, a greater assessment for the model data in other months or in multiple years are planned in the near future.

5. Conclusions

By examining the heavy rainfall events during the Meiyu season of 2017, this study investigates the possible impact of BSISOs in affecting the formation of heavy Meiyu rainfall in Taiwan. Analyses also focus on clarifying whether or not the models’ (including NCEPgfs and CWBgfs) capability in forecasting the BSISOs has some insight on its capability in forecasting the 2017 Meiyu rainfall formation in Taiwan.
Our analysis of the observational data shows that BSISO2 is more important than BSISO1 in modulating the heavy rainfall formation in Taiwan during the 2017 Meiyu season (see Figure 3 and Figure 4). In general, the heavy rainfall in Taiwan occurs during phases 4–6 of BSISO2 (see Figure 5), when the enhanced southwesterly wind and moisture flux convergence center propagate northward from the lower latitude regions into the Taiwan area (see Figure 6, Figure 7, Figure 8 and Figure 9). This finding, which is also true for the 2014–2016 Meiyu seasons, is summarized in the schematic diagram of Figure 10. In addition, the observational evidence also shows that a larger amplitude of the BSISO2 index corresponds to a higher chance of heavy rainfall formation in Taiwan during the Meiyu season of 2017, as well as of 2014 to 2016 (see Figure 5).
Regarding the model forecast, the examinations show that both the NCEPgfs and CWBgfs perform better in simulating the BSISO2 index than the BSISO1 index during the 2017 Meiyu season (see Figure 11). Furthermore, NCEPgfs has a better skill than CWBgfs in predicting the BSISO2 index during the 2017 Meiyu season, while a reverse situation is true for the BSISO1 index. Consistent with the models’ performance in simulating the BSISO2 index, NCEPgfs has a better skill than CWBgfs in predicting the rainfall variation over the areas near Taiwan (see Figure 12 and Figure 13). This finding, which highlights that the better the prediction of BSISO2 is, the better the prediction of rainfall formation in Taiwan during the 2017 Meiyu season is, deserves further research and attention to clarify whether it is also true for other Meiyu seasons.

Supplementary Materials

The following are available online at https://www.mdpi.com/2073-4433/10/4/205/s1, Figure S1: The EOF patterns of normalized daily anomalies of OLR and 850hPa wind fields. Figure S2: The observed time series of PCs of BSISOs during May and June 2017. Figure S3: The forecasted time series of PCs of BSISOs during May and June 2017. Figure S4: The power spectrum, the time series of daily anomalies, 10-30 day band pass filtered and 30-60 day band pass filtered of daily rainfall in Taiwan during May to October 2017. Figure S5: The power spectrum, the time series of daily anomalies, 10-30 day band pass filtered and 30-60 day band pass filtered of daily rainfall in Taiwan during May and June of 2008, 2009 and 2012. Figure S6: The phase-space diagrams of BSISOs during 2014-2017 MJ and during 2014-2017 MJJASO. Figure S7: The composite daily anomalies of 850-hPa wind vectors and related stream function for each phase of BSISO2 during May and June 2014-2017. Figure S8: The 850-hPa wind vectors and related stream function averaged during 2014-2017 MJ, during 2014-2017 MJJASO and difference between them.

Author Contributions

Conceptualization, W.-R.H. Data curation, W.-R.H., P.-Y.L., and J.-H.C. Investigation, W.-R.H. Software, P.-Y.L. and L.D. Writing – original draft, W.-R.H. Writing – review & editing, W.-R.H., P.-Y.L., J.-H.C., and L.D.

Funding

This research was funded by the Ministry of Science and Technology of Taiwan under MOST 106-2628-M-003-001-MY4 and MOST 107-2625-M-003-002, as well as Grant MOTC-CWB-107-M-09 and MOTC-CWB-108-M-09 of the Central Weather Bureau in Taiwan. L. Deng was supported by the National Natural Science Foundation of China (Grant No. 41875071), “Yangfan” Talent Project of Guangdong Province (Grant No. 000001005), and Doctoral Fund of Guangdong Ocean University (Grant No. R17002).

Acknowledgments

Data provided by several research centers (including NCEP, NOAA, and NASA) in U.S.A and CWB in Taiwan are highly appreciated.

Conflicts of Interest

The authors declare no conflict of interest.

References

  1. Chen, T.C.; Huang, W.R.; Yen, M.C. Interannual Variation of the Late Spring-Early Summer Monsoon Rainfall in the Northern Part of the South China Sea. J. Clim. 2011, 24, 4295–4313. [Google Scholar] [CrossRef]
  2. Huang, W.R.; Chen, K.C. Trends in Pre-Summer Frontal and Diurnal Rainfall Activities during 1982–2012 over Taiwan and Southeast China: Characteristics and Possible Causes. Int. J. Climatol. 2015, 35, 2608–2619. [Google Scholar] [CrossRef]
  3. Huang, W.R.; Huang, P.H.; Chang, Y.H.; Cheng, C.T.; Hsu, H.H.; Tu, C.Y.; Kitoh, A. Dynamical Downscaling Simulation and Future Projection of Extreme Precipitation Activities in Taiwan during the Mei-Yu Seasons. J. Meteorol. Soc. Jpn. 2019, 97. [Google Scholar] [CrossRef]
  4. Wang, C.C.; Kung, C.Y.; Lee, C.S.; Chen, G.T.J. Development and evaluation of Mei-yu season quantitative precipitation forecast in Taiwan river basins based on a conceptual climatology model. Weather Forecast. 2012, 27, 586–607. [Google Scholar] [CrossRef]
  5. Yim, S.Y.; Wang, B.; Xing, W. Prediction of early summer rainfall over South China by a physical-empirical model. Clim. Dyn. 2014, 43, 1883–1891. [Google Scholar] [CrossRef]
  6. Yim, S.Y.; Wang, B.; Xing, W.; Lu, M.M. Prediction of Meiyu rainfall in Taiwan by multi-lead physical-empirical models. Clim. Dyn. 2015, 44, 3033–3042. [Google Scholar] [CrossRef]
  7. Chang, Y.H.; Chen, K.C.; Huang, W.R. Application and Improvement of Physical-Empirical Model on the Prediction of Interannual Variation of Meiyu Season Rainfall in Taiwan. Atmos. Sci. 2017, 45, 333–348, (In Chinese with an English Abstract). [Google Scholar]
  8. Wang, C.C.; Paul, S.; Chien, F.C.; Lee, D.I.; Chuang, P.Y. An evaluation of WRF rainfall forecasts in Taiwan during three mei-yu seasons from 2008 to 2010. Weather Forecast. 2017, 32, 1329–1351. [Google Scholar] [CrossRef]
  9. Wang, C.C.; Chen, G.T.J.; Ngai, C.H.; Tsuboki, K. Case study of a morning convective rainfall event over southwestern Taiwan in the Mei-yu season under weak synoptic conditions. J. Meteorol. Soc. Jpn. 2018, 96, 461–484. [Google Scholar] [CrossRef]
  10. Lee, J.Y.; Wang, B.; Wheeler, M.C.; Fu, X.; Waliser, D.E.; Kang, I.S. Real-time multivariate indices for the boreal summer intraseasonal oscillation over the Asian summer monsoon region. Clim. Dyn. 2013, 40, 493–509. [Google Scholar] [CrossRef]
  11. Lee, S.S.; Wang, B.; Waliser, D.; Neena, J.M.; Lee, J.Y. Predictability and prediction skill of the boreal summer intraseasonal oscillation in the Intraseasonal Variability Hindcast Experiment. Clim. Dyn. 2015, 45, 2123–2135. [Google Scholar] [CrossRef] [Green Version]
  12. Lee, S.; Moon, J.; Wang, B.; Kim, H. Subseasonal Prediction of Extreme Precipitation over Asia: Boreal Summer Intraseasonal Oscillation Perspective. J. Clim. 2017, 30, 2849–2865. [Google Scholar] [CrossRef]
  13. Huang, W.R.; Chang, Y.H. Impact of Boreal Summer Intraseasonal Oscillations on Warm Season Diurnal Convection Activity in Taiwan. Int. J. Climatol. 2018, 38, 2187–2200. [Google Scholar] [CrossRef]
  14. Fu, X.; Lee, J.; Wang, B.; Wang, W.; Vitart, F. Intraseasonal Forecasting of the Asian Summer Monsoon in Four Operational and Research Models. J. Clim. 2013, 26, 4186–4203. [Google Scholar] [CrossRef]
  15. Li, J.; Mao, J.; Wu, G. A case study of the impact of boreal summer intraseasonal oscillations on Yangtze rainfall. Clim. Dyn. 2015, 44, 2683–2702. [Google Scholar] [CrossRef]
  16. Hsu, P.C.; Lee, J.Y.; Ha, K.J. Influence of boreal summer intraseasonal oscillation on rainfall extremes in southern China. Int. J. Clim. 2016, 36, 1403–1412. [Google Scholar] [CrossRef]
  17. Hung, C.; Lin, H.J.; Kao, P.; Shih, M.F.; Fong, W. Boreal summer intraseasonal oscillation impact on western North Pacific typhoons and rainfall in Taiwan. Terr. Atmos. Ocean. Sci. 2016, 27, 893–906. [Google Scholar] [CrossRef]
  18. Ren, P.; Ren, H.L.; Fu, J.X.; Wu, J.; Du, L. Impact of boreal summer intraseasonal oscillation on rainfall extremes in southeastern China and its predictability in CFSv2. J. Geophys. Res. Atmos. 2018, 123, 4423–4442. [Google Scholar] [CrossRef]
  19. Xu, W.; Rutledge, S.A. Convective Variability Associated with the Boreal Summer Intraseasonal Oscillation in the South China Sea Region. J. Clim. 2018, 31, 7363–7383. [Google Scholar] [CrossRef]
  20. Chen, T.C.; Wang, S.Y.; Huang, W.R.; Yen, M.C. Variation of the East Asian Summer Monsoon Rainfall. J. Clim. 2004, 17, 744–762. [Google Scholar] [CrossRef]
  21. Achuthavarier, D.; Krishnamurthy, V. Relation between intraseasonal and interannual variability of the South Asian monsoon in the National centers for environmental prediction forecast systems. J. Geophys. Res. 2010, 115, D08104. [Google Scholar] [CrossRef]
  22. Shin, C.S.; Huang, B. Slow and fast annual cycles of the Asian Summer Monsoon in the NCEP CFSv2. Clim. Dyn. 2016, 47, 529–553. [Google Scholar] [CrossRef]
  23. Hsu, P.C.; Lee, J.Y.; Ha, K.J.; Tsou, C.H. Influences of Boreal Summer Intraseasonal Oscillation on Heat Waves in Monsoon Asia. J. Clim. 2017, 30, 7191. [Google Scholar] [CrossRef]
  24. Diao, Y.; Li, T.; Hsu, P.C. Influence of the Boreal Summer Intraseasonal Oscillation on Extreme Temperature Events in the Northern Hemisphere. J. Meteorol. Res. 2018, 32, 534. [Google Scholar] [CrossRef]
  25. Zhao, H.; Chen, S.; Klotzbach, P.J.; Raga, G.B. Impact of the Extended Boreal Summer Intraseasonal Oscillation on Western North Pacific Tropical Cloud Cluster Genesis Productivity. J. Clim. 2018, 31, 9175. [Google Scholar] [CrossRef]
  26. Kanamitsu, M.; Ebisuzaki, W.; Woollen, J.; Yang, S.K.; Hnilo, J.J.; Fiorino, M.; Potter, G.L. NCEP-DOE AMIP-II Reanalysis (R-2). Bull. Am. Meteorol. Soc. 2002, 83, 1631–1643. [Google Scholar] [CrossRef]
  27. Huffman, G.J.; Bolvin, D.T.; Braithwaite, D.; Hsu, K.; Joyce, R.; Kidd, C.; Nelkin, E.J.; Sorooshian, S.; Tan, J.; Xie, P. NASA Global Precipitation Measurement (GPM) Integrated Multi-SatellitE Retrievals for GPM (IMERG); Algorithm Theoretical Basis Document (ATBD) Version 5.1; NASA: Greenbelt, MD, USA, 2017.
  28. Huang, W.R.; Chang, Y.H.; Liu, P.Y. Assessment of IMERG precipitation over Taiwan at multiple timescales. Atmos. Res. 2018, 214, 239–249. [Google Scholar] [CrossRef]
  29. Ek, M.; Mitchell, K.E.; Lin, Y.; Rogers, E.; Grunmann, P.; Koren, V.; Gayno, G.; Tarpley, J.D. Implementation of Noah land-surface model advances in the NCEP operational mesoscale Eta model. J. Geophys. Res. Atmos. 2003, 108, 8851. [Google Scholar] [CrossRef]
  30. Hong, S.Y.; Pan, H.L. Nonlocal boundary layer vertical diffusion in a medium-range forecast model. Mon. Weather Rev. 1996, 124, 2322–2339. [Google Scholar] [CrossRef]
  31. Han, J.; Pan, H.L. Revision of Convection and Vertical Diffusion Schemes in the NCEP Global Forecast System. Weather Forecast. 2011, 26, 520–533. [Google Scholar] [CrossRef]
  32. Zhao, Q.Y.; Carr, F.H. A prognostic cloud scheme for operational NWP models. Mon. Weather Rev. 1997, 125, 1931–1953. [Google Scholar] [CrossRef]
  33. Clough, S.A.; Shephard, M.W.; Mlawer, E.J.; Delamere, J.S.; Iacono, M.J.; Cady-Pereira, K.; Boukabara, S.; Brown, P.D. Atmospheric radiative transfer modeling: A summary of the AER codes. J. Quant. Spectrosc. Radiat. Transf. 2005, 91, 233–244. [Google Scholar] [CrossRef]
  34. Iacono, M.J.; Delamere, J.S.; Mlawer, E.J.; Shephard, M.W.; Clough, S.A.; Collins, W.D. Radiative forcing by long-lived greenhouse gases: Calculations with the AER radiative transfer models. J. Geophys. Res. Atmos. 2008, 113, D13103. [Google Scholar] [CrossRef]
  35. Kim, Y.J.; Arakawa, A. Improvement of orographic gravity wave parameterization using a mesoscale gravity wave model. J. Atmos. Sci. 1995, 52, 1875–1902. [Google Scholar] [CrossRef]
  36. Palmer, T.N.; Shutts, G.; Swinbank, R. Alleviation of a systematic westerly bias in general circulation and numerical weather prediction models through an orographic gravity wave drag parameterization. Quart. J. R. Meteorol. Soc. 1986, 112, 1001–1039. [Google Scholar] [CrossRef]
  37. Chun, H.; Baik, J. Momentum Flux by Thermally Induced Internal Gravity Waves and Its Approximation for Large-Scale Models. J. Atmos. Sci. 1998, 55, 3299–3310. [Google Scholar] [CrossRef]
  38. Scinocca, J.F. An Accurate Spectral Non-Orographic Gravity Wave Parameterization for General Circulation Models. J. Atmos. Sci. 2003, 60, 667–682. [Google Scholar] [CrossRef]
  39. Wang, B. The vertical structure and development of the ENSO anomaly mode during 1979–1989. J. Atmos. Sci. 1992, 49, 698–712. [Google Scholar] [CrossRef]
  40. Lin, H.; Brunet, G.; Derome, J. Forecast skill of the Madden–Julian oscillation in two Canadian atmospheric models. Mon. Weather Rev. 2008, 136, 4130–4149. [Google Scholar] [CrossRef]
  41. Gottschalck, J.; Wheeler, M.; Weickmann, K.; Vitart, F.; Savage, N.; Lin, H.; Hendon, H.; Waliser, D.; Sperber, K.; Nakagawa, M.; et al. A Framework for Assessing Operational Madden-Julian Oscillation Forecasts. Bull. Am. Meteorol. Soc. 2010, 91, 1247–1258. [Google Scholar] [CrossRef]
  42. Charba, J.P.; Samplatsky, F.G. High-Resolution GFS-Based MOS Quantitative Precipitation Forecasts on a 4-km Grid. Mon. Weather Rev. 2011, 139, 39–68. [Google Scholar] [CrossRef]
  43. Zhang, B.; Lindzen, R.S.; Tallapragada, V.; Weng, F.; Liu, Q.; Slippel, J.A.; Ma, Z.; Bender, M.A. Increasing vertical resolution in US models to improve track forecasts of Hurricane Joaquin with HWRF as an example. Proc. Natl. Acad. Sci. USA 2016, 113, 11765–11769. [Google Scholar] [CrossRef] [PubMed] [Green Version]
  44. Zhou, X.; Zhu, Y.; Hou, D.; Luo, Y.; Peng, J.; Wobus, R. Performance of the New NCEP Global Ensemble Forecast System in a Parallel Experiment. Weather Forecast. 2017, 32, 1989–2004. [Google Scholar] [CrossRef]
Figure 1. (a) Latitude-time diagram of daily rainfall averaged over the longitudinal zone of Taiwan (120–122° E), extracted from the GPM IMERG rainfall production, during May and June 2017. (b) The related time series of daily rainfall area averaged over Taiwan (120–122° E, 22–25.5° N). In (b), three heavy rainfall events (denoted as FR1~FR3) are defined based on the criterion that the daily rainfall > 15 mm/day continues for at least two days. The dashed orange line in (a) indicates the location of Taiwan (around 25° N).
Atmosphere 10 00205 g001
Figure 2. Surface weather maps for the selected date of (a) FR1: 16 May 2017, (b) FR2: 02 June 2017, and (c) FR3: 14 June 2017. (df) is the daily mean of low-level wind circulation at 850 hPa superimposed with the daily rainfall amount related to (ac), respectively.
Atmosphere 10 00205 g002
Figure 3. Power spectrum analysis of the time series of daily rainfall area averaged over Taiwan (120–122° E, 22–25.5° N) during May and June 2017, extracted from Figure 1b. The dashed line indicates the related 95% confidence interval.
Atmosphere 10 00205 g003
Figure 4. (a) The phase (P1-P8 denotes phase 1-phase 8) and amplitude of BSISO1 related to the occurrence of three heavy rainfall events (FR1~FR3) identified in Figure 1. (b) is similar to (a) but for the phase and amplitude of BSISO2 related to the occurrence of FR1~FR3 events. In (a,b), the meaning of the color and size of the dots is explained in the right panel of (b). Following Lee et al. [10], a large open circle indicating the amplitude of BSISOs equal to 1.5 is added in (a,b) to clarify whether the BSISOs is stronger (i.e., amplitude > 1.5) or weaker (i.e., amplitude ≤ 1.5). (c) The time series of daily anomalies (i.e., removed the mean of May and June 2017, gray bars), 10 to 30 day band pass filtered (green line) and 30 to 60 day band pass filtered (red line) of daily rainfall area averaged over Taiwan (120-122° E, 22-25.5° N) during May and June 2017.
Atmosphere 10 00205 g004
Figure 5. Phase diagram of (a) BSISO1 and (b) BSISO2 with the value of daily rainfall area averaged over Taiwan (120–122° E, 22–25.5° N), during the periods of May and June 2014 to 2017. The explanations of symbols in (a,b) are given in the right bottom of (b). (c) is the percentage of days with daily rainfall >15 mm⋅d−1 over the total days of 2014–2017 May and June, estimated for each phase (P1-P8 denotes phase 1-phase 8) of BSISO1 (pink bar) and BSISO2 (blue bar). (d) is similar to (c), but for the percentage of days with daily rainfall >30 mm⋅d−1 over the total days of May and June 2014–2017.
Atmosphere 10 00205 g005
Figure 6. (a) The composite daily anomalies (MJ mean removed) of 850-hPa wind vectors and related stream function (ψ; shaded) for each phase of BSISO2 during May and June 2014 to 2017. The information of the phases (P1 to P8) and days for composites is provided in the top left. “L” indicates the movement of the cyclonic system discussed in the manuscript. (b) is corresponding to (a), but for the composite daily anomalies of the potential function of vertical integrated moisture flux (χQ) and related rain rate (shaded) for each phase of BSISO2. The movement of the convergence line (marked by dashed line), and the convergence centers (marked by “C”), that are discussed in the manuscript are added. The contour interval is 0.15 × 10⁷ kg s−1.
Atmosphere 10 00205 g006
Figure 7. Latitude-phase diagram (averaged between 115° E–125° E) based on the daily anomalies of rainfall intensity (shaded areas; unit: mm d−1) and daily anomalies of vertical integrated specific humidity (contours; unit: kg m−2) for the composite at each phase of BSISO2, during May and June 2014 to 2017. The red arrow is added to help indicate the northward propagation feature.
Atmosphere 10 00205 g007
Figure 8. Similar to Figure 6, but for the composite of 10–30 day band pass filtered ψ (shaded) superimposed with related wind vectors at 850 hPa for the three selected events: (a) FR1 (15–16 May 2017), (b) FR2 (01–03 June 2017), and (3) FR3 (14–18 June 2017). (df) corresponds to (ac), respectively, but for the composite of 10–30 day band pass filtered rainfall (shaded) superimposed with χQ (contour) and related flux vectors.
Atmosphere 10 00205 g008
Figure 9. The shaded areas represent the time lagged correlation between the time series of the 10 to 30 day band pass filtered rainfall in Taiwan (i.e., green line in Figure 4c) and the latitude-time diagram of the 10–30 day band pass filtered rainfall averaged over (115–125° E) during May and June, 2017. Only the areas that passed the significance test are shaded. The contour areas represent the related time lagged correlation between the green line in Figure 4c and the 10 to 30 day band pass filtered vertically and integrated specific humidity averaged over 115–125° E during May and June, 2017. Only the areas passed the significance test are colored in purple. The red arrow is added to help indicate the northward propagation feature.
Atmosphere 10 00205 g009
Figure 10. Schematic diagram illustrating (a) the propagation of the cyclonic circulation (“L” denotes the low system, number denotes the phase of related BSISO2), and (b) the propagation of moisture convergence line (“C” denotes the convergence, number denotes the phase of related BSISO2, circle denotes the convergence center of χQ in Figure 6 that are important to facilitate the heavy rainfall formation in Taiwan during the 2014–2017 Meiyu seasons.
Atmosphere 10 00205 g010
Figure 11. (a) Bivariate correlation coefficients for BSISO1 index during May and June 2017 forecasted by NCEPgfs (blue line) and CWBgfs (red line) at different lead times. (b) is similar to (a), but for the bivariate correlation coefficients of BSISO2 forecasted by NCEPgfs and CWBgfs.
Atmosphere 10 00205 g011
Figure 12. The horizontal distribution of point-to-point temporal correlation between the observed daily rainfall from GPM IMERG and the forecasted daily rainfall from NCEPgfs at lead times of 1 day to 16 days (i.e., LT1~16). The correlation period is during the 2017 Meiyu season. Only the areas with correlation significance at the 90% confidence interval are shaded.
Atmosphere 10 00205 g012
Figure 13. Similar to Figure 12, but for the point-to-point temporal correlation between the observation and the CWBgfs forecast daily rainfall (at lead times of 1 day to 16 days; LT1~16) during the 2017 Meiyu season. Only the areas with correlation significant at the 90% confidence interval are shaded.
Atmosphere 10 00205 g013
Table 1. Detailed information about NCEPgfs and CWBgfs. LT1-10 (LT11-16) denotes lead-time of 1 day to 10 days (11 days to 16 days).
ModelsNCEPgfs
(T1534L64) for LT1-10
(T574L64) for LT11-16
CWBgfs
(T511L60)
Settings
Data AssimilationHybrid GSIHybrid GSI
Horizontal Resolution13 km for LT1-10
23 km for LT11-16
25 km
Vertical ResolutionS-P Hybrid Coordinate with 64 LevelsS-P Hybrid Coordinate with 60 Levels
Top Level Pressure0.27 mb0.1 mb
Land Surface ModelNoah Land Surface Model [29]Noah Land Surface Model [29]
Vertical MixingHong and Pan [30]
Han and Pan [31]
Hong and Pan [30]
Han and Pan [31]
Cumulus ConvectionHan and Pan [31] Han and Pan [31]
Shallow ConvectionHan and Pan [31]Han and Pan [31]
Cloud Microphysics ParameterizationZhao and Carr [32]Zhao and Carr [32]
RadiationClough et al. [33]
Iacono et al. [34]
Clough et al. [33]
Iacono et al. [34]
Orographic Gravity Wave DragKim and Arakawa [35]Palmer et al. [36]
Non-Orographic Gravity Wave DragChun and Baik [37]Scinocca [38]

