1. Introduction
In history, water resources allowed several human civilizations to bloom, and also evidenced a decline of those civilizations when they experienced serious shortages of water [
1]. Nowadays, human beings can better arrange their water resources to use efficiently. However, the available water still remains an intractable problem for many countries to overcome [
2]. The availability of water resources is mainly governed by precipitations from weather systems, and further, those weather systems could be affected by adjacent large-scale atmospheric or oceanic environments such as El Niño/Southern Oscillation (ENSO), Indian Ocean Dipole (IOD), or others. These possible large-scale factors were well-discussed in many researches. The variability of precipitation in countries around the Indian ocean was attributed to IOD and even ENSO [
3,
4,
5,
6]. Barriopedro et al. (2012) [
7] suggested a weakened broad-scale South Asian monsoon possibly influenced by El Niño and Arctic Oscillation led to the recent severe drought cases in China. D’Arrigo et al. (2013) [
8] proposed a linkage between sustained drought conditions in Myanmar and ENSO. Hernandez et al. (2015) [
9] also supported the idea that droughts in monsoon Asia would be influenced by ENSO and associated shifts in Walker circulation.
In some certain places, the problem of water scarcity could be more intense, especially under the current scenario of climate change. Zhai et al. (2010) [
10] indicated a rising trend for both the occurrence frequency and the duration of droughts in many places of Asia under global warming. For those water-sensitive places, plans for better water management are always urgent, and Taiwan certainly cannot keep out of the situation [
11]. The steep topography creates difficulties for the island to keep water from rainfall, and the high density of population needs to carve up the remaining water resources [
12]. This tough situation makes people often struggle to manage the available water during most of the time in a year [
13,
14]. In fact, researches showed that Taiwan is facing increased risk of droughts in the 21st century [
15] and the regions currently threatened by droughts will be at greater risk in the future [
16].
Droughts have always been one of the top issues being discussed under the climate change [
17,
18]. A drought is generally defined as a period without rainfall, and it can widely strike the balance of local hydrology systems [
19]. In response to the situation, several indices for identifying droughts were introduced to make people better understand what lies behind this devastating natural disaster from a scientific perspective [
20,
21,
22,
23]. Some indices among them, such as Palmer Drought Severity Index (hereafter PDSI) [
24] and self-calibrating PDSI (hereafter scPDSI) [
25], have been widely used in many studies.
Although these two indices show their own strengths and were applied in various researches like the trend of droughts under global warming [
26] and the spatial and temporal evolution of drought conditions [
27], some deficiencies were also mentioned, such as utilizing simplified model to compute for the PDSI [
28] and the requirement of carefully choosing calibration period for the scPDSI [
29,
30].
Another popular index, named the Standardized Precipitation Index (hereafter SPI), was proposed by Reference [
31]. It features the ability to transform multi-time-scale rainfall data into an index, which is a major deficiency of the PDSI and the scPDSI. The SPI is presented by multiple numbers below or above zero; the former represents different severities of a drought and the latter simply means wet. Usually, an index value below −2 would be regarded as a severe dry event.
Although the SPI shows its advantages in many aspects [
32,
33], some criticisms about its disadvantages were pointed out [
34,
35]. Recently, a new drought index developed from the SPI and adopting the concept of evaporation was introduced by Reference [
36], namely the Standardized Precipitation Evapotranspiration Index (SPEI). Like the SPI, the negative values also denote the severity of a drought. It should better replicate droughts compared to the SPI, as it not only uses rainfall data but adopts air temperature data for the evaporation between the land and the atmosphere, meaning the index should be a replica of reality. Since the introduce of the index, it has been extensively employed in studies to discuss dry conditions in many regions on the earth [
37,
38]. Weng and Yang (2013) [
39] adopted the concept of the SPEI and used monthly observational data from Central Weather Bureau (hereafter CWB) to construct a sequence of the SPEI for Taiwan. Their SPEI data with different lags in length is to examine historical droughts in different time scales and the related large-scale circulations affecting the island.
Our previous work (hereafter HS2017) [
40] acquired this set of SPEI data and chose the one-month lag ones from 13 major CWB conventional weather stations to present drought conditions on the plains of Taiwan without compromising data’s original meteorological meaning. The result of the percentage of dry stations in the annual cycle by the SPEI clearly exposed a problem: Extensive dry conditions largely intensified from spring to late fall with a peak seen in July, which is strongly against the knowledge about the typhoon season occurring in summer and fall in Taiwan [
41,
42]. We attributed the problem to the excessive evaporation term in the calculation for the SPEI. For generating evaporation term, air temperature data is added, and the extremely high temperatures in summer of Taiwan could make the evaporation term significantly overrated, which in turn contributes a dry tendency to the SPEI.
Recently, some other methods for monitoring rainfall conditions in Taiwan were established. Hung (2012) [
43] used rainfall data to construct Taiwan Rainfall Index (TRI) supported by Taiwan Climate Change Projection and Information Platform Project (TCCIP). The TRI combines rainfall conditions on the island of Taiwan into one index on a daily or monthly basis over a hundred years of observation history, but the index is not suitable for detecting droughts. This is because the TRI treats rainfalls on the island as one index, and it cannot eliminate the possibility of a regional extreme rainfall to impact on others. Cho and Lu (2013) [
44] proposed an index for droughts (DSidx), which was designed to represent extreme dry events in Taiwan based on daily rainfall data from six different CWB conventional weather stations (Taipei, Taichung, Tainan, Hengchun, Hualien, and Taitung stations) spreading on the island. Compared to other drought indices, the DSidx only takes rainfall data into account, implying that it is less complex to calculate and still able to replicate drought cases for people to examine corresponding large-scale meteorological backgrounds. However, HS2017 noticed a major flaw hiding in the DSidx, and that should yield significant differences from the truth. Hence, HS2017 introduced a new drought index, Taiwan Meteorological Drought index (hereafter TMD index), which is based on the DSidx but has made some modifications from it.
In short, an applicable and efficient drought-detecting index is critical simply because it acts as an indispensable role in building up a substantial foundation for the further analysis. Nowadays, researchers have plenty of indices to choose for the drought-related study, while most of the methods are usually complex to produce and that could gain the sensitivity within the index, which means they may not able to adapt themselves to some regional scopes of discussions. As mentioned earlier, HS2017 has shown the drawbacks of various drought-detecting indices when analyzing the dryness in Taiwan, and the newly-proposed TMD index is a more efficient method to identify droughts on the island. Hence, following the results from HS2017, this study introduces the strengths of the TMD index and applies it to track severe drought cases in Taiwan history in order to investigate possible causes by analyzing large-scale atmospheric and oceanic environments. Through the method described in the present study, the large-scale factors which may trigger another severe drought in the nearly future in Taiwan can be clarified, as a potential alert sent to the government and the society to better prepare countermeasures against the coming dryness.
3. Features of the Drought in Taiwan
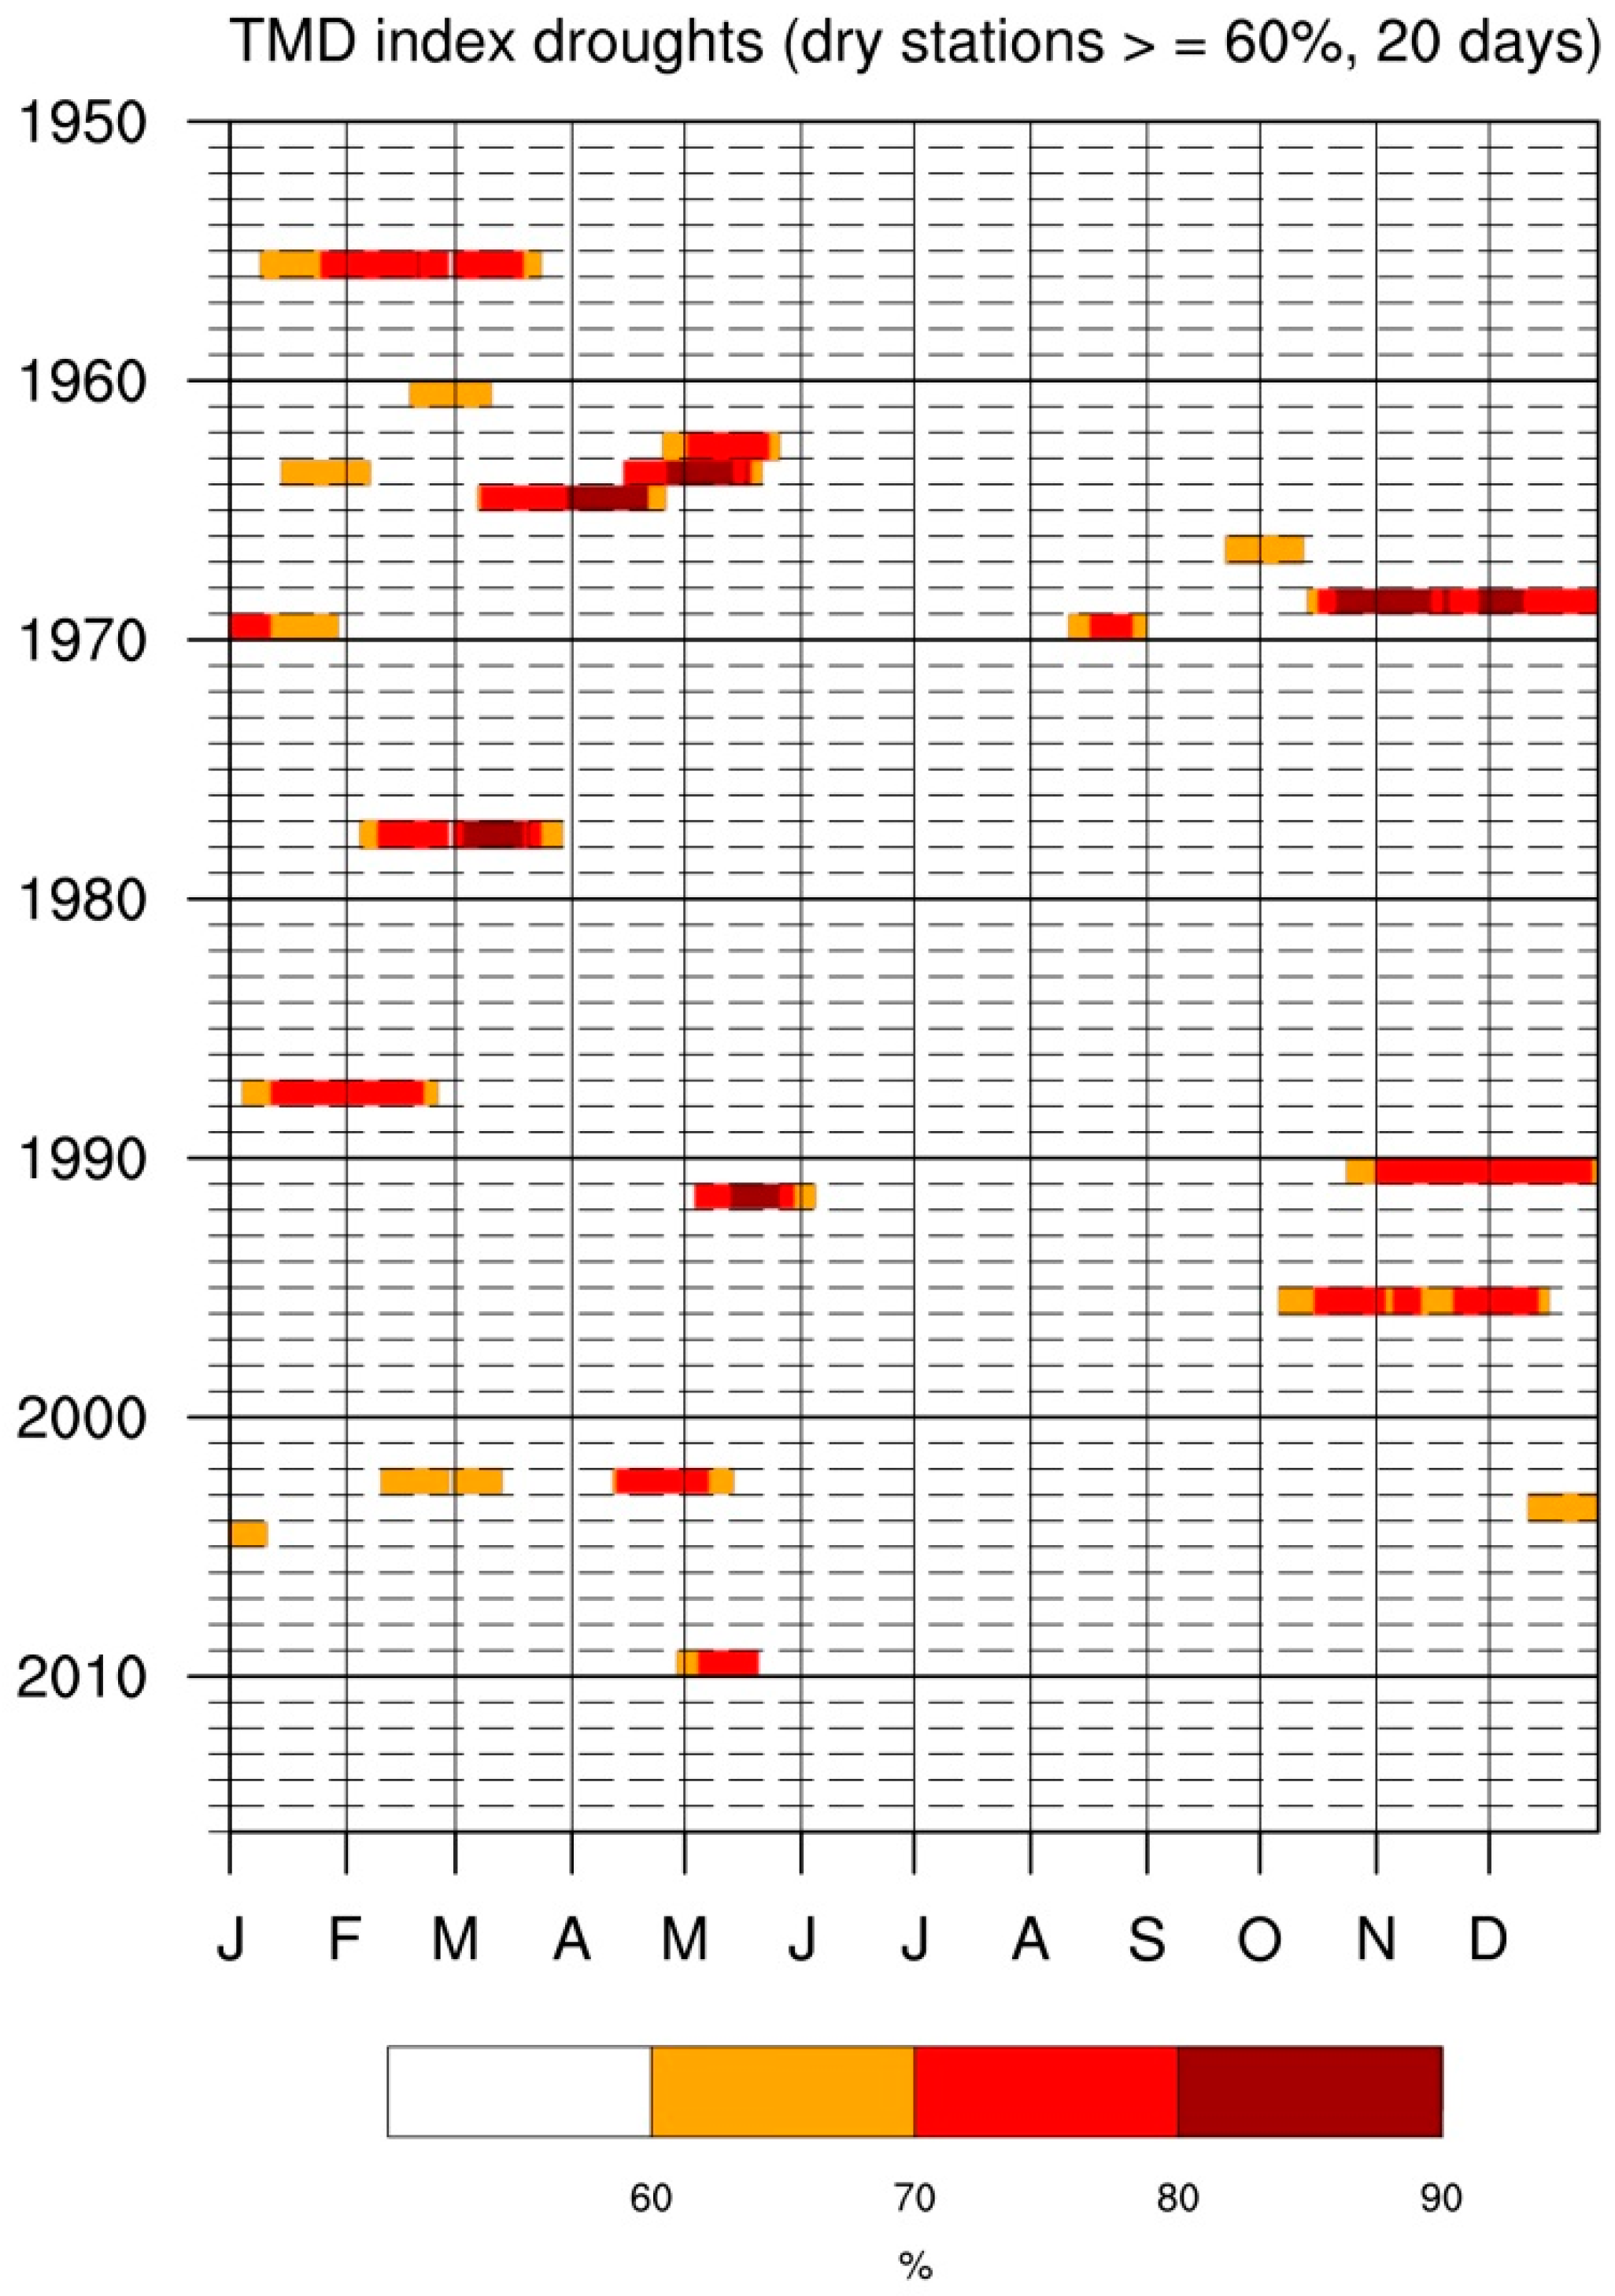
Through the demonstration of
Figure 2, the severe drought cases clearly display their own occurrence period and severity in the way of percentages of dry stations. Almost all the cases are eliminated during the typhoon season (June to September) apart from two relatively weak ones, respectively seen in September 1966 and in August 1969. However, this also implies a risk of experiencing a long-lasting and severe drought if there is no sufficient water brought from typhoons during that period.
In
Figure 2, most of the historical severe drought cases in Taiwan are well captured by the TMD index including those well-known and destructive ones, such as cases occurring in 1963, 1964, 1968, 1977, 1990, 1991, 1995, 2002, and 2003, according to the report from Water Resources Agency, which ensures the capability of this approach. Also, the threshold of dry stations can be easily adjusted to release or wipe out more drought cases depending on the level of examined severity. The criterion set here is believed to be an appropriate balance for our further analyses without showing too many unimportant cases or losing too much crucial information.
Based on the results in
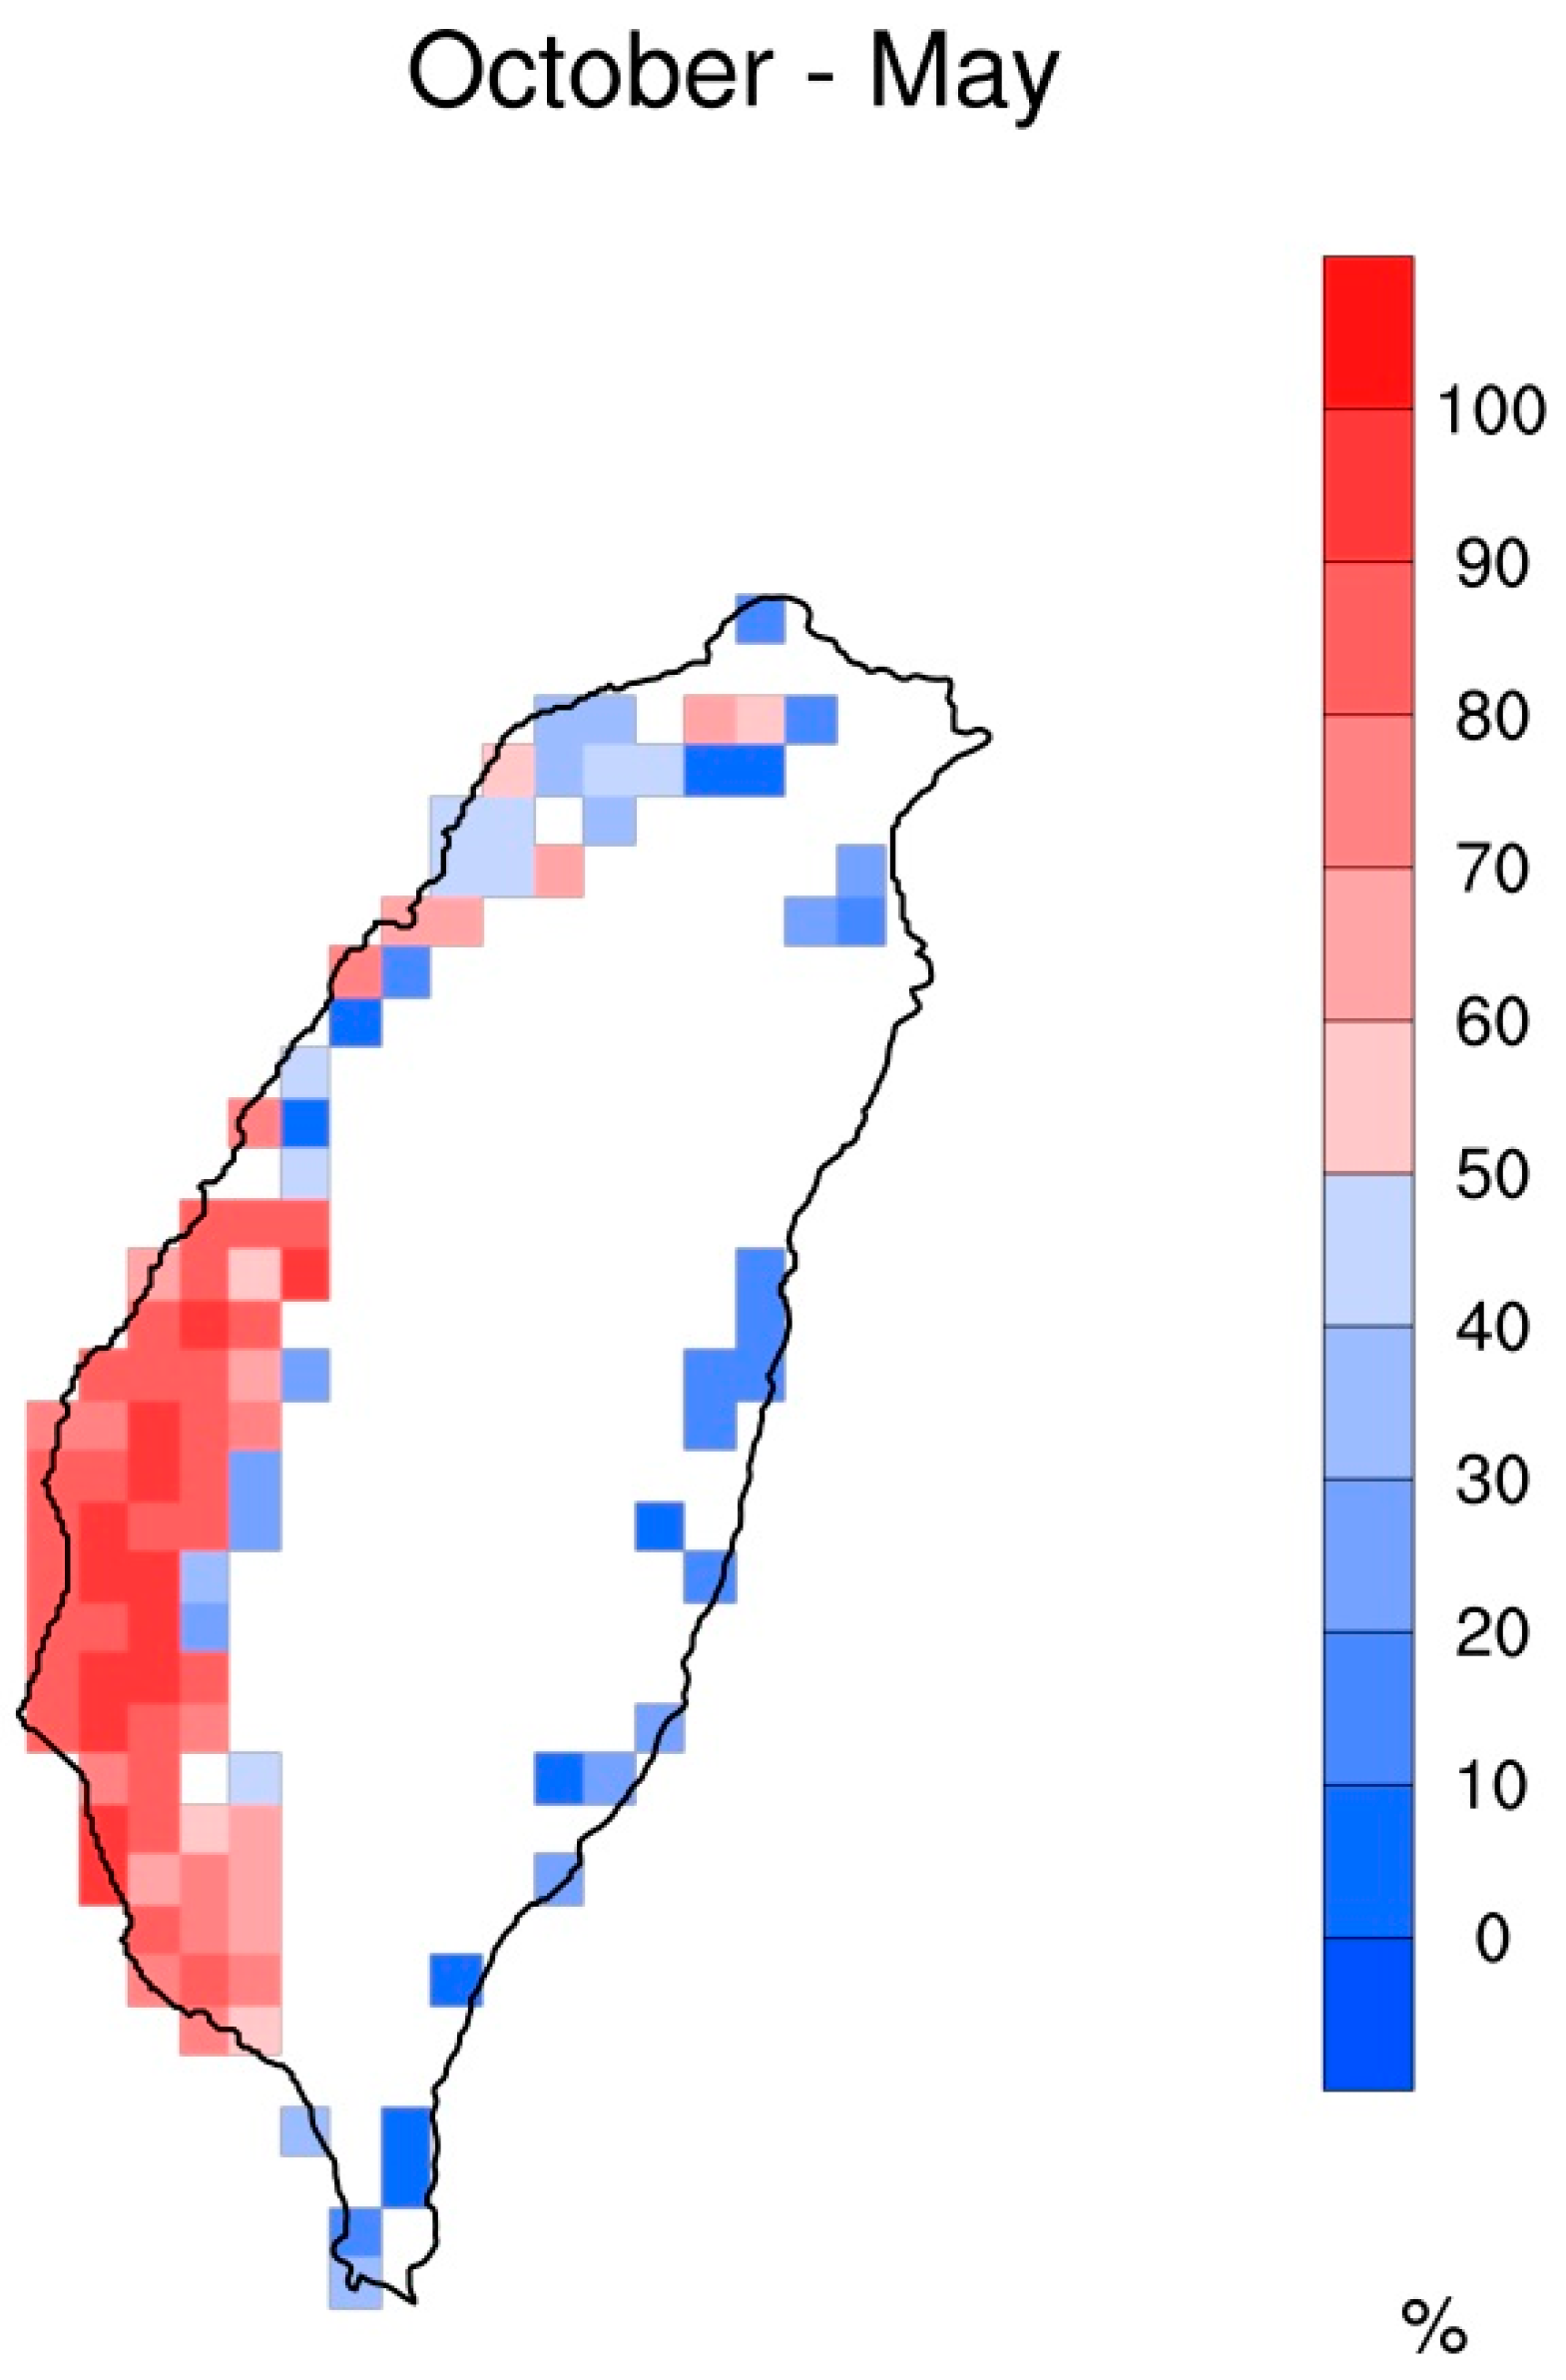
Figure 2, the temporal distributions of historical severe droughts can be translated into spatial distributions on the island of Taiwan. The amount of extreme dry event signal for each station during the severe droughts identified is accumulated day by day to obtain the total frequency of occurrence for the severe droughts. After that, the result of each station is divided by the total operation day of the same station during the severe drought periods to get the probability of occurrence. Finally, the gridded results over the period of October to May are shown in
Figure 3.
The majority of population in Taiwan spreads out on the west coast, leading that region to encounter an extreme shortage of water for people. The southern part of the west coast has been developing into the center of agriculture and heavy industry, and both of these industries particularly require a great amount of water. Despite the huge demand of water in that region, the results in
Figure 3 clearly reveal a dilemma that southern Taiwan is much more likely to face the strikes from severe droughts outside the typhoon season, while northern and eastern Taiwan receive more water over the same period (October to the following May). This also exposes an extremely unbalanced water supply situation for the island.
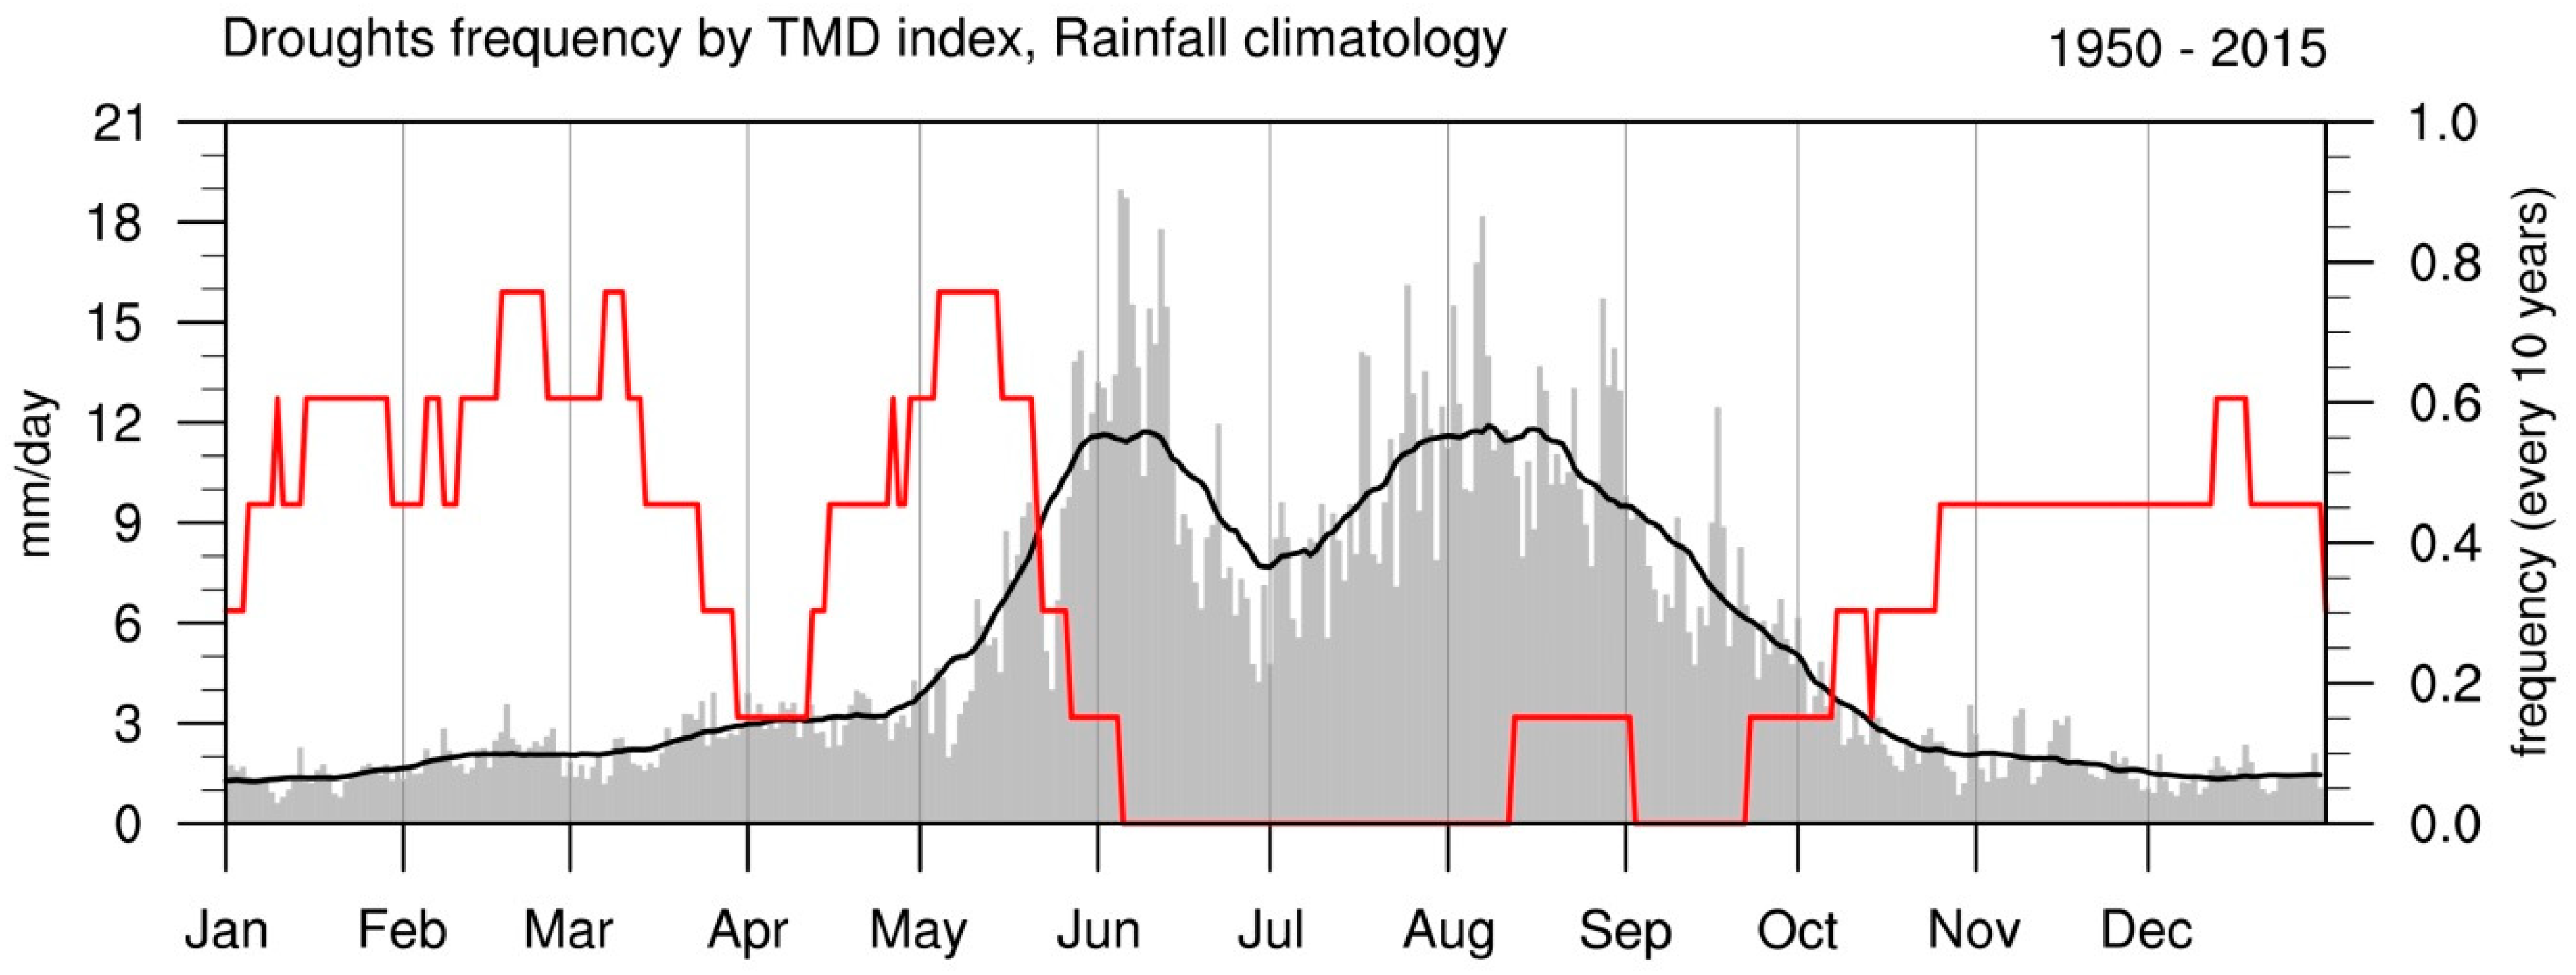
In addition, as described previously, rainfall in Taiwan features significant seasonal variability. In general, water mainly precipitates onto the island over two periods: Meiyu and summer (the typhoon season). The two major wet periods are clearly identified in the rainfall annual cycle with two peaks, respectively seen in Jun and July to August, shown by the annual rainfall climatology in
Figure 4. It is also clear to see a dry period spanning from winter to spring and that period correlates closely with most of the major droughts captured by the TMD index.
Figure 4 also shows the frequency of occurrence for the severe droughts captured by this study. The frequencies almost oppositely match the climatology rainfall values. This means that, based on the statistic of historical cases, severe droughts are more likely to happen from late fall throughout winter. This resonates the fact that only a few rainfalls drop onto the island over this period besides the rather wet conditions in the north. The extremely dry conditions are still easily found in spring. However, there is a noticeable drop of frequency from late March until early April because of spring rain. The spring rainfall usually mainly affects northern Taiwan and does not bring as much water as Meiyu does, while more precipitation could be possible in some certain conditions, such as during positive Pacific decadal oscillation (PDO) phase [
50]. Heavy precipitation from the spring rain sometimes happens and the raining area can spread out on the whole island. This more or less relieves the dry conditions especially for southern Taiwan. Following the spring rain, there is another period for severe droughts to likely occur. The entire dry conditions should last until mid-May (the start of Meiyu) to be completely ended up, and the subsequent typhoon season works together to make severe droughts almost absent over the wet period. Overall, during the entire dry period (October to the following May), the averaged frequency of occurrence for the severe droughts is calculated and the result is 0.46 times per 10 years. In other words, a severe drought could happen about every 21.7 years in Taiwan.
For the goal to understand what factors induce the severe droughts in Taiwan, in this study, the spatial differences of dry conditions in different regions are first ignored here to gain the completed picture. With the over 60% dry stations requirement when the cases are chosen in
Figure 2, it is representative enough to treat the whole island as a single dry region. This helps us more easily examine the requisite large-scale atmospheric and oceanic backgrounds over the dry period from October to the following May. The entire period can be briefly divided into two parts, namely from late fall throughout winter and spring. Considering these two periods are rather different in length, an extra period before spring is added as a transition between winter and spring. As a result, the total analyzed dry period is finally divided into three different periods: October to December (hereafter OND), January to February (hereafter JF) and March to May (hereafter MAM).
4. Discussion of the Results
In order to clarify the physical mechanism of the severe droughts’ formation, large-scale atmospheric circulations and SST over the above three analyzed periods (OND, JF, and MAM) are established. Composite analyses for several variables are conducted during the identified severe drought cases within each period. Then the corresponding climatology values are subtracted from the composite results to acquire the anomalies. Therefore, those variables can depict their own anomalous large-scale fields related to the severe droughts.
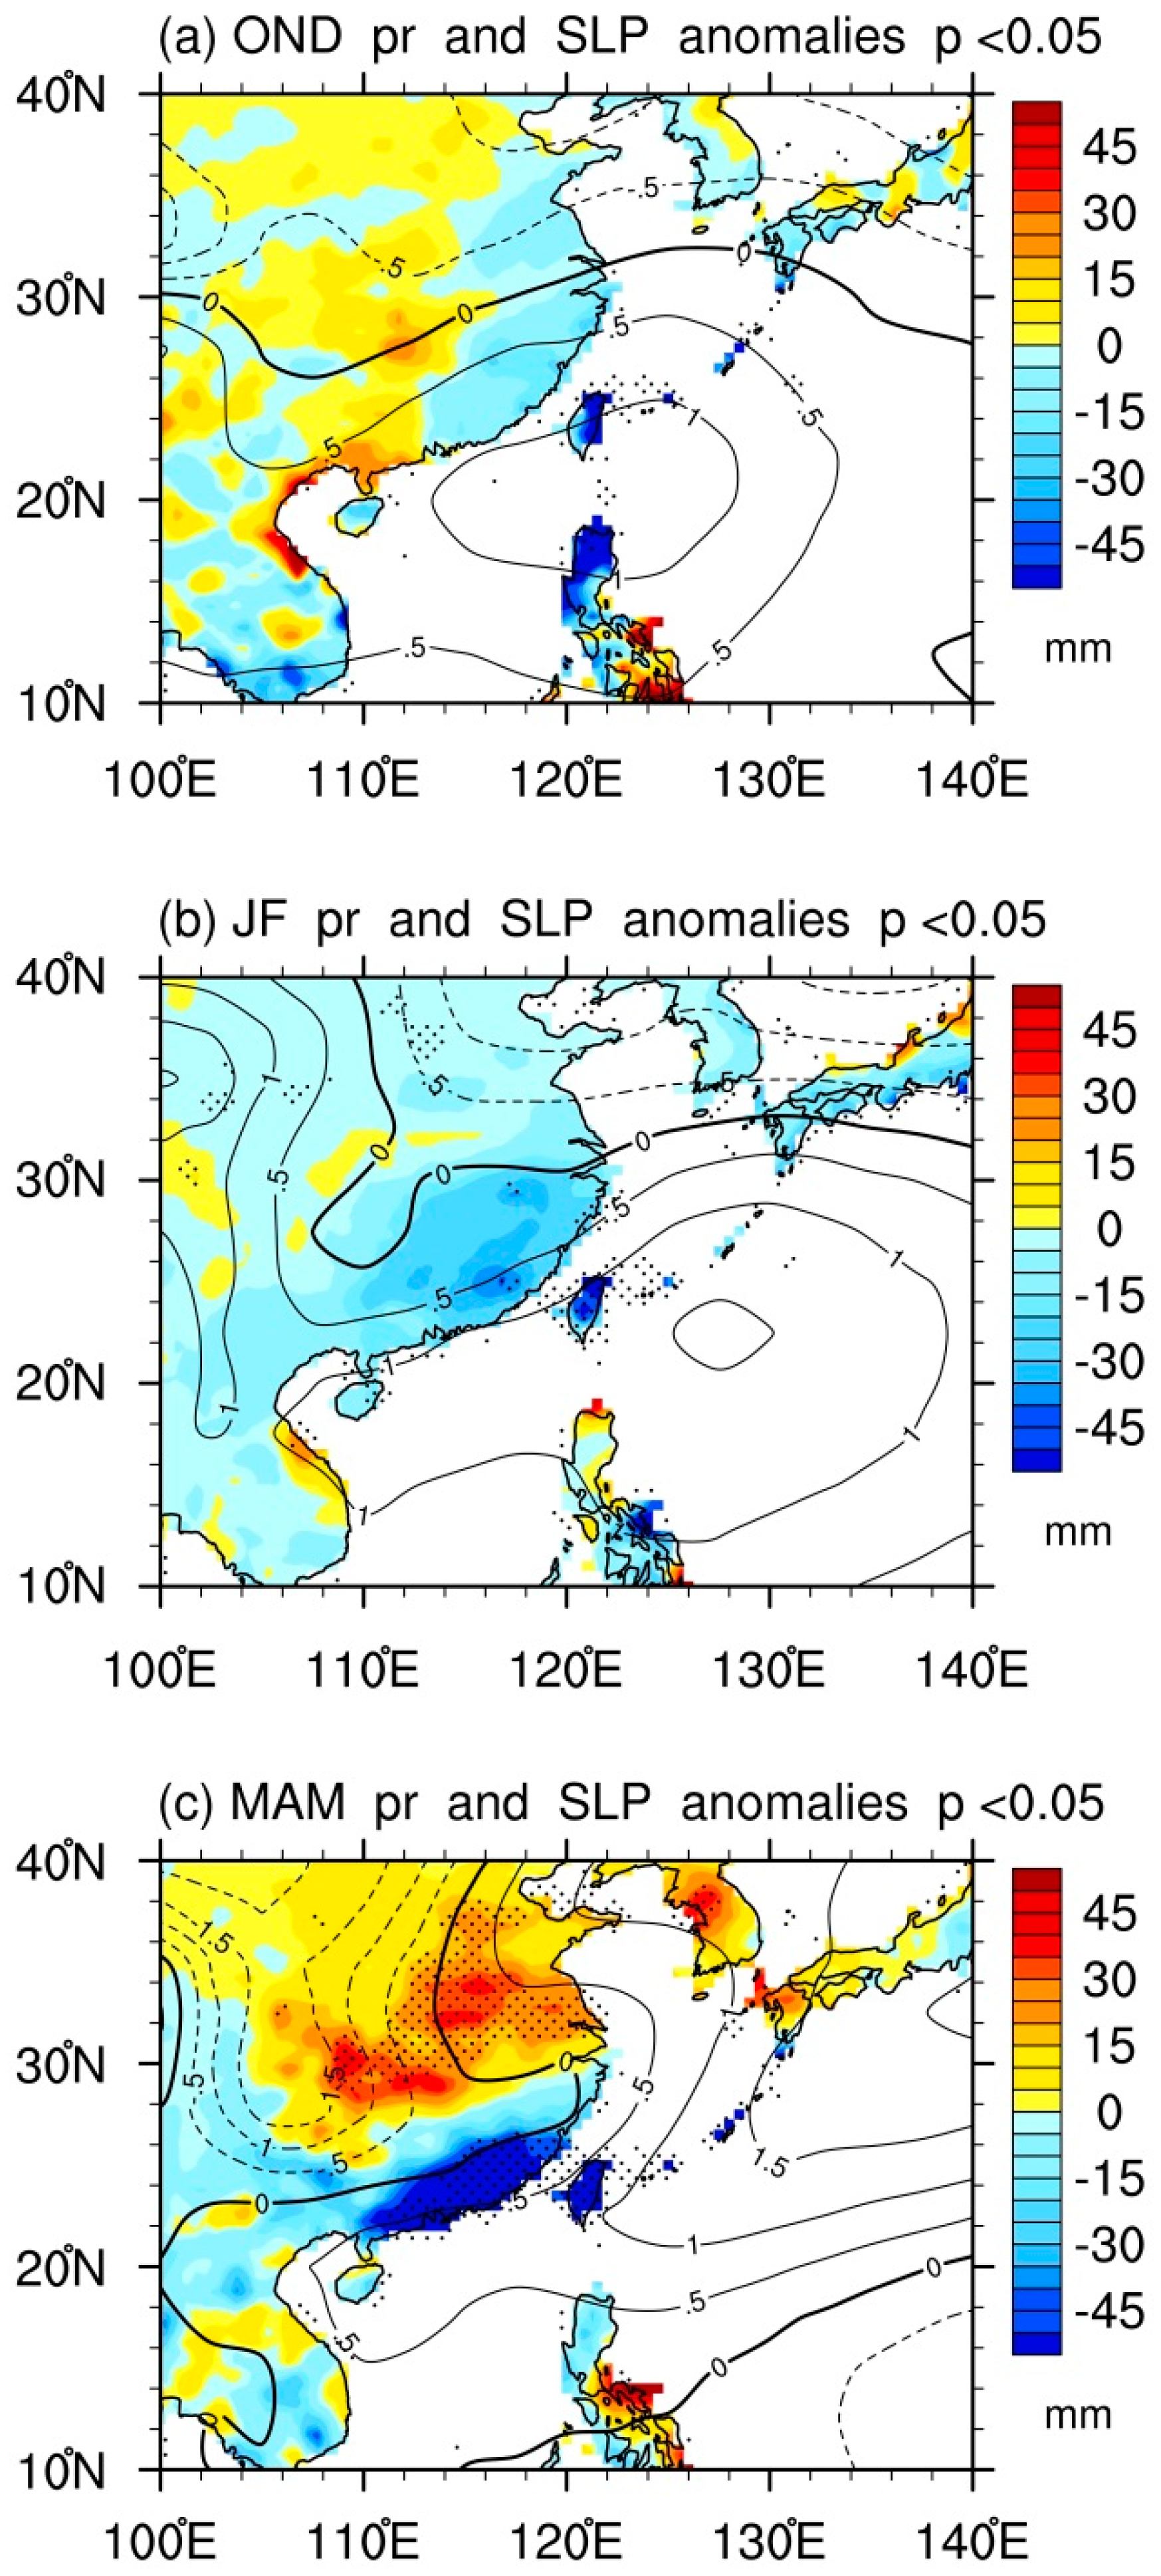
The mean of each period shows its anomalous results of precipitation and SLP (
Figure 5). The anomalous rainfall reveals distinct negative patterns on entire Taiwan and the whole island all passes 95% confidence level, which nicely presents the extremely dry conditions examined in this study. This situation could be explained by the anomalous high SLP patterns around the island because high pressures create an unfavorable condition for convection systems to grow. The distribution of the anomalous high SLP has some differences between each analyzed period. During OND and JF (
Figure 5a,b), Taiwan is surrounded by an anomalous high-pressure system with an adjacent local center seen over each period. However, during MAM (
Figure 5c), a relatively stronger anomalous high-pressure system coming from the northeast covers a large portion of East Asia including Taiwan, which strongly implies the existence of a large-scale system outside the current analyzed spatial domain. Hence, a much larger spatial domain covering the entire North Pacific and its surroundings is applied for the following analyses.
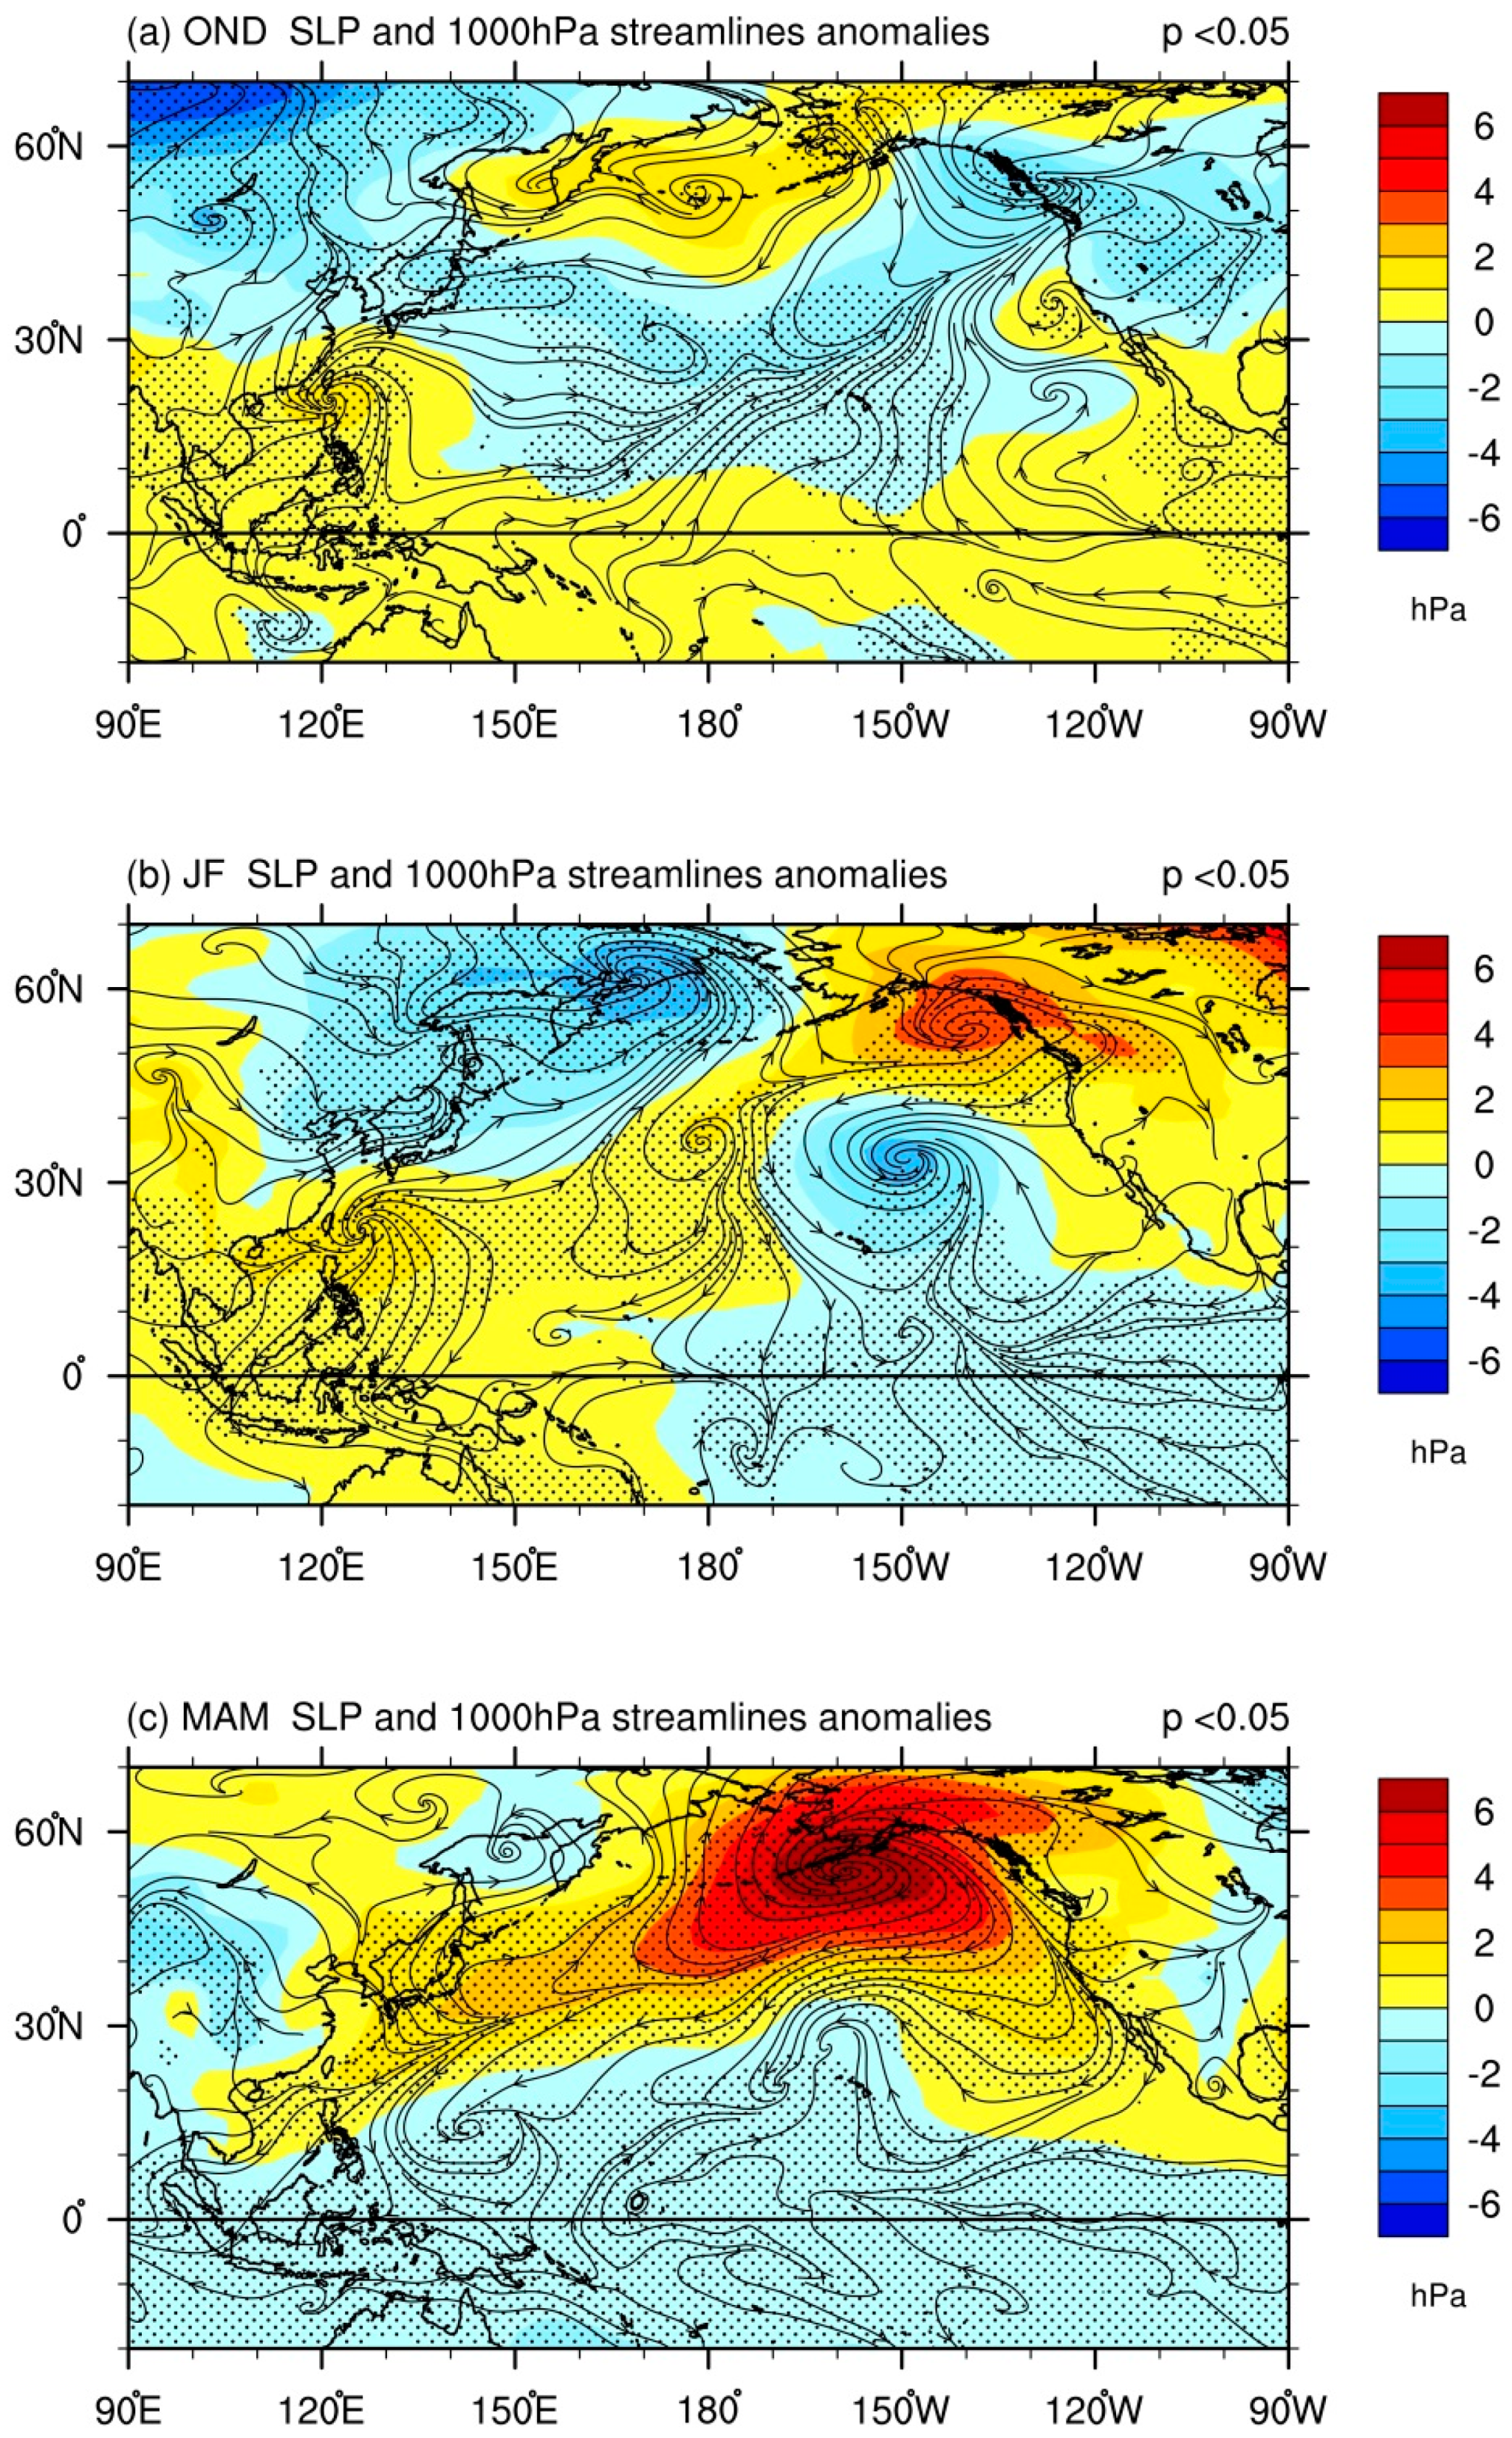
The results in
Figure 6 present large-scale anomalous SLP and 1000 hPa streamlines across the North Pacific as well as parts of East Asia and North America. With the larger domain, the anomalous atmospheric patterns leak more things worthy to go into. In
Figure 6a, although the anomalous SLP during OND now significantly expands, in East Asia, the mentioned local anomalous high’s center located south of Taiwan is still the only dominator. Within the same region, the area of passing 95% confidence level also assembles over Taiwan, Southeast Asia, and adjacent oceans. For these two phenomena above, we suggest the rainfall on the island should be directly dominated by that local anomalous high over this period. An anomalous anticyclone drawn by the 1000 hPa streamlines locates south of Taiwan right above the mentioned anomalous high’s center, which backs up our thought about the local anomalous high affecting the island.
The area of the anomalous high SLP in East Asia connects with another system coming from North America with its center locating south of Alaska during JF (
Figure 6b), creating a bridge-shaped anomalous high across the Pacific. However, the anomalous high on the Asian side still persists around Taiwan, and the areas with 95% confidence level over this entire anomalous high SLP pattern roughly distribute in three regions: Southeast Asia, the Central Pacific and southern Alaska. These findings point out a way of thoughts that the anomalous high affecting Taiwan should be again restricted in Southeast Asia and its adjacent oceans, rather than coming from the northeastern side despite a rather strong center seen beside Alaska. A 1000 hPa anomalous anticyclone east of Taiwan again supports this suggestion. The local higher surface pressures and divergent flows build a relatively unfriendly foundation for convections during this period.
As for springtime during MAM (
Figure 6c), the anomalous high SLP on the Pacific with 95% confidence level seems more to be a massive anomalous high system extending southwestward to the South China Sea with an exceptionally strong center beside Alaska. The anomalous high also covers Taiwan, so a relatively stable atmospheric condition during that time is expected. The 1000 hPa streamlines support the finding of the massive anomalous high-pressure system. A 1000 hPa anomalous anticyclonic circulation on the anomalous high SLP area goes all the way to East Asia in its southwest. Although the major flows start turning back above Japan, its branches still flow through Taiwan. As a consequence, Taiwan is still covered by this extensive low-level anomalous anticyclonic circulation, and obviously this massive system should be in charge of the lack of water on the island in spring.
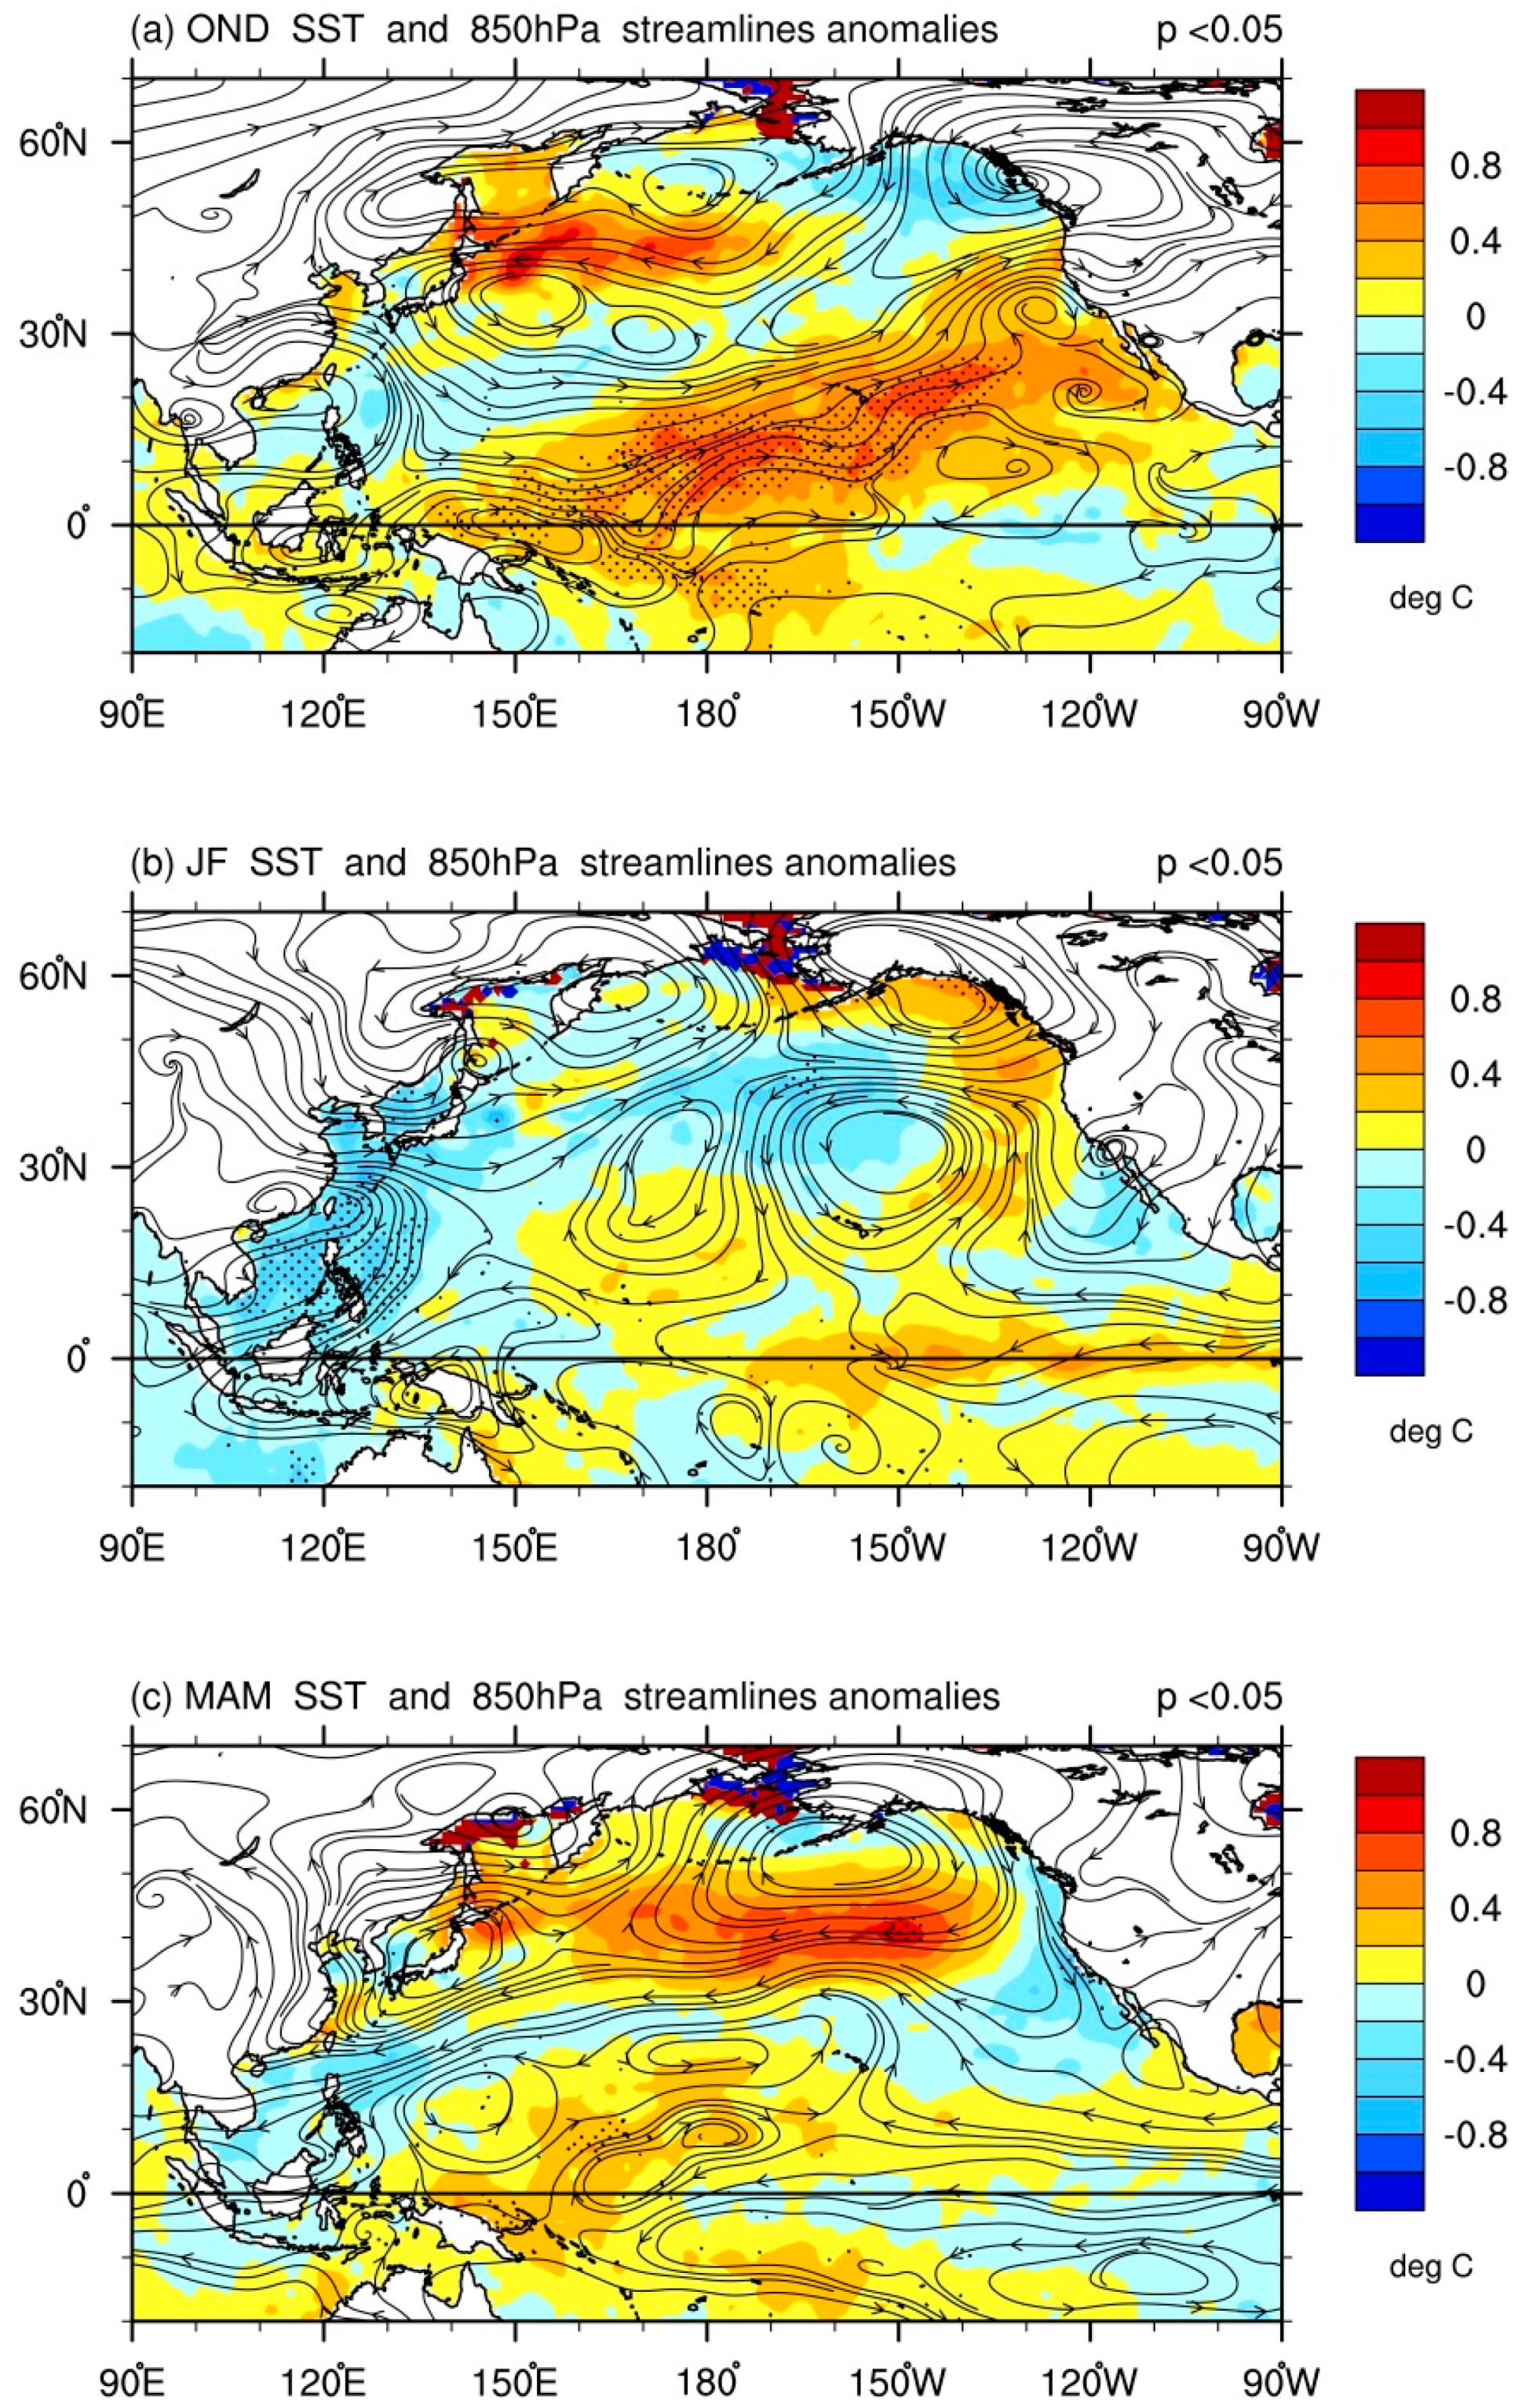
Having preliminarily confirmed the systems putting their negative impact on the rainfall of Taiwan, this study attempts to find out the causes physically triggering the whole processes. Our results are exhibited in
Figure 7 with anomalous SST and streamlines at 850 hPa. In
Figure 7a, the anomalous SST during OND discloses an interesting clue, which would be firmly associated with Pacific Meridional Mode (hereafter PMM). Chiang and Vimont (2004) [
51] found that the PMM is atmosphere-ocean coupled variability distinct from ENSO in the Pacific. Indeed, it is a phenomenon relevant to wintertime mid-latitude atmospheric variability and wind-evaporation-SST feedback [
52]. The oceanic attribute of the PMM in winter is characterized by a northeast-southwest tilting anomalous warm SST pattern in the Central and Eastern Pacific, and a similar tilting way but anomalous cold SST pattern on its north which extends the properties to the coast of East Asia. The PMM also features anomalous surface winds from the west, southwest, and south flowing across the anomalous warm SST area in winter.
In this study, the anomalous SST patterns during OND resemble the ones found in the PMM (
Figure 7a). The anomalous warm SST at 95% confidence level is mostly in the Central and Eastern Pacific with a northeast-southwest tilting pattern north of the equator. Together with that, a similar tilting signal but weaker anomalous cold SST pattern on its north is also seen and reaches all the way to the east coast of Taiwan and even the South China Sea. This shows that the PMM may account for the cause of the severe droughts in Taiwan during OND, with its anomalous cold SST branch stretching into the oceans east and south of Taiwan. The colder SST means less evaporation and latent heat into the atmosphere above, and thus a relatively stable atmospheric environment is expected, creating an unfavorable surface for convections. Regarding the low-level winds, the 1000 hPa streamlines in
Figure 6a during OND also flow similarly as the surface wind patterns found in the PMM. The 1000 hPa westerly, southwesterly, and southerly from the tropical all merge over the major anomalous warm SST area in the Northern Hemisphere and flow together to the further north.
The above-mentioned 1000 hPa anomalous anticyclone locating south of Taiwan seems to be dynamically driven by the PMM-like wind patterns, and its northern and eastern parts then flow into the main signal region of the PMM over the Central Pacific. As for the slightly higher level at 850 hPa, although it is higher than the PMM’s main wind patterns at surface layer, the wind patterns here still remain similar especially at lower latitudes. An anomalous anticyclone at 850 hPa again could be dynamically induced by its adjacent flows as a response to the PMM-like wind patterns. The properties of this anomalous anticyclone cover the South China Sea and the adjacent regions, which would build a descending and stable atmospheric environment over these areas. Together with the dynamically-driven anomalous anticyclone at 1000 hPa, it effectively benefits the severe droughts to occur in Taiwan.
During JF, the clearly seen anomalous cold SST dominates the oceans in East Asia (
Figure 7b), and the area of 95% confidence level mostly covers the South China Sea and the oceans east of Taiwan and Philippines. These imply the anomalous cold SST, which again should be an important factor triggering the entire process during this period, is localized in Southeast Asia rather than extending from somewhere far away. This local anomalous cold surface with less latent heat into the air through evaporation makes the atmosphere stable, and that in turn induces an anomalous anticyclonic circulation respectively seen at 1000 hPa and 850 hPa. These anomalous anticyclonic circulations work together to originate a large-scale descending atmospheric condition over the island and the adjacent regions, which would ruin a foundation for convections to grow. Under this scenario, it is surely unable to precipitate much water onto the land, so more severe droughts to come for Taiwan are expected.
For the anomalous SST during MAM (
Figure 7c), the areas passing 95% confidence level intersperse on few anomalous warm regions and they only account for a small portion. Therefore, it is obvious to know the anomalous SST has lost its influence during this period despite its noticeable patterns. What takes over the domination is a large anomalous anticyclonic circulation at 850 hPa centering east of the Bering Sea with a secondary center above Japan. The anomalous circulation stretches its influence across the Pacific to South China including Taiwan on its southwest boundary, and it resonates the mentioned giant anticyclonic circulation at 1000 hPa. These two strong and extensive anomalous circulations should be wrapped up as one massive system, and the system suppresses the growing of any convection systems under its properties. Taiwan is certainly not out of the case. Although it is supposed to become relatively wet in spring on the island, under the force from this system, some severe drought cases still happen.
The results discussed above have exposed the possible large-scale factors in different seasons which may trigger another severe dryness on the island in the nearly future. They should be interesting perspectives for related studies to further go into more details or discover other possible physical mechanisms. Moreover, as for practical use, the results send valuable information to the government and the society to establish better countermeasures to prepare for the future droughts, which can largely reduce the loss and impact in many fields.
5. Conclusions
In HS2017, our previous study, comparisons for verifying the performance of several drought indices had been made. Considering none of those indices ideally replicated historical drought cases, HS2017 established a new one based on the DSidx. As a result, the TMD index, which adopts many modifications to better suit Taiwan’s climatic characteristics, had made its debut. The index features less complexity to compute and still retains the level of ability to detect droughts in Taiwan, which implies the method can be easily applied in other researches to establish a new drought-detecting index that fits respective local situations. However, the limitation is that the index cannot timely track ongoing cases as its definition requires a period of a dry spell persisting longer than the associated criterion. Therefore, the index is applicable only for detecting previous cases or those dry spells which days have already exceeded the according criterion.
Since the TMD index shows itself more effective in detecting the dryness in many ways, the more accurate cases identified by the index surely are the better candidates for the scientific field to further inspect. This study follows what have been done in HS2017, applying the TMD index to analyze historical severe droughts for the aim at clarifying physical mechanisms from large-scale backgrounds which cause dry conditions. The understandings of the findings provide researchers different perspectives and subjects to explore more details. Thus, the results can be treated as an alert in future when a similar large-scale pattern is observed again.
Through the TMD index, most historical severe drought cases can be identified on a daily basis in a long-term time series with a percentage of dry stations representing the affected extent on the island. The captured historical severe drought cases reveal temporal information about the frequency of occurrence (about 21.7 years) and significant seasonal changings. As for the seasonal changes, the majority of those cases occur during the period of October to the next May when Taiwan receives the least rainfall especially in southern Taiwan, and the extreme dryness is almost extinct from June to September.
Besides the temporal analyses, this study also examines spatial distributions of these severe drought cases during October to the next May. As expected, many extremely arid stations in southern Taiwan during that period deliver a huge contribution to those severe droughts. From a climatological perspective, the dry season spans from late fall throughout the entire winter in southern Taiwan. The relatively significant rainfall from cold fronts in wintertime normally only benefits northern part of the island, so the south usually remains dry during that time. Although it should be wetter in spring for southern Taiwan, it is still likely to experience water shortages if weather systems like Meiyu fronts do not bring sufficient rainfall.
To understand large-scale environments associated with the severe drought cases captured by the TMD index, the entire Taiwan is first treated as a single dry region, and then composites for various variables are conducted in this study. For those months when most of the severe cases occur (October to the next May), this study divides this period into three parts: October to December (OND), January and February (JF), and March to May (MAM). Thus, the mean composite results with different variables over each analyzed period depict the large-scale anomalous atmospheric environments and SST related to the extremely dry conditions in Taiwan.
During OND, a cold anomalous SST band from the PMM patterns extends its properties to Taiwan’s adjacent oceans, and thus creates a relatively stable atmosphere because less evaporation and latent heat into the air. Working together with that cold anomalous SST, low-level anomalous anticyclones dynamically driven by the PMM’s wind patterns above the South China Sea and its surroundings produce downward motion to further stabilize the environment. Similarly, during JF, a noticeable cold area of anomalous SST around Taiwan and in the South China Sea weakens the atmospheric motion above it because of less latent heat into the above air through evaporation. Besides, in response to the weakened atmospheric motion, low-level anomalous anticyclones covering South China, the South China Sea and Southeast Asia also send their contributions to build up the unfavorable environment for convections. A different situation is seen during MAM. The anomalous SST which triggers the entire process to proceed onward in wintertime, loses its influence and the role is replaced by a massive low-level anomalous anticyclonic circulation associated with the weakening of Aleutian low. The entire atmosphere under this extensive anomalous system is expected to be relatively stable, which ruins the foundation for active convections to grow.
Note that the possibility of this massive anomalous anticyclonic circulation suppressing convections through a different way cannot be ruled out. As well-mentioned in this study, cold fronts and Meiyu fronts can precipitate considerable rainfall onto the island in spring. While the existence of this anomalous anticyclonic circulation is like a solid barrier to block up those fronts. In that scenario, fronts could be stuck on the north and keep their rain bands away from Taiwan. The examinations into more details about the mechanism for the whole process are reserved for the future study. A brief idea about the future analysis is to examine historical weather charts and then categorize fronts into various types by their location. Through this method, the links between adjacent large-scale atmospheric fields and the defined different locations of fronts can be built. Thus, the associated mechanisms adding into the rain bands are possibly to be clarified.


