Size-Segregated Characteristics of Carbonaceous Aerosols during the Monsoon and Non-Monsoon Seasons in Lhasa in the Tibetan Plateau


Abstract
1. Introduction
2. Experiments
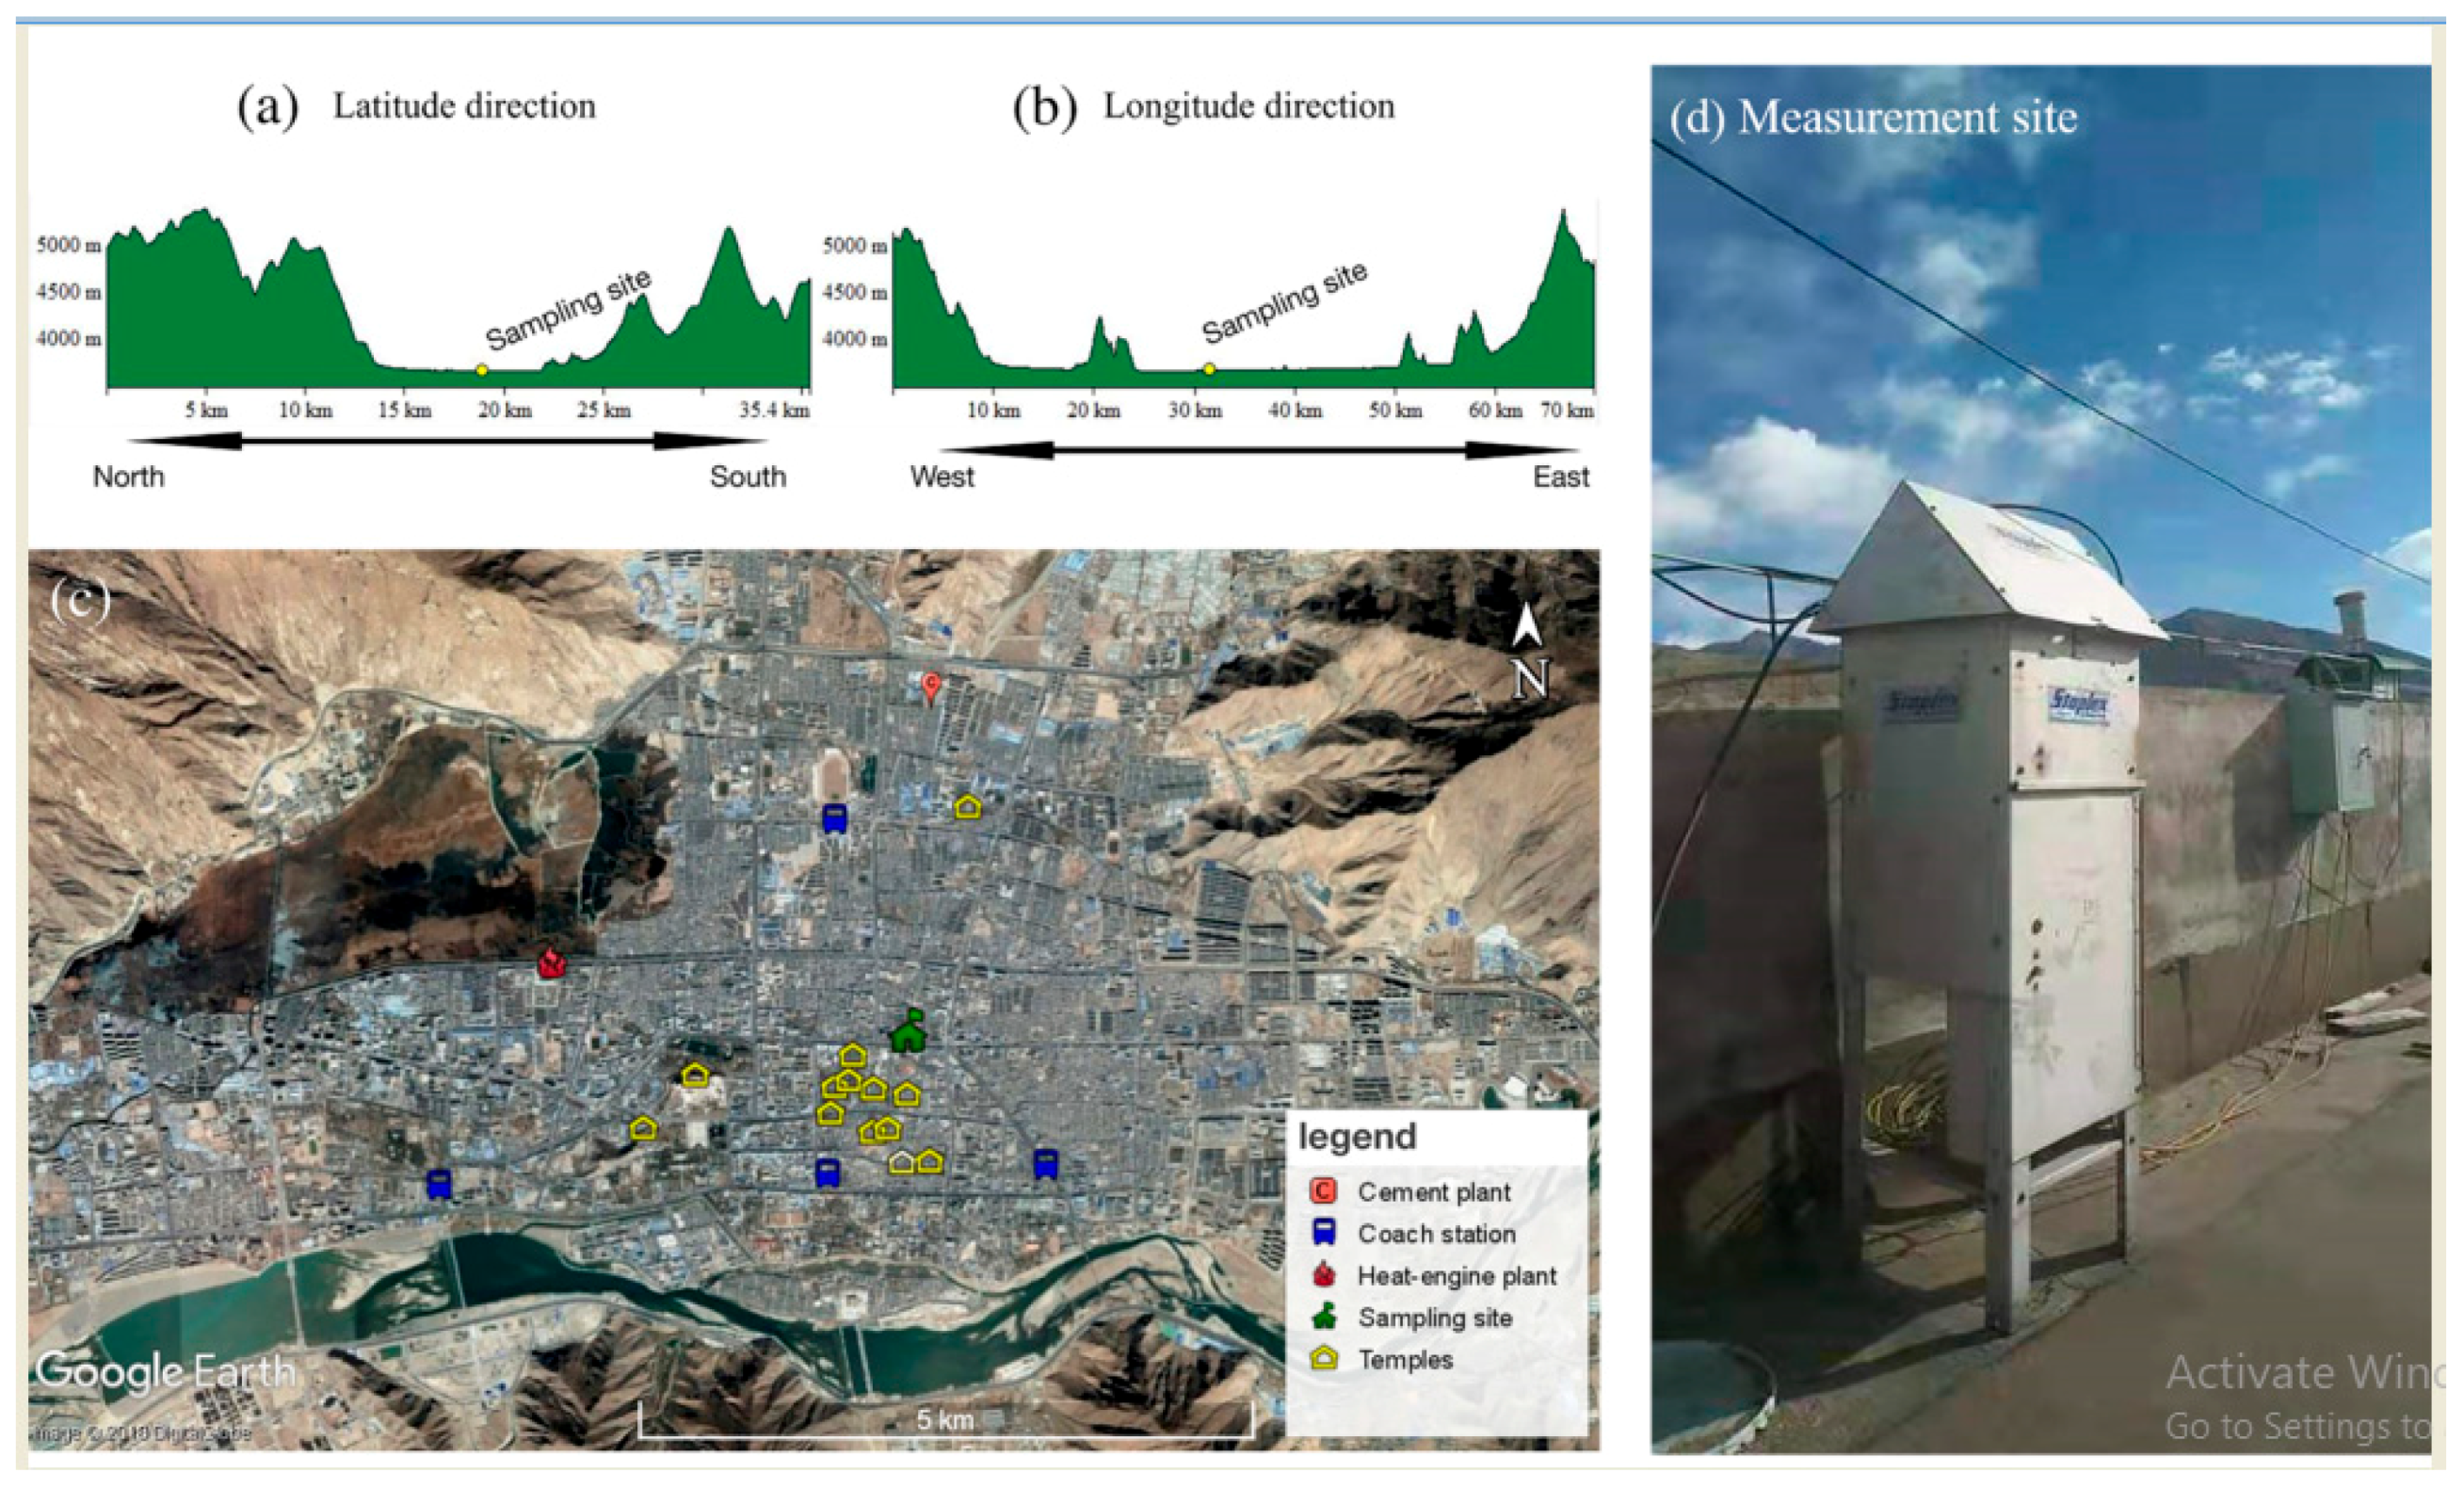
2.1. Sampling Site
2.2. Organic Carbon (OC), Elemental Carbon (EC), and Water-Soluble Organic Carbon (WSOC)Analyses
2.3. Water-Soluble Ion Analysis
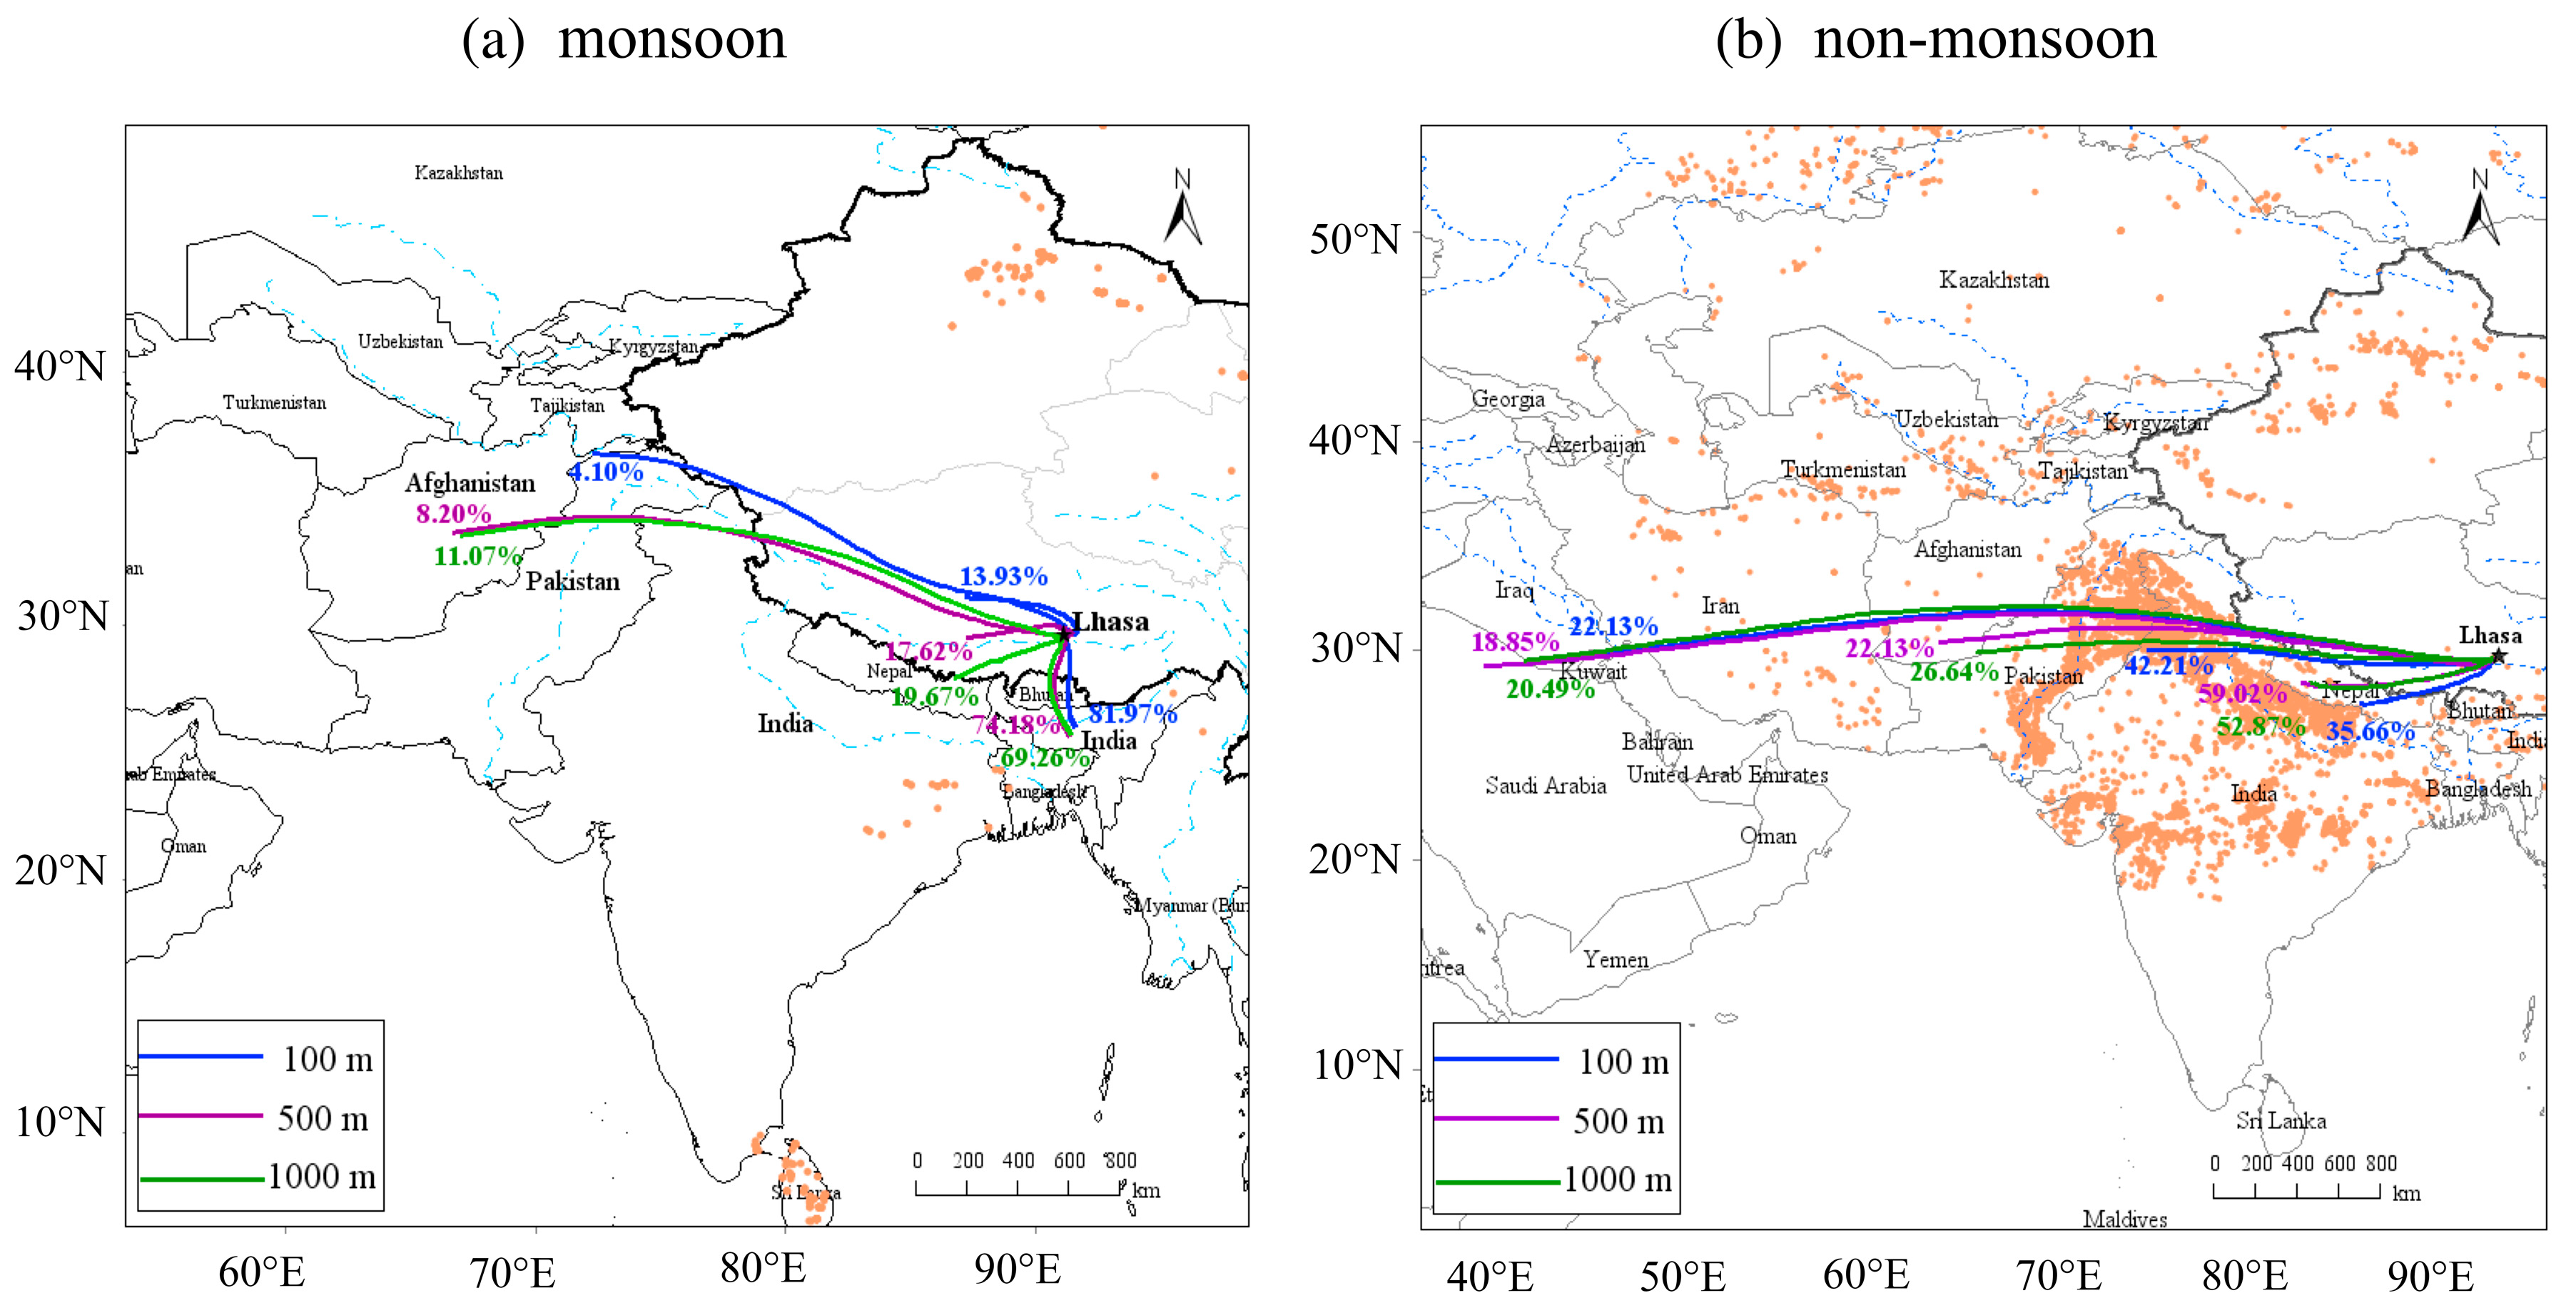
2.4. Back Trajectory Interpretation
3. Results and Discussion
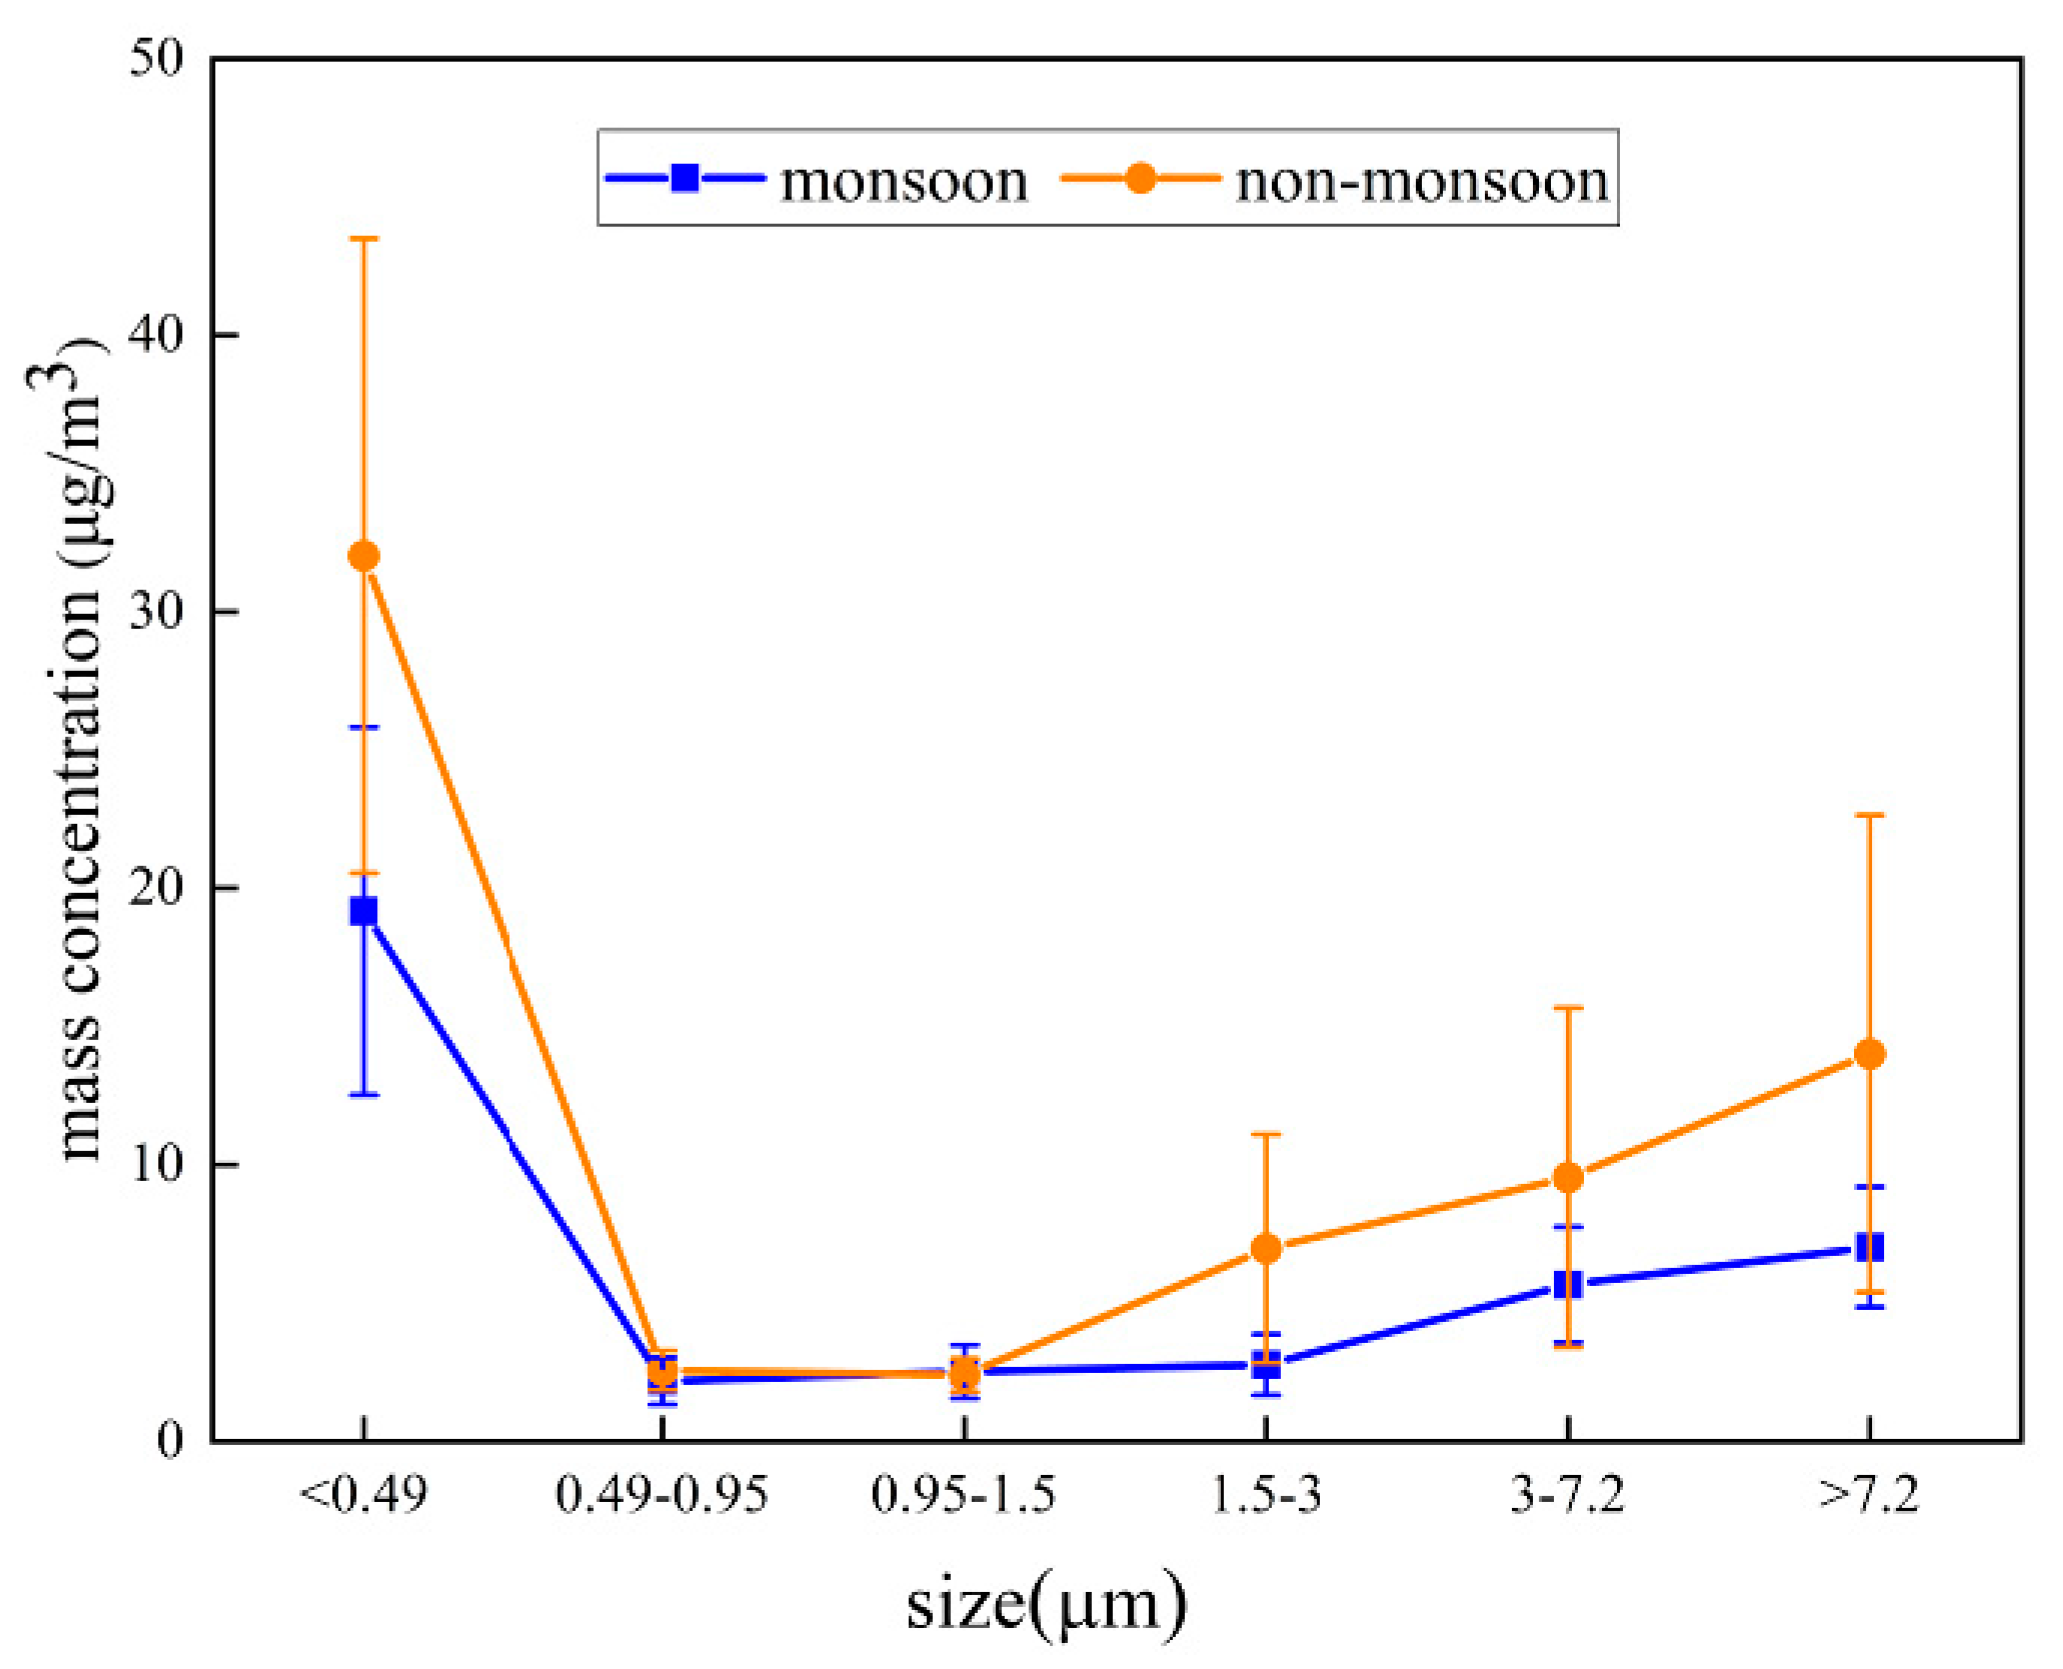
3.1. Concentrations of Size-Segregated Particulate Matter (PM) Samples
3.2. Temporal Variations of the OC, EC, and WSOC Mass Concentrations
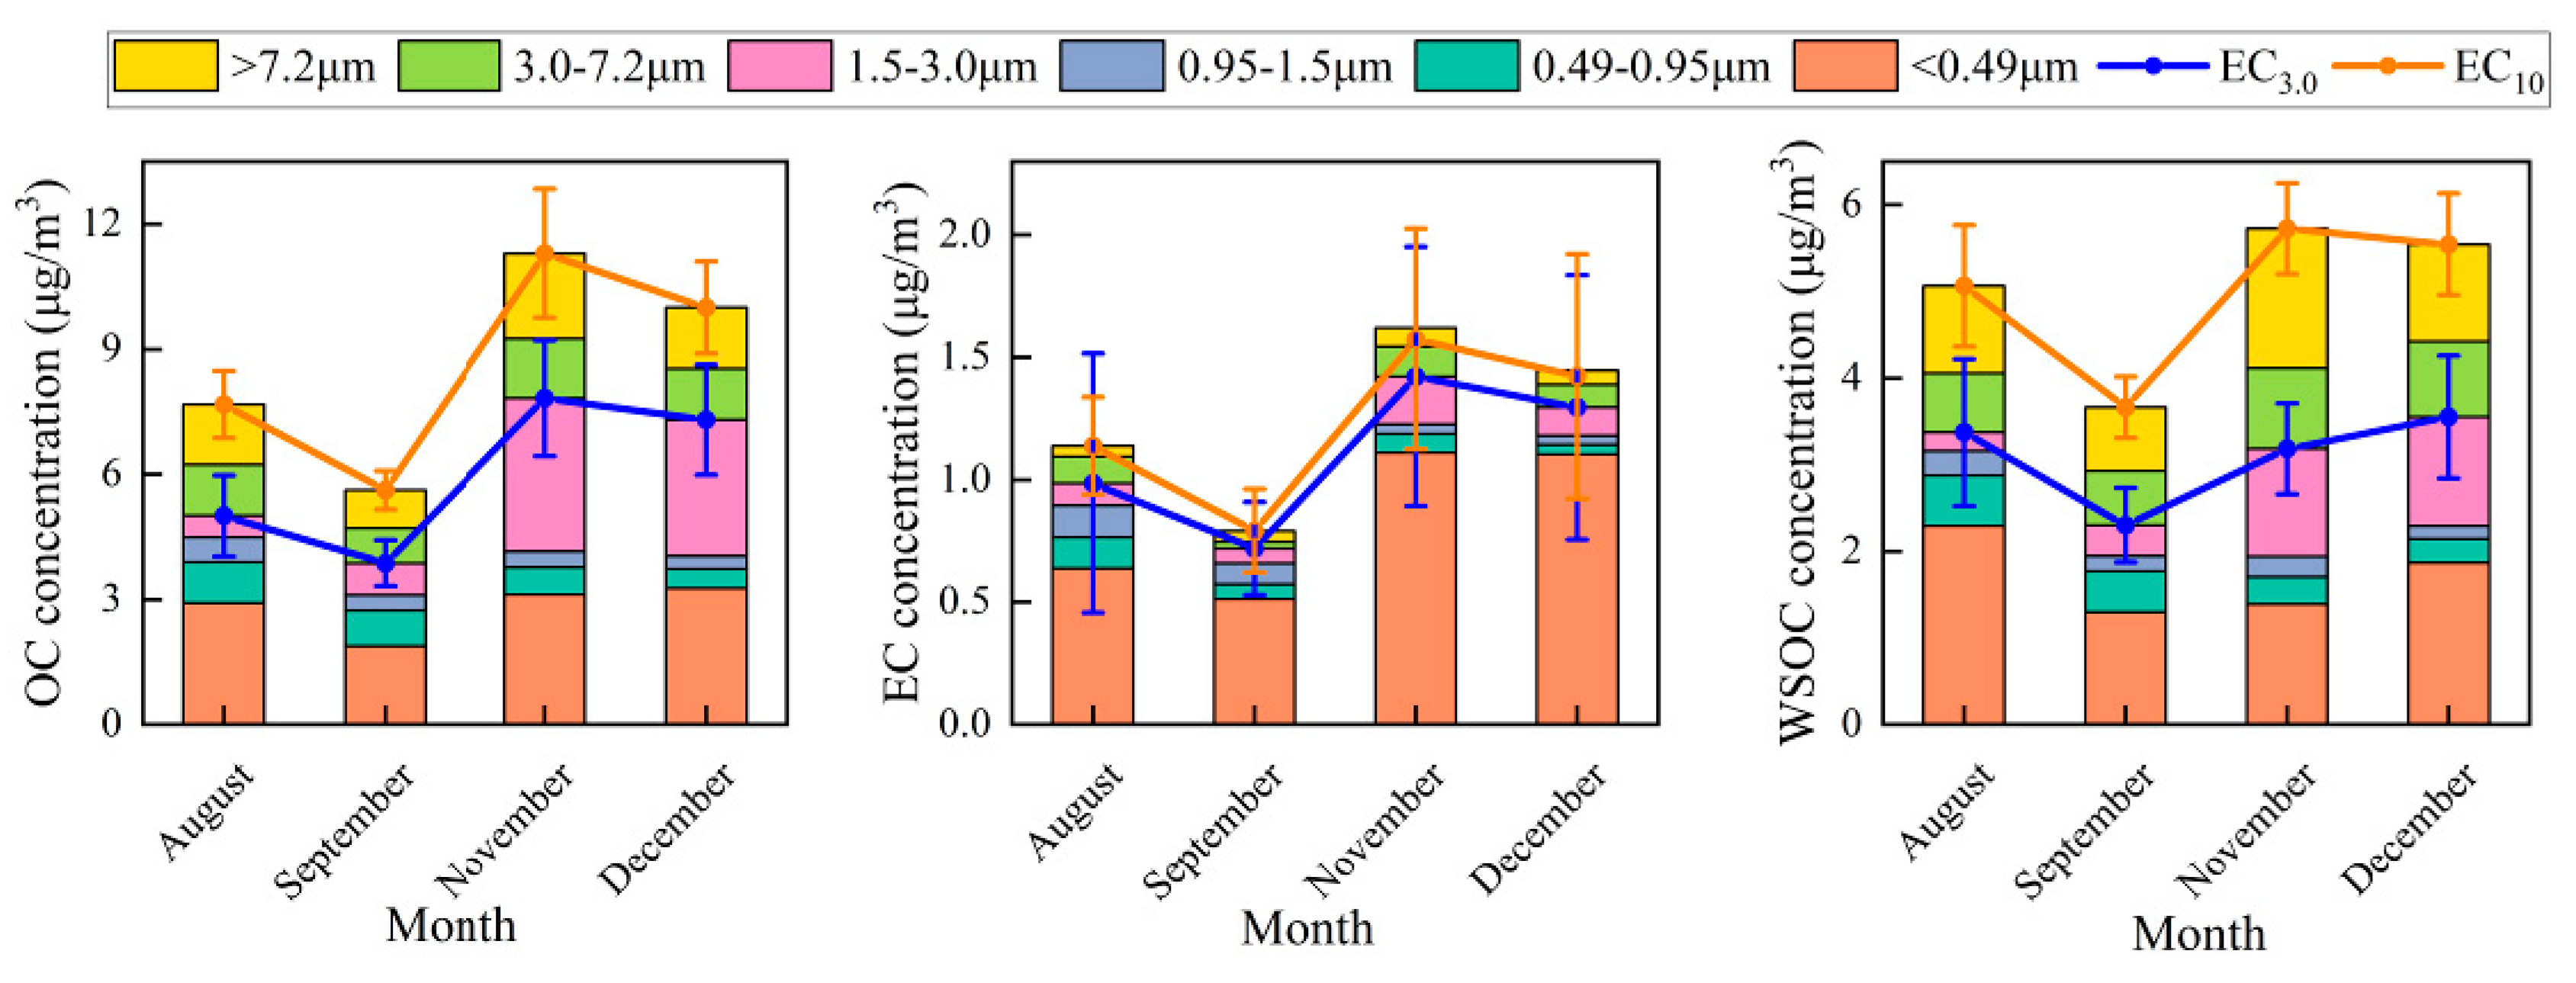
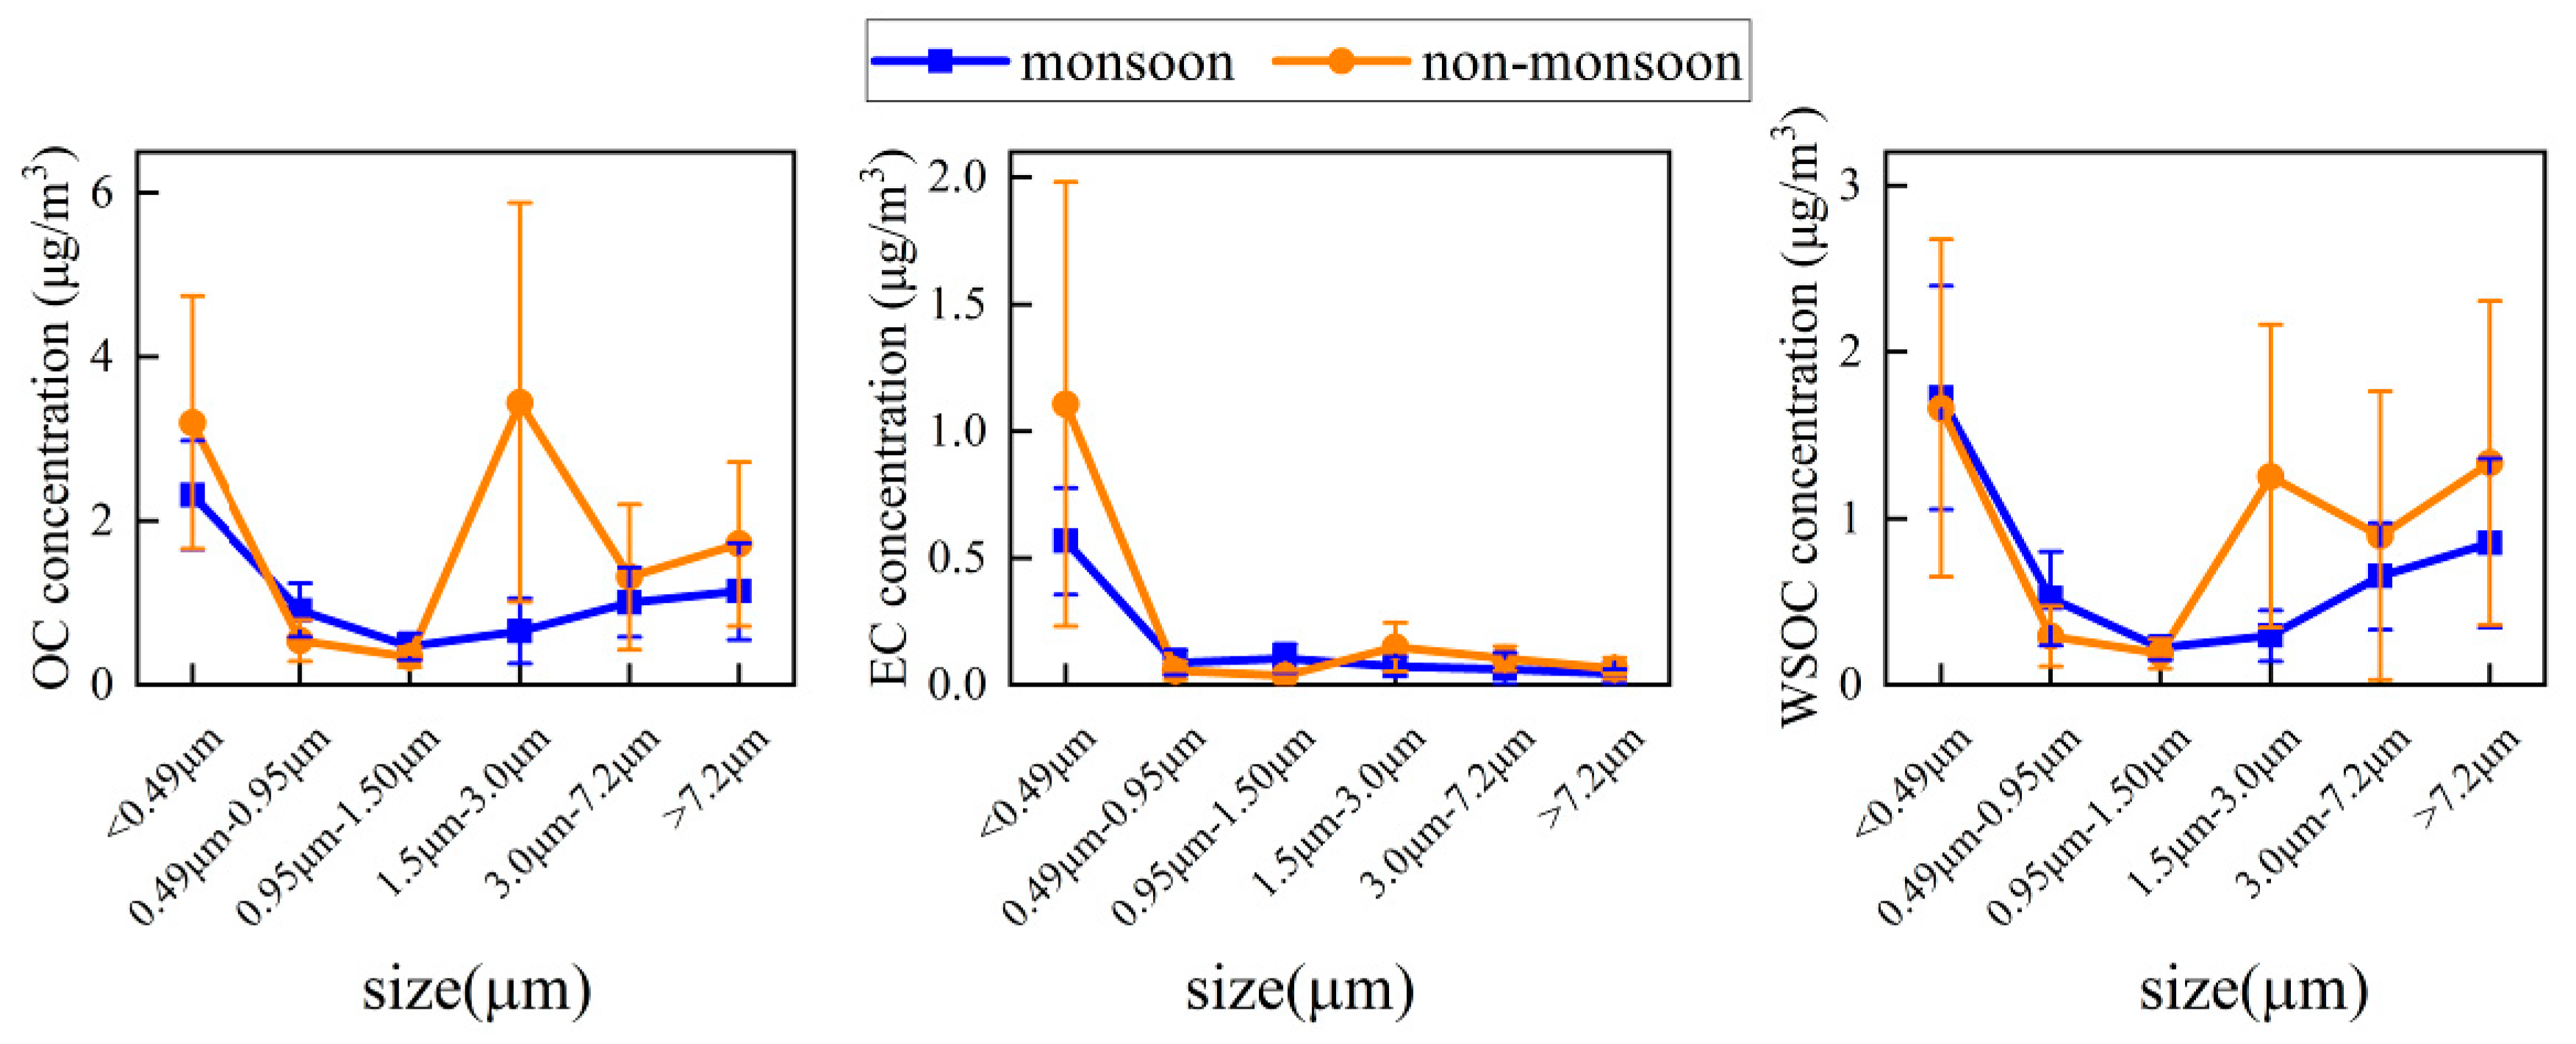
3.3. OC, EC, and WSOC Mass Concentrations of Size-Segregated Aerosols
3.4. Analysis of OC, EC and WSOC Sources
3.4.1. Relationships among the Different Carbonaceous Aerosols
3.4.2. The Implications from Key Water-Soluble Ions
4. Conclusions
Supplementary Materials
Author Contributions
Funding
Acknowledgments
Conflicts of Interest
References
- Ping, G.; Wang, X.; Yao, T. Ambient distribution of particulate- and gas-phase n -alkanes and polycyclic aromatic hydrocarbons in the Tibetan Plateau. Environ. Earth Sci. 2011, 64, 1703–1711. [Google Scholar]
- Huang, J.; Kang, S.; Wang, S.; Wang, L.; Zhang, Q.; Guo, J.; Wang, K.; Zhang, G.; Tripathee, L. Wet deposition of mercury at Lhasa, the capital city of Tibet. Sci. Total Environ. 2013, 447, 123–132. [Google Scholar] [CrossRef] [PubMed]
- Wan, X.; Kang, S.; Xin, J.; Liu, B.; Wen, T.; Wang, P.; Wang, Y.; Cong, Z. Chemical composition of size-segregated aerosols in Lhasa city, Tibetan Plateau. Atmosp. Res. 2016, 174–175, 142–150. [Google Scholar] [CrossRef]
- Duo, B.; Zhang, Y.; Kong, L.; Fu, H.; Hu, Y.; Chen, J.; Li, L.; Qiong, A. Individual particle analysis of aerosols collected at Lhasa City in the Tibetan Plateau. J. Environ. Sci. (China) 2015, 29, 165–177. [Google Scholar] [CrossRef] [PubMed]
- Huang, Q.Z. Analysis on the ambient air quality relation to meteorological condition in Lhasa. Environ. Monit. China 2001, 17, 50–53. [Google Scholar]
- Huang, L.; Hamza, N.; Lan, B.; Zahi, D. Climate-responsive design of traditional dwellings in the cold-arid regions of Tibet and a field investigation of indoor environments in winter. Energy Build. 2016, 128, 697–712. [Google Scholar] [CrossRef]
- Cui, Y.Y.; Liu, S.; Bai, Z.; Bian, J.; Li, D.; Fan, K.; McKeen, S.A.; Watts, L.A.; Ciciora, S.J.; Gao, R.-S. Religious burning as a potential major source of atmospheric fine aerosols in summertime Lhasa on the Tibetan Plateau. Atmosp. Environ. 2018, 181, 186–191. [Google Scholar] [CrossRef]
- Wang, Y.; Yang, L.; Zhou, X.; Dai, J.; Zhou, Y.; Deng, Z. Experiment study of the altitude effects on spontaneous ignition characteristics of wood. Fuel 2010, 89, 1029–1034. [Google Scholar]
- Fang, J.; Tu, R.; Guan, J.-F.; Wang, J.-J.; Zhang, Y.-M. Influence of low air pressure on combustion characteristics and flame pulsation frequency of pool fires. Fuel 2011, 90, 2760–2766. [Google Scholar] [CrossRef]
- Liu, J.; Li, J.; Lin, T.; Liu, D.; Xu, Y.; Chaemfa, C.; Qi, S.; Liu, F.; Zhang, G. Diurnal and nocturnal variations of PAHs in the Lhasa atmosphere, Tibetan Plateau: Implication for local sources and the impact of atmospheric degradation processing. Atmosp. Res. 2013, 124, 34–43. [Google Scholar] [CrossRef]
- Pachauri, T.; Singla, V.; Satsangi, A. Characterization of carbonaceous aerosols with special reference to episodic events at Agra, India. Atmosp. Res. 2013, 128, 98–110. [Google Scholar] [CrossRef]
- Liu, J.; Mo, Y.; Li, J.; Liu, D.; Shen, C.; Ding, P.; Jiang, H.; Cheng, Z.; Zhang, X.; Tian, C. Radiocarbon-derived source apportionment of fine carbonaceous aerosols before, during, and after the 2014 Asia-Pacific Economic Cooperation (APEC) summit in Beijing, China. J. Geophys. Res. Atmosp. 2016, 121, 4177–4187. [Google Scholar] [CrossRef]
- Ning, H. Review of Measurement Techniques about Organic Carbon and Elemental Carbon in Atmospheric Particles. Acta Sci. Nat. Univ. Pekin. 2005, 41, 957–964. [Google Scholar]
- Zhong, Z.; Hu, K.; Huang, Z.; Yin, T.; Shen, L. Characteristic Analysis of OC and EC in PM_(2.5) of Typical Haze Weather in Wuhan City. Meteorol. Environ. Res. 2014, 5, 19–22. [Google Scholar]
- Chow, J.C.; Watson, J.G. PM 2.5 carbonate concentrations at regionally representative Interagency Monitoring of Protected Visual Environment sites. J. Geophys. Res. 2002, 107, ICC-6. [Google Scholar] [CrossRef]
- Zhang, Y.L.; Elhaddad, I.; Huang, R.J.; Ho, K.F.; Cao, J.J.; Han, Y.; Zotter, P.; Bozzetti, C.; Daellenbach, K.R.; Slowik, J.G. Large contribution of fossil fuel derived secondary organic carbon to water soluble organic aerosols in winter haze in China. Atmosp. Chem. Phys. 2018, 18, 1–32. [Google Scholar] [CrossRef]
- Wozniak, A.S.; Bauer, J.E.; Dickhut, R.M. Characteristics of water-soluble organic carbon associated with aerosol particles in the eastern United States. Atmosp. Environ. 2012, 46, 181–188. [Google Scholar] [CrossRef]
- Weber, R.J.; Sullivan, A.P.; Peltier, R.E.; Russell, A.; Yan, B.; Zheng, M.; De Gouw, J.; Warneke, C.; Brock, C.; Holloway, J.S. A study of secondary organic aerosol formation in the anthropogenic-influenced southeastern United States. J. Geophys. Res. Atmosp. 2007, 112, D13302. [Google Scholar] [CrossRef]
- Mayol-Bracero, O.L.; Guyon, P.; Graham, B.; Roberts, G.; Andreae, M.O.; Decesari, S.; Facchini, M.C.; Fuzzi, S.; Artaxo, P. Water-soluble organic compounds in biomass burning aerosols over Amazonia 2. Apportionment of the chemical composition and importance of the polyacidic fraction. J. Geophys. Res. Atmosp. 2002, 107, LBA 59-1–LBA 59-15. [Google Scholar] [CrossRef]
- Bond, T.C.; Doherty, S.J.; Fahey, D.W.; Forster, P.M.; Berntsen, T.; Deangelo, B.J.; Flanner, M.G.; Ghan, S.; Kärcher, B.; Koch, D. Bounding the role of black carbon in the climate system: A scientific assessment. J. Geophys. Res. Atmosp. 2013, 118, 5380–5552. [Google Scholar] [CrossRef]
- Wan, X.; Kang, S.; Wang, Y.; Xin, J.; Liu, B.; Guo, Y.; Wen, T.; Zhang, G.; Cong, Z. Size distribution of carbonaceous aerosols at a high-altitude site on the central Tibetan Plateau (Nam Co Station, 4730ma.s.l.). Atmosp. Res. 2015, 153, 155–164. [Google Scholar] [CrossRef]
- Kaspari, S.D.; Schwikowski, M.; Gysel, M.; Flanner, M.G.; Kang, S.; Hou, S.; Mayewski, P.A. Recent increase in black carbon concentrations from a Mt. Everest ice core spanning 1860–2000 AD. Geophys. Res. Lett. 2011, 38, 155–170. [Google Scholar] [CrossRef]
- Andreae, M.O.; Gelencsér, A. Black carbon or brown carbon? The nature of light-absorbing carbonaceous aerosols. Atmosp. Chem. Phys. 2006, 6, 3131–3148. [Google Scholar] [CrossRef]
- Albrecht, B.A. Aerosols, cloud microphysics, and fractional cloudiness. Science 1989, 245, 1227–1230. [Google Scholar] [CrossRef]
- Saleh, R.; Robinson, E.S.; Tkacik, D.S.; Ahern, A.T.; Liu, S.; Aiken, A.C.; Sullivan, R.C.; Presto, A.A.; Dubey, M.K.; Yokelson, R.J. Brownness of organics in aerosols from biomass burning linked to their black carbon content. Nat. Geosci. 2014, 7, 647. [Google Scholar] [CrossRef]
- Washenfelder, R.A.; Attwood, A.R.; Brock, C.A.; Guo, H.; Xu, L.; Weber, R.J.; Ng, N.L.; Allen, H.M.; Ayres, B.R.; Baumann, K. Biomass burning dominates brown carbon absorption in the rural southeastern United States. Geophys. Res. Lett. 2015, 42, 653–664. [Google Scholar] [CrossRef]
- Bond, T.C. Spectral dependence of visible light absorption by carbonaceous particles emitted from coal combustion. Geophys. Res. Lett. 2001, 28, 4075–4078. [Google Scholar] [CrossRef]
- Guang-Ming, W.U.; Cong, Z.Y.; Kang, S.C.; Kawamura, K.; Ping-Qing, F.U.; Zhang, Y.L.; Wan, X. Brown carbon in the cryosphere: Current knowledge and perspective. Adv. Clim. Chang. Res. 2016, 7, 82–89. [Google Scholar]
- Lack, D.; Bahreini, R.; Langridge, J.; Gilman, J.; Middlebrook, A. Brown carbon absorption linked to organic mass tracers in biomass burning particles. Atmosp. Chem. Phys. 2013, 13, 2415–2422. [Google Scholar] [CrossRef]
- Zhang, X.; Lin, Y.H.; Surratt, J.D.; Zotter, P.; Prevot, A.S.H.; Weber, R.J. Light-absorbing soluble organic aerosol in Los Angeles and Atlanta: A Contrast in Secondary Organic Aerosol. Geophys. Res. Lett. 2011, 38, 759–775. [Google Scholar] [CrossRef]
- Fu, P.; Kawamura, K.; Chen, J.; Qin, M.; Ren, L.; Sun, Y.; Wang, Z.; Barrie, L.A.; Tachibana, E.; Ding, A. Fluorescent water-soluble organic aerosols in the High Arctic atmosphere. Sci. Rep. 2015, 5, 9845. [Google Scholar] [CrossRef]
- Laskin, A.; Laskin, J.; Nizkorodov, S.A. Chemistry of Atmospheric Brown Carbon. Chem. Rev. 2015, 115, 4335. [Google Scholar] [CrossRef] [PubMed]
- Yue, S.; Ren, H.; Fan, S.; Sun, Y.; Wang, Z.; Fu, P. Springtime precipitation effects on the abundance of fluorescent biological aerosol particles and HULIS in Beijing. Sci. Rep. 2016, 6, 29618. [Google Scholar] [CrossRef]
- Twomey, S. Pollution and the planetary albedo. Atmosp. Environ. 1974, 8, 1251–1256. [Google Scholar] [CrossRef]
- Daniel, R.; Ulrike, L.; Raga, G.B.; O’Dowd, C.D.; Markku, K.; Sandro, F.; Anni, R.; Andreae, M.O. Flood or drought: How do aerosols affect precipitation? Science 2008, 321, 1309–1313. [Google Scholar]
- Kang, H.; Zhu, B.; Wang, H.L.; Shi, S.S. Characterization and Variation of Organic Carbon(OC) and Elemental Carbon(EC) in PM_(2.5) During the Winter in the Yangtze River Delta Region, China. Environ. Sci. 2018, 39, 961–971. [Google Scholar]
- Balachandran, S.; Pachon, J.E.; Lee, S.; Oakes, M.M.; Rastogi, N.; Shi, W.; Tagaris, E.; Yan, B.; Davis, A.; Zhang, X. Particulate and gas sampling of prescribed fires in South Georgia, USA. Atmosp. Environ. 2013, 81, 125–135. [Google Scholar] [CrossRef]
- Bozzetti, C.; El Haddad, I.; Salameh, D.; Daellenbach, K.R.; Fermo, P.; Gonzalez, R.; Cruz Minguillón, M.; Iinuma, Y.; Poulain, L.; Elser, M. Organic aerosol source apportionment by offline-AMS over a full year in Marseille. Atmosp. Chem. Phys. 2017, 17, 1–46. [Google Scholar]
- Park, S.H.; Gong, S.L.; Bouchet, V.S.; Gong, W.; Makar, P.A.; MORAN, M.D.; Stroud, C.A.; Zhang, J. Effects of black carbon aging on air quality predictions and direct radiative forcing estimation. Tellus 2011, 63, 1026–1039. [Google Scholar] [CrossRef]
- Singh, A.; Rastogi, N.; Patel, A.; Satish, R.V.; Singh, D. Size-Segregated Characteristics of Carbonaceous Aerosols over the Northwestern Indo-Gangetic Plain: Year Round Temporal Behavior. Aerosol Air Q. Res. 2016, 16, 1615–1624. [Google Scholar] [CrossRef]
- Ming, J.; Xiao, C.; Sun, J.; Kang, S.; Bonasoni, P. Carbonaceous particles in the atmosphere and precipitation of the Nam Co region, central Tibet. J. Environ. Sci. 2010, 22, 1748–1756. [Google Scholar] [CrossRef]
- Zhao, Z.; Wang, Q.; Xu, B.; Shen, Z.; Huang, R.; Zhu, C.; Su, X.; Zhao, S.; Long, X.; Liu, S. Black carbon aerosol and its radiative impact at a high-altitude remote site on the southeastern Tibet Plateau. J. Geophys. Res. Atmosp. 2017, 122, 5515–5530. [Google Scholar] [CrossRef]
- Xu, J.Z.; Zhang, Q.; Wang, Z.B.; Yu, G.M.; Ge, X.L.; Qin, X. Chemical composition and size distribution of summertime PM2.5 at a high altitude remote location in the northeast of the Qinghai–Xizang (Tibet) Plateau: Insights into aerosol sources and processing in free troposphere. Atmosp. Chem. Phys. 2015, 15, 5069–5081. [Google Scholar] [CrossRef]
- Zhang, Y.-L.; Liu, J.-W.; Salazar, G.A.; Li, J.; Zotter, P.; Zhang, G.; Shen, R.-R.; Schäfer, K.; Schnelle-Kreis, J.; Prévôt, A.S.H.; et al. Micro-scale (μg) radiocarbon analysis of water-soluble organic carbon in aerosol samples. Atmosp. Environ. 2014, 97, 1–5. [Google Scholar] [CrossRef]
- Duo, B.; Cui, L.; Wang, Z.; Li, R.; Zhang, L.; Fu, H.; Chen, J.; Zhang, H.; Qiong, A. Observations of atmospheric pollutants at Lhasa during 2014-2015: Pollution status and the influence of meteorological factors. J. Environ. Sci. (China) 2018, 63, 28–42. [Google Scholar] [CrossRef]
- Li, C.; Chen, P.; Kang, S.; Yan, F.; Hu, Z.; Qu, B.; Sillanpää, M. Concentrations and light absorption characteristics of carbonaceous aerosol in PM 2.5 and PM 10 of Lhasa city, the Tibetan Plateau. Atmos. Environ. 2016, 127, 340–346. [Google Scholar] [CrossRef]
- Liu, J.; Li, J.; Zhang, Y.; Liu, D.; Ding, P.; Shen, C.; Shen, K.; He, Q.; Ding, X.; Wang, X. Source apportionment using radiocarbon and organic tracers for PM2.5 carbonaceous aerosols in Guangzhou, South China: Contrasting local- and regional-scale haze events. Environ. Sci. Technol. 2014, 48, 12002–12011. [Google Scholar] [CrossRef] [PubMed]
- Cong, Z.; Kang, S.; Kawamura, K.; Liu, B.; Wan, X.; Wang, Z.; Gao, S.; Fu, P. Carbonaceous aerosols on the south edge of the Tibetan Plateau: Concentrations, seasonality and sources. Atmosp. Chem. Phys. 2015, 15, 1573–1584. [Google Scholar] [CrossRef]
- Long, S.; Zeng, J.; Li, Y.; Bao, L.; Cao, L.; Liu, K.; Xu, L.; Lin, J.; Liu, W.; Wang, G.; et al. Characteristics of secondary inorganic aerosol and sulfate species in size-fractionated aerosol particles in Shanghai. J. Environ. Sci. 2014, 26, 1040–1051. [Google Scholar] [CrossRef]
- Stein, A.F.; Draxler, R.R.; Rolph, G.D.; Stunder, B.J.B.; Cohen, M.D.; Ngan, F. NOAA’s HYSPLIT Atmospheric Transport and Dispersion Modeling System. Bull. Am. Meteorol. Soc. 2016, 96, 2059–2077. [Google Scholar] [CrossRef]
- Zhang, N.; Cao, J.; Wang, Q.; Huang, R.; Zhu, C.; Xiao, S.; Wang, L. Biomass burning influences determination based on PM 2.5 chemical composition combined with fire counts at southeastern Tibetan Plateau during pre-monsoon period. Atmosp. Res. 2018, 206, 108–116. [Google Scholar] [CrossRef]
- Bonasoni, P.; Laj, P.; Marinoni, A.; Sprenger, M.; Angelini, F.; Arduini, J.; Bonafè, U.; Calzolari, F.; Colombo, T.; Decesari, S. Atmospheric Brown Clouds in the Himalayas: First two years of continuous observations at the Nepal Climate Observatory-Pyramid (5079 m). Atmosp. Chem. Phys. 2010, 10, 7515–7531. [Google Scholar] [CrossRef]
- Zhou, W.; Yang, S.; Jiang, X.; Guo, Q. Estimating planetary boundary layer height over the Tibetan Plateau using COSMIC radio occultation data. Acta Meteorol. Sin. 2018, 76, 117–133. [Google Scholar]
- Zhao, T.L.; Gong, S.L.; Huang, P.; Lavoué, D. Hemispheric transport and influence of meteorology on global aerosol climatology. Atmosp. Chem. Phys. 2012, 12, 7609–7624. [Google Scholar] [CrossRef]
- Han, Y.; Sun, H.; Liu, J.; Zhao, T.; Gong, S.L. Study on Simulated Seasonal Variations of Black Carbon Aerosol Transport and Depositions over the Tibetan Plateau. J. Arid Meteorol. 2014, 91, 22–25. [Google Scholar]
- Zhao, Z.; Cao, J.; Shen, Z.; Xu, B.; Zhu, C.; Chen, L.W.A.; Su, X.; Liu, S.; Han, Y.; Wang, G. Aerosol particles at a high-altitude site on the Southeast Tibetan Plateau, China: Implications for pollution transport from South Asia. J. Geophys. Res.-Atmosp. 2013, 118, 11360–11375. [Google Scholar] [CrossRef]
- Sang, X.; Zhang, Z.; Chan, C.; Engling, G. Source categories and contribution of biomass smoke to organic aerosol over the southeastern Tibetan Plateau. Atmos. Environ. 2013, 78, 113–123. [Google Scholar] [CrossRef]
- Guo, H.; Lei, L. Vegetation greenness trend (2000 to 2009) and the climate controls in the Qinghai-Tibetan Plateau. J. Appl. Remote Sens. 2013, 7, 3572. [Google Scholar]
- Hu, T.; Cao, J.; Zhu, C.; Zhao, Z.; Liu, S.; Zhang, D. Morphologies and elemental compositions of local biomass burning particles at urban and glacier sites in southeastern Tibetan Plateau: Results from an expedition in 2010. Sci. Total Environ. 2018, 628–629, 772–781. [Google Scholar] [CrossRef]
- Chen, P.; Kang, S.; Bai, J.; Sillanpää, M.; Li, C. Yak dung combustion aerosols in the Tibetan Plateau: Chemical characteristics and influence on the local Atmosp. Environ. Atmosp. Res. 2015, 156, 58–66. [Google Scholar] [CrossRef]
- Yang, H.; Zhang, D.; Chu, B.; Zhang, W.; Xia, P.; Yuan, R.; Chen, M.; Min, D.U.; Lei, J.I.; Chen, X. Establishment and Analysis of Atmospheric Particulate Matter Source Spectra in the Typical City of Lhasa, Qinghai-Tibetan Plateau, China. Environ. Monit. China. 2017, 33, 46–54. [Google Scholar]
- Wu, D.; Shen, K.Y.; Ge, X.L.; Xia, J.R.; Liu, G.; Li, F.Y.; Yang, M. Characteristics of water-soluble organic carbon (WSOC) in atmospheric particulate matter at northern suburb of Nanjing. China Environ. Sci. 2017, 37, 3237–3246. [Google Scholar]
- Seinfeld, J.H.; Pandis, S.N. From air pollution to climate change. Atmosp. Chem. Phys. 2006, 429–443. [Google Scholar]
- Kumar, A.; Ram, K.; Ojha, N. Variations in carbonaceous species at a high-altitude site in western India: Role of synoptic scale transport. Atmosp. Environ. 2016, 125, 371–382. [Google Scholar] [CrossRef]
- Saud, T.; Gautam, R.; Mandal, T.K.; Gadi, R.; Singh, D.P.; Sharma, S.K.; Dahiya, M.; Saxena, M. Emission estimates of organic and elemental carbon from household biomass fuel used over the Indo-Gangetic Plain (IGP), India. Atmosp. Environ. 2012, 61, 212–220. [Google Scholar] [CrossRef]
- Zhang, H.; Wang, S.; Hao, J.; Wan, L. Chemical and size characterization of particles emitted from the burning of coal and wood in rural households in Guizhou, China. Atmosp. Environ. 2012, 51, 94–99. [Google Scholar] [CrossRef]
- Bano, S.; Pervez, S.; Chow, J.C.; Matawle, J.L.; Watson, J.G.; Sahu, R.K.; Srivastava, A.; Tiwari, S.; Pervez, Y.F.; Deb, M.K. Coarse particle (PM10–2.5) source profiles for emissions from domestic cooking and industrial process in Central India. Sci. Total Environ. 2018, 627, 1137–1145. [Google Scholar] [CrossRef]
- Srinivas, B.; Rastogi, N.; Sarin, M.M.; Singh, A.; Singh, D. Mass absorption efficiency of light absorbing organic aerosols from source region of paddy-residue burning emissions in the Indo-Gangetic Plain. Atmos. Environ. 2016, 125, 360–370. [Google Scholar] [CrossRef]
- Guo, Y. Carbonaceous aerosol composition over northern China in spring 2012. Environ. Sci. Pollut. Res. Int. 2015, 22, 10839–10849. [Google Scholar] [CrossRef]
- Li, J.; Pósfai, M.; Hobbs, P.V.; Buseck, P.R. Individual aerosol particles from biomass burning in southern Africa: 2, Compositions and aging of inorganic particles. J. Geophys. Res. Atmosp. 2003, 108. [Google Scholar] [CrossRef]
- Ordou, N.; Agranovski, I.E. Mass distribution and elemental analysis of the resultant atmospheric aerosol particles generated in controlled biomass burning processes. Atmosp. Res. 2017, 198, 108–112. [Google Scholar] [CrossRef]
- Ran, L.; Lin, W.L.; Deji, Y.Z.; La, B.; Tsering, P.M.; Xu, X.B.; Wang, W. Surface gas pollutants in Lhasa, a highland city of Tibet-current levels and pollution implications. Atmosp. Chem. Phys. 2014, 14, 10721–10730. [Google Scholar] [CrossRef]


© 2019 by the authors. Licensee MDPI, Basel, Switzerland. This article is an open access article distributed under the terms and conditions of the Creative Commons Attribution (CC BY) license (http://creativecommons.org/licenses/by/4.0/).
Share and Cite
Wei, N.; Ma, C.; Liu, J.; Wang, G.; Liu, W.; Zhuoga, D.; Xiao, D.; Yao, J. Size-Segregated Characteristics of Carbonaceous Aerosols during the Monsoon and Non-Monsoon Seasons in Lhasa in the Tibetan Plateau. Atmosphere 2019, 10, 157. https://doi.org/10.3390/atmos10030157
Wei N, Ma C, Liu J, Wang G, Liu W, Zhuoga D, Xiao D, Yao J. Size-Segregated Characteristics of Carbonaceous Aerosols during the Monsoon and Non-Monsoon Seasons in Lhasa in the Tibetan Plateau. Atmosphere. 2019; 10(3):157. https://doi.org/10.3390/atmos10030157
Chicago/Turabian StyleWei, Nannan, Chulei Ma, Junwen Liu, Guanghua Wang, Wei Liu, Deqing Zhuoga, Detao Xiao, and Jian Yao. 2019. "Size-Segregated Characteristics of Carbonaceous Aerosols during the Monsoon and Non-Monsoon Seasons in Lhasa in the Tibetan Plateau" Atmosphere 10, no. 3: 157. https://doi.org/10.3390/atmos10030157
APA StyleWei, N., Ma, C., Liu, J., Wang, G., Liu, W., Zhuoga, D., Xiao, D., & Yao, J. (2019). Size-Segregated Characteristics of Carbonaceous Aerosols during the Monsoon and Non-Monsoon Seasons in Lhasa in the Tibetan Plateau. Atmosphere, 10(3), 157. https://doi.org/10.3390/atmos10030157