Article

Size-Segregated Characteristics of Carbonaceous Aerosols during the Monsoon and Non-Monsoon Seasons in Lhasa in the Tibetan Plateau

1
School of Nuclear Science and Technology, University of South China, Hengyang 421001, China
2
Department of Nuclear Reactor Engineering, Shanghai Institute of Applied Physics, Chinese Academy of Sciences, Shanghai 201800, China
3
Institute for Environmental and Climate Research, Jinan University, Guangzhou 510632, China
4
Meteorological Service Center of Tibet Autonomous Region Meteorological Bureau, Lhasa 850000, China
*
Authors to whom correspondence should be addressed.
Atmosphere 2019, 10(3), 157; https://doi.org/10.3390/atmos10030157
Submission received: 22 February 2019 / Revised: 17 March 2019 / Accepted: 20 March 2019 / Published: 24 March 2019

Abstract

:
In this paper, we intensively collected atmospheric particulate matter (PM) with different diameters (size ranges: <0.49, 0.49–0.95, 0.95–1.5, 1.5–3.0, 3.0–7.2, and >7.2 μm) in Lhasa during the monsoon and non-monsoon seasons. The results clearly showed that the concentrations of PM, organic carbon (OC), elemental carbon (EC), and water-soluble organic carbon (WSOC) during the non-monsoon season were much higher than the concentrations during the monsoon season. During the monsoon season, a bimodal size distribution of the OC and WSOC, which were at <0.49 μm and >7.2 μm, respectively, and a unimodal size distribution at <0.49 μm for the EC were observed. However, during the non-monsoon season, there was a trimodal size distribution of the OC and WSOC (<0.49 μm, 1.5–3.0 μm, and >7.2 μm), and a unimodal size distribution of the EC (<0.49 μm). Possible sources of the carbonaceous components were revealed by combining the particle size distribution and the correlation analysis. OC, EC, and WSOC were likely from the photochemical transformation of biogenic and anthropogenic VOC, and the incomplete combustion of biomass burning and fossil fuels at <0.49 μm, whilst they were also likely to be from various types of dust and biogenic aerosols at >7.2 μm. OC and WSOC at 1.5–3.0 μm were likely to have been from the burning of yak dung and photochemical formation. The above results may draw attention in the public and scientific communities to the issues of air quality in the Tibetan Plateau.

1. Introduction

Lhasa, surrounded by high mountains, is located in the east–west valley of the southern Tibetan Plateau (TP). As a highland city, the air pollution in Lhasa has the following unique characteristics [1,2,3]. The number of motor vehicles has increased rapidly (National Bureau of Statistics, NBS), while the tail gas emissions have also increased. First, urban residents mainly use gas and electricity for heating, with a low rate of coal utilization. Furthermore, in rural areas, more yak dung was used [4]. The pollution sources from residents mainly include cooking fuel, oil smoke, heating, and the burning of cypress branches and butter lamps day and night by local temples. Second, Lhasa has a fragile ecosystem and low vegetation coverage [5], indicating a poor capacity to absorb gaseous pollutants. Weather conditions with less rain and more wind easily produce a large amount of dust [6]. Therefore, the low vegetation coverage and a large amount of dust caused by the strong winds may render the atmosphere of Lhasa worse. Third, in terms of meteorological conditions, Lhasa is located on a plateau with a low oxygen content in the air (60–70% of normal conditions), which leads to a large difference in the combustion of fossil fuels and biofuels between Lhasa and the inland area [7,8,9,10]. At the same time, due to special climatic conditions (such as strong solar radiation) and different energy consumption structures (such as burning of yak dung and cypress branches), the chemical and physical properties of aerosols in Lhasa may be different compared to other cities in China.
Carbonaceous components (total carbon, TC) are one of the most important components of atmospheric aerosols, which are composed of elemental carbon (EC), organic carbon (OC), and carbonate carbon (CC) [11,12]. In general weather conditions, especially in areas far away from desert sources, CC accounts for a small proportion of the acidic atmospheric components, typically less than 5% [13,14,15]. Therefore, carbonaceous components are usually concentrated in two major components, being the OC and EC. Water-soluble organic carbon (WSOC) accounts for most of the organic aerosols (OA) in atmospheric particulates, which accounts for approximately 10% to 80% of OC in the aerosols of most areas [16,17,18,19]. Owing to its absorbency, EC is an important contributor to global warming in addition to carbon dioxide emissions [20]. In addition, as more EC is deposited in glaciers, it may accelerate glacier melting [20,21,22]. OC is traditionally thought to be light-scattering. However, recent studies have shown that the light in the short wavelength range can be absorbed by most of OC in the aerosols, which can be defined as brown carbon (BrC) [23,24]. BrC can result from many primary sources, such as biomass burning [25,26], fossil fuel burning [27], biogenic aerosols, and soil humic matters [28]. Moreover, BrC can also be from anthropogenic or biogenic secondary sources [29,30]. Only 10% to 20% of WSOC is analyzed at the molecular level, which consists of a series of chemicals [16,31]. Recent reports indicate that water-soluble humic like substances (HULIS) are the main components of WSOC, and they have strong light absorption characteristics [32,33]. In addition to directly affecting the Earth’s climatic system by scattering and absorbing solar radiation, WSOC can also change the climate indirectly by affecting cloud formation and cloud properties, such as the cloud albedo [34], or the lifetime of clouds [24,35].
Incomplete combustion of biomass and fossil fuels is the most important source of EC [21,36]. Except for the same primary sources, OC and WSOC also have different origins, that is, a series of chemical reactions of volatile organic compounds (VOCs) during transport and biogenic emissions [16,37,38]. Studying the particle size distribution of carbonaceous aerosols in atmospheric particulate matter is critical for studying the sources and their impacts on the environment. Previous studies have shown that climate forcing is very sensitive to particle size distribution, mainly because of the aging, dry deposition, and mixing state of carbonaceous aerosols [39,40]. Although studies [3,21,41,42,43,44,45,46] regarding carbonaceous aerosols have been reported in the TP, few have focused on the size-segregated characteristics of OC, EC, and WSOC. In this paper, we aimed to elucidate the characteristics of the size-segregated carbonaceous aerosols, and we discussed their links with different carbonaceous aerosol sources in combination with the correlation analysis results. In this paper, we aimed to explore the seasonal variation in the OC, EC, and WSOC size distributions, and we also evaluated their sources by using correlation analysis, air mass back trajectories, and the size distributions of the OC, EC, and WSOC.

2. Experiments

2.1. Sampling Site

To reveal the concentration distribution characteristics of size-segregated aerosols in Lhasa (29°39′ N, 91°08′ E), six sizes (<0.49, 0.49–0.95, 0.95–1.5, 1.5–3.0, 3.0–7.2, and >7.2 μm) of particulate matter samples were collected from August to September (monsoon), and from November to December (non-monsoon) during 2014 (as detailed in Table S1) using an M235 sampler (STAPLEX Inc. make, USA. Flow rate: 1.13 m3/min). Meteorological factors, such as wind speed (WS), humidity (RH), and temperature (TEMP), as well as gaseous pollutants (SO2, NO2, CO, and O3) are shown in Figures S1–S3. The samples were collected at the top of a six-story building for the Tibet Autonomous Region Meteorological Bureau, about 18 m above the ground, at an altitude of 3679 m. The sampling site was close to the old city. In order to better evaluate the sources of OC, EC, and WSOC, a series of representative emission sources have been mapped out in Figure 1.
By referring to the recommendations of the National Ambient Air Quality Standards (NAAQS) for the sampling process of atmospheric particulate matter, the quality assurance and quality control measures for the particulate sampling were as follows: (1) A field blank was considered in this study. The blank sample was processed and stored in the same way as the collected atmospheric particulate samples, and the average field blank was deducted from the samples when the samples were analyzed. (2) Before and after sampling, a filter was placed in a chamber under controlled temperature and humidity for 48 hours to eliminate the effects of environmental factors on the particle quality. (3) Before and after weighing, the static electricity was removed from the filter using a static electricity meter to eliminate the quality error caused by the static electricity.

2.2. Organic Carbon (OC), Elemental Carbon (EC), and Water-Soluble Organic Carbon (WSOC)Analyses

Prior to the analysis, the samples in the filter were acidified using 12 M hydrochloric acid in a desiccator for 24 h to remove any potential interference from the CC, and then they were dried at 60 °C for 1 h. To simultaneously analyze the OC, EC, and WSOC using the same filter, a punch with an area of 0.4755 cm2 was placed in 100 mL of ultrapure water (18.2 MΩ), and it was allowed to stand for 12 h as described in Reference [47]. The filtered filter was dried in a desiccator and then wrapped in aluminum foil. The carbon components on this filter included WINSOC (water-insoluble organic carbon) and EC. WSOC was deduced from the subtraction of TC (without the water-extraction treatment) and TC (with the water-extraction treatment). The concentration of the OC was the sum of the concentrations of the WINOC and WSOC.
Samples were analyzed for OC, EC, and TC using the thermal/optical carbon aerosol analyzer (DRI Model 2001A, Desert Research Institute, USA) and the IMPROVE-A thermal/optical reflectance (TOR) protocol, as in Reference [48]. Duplicate punches were analyzed to eliminate the influence from the non-uniform depositions on the filter, especially the coarse particles. Then, 20% of the samples were randomly selected for repeatability testing, with relative standard deviations of 10.5% and 6.2% for the OC and EC, respectively. Additionally, all of the OC and EC data reported in this study were corrected by the field blanks.

2.3. Water-Soluble Ion Analysis

The concentrations of water-soluble ion (K+, SO42−, NO3, NH4+, and Ca2+) were determined with an ion chromatograph (ICS-2100, DIONEX, USA) using the analytical method as described in Reference [49]. A punch was placed in a 10 mL colorimetric tube, and 10 mL of ultrapure water was added to the tube. An ultrasonic machine was used to shake the 10 mL tube containing the samples for 30 min. The samples were then transferred to a 50 mL colorimetric tube through a 0.45 μm micropore filter. During the transfer process, the filter membrane and the colorimetric tube were immersed several times. The overall uncertainty was less than 5% for the analysis of each ion. In addition, the field blank levels were averaged and then subtracted from the samples.
The detection limits of NO3, SO42−, NH4+, K+, and Ca2+ were 0.002, 0.004, 0.001, 0.001, and 0.004 μg m−3, respectively. The standard curve was linear because the fitting degree (R2) of the standard curve was 0.999. After every 10 samples, a random replicate check was performed, and the relative standard deviation (RSD) of each ion was less than 5% for the reproducibility test. The test results of the standard material (GSBZ 50008–88, 200835) showed that the recoveries ranged from 91.8% to 95.9%, and the coefficient variation of recovery was between 2.21% and 3.04%. The averaged concentrations of NO3, SO42−, K+, and Ca2+ in the field blank sample were 0.005, 0.006, 0.001, and 0.006 μg m−3, respectively, while NH4+ was undetectable in these samples.

2.4. Back Trajectory Interpretation

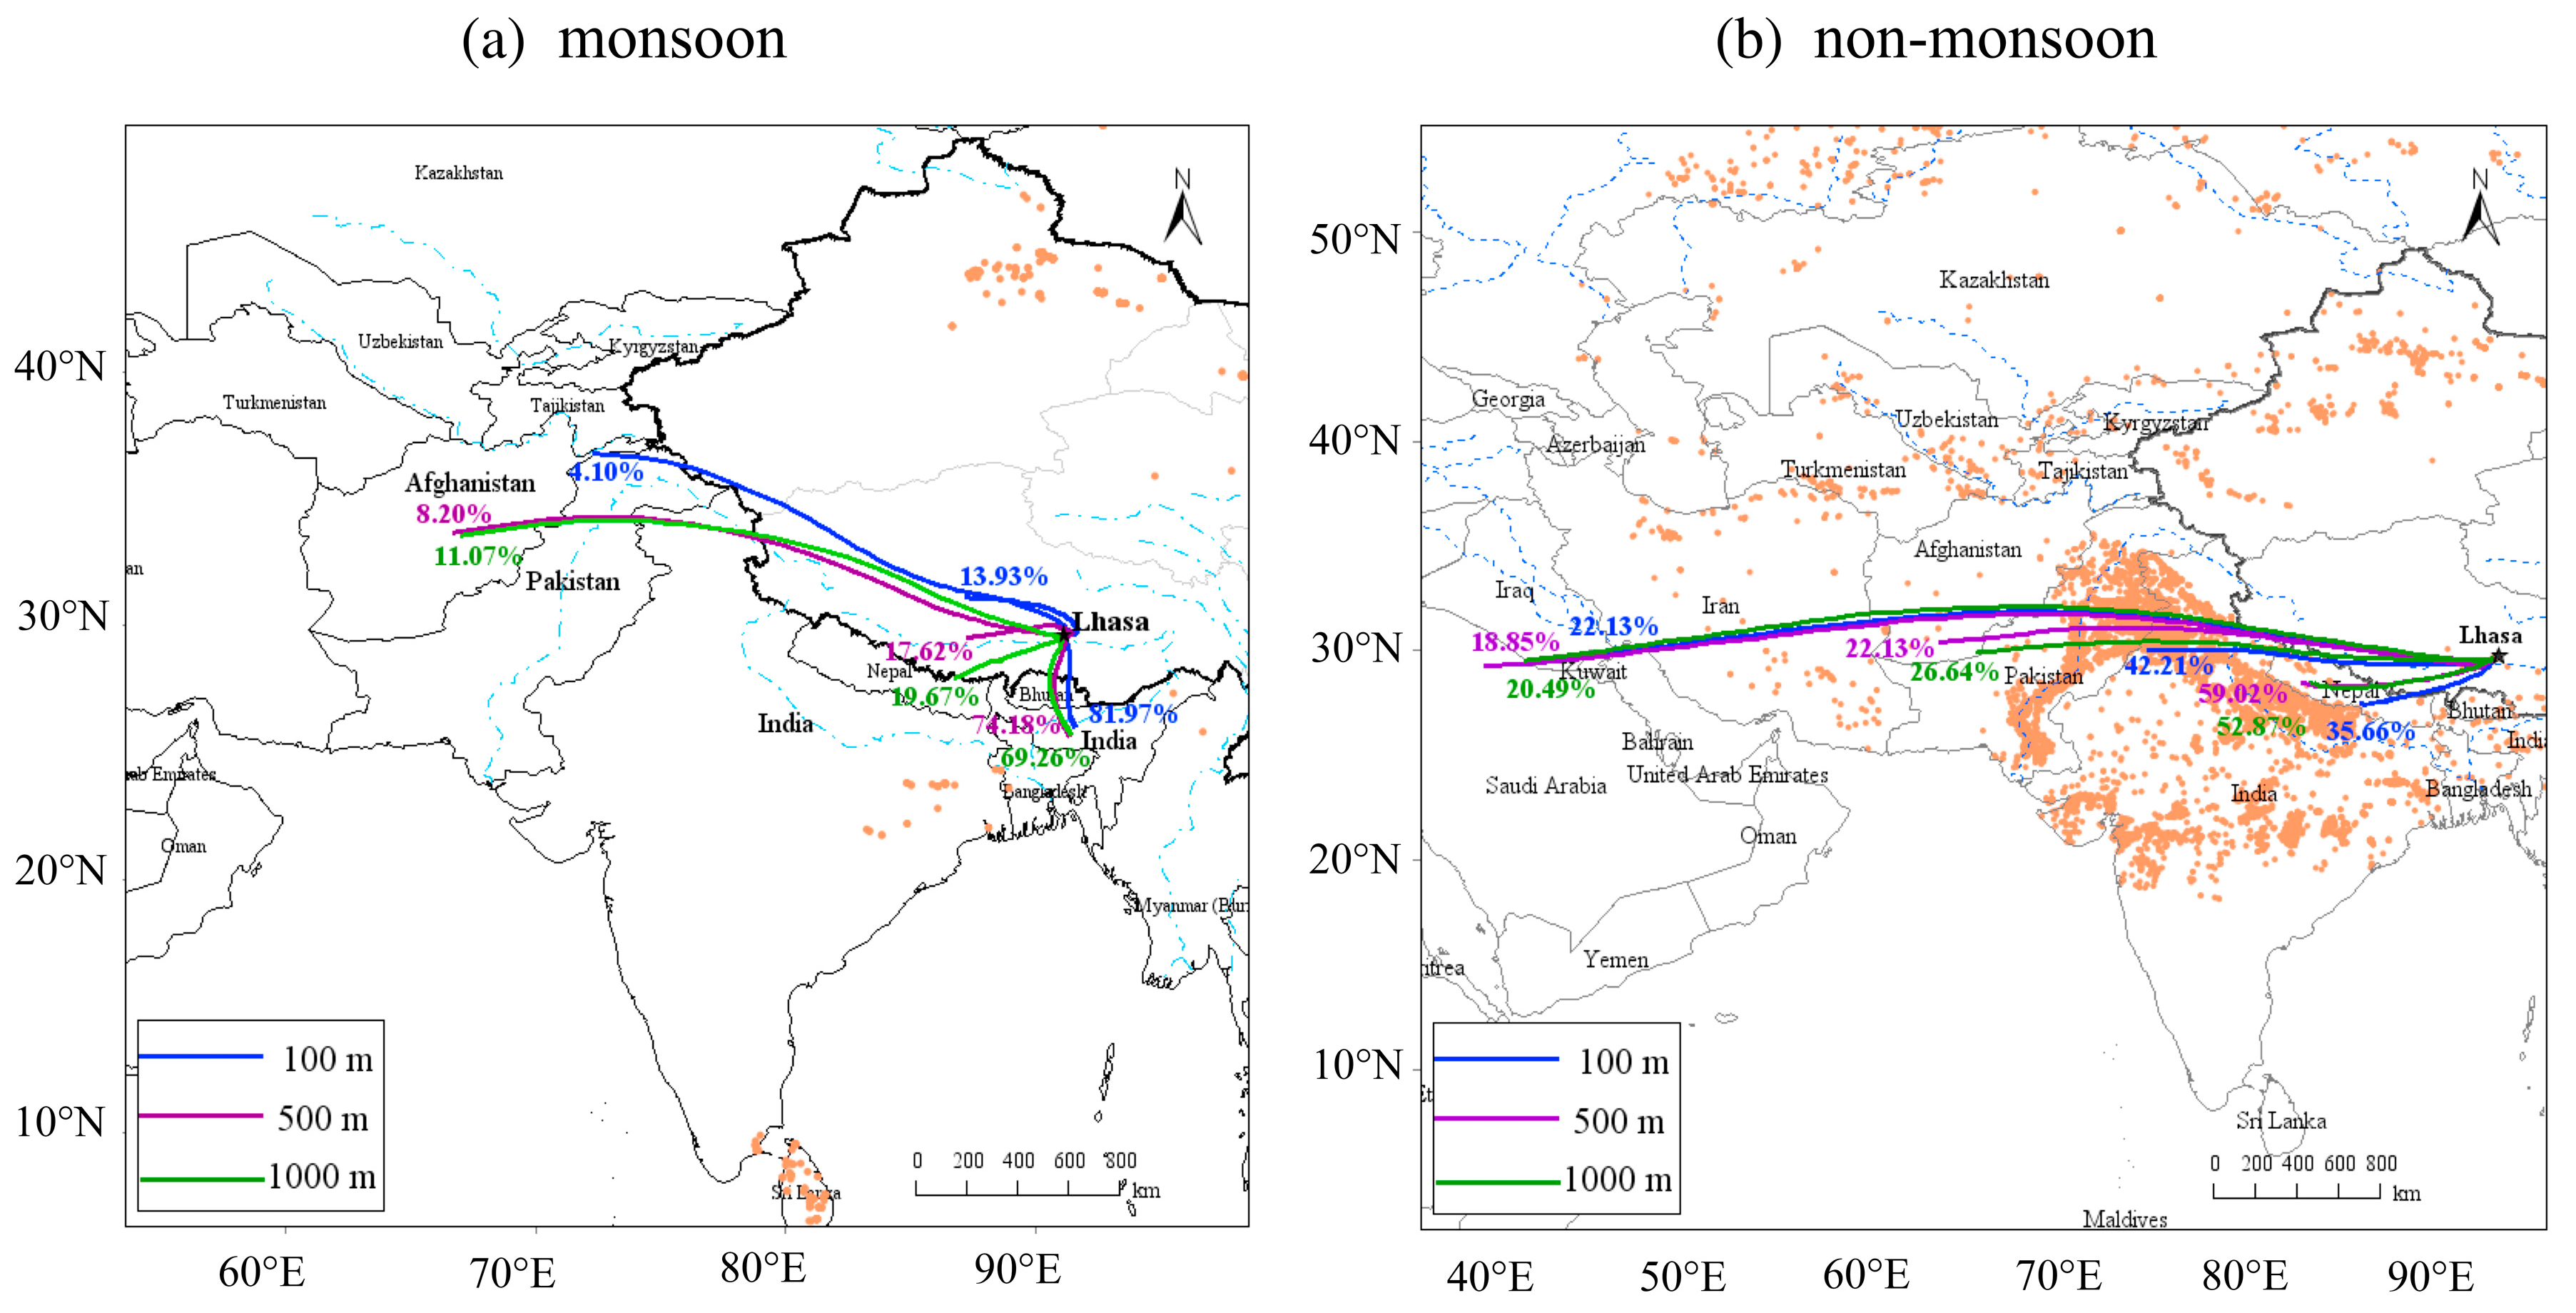
In order to study the transportation process of the air mass arriving in Lhasa, the three-day backward trajectory was calculated using the HYSPLIT model, as in References [45,50,51,52], and the global data assimilation system (GDAS) data for every day in August, September, November, and December. The daily drawings started at 00:00, 06:00, 12:00, and 18:00. Considering the typical atmospheric boundary layer height of the TP [53], the height of the air mass during modeling was set to 100, 500, and 1000 m above ground level, as in Reference [4]. The backward trajectories with fire point information in Figure 2 calculated the three average values of different heights. All the backward trajectory data are presented in Figure S4. These backward trajectories clearly indicated the transport of air masses from different areas.
During the monsoon season, it can be seen from Figure 2 that in the backward trajectory of different heights, the regional source affecting the air quality of Lhasa mainly emanated from a lower altitude near the south. The air mass from the northern plain of India accounted for the highest proportions at 81.97% (100 m AGL), 74.18% (500 m AGL), and 69.26% (1000 m AGL). Furthermore, the air mass from the south side of the TP accounted for 13.93% (100 m AGL), 17.62% (500 m AGL), and 19.67% (1000 m AGL). The above clusters were regional air masses. Moreover, the remaining air masses were from the western part of the TP, representing a long-range transport of air mass. Therefore, during the monsoon season, the air quality of Lhasa is largely affected by the regional air masses from the northern plain of India.
During the non-monsoon season, the external sources affecting the air quality in Lhasa are mainly from the western part of the TP. The air masses flow around the southern rim of the plateau through the southern branch of the westerlies, and they reach the southern part of the TP, which in turn affects the air quality of Lhasa. It could be seen that more than half of the air masses that arrived in Lhasa during the non-monsoon season came from the South Asian subcontinent, such as India with 35.66% (100 m AGL), 59.66% (500 m AGL), and 59.02% (1000 m AGL), respectively, and Pakistan with 42.21% (100 m AGL), 22.13% (500 m AGL), and 22.13% (1000 m AGL), respectively. The remaining air masses came from western and southwestern Asia, such as Iran and Iraq. The above clusters were long-range transports of air mass. Studies have shown that atmospheric aerosol transport can be divided into atmospheric boundary layer transport and free troposphere transport. Compared with the significant regional characteristics of the atmospheric boundary layer transport, the free troposphere transport is more effective for long-range aerosol transport [54]. The westerly jets over midlatitude Eurasia direct the aerosols of the free troposphere from the European source area to the TP for long-distance transport, and they maintain the direction from west to east throughout the year [55].
Forest fires, especially man-made fires in South and Southeast Asia, are the two major sources of biomass burning in the world. The emissions of atmospheric particulate matter are very strong in South and Southeast Asia during the non-monsoon season [52,56]. Studies show that the monthly fire point is significantly correlated with the monthly variation in the water-soluble K+ concentration, which largely represents the contribution of biomass burning [57]. Therefore, during the non-monsoon season, the air quality of Lhasa is mainly affected by the long-range transport of air mass from the western part of the TP.

3. Results and Discussion

3.1. Concentrations of Size-Segregated Particulate Matter (PM) Samples

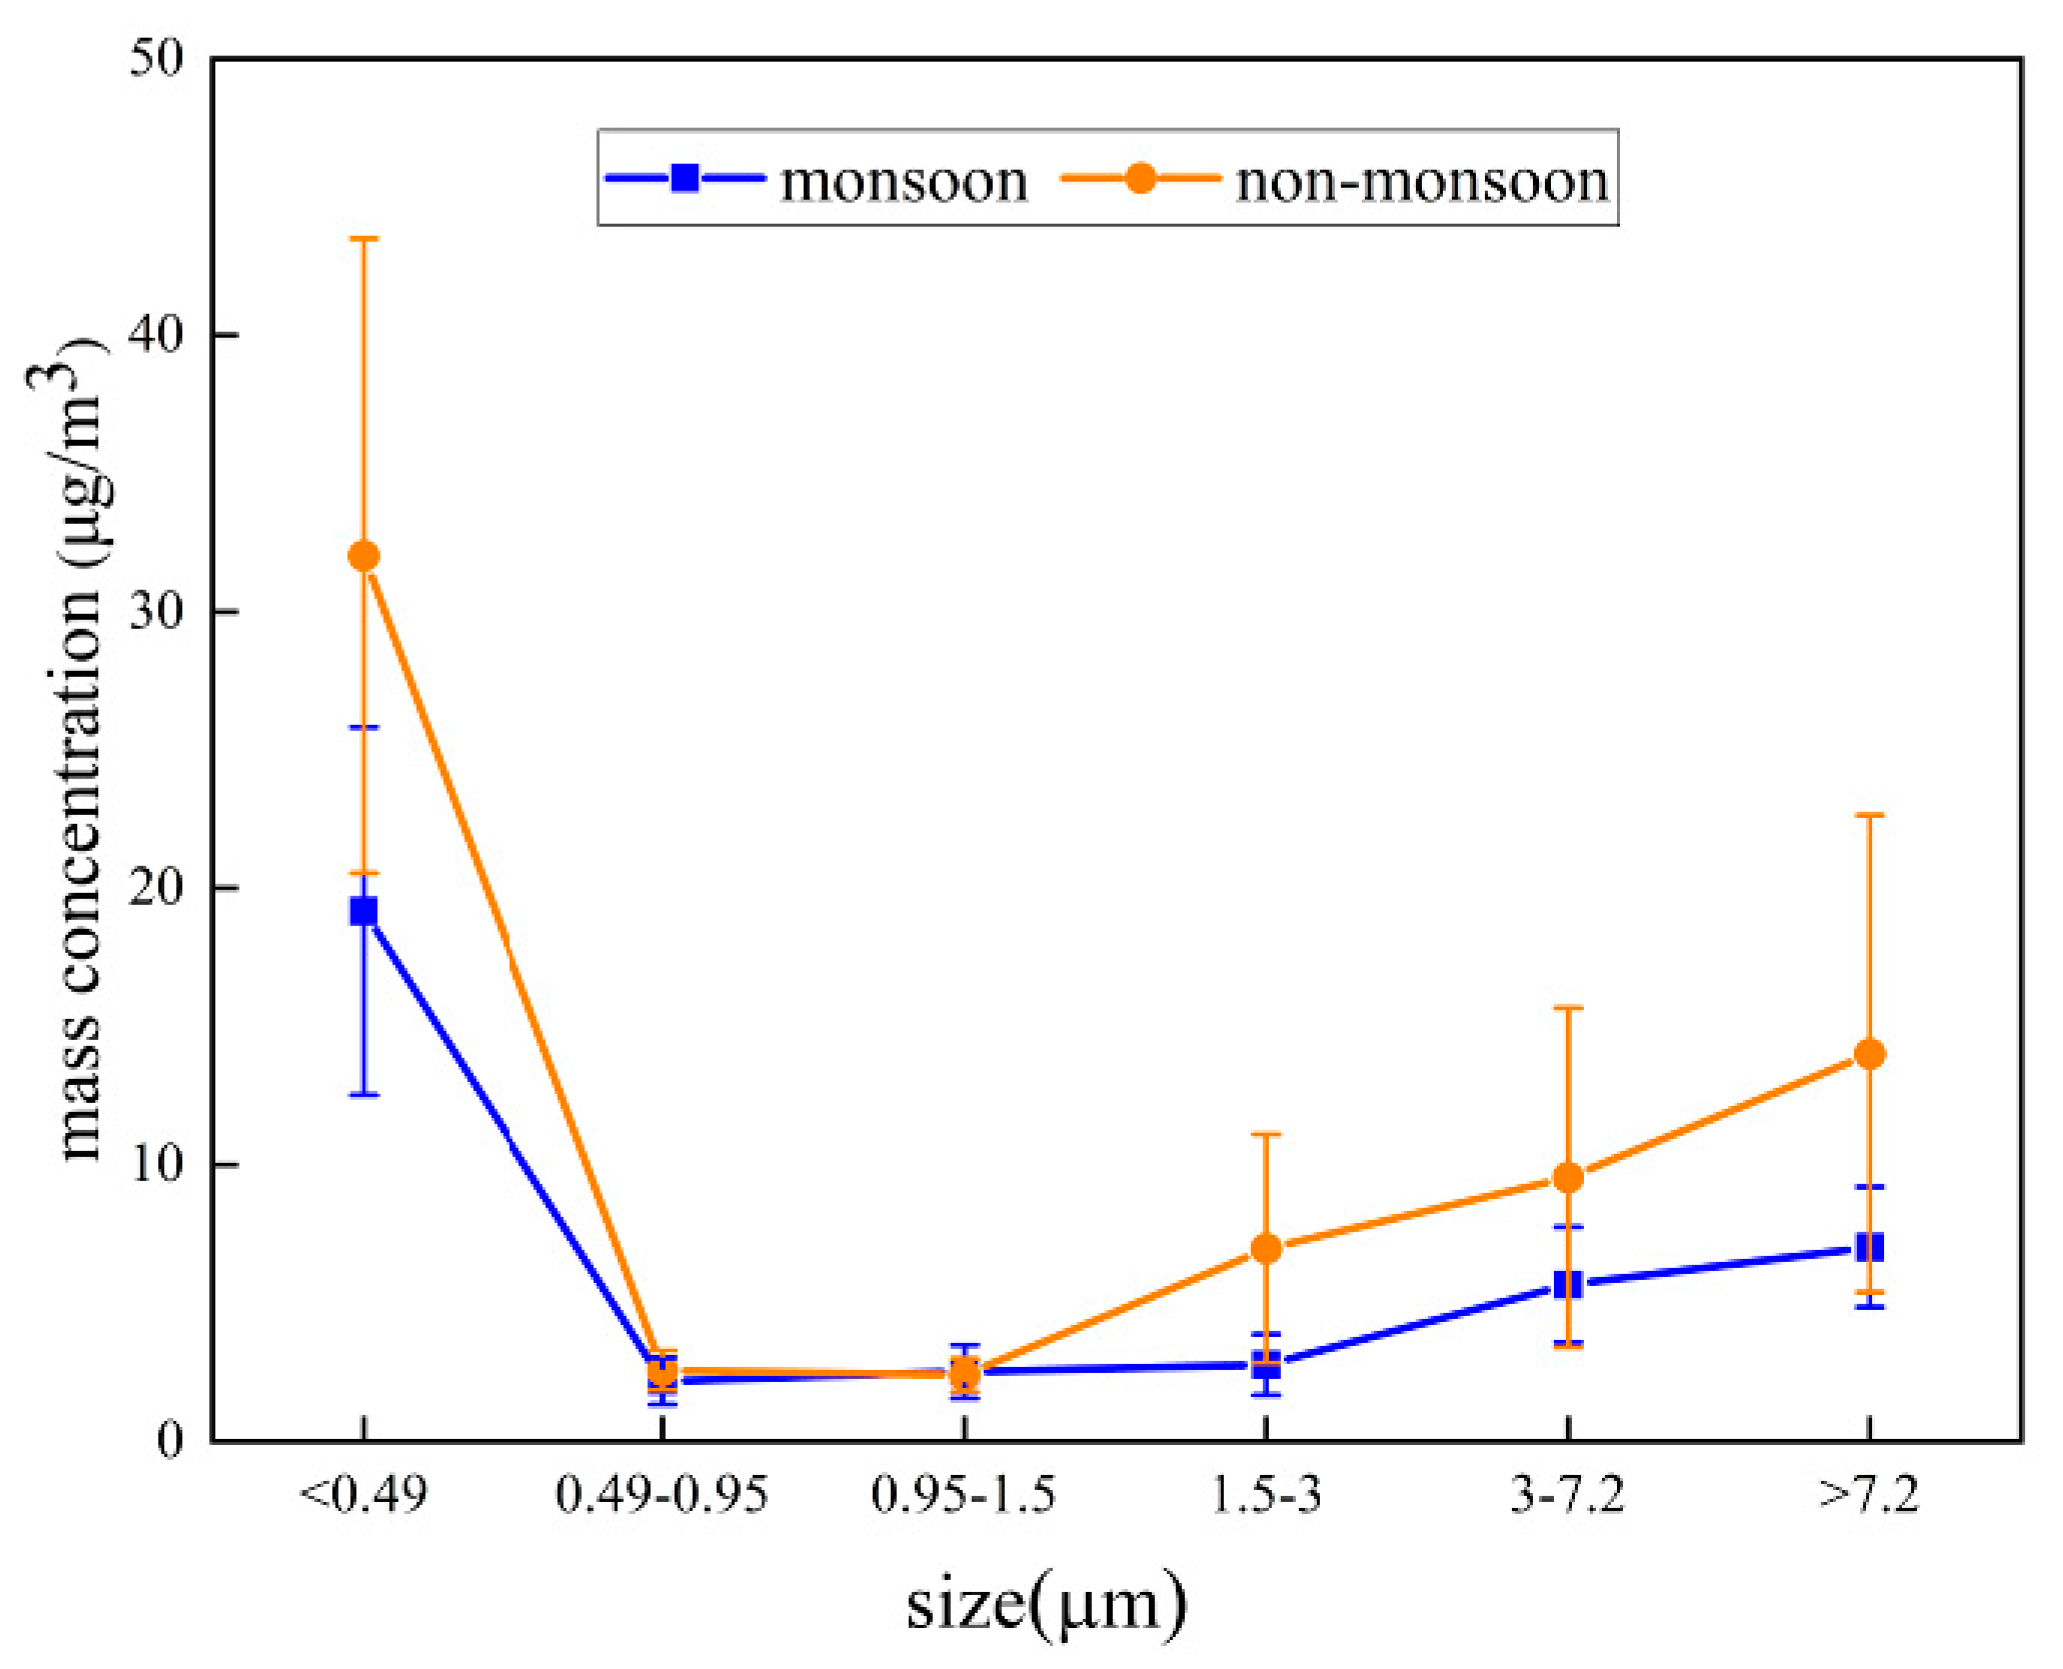
The aerosol mass distribution showed two maxima at PM<0.49 and PM>7.2 during the sampling period (Figure 3). Mass concentrations of the size-segregated aerosols during the non-monsoon season were higher than those during the monsoon season, except PM0.49–0.95 and PM0.95–1.5 (Figure 3 and Table S2). During the non-monsoon season, the additional incomplete combustion of biomass and fossil fuels was responsible for the higher concentrations of PM<0.49 and PM1.5–3, compared to the concentrations during the monsoon season with high heavy precipitation, as will be discussed later with reference to the correlation analysis. The possible reason why the PM3–7.2 and PM>7.2 showed higher concentrations during the non-monsoon season is that there was more dust from less vegetation and stronger winds during this season. Additionally, according to Figure S2, more precipitation during the monsoon season than during the non-monsoon season may also be one of the reasons why the mass concentrations of size-segregated aerosols during the non-monsoon season are higher than the concentrations during the monsoon season.

3.2. Temporal Variations of the OC, EC, and WSOC Mass Concentrations

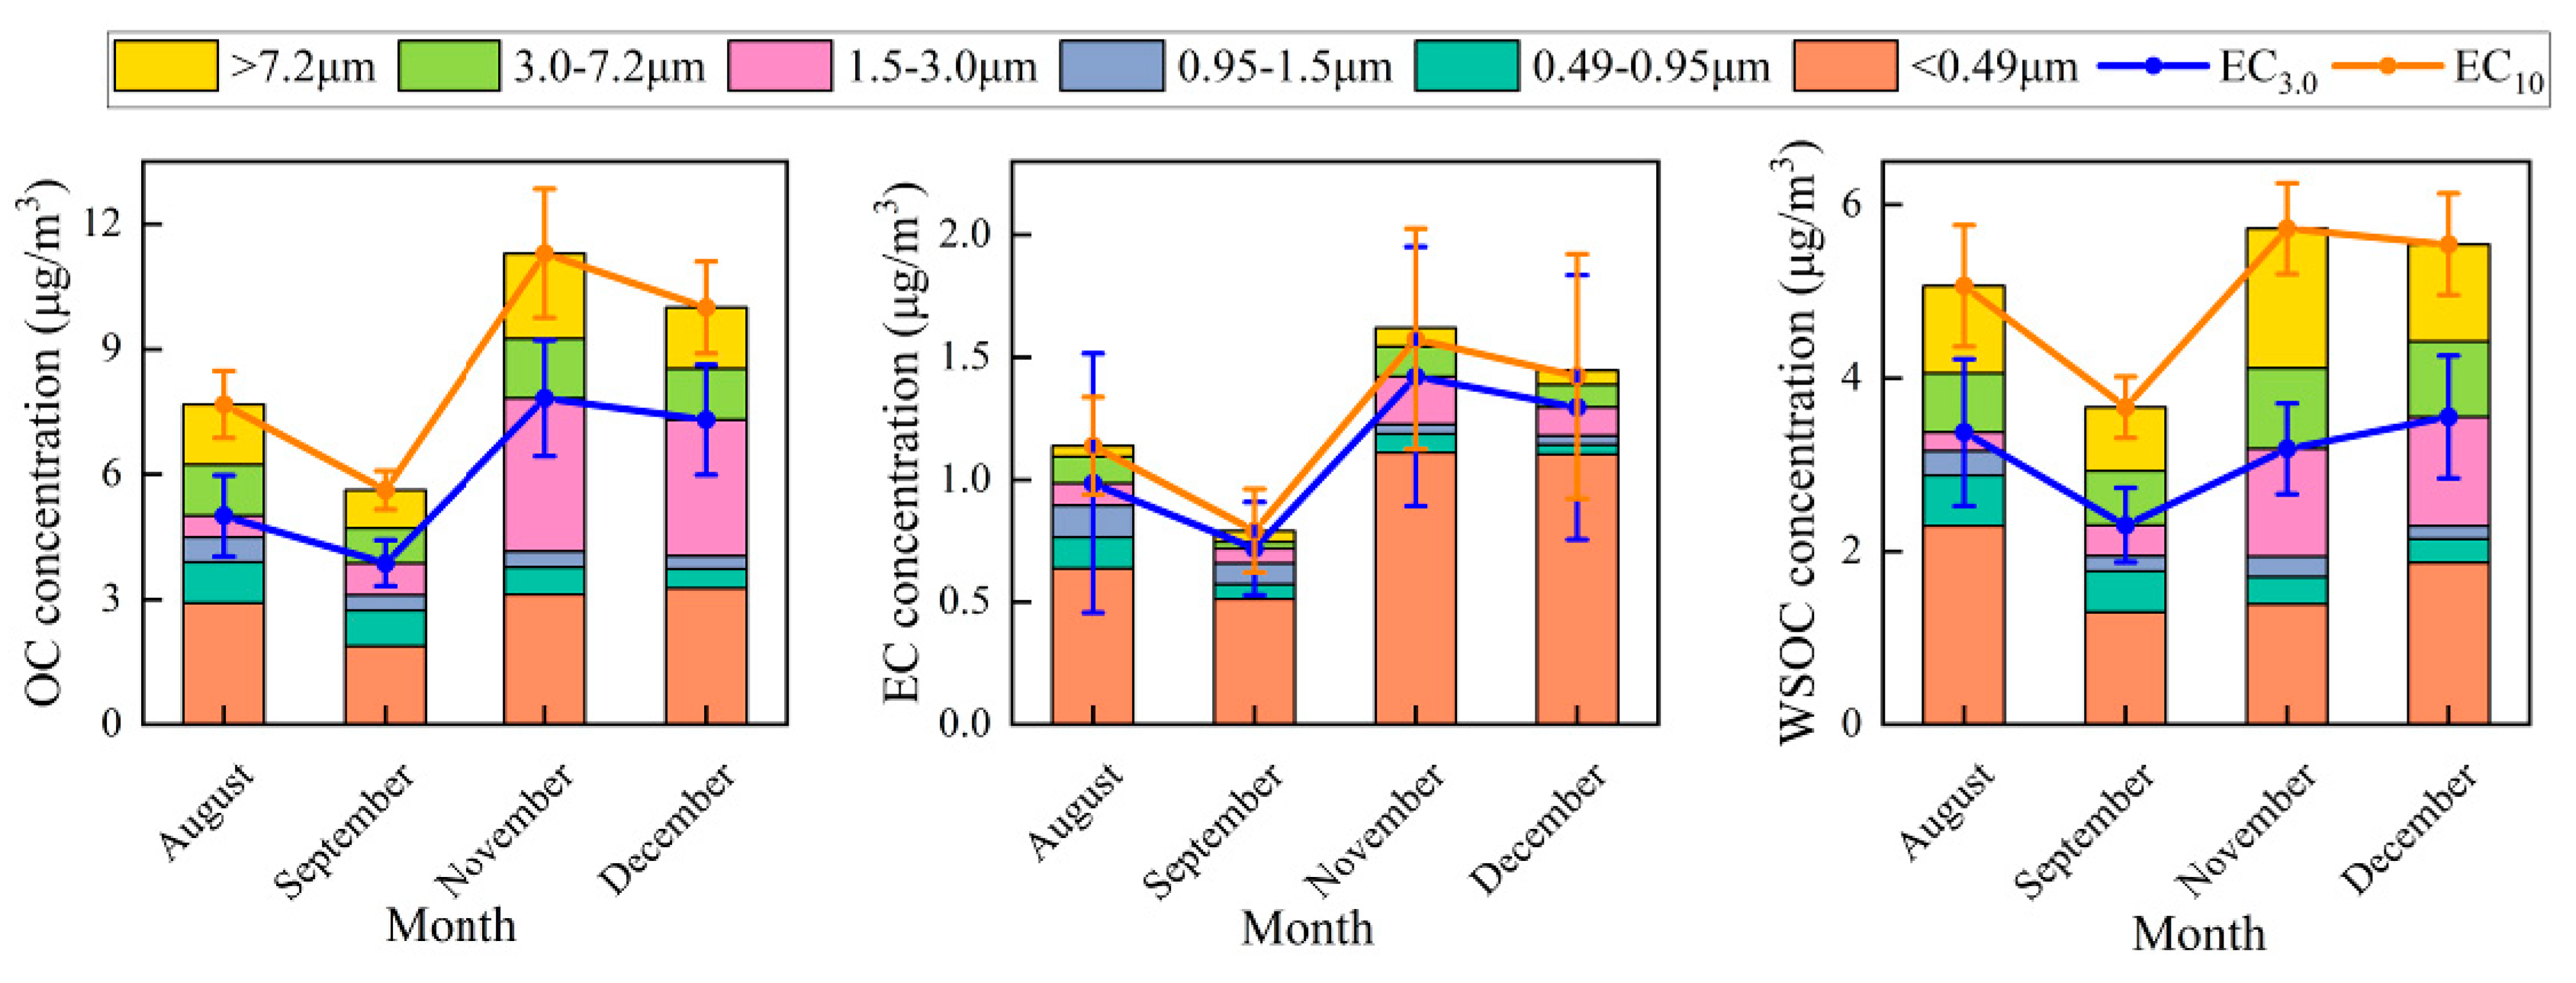
The temporal variability in the mass concentrations of the OC, EC, and WSOC is presented in Figure 4. OC3.0 represented the total concentration of these components within the <0.49 μm, 0.49–0.95 μm, 0.95–1.5 μm, and 1.5–3.0 μm samples, while OC10 represented the total concentration of these components in all the size samples. Throughout the observation period, the OC, EC, and WSOC showed similar varying tendencies, with the highest mass concentrations occurring during the non-monsoon season, followed by that during the monsoon season. The preliminary analysis suggested that the phenomenon was an interaction between local and remote sources. For the non-monsoon season, due to the temperature reduction and the lack of heat supply in Lhasa, there was a great increase in the demand for thermal energy. On the TP, more than 90% of the forests are widely distributed in the southeastern part of the TP and on the northern slopes of the Himalayas [58]. Therefore, almost all of the energy needed for heating and cooking in the area comes from firewood [59]. Animal waste, such as yak dung, is the predominant energy source in the urban and rural regions of the central TP, including Lhasa [60]. Therefore, in addition to the long-term operation of heating boilers and residential household stoves, the contributions of the large amounts of biomass and fossil fuel will also have a significant impact on the concentration levels. Another reason may be due to the topographic inversion. Lhasa is located in the Lhasa River Valley Plain and it is surrounded by mountains. Given the temperature drop, the cooling action on the slope is faster than in the valley, causing the mountain breeze to sink and resulting in the accumulation of pollutants [45]. Moreover, the polluted air masses from Western Europe, Pakistan, and the northern Indian plain will also increase the concentration of atmospheric particulate matter in Lhasa. The survey found that the iron ore production in Tibet during the period from November to December 2014 was 227,800 tons (National Bureau of Statistics, NBS), which accounted for 90% of the annual mining volume. Mineral dust from large-scale mining during the non-monsoon season also affects the OC, EC, and WSOC concentrations in Lhasa [3,61].
On a monthly scale, except for the individual data, the OC, EC, and WSOC concentrations of PM3 and PM10 in August were greater than the concentrations in September (Figure 4). A grand religious festival called the Sho Dun Festival was held in Lhasa in mid-August, which attracted a large number of tourists. Therefore, burning cypress branches and emissions of motor vehicle exhaust were the important factors affecting the high concentration of atmospheric particulates in August. In addition to the EC, the concentrations of OC and WSOC in November were higher than in December because of the snowfall during the sampling period from December 14 to 17. Research has indicated that the removal efficiency of water-soluble organic carbon in the atmospheric particulates through winter precipitation was as high as 48.5%, with the removal efficiency through snowfall being much higher than that by precipitation. However, no research has shown that snowfall has a significant removal efficiency for EC [62].

3.3. OC, EC, and WSOC Mass Concentrations of Size-Segregated Aerosols

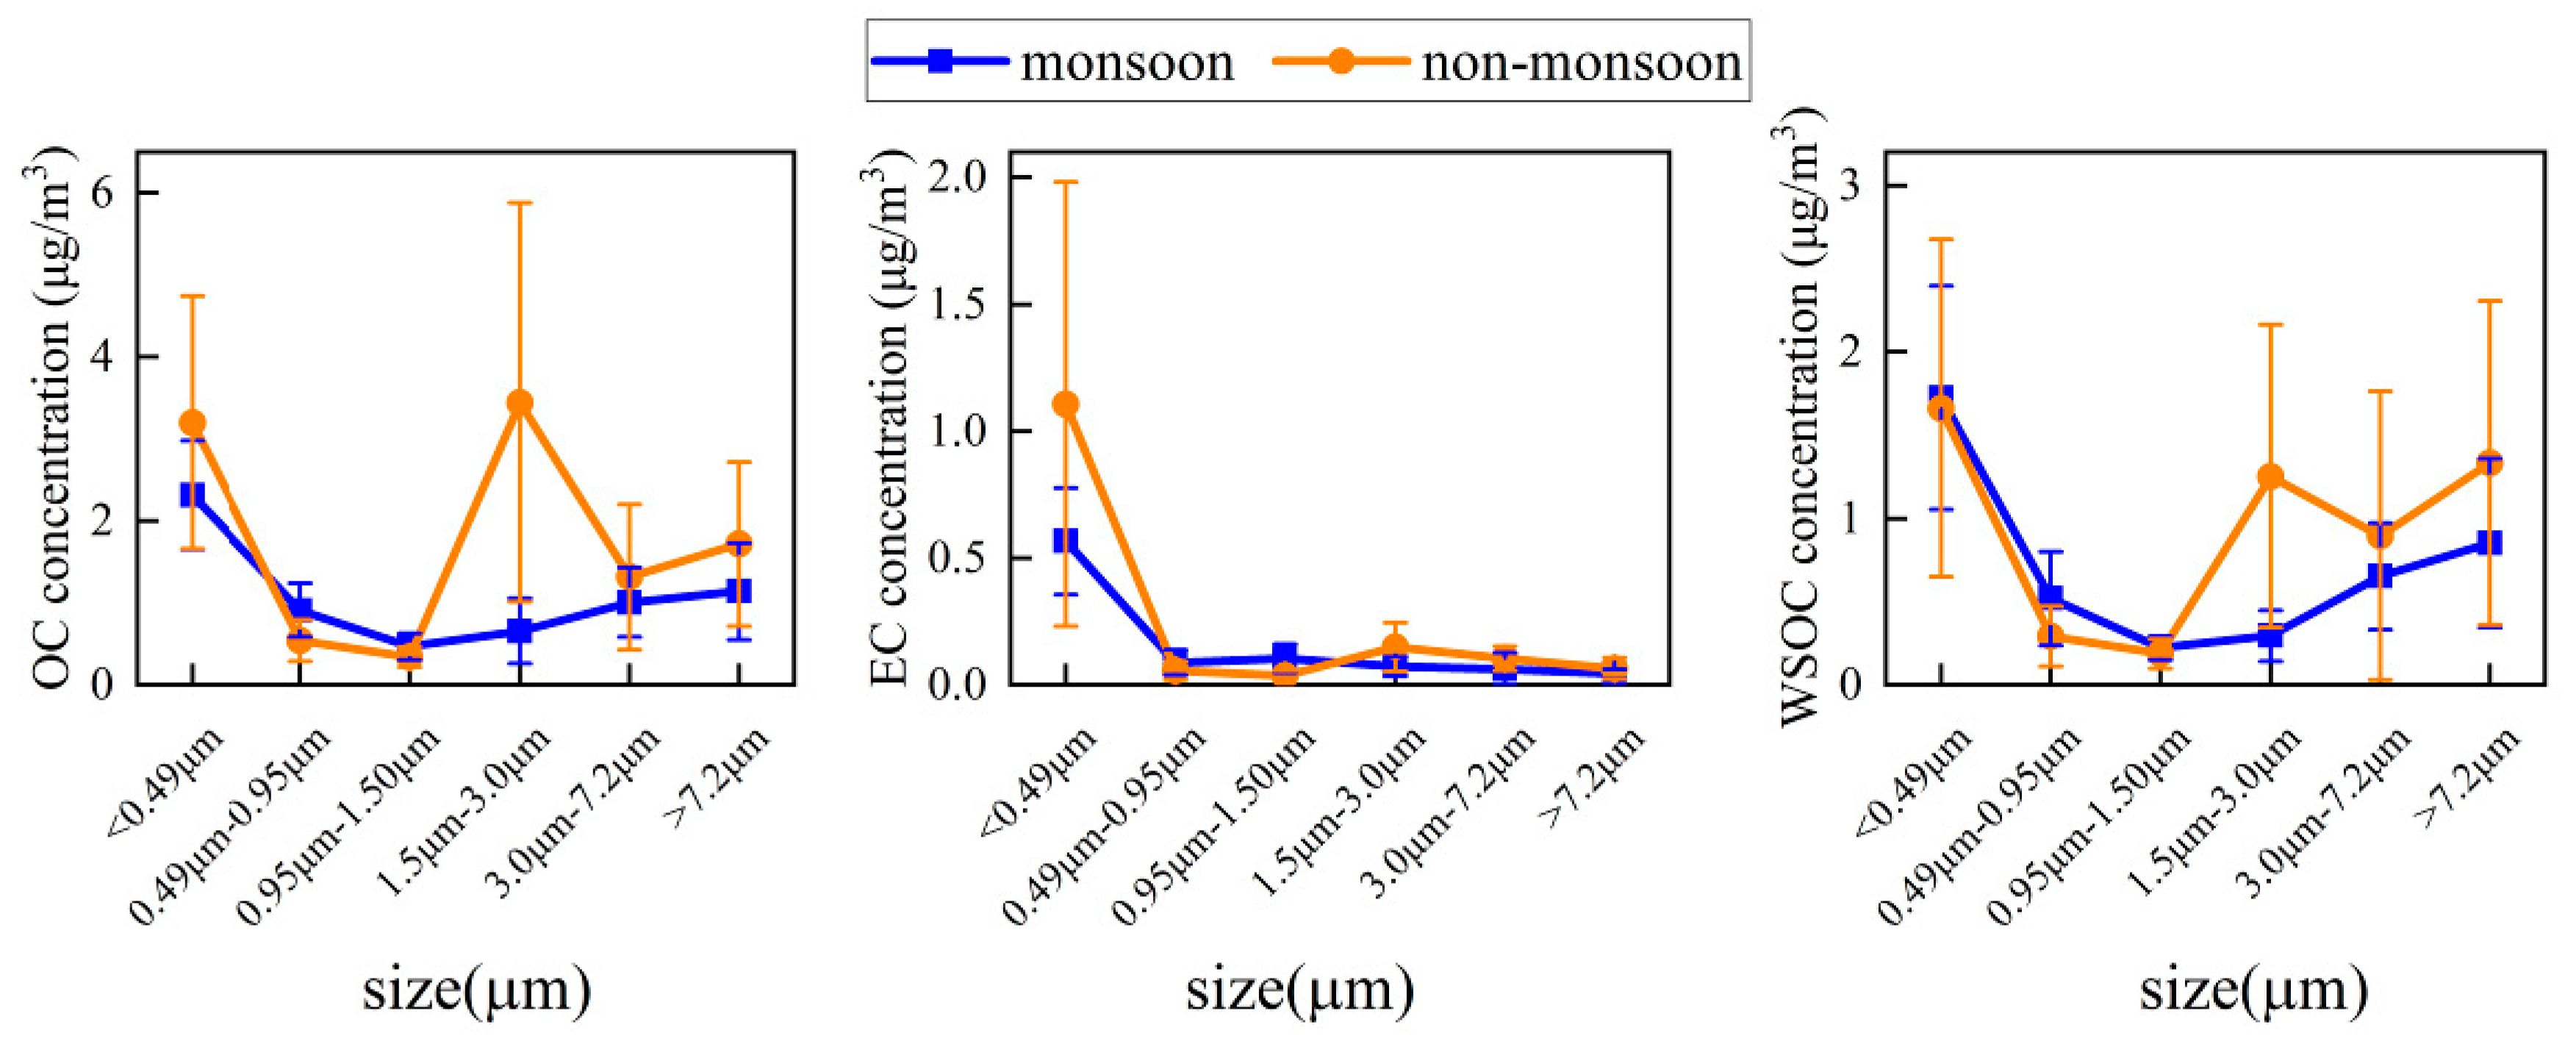
During the monsoon season, Figure 5 and Table S3 showed that there was a bimodal size distribution for the OC and WSOC, which were at <0.49 μm and >7.2 μm, respectively, as well as a unimodal size distribution at <0.49 μm for the EC. Yang et al. [61] showed that the main biomass burning sources in Lhasa were yak dung and pine and cypress branches. Among them, the OC content of pine and cypress branches was 60.42%, and the particles generated by combustion were more than 90% concentrated in the fine mode. In the coarse mode of the OC and WSOC, the peaks may come from industrial dust such as cement [61] and soil dust [3], and biogenic aerosols such as algae, pollen, vegetation debris, viruses, and microorganisms [63]. Specifically for the EC, the incomplete combustion of biomass and fossil fuel is also an important cause of peaks <0.49 μm [21,36].
During the non-monsoon season, there was a trimodal size distribution for the OC and WSOC (<0.49 μm, 1.5–3.0 μm, and >7.2μm), and a unimodal size distribution for the EC (<0.49 μm). The cause of the particle sizes (<0.49 μm and >7.2μm) related to almost the same reasons as that occurring during the monsoon season. OC and WSOC at 1.5–3.0 μm may have been from the burning of yak dung and the photochemical formation. The specific reasons will be explained in the following sections.
Additionally, similar peaks in the fine and coarse modes were reported in the size-segregated aerosols from other studies on Lhasa [3]. In all four seasons studied, the EC showed dominant peaks at 0.43–0.65 μm, and the OC showed typical bimodal distributions at 0.43–0.65 μm and 5.8–9.0 μm. However, the particle size distribution of the WSOC in Lhasa was not discussed in that previous study.

3.4. Analysis of OC, EC and WSOC Sources

3.4.1. Relationships among the Different Carbonaceous Aerosols

The origins of carbonaceous aerosols can be better understood by analyzing the correlation between the OC and EC [64]. The correlation between the OC and EC is shown in Figure S5. In general, for fine mode particles, the OC and EC have similar sources because of the significant correlation between the OC and EC (0.67 at <0.49 μm, 0.55 at 0.95–1.5 μm, and 0.62 at 1.5–3.0 μm), indicating that they come from related sources or are transported to the site together. However, the correlation between the OC and EC in the coarse mode is poor (0.31 at 3.0–7.0 μm and 0.02 at >7.2 μm), which indicates that the source of the OC in the coarse mode is more complicated.
The ratio of OC/EC is an important indicator for determining the type and source of the carbonaceous aerosols [64]. For fine particles, Chen et al. [60] analyzed the fresh yak dung samples collected from the Nam Co region of the TP and found that OC accounted for 58.83% of the PM2.5, with a ratio of OC/EC as high as 16.3 ± 4.4. Saud et al. [65] analyzed dried yak dung cakes, as well as branches and crop residues collected from the Indo-Gangetic Plain, and found that their corresponding OC/EC ratios were 8.92 (dried dung cakes), 3.23 (fuel wood), and 3.46 (crop residues). Zhang et al. [66] reported an OC/EC ratio of 7.6 for coal combustion. For coarse particles, the atmospheric particulate matter produced by cement production has a value of 31.99 for the OC/EC ratio in the coarse mode [67]. In the present study, the OC/EC ratios of the size-segregated particles are shown in Table S4. For the fine mode particles, these high OC/EC ratios at 0.49–3.0 μm may have been caused by biomass burning [68], fossil fuel combustion [69], long-range transport, and SOA formation on account of the strong solar radiation on the TP through a photochemical reaction [21]. However, at <0.49 μm, more fossil fuel combustion led to lower values of the OC/EC ratio, as extra EC was released. Higher OC/EC ratios in the coarse mode may have been due to relatively lower EC concentrations and higher OC concentrations arising from the uptake of gas species and biogenic aerosols [63]. Another cause may have been from the industrial dust of cement plants [61]. Moreover, the OC/EC ratio also showed seasonal changes in the PM3, expressed as the ratio of OC/EC during the monsoon season, which was lower than that during the non-monsoon season, indicating the favorable removal of aerosols, sources of which were biomass burning (with high OC/EC ratios) and volatile organic compounds (the main precursor of SOC), from the atmosphere during the monsoon season through heavy precipitation. This may have indicated that the carbonaceous particle contamination in Lhasa was greatly affected by the local emission sources during the sampling period, while the long-distance transport may have had a lesser impact than the local source emission [46]. However, the source of the contaminant, represented by the value of the OC/EC ratio for each particle size segment, could not be determined accurately in this study owing to the lack of detailed source spectrum information.
Relative to the OC, the concentration of the WSOC could generally be used as an indicator to analyze whether an organic aerosol was primary or secondary, since secondary organics are generally more soluble in water than the primary organics [48]. The average WSOC/OC ratios in Lhasa were 0.60 ± 0.20 and 0.53 ± 0.18 during the monsoon and non-monsoon seasons, respectively. According to backward trajectory-assisted analysis, the relatively higher WSOC/OC ratio during the monsoon season may have been due to the increase in the SOA formed during the transport of the air masses in the northern plain of India. Furthermore, during both the sampling periods, the WSOC concentration had a significantly positive correlation with the OC (Figure S6). However, an excellent correlation between the WSOC and OC was observed for the monsoon samples (R2 = 0.86) compared to correlation for the non-monsoon samples (R2 = 0.73). The numerical difference in the correlation could be attributed to changes in the characteristics of the source and the effects of the remote aerosol delivery process.

3.4.2. The Implications from Key Water-Soluble Ions

K+ is commonly used as a tracer for biomass combustion [70,71]. It has been reported that K+ and Ca2+ in Lhasa are from soil sand, road dust, construction dust, and mining dust [61].
The correlation between OC and K+ in different particle sizes of Lhasa was analyzed. The results are shown in Figure S7, with 0.84 at <0.49 μm, 0.64 at 0.49–0.95 μm, 0.32 at 0.95–1.5 μm, 0.99 at 1.5–3.0 μm, 0.74 at 3.0–7.2 μm, and 0.80 at >7.2 μm. It can be seen that OC and K+ were strongly correlated in other particle sizes, except between 0.95 and 1.5 μm.
It has reported that the particles produced by burning pine and cypress branches occur mostly in the fine mode [71], with 54% at <0.5 μm and 22% at 0.5–0.96 μm, respectively. In order to verify that the particulate generated by coal combustion [3] and vehicular exhaust [72] mainly exists at <0.49 μm, the correlations between the OC and SO42− (NO3) at <0.49 μm were plotted (Figure S8). OC had significant correlations with SO42− (0.59) and NO3 (0.75) at <0.49 μm, respectively. Therefore, the high OC concentrations in the fine mode were more likely to occur due to the incomplete combustion of biomass (<0.95 μm) and fossil fuels (<0.49 μm).
An excellent correlation of 1.5–3.0 μm during the non-monsoon season was more likely from the burning of yak dung in Lhasa, as explained below. Higher concentrations of NH4+ and SO42− appeared in the particles from yak dung burning [61]. As can be seen from Figure S9, NH4+ and SO42− showed a strong correlation of 0.78 only at 1.5–3.0 μm. WSOC and OC had significant correlations with NH4+ (0.91, 0.90) and SO42− (0.63, 0.59) at 1.5–3.0μm, respectively (Figure S10). Therefore, the high OC and WSOC concentrations at 1.5–3.0 μm during the non-monsoon season were more likely to occur from yak dung burning.
To better explain the origin of OC in the coarse particle size, the correlation between K+ and Ca2+ was analyzed (Figure S11). They showed a strong correlation with each other, 0.86 at 3.0–7.2 μm and 0.82 at >7.2 μm, respectively. Therefore, the high OC concentrations with coarse particle size were more likely from various types of dust, such as soil dust and industrial dust.

4. Conclusions

The present study reports the measurements of size-segregated particulate matter mass concentrations, as well as carbonaceous aerosol (OC, EC, and WSOC) concentrations, in Lhasa during the monsoon season (August to September) and non-monsoon season (November to December). In terms of the temporal variations, the concentrations of the OC, EC, and WSOC during the non-monsoon season were all higher than the concentrations during the monsoon season. At the same time, due to the influence of the Sho Dun Festival, the burning of biomass and the exhaust emissions of motor vehicles exhibited large increases, and the concentrations in August were greater than the concentrations in September. In terms of particle size distribution, the concentrations of OC and WSOC had the same bimodal size distributions during the monsoon season, which were at <0.49 μm and >7.2 μm. The concentration of EC exhibited a unimodal distribution during the monsoon season, which was at <0.49 μm. During the non-monsoon season, the concentrations of OC and WSOC had the same trimodal size distributions, which were at <0.49 μm, 1.5–3.0 μm, and >7.2 μm. The concentration of EC exhibited a unimodal distribution during the monsoon season, which was at <0.49 μm. We discussed their links with different carbonaceous aerosol sources in combination with the correlation analysis results. Our results demonstrated that the large-scale biomass burning (such as the burning of pine and cypress branches), fossil fuel combustion (such as emissions from thermal power plants or motor vehicle exhaust), and the photochemical formation in Lhasa were responsible for the high concentration of OC, WSOC, and EC at <0.49 μm, while various types of dust (such as soil dust from the dry riverbed of the Lhasa River and the industrial dust that is emitted from cement plants) and biogenic aerosols in Lhasa were responsible for the high concentration of OC and WSOC at >7.2 μm during the sampling period. The high OC and WSOC concentrations at 1.5–3.0 μm during the non-monsoon season were more likely to occur because of yak dung burning and the photochemical transformation of biogenic and anthropogenic VOC. At the same time, it could be seen from the backward trajectory that the air quality of Lhasa during the monsoon season was mainly affected by regional air masses from the northern plain of India, while the air quality of Lhasa during the non-monsoon season was mainly affected by the long-range transport of air mass from the western part of the TP.

Supplementary Materials

The following are available online at https://www.mdpi.com/2073-4433/10/3/157/s1. Table S1: Detailed description of the sampling time, Table S2: Mass concentrations (μg m−3) of size-segregated atmospheric particulate matter (PM) samples during the monsoon, non-monsoon, and whole sampling period, Table S3: organic carbon (OC), elemental carbon (EC), and water-soluble organic carbon (WSOC) concentrations of size-segregated aerosols (The unit is in μg/m3), Table S4: The OC/EC ratios of size-segregated particles during the monsoon, non-monsoon, and whole sampling period, Figure S1: Wind speed in Lhasa during the monsoon and non-monsoon seasons, Figure S2: Behavior of temperature, relative humidity, precipitation, and cloud cover in Lhasa during the sampling period, Figure S3: Behavior of CO, O3, NO2, and SO2 in Lhasa during the sampling period, Figure S4: All backward trajectories of different heights during the monsoon and non-monsoon seasons, 4 tracks per day, starting from 00:00, 06:00, 12:00, 18:00, Figure S5: The correlation between the OC and EC in different size particles, Figure S6: Correlation between the OC and WSOC mass concentration with all size particles during the monsoon and non-monsoon seasons, Figure S7: Correlation between the OC and K+ mass concentration in different size particles, Figure S8: Correlation between the OC and SO42− (NO3) mass concentration at <0.49 μm, Figure S9: Correlation of NH4+ and SO42− mass concentration in fine mode particles, Figure S10: (a) Correlation of the NH4+ and WSOC mass concentration at 1.5–3.0 μm, (b) correlation of the SO42− and WSOC mass concentration at 1.5–3.0 μm, (c) correlation of the NH4+ and OC mass concentration at 1.5–3.0 μm, (d) correlation of the SO42− and OC mass concentration at 1.5–3.0 μm, Figure S11: Correlation between the Ca2+ and K+ mass concentration in the coarse mode.

Author Contributions

Conceptualization, D.X.; methodology, G.W.; software, N.W. and C.M.; formal analysis, N.W. and C.M.; investigation, D.Z.; resources, W.L.; data curation, N.W.; writing—original draft preparation, N.W.; writing—review and editing, N.W., J.L., and J.Y.; supervision, D.X. and J.Y.; funding acquisition, N.W., J.Y., D.X., and J.L.

Funding

This research was funded by the National Natural Science Foundation of China (Grant Number: 11775180, 11475082 and 41603096), the Graduate Student Research Innovation Project of Hunan Province (Grant Number: 2014SCX03), and the General Program of the Hunan Provincial Education Department (Grant Number: 17C1353).

Acknowledgments

We thank the NOAA Air Resources Laboratory (ARL) for the HYSPLIT transport model.

Conflicts of Interest

The authors declare no conflict of interest.

References

  1. Ping, G.; Wang, X.; Yao, T. Ambient distribution of particulate- and gas-phase n -alkanes and polycyclic aromatic hydrocarbons in the Tibetan Plateau. Environ. Earth Sci. 2011, 64, 1703–1711. [Google Scholar]
  2. Huang, J.; Kang, S.; Wang, S.; Wang, L.; Zhang, Q.; Guo, J.; Wang, K.; Zhang, G.; Tripathee, L. Wet deposition of mercury at Lhasa, the capital city of Tibet. Sci. Total Environ. 2013, 447, 123–132. [Google Scholar] [CrossRef] [PubMed]
  3. Wan, X.; Kang, S.; Xin, J.; Liu, B.; Wen, T.; Wang, P.; Wang, Y.; Cong, Z. Chemical composition of size-segregated aerosols in Lhasa city, Tibetan Plateau. Atmosp. Res. 2016, 174–175, 142–150. [Google Scholar] [CrossRef]
  4. Duo, B.; Zhang, Y.; Kong, L.; Fu, H.; Hu, Y.; Chen, J.; Li, L.; Qiong, A. Individual particle analysis of aerosols collected at Lhasa City in the Tibetan Plateau. J. Environ. Sci. (China) 2015, 29, 165–177. [Google Scholar] [CrossRef] [PubMed]
  5. Huang, Q.Z. Analysis on the ambient air quality relation to meteorological condition in Lhasa. Environ. Monit. China 2001, 17, 50–53. [Google Scholar]
  6. Huang, L.; Hamza, N.; Lan, B.; Zahi, D. Climate-responsive design of traditional dwellings in the cold-arid regions of Tibet and a field investigation of indoor environments in winter. Energy Build. 2016, 128, 697–712. [Google Scholar] [CrossRef]
  7. Cui, Y.Y.; Liu, S.; Bai, Z.; Bian, J.; Li, D.; Fan, K.; McKeen, S.A.; Watts, L.A.; Ciciora, S.J.; Gao, R.-S. Religious burning as a potential major source of atmospheric fine aerosols in summertime Lhasa on the Tibetan Plateau. Atmosp. Environ. 2018, 181, 186–191. [Google Scholar] [CrossRef]
  8. Wang, Y.; Yang, L.; Zhou, X.; Dai, J.; Zhou, Y.; Deng, Z. Experiment study of the altitude effects on spontaneous ignition characteristics of wood. Fuel 2010, 89, 1029–1034. [Google Scholar]
  9. Fang, J.; Tu, R.; Guan, J.-F.; Wang, J.-J.; Zhang, Y.-M. Influence of low air pressure on combustion characteristics and flame pulsation frequency of pool fires. Fuel 2011, 90, 2760–2766. [Google Scholar] [CrossRef]
  10. Liu, J.; Li, J.; Lin, T.; Liu, D.; Xu, Y.; Chaemfa, C.; Qi, S.; Liu, F.; Zhang, G. Diurnal and nocturnal variations of PAHs in the Lhasa atmosphere, Tibetan Plateau: Implication for local sources and the impact of atmospheric degradation processing. Atmosp. Res. 2013, 124, 34–43. [Google Scholar] [CrossRef] [Green Version]
  11. Pachauri, T.; Singla, V.; Satsangi, A. Characterization of carbonaceous aerosols with special reference to episodic events at Agra, India. Atmosp. Res. 2013, 128, 98–110. [Google Scholar] [CrossRef]
  12. Liu, J.; Mo, Y.; Li, J.; Liu, D.; Shen, C.; Ding, P.; Jiang, H.; Cheng, Z.; Zhang, X.; Tian, C. Radiocarbon-derived source apportionment of fine carbonaceous aerosols before, during, and after the 2014 Asia-Pacific Economic Cooperation (APEC) summit in Beijing, China. J. Geophys. Res. Atmosp. 2016, 121, 4177–4187. [Google Scholar] [CrossRef] [Green Version]
  13. Ning, H. Review of Measurement Techniques about Organic Carbon and Elemental Carbon in Atmospheric Particles. Acta Sci. Nat. Univ. Pekin. 2005, 41, 957–964. [Google Scholar]
  14. Zhong, Z.; Hu, K.; Huang, Z.; Yin, T.; Shen, L. Characteristic Analysis of OC and EC in PM_(2.5) of Typical Haze Weather in Wuhan City. Meteorol. Environ. Res. 2014, 5, 19–22. [Google Scholar]
  15. Chow, J.C.; Watson, J.G. PM 2.5 carbonate concentrations at regionally representative Interagency Monitoring of Protected Visual Environment sites. J. Geophys. Res. 2002, 107, ICC-6. [Google Scholar] [CrossRef]
  16. Zhang, Y.L.; Elhaddad, I.; Huang, R.J.; Ho, K.F.; Cao, J.J.; Han, Y.; Zotter, P.; Bozzetti, C.; Daellenbach, K.R.; Slowik, J.G. Large contribution of fossil fuel derived secondary organic carbon to water soluble organic aerosols in winter haze in China. Atmosp. Chem. Phys. 2018, 18, 1–32. [Google Scholar] [CrossRef]
  17. Wozniak, A.S.; Bauer, J.E.; Dickhut, R.M. Characteristics of water-soluble organic carbon associated with aerosol particles in the eastern United States. Atmosp. Environ. 2012, 46, 181–188. [Google Scholar] [CrossRef]
  18. Weber, R.J.; Sullivan, A.P.; Peltier, R.E.; Russell, A.; Yan, B.; Zheng, M.; De Gouw, J.; Warneke, C.; Brock, C.; Holloway, J.S. A study of secondary organic aerosol formation in the anthropogenic-influenced southeastern United States. J. Geophys. Res. Atmosp. 2007, 112, D13302. [Google Scholar] [CrossRef]
  19. Mayol-Bracero, O.L.; Guyon, P.; Graham, B.; Roberts, G.; Andreae, M.O.; Decesari, S.; Facchini, M.C.; Fuzzi, S.; Artaxo, P. Water-soluble organic compounds in biomass burning aerosols over Amazonia 2. Apportionment of the chemical composition and importance of the polyacidic fraction. J. Geophys. Res. Atmosp. 2002, 107, LBA 59-1–LBA 59-15. [Google Scholar] [CrossRef]
  20. Bond, T.C.; Doherty, S.J.; Fahey, D.W.; Forster, P.M.; Berntsen, T.; Deangelo, B.J.; Flanner, M.G.; Ghan, S.; Kärcher, B.; Koch, D. Bounding the role of black carbon in the climate system: A scientific assessment. J. Geophys. Res. Atmosp. 2013, 118, 5380–5552. [Google Scholar] [CrossRef] [Green Version]
  21. Wan, X.; Kang, S.; Wang, Y.; Xin, J.; Liu, B.; Guo, Y.; Wen, T.; Zhang, G.; Cong, Z. Size distribution of carbonaceous aerosols at a high-altitude site on the central Tibetan Plateau (Nam Co Station, 4730ma.s.l.). Atmosp. Res. 2015, 153, 155–164. [Google Scholar] [CrossRef]
  22. Kaspari, S.D.; Schwikowski, M.; Gysel, M.; Flanner, M.G.; Kang, S.; Hou, S.; Mayewski, P.A. Recent increase in black carbon concentrations from a Mt. Everest ice core spanning 1860–2000 AD. Geophys. Res. Lett. 2011, 38, 155–170. [Google Scholar] [CrossRef]
  23. Andreae, M.O.; Gelencsér, A. Black carbon or brown carbon? The nature of light-absorbing carbonaceous aerosols. Atmosp. Chem. Phys. 2006, 6, 3131–3148. [Google Scholar] [CrossRef] [Green Version]
  24. Albrecht, B.A. Aerosols, cloud microphysics, and fractional cloudiness. Science 1989, 245, 1227–1230. [Google Scholar] [CrossRef]
  25. Saleh, R.; Robinson, E.S.; Tkacik, D.S.; Ahern, A.T.; Liu, S.; Aiken, A.C.; Sullivan, R.C.; Presto, A.A.; Dubey, M.K.; Yokelson, R.J. Brownness of organics in aerosols from biomass burning linked to their black carbon content. Nat. Geosci. 2014, 7, 647. [Google Scholar] [CrossRef]
  26. Washenfelder, R.A.; Attwood, A.R.; Brock, C.A.; Guo, H.; Xu, L.; Weber, R.J.; Ng, N.L.; Allen, H.M.; Ayres, B.R.; Baumann, K. Biomass burning dominates brown carbon absorption in the rural southeastern United States. Geophys. Res. Lett. 2015, 42, 653–664. [Google Scholar] [CrossRef] [Green Version]
  27. Bond, T.C. Spectral dependence of visible light absorption by carbonaceous particles emitted from coal combustion. Geophys. Res. Lett. 2001, 28, 4075–4078. [Google Scholar] [CrossRef] [Green Version]
  28. Guang-Ming, W.U.; Cong, Z.Y.; Kang, S.C.; Kawamura, K.; Ping-Qing, F.U.; Zhang, Y.L.; Wan, X. Brown carbon in the cryosphere: Current knowledge and perspective. Adv. Clim. Chang. Res. 2016, 7, 82–89. [Google Scholar]
  29. Lack, D.; Bahreini, R.; Langridge, J.; Gilman, J.; Middlebrook, A. Brown carbon absorption linked to organic mass tracers in biomass burning particles. Atmosp. Chem. Phys. 2013, 13, 2415–2422. [Google Scholar] [CrossRef] [Green Version]
  30. Zhang, X.; Lin, Y.H.; Surratt, J.D.; Zotter, P.; Prevot, A.S.H.; Weber, R.J. Light-absorbing soluble organic aerosol in Los Angeles and Atlanta: A Contrast in Secondary Organic Aerosol. Geophys. Res. Lett. 2011, 38, 759–775. [Google Scholar] [CrossRef]
  31. Fu, P.; Kawamura, K.; Chen, J.; Qin, M.; Ren, L.; Sun, Y.; Wang, Z.; Barrie, L.A.; Tachibana, E.; Ding, A. Fluorescent water-soluble organic aerosols in the High Arctic atmosphere. Sci. Rep. 2015, 5, 9845. [Google Scholar] [CrossRef] [Green Version]
  32. Laskin, A.; Laskin, J.; Nizkorodov, S.A. Chemistry of Atmospheric Brown Carbon. Chem. Rev. 2015, 115, 4335. [Google Scholar] [CrossRef] [PubMed]
  33. Yue, S.; Ren, H.; Fan, S.; Sun, Y.; Wang, Z.; Fu, P. Springtime precipitation effects on the abundance of fluorescent biological aerosol particles and HULIS in Beijing. Sci. Rep. 2016, 6, 29618. [Google Scholar] [CrossRef] [Green Version]
  34. Twomey, S. Pollution and the planetary albedo. Atmosp. Environ. 1974, 8, 1251–1256. [Google Scholar] [CrossRef]
  35. Daniel, R.; Ulrike, L.; Raga, G.B.; O’Dowd, C.D.; Markku, K.; Sandro, F.; Anni, R.; Andreae, M.O. Flood or drought: How do aerosols affect precipitation? Science 2008, 321, 1309–1313. [Google Scholar]
  36. Kang, H.; Zhu, B.; Wang, H.L.; Shi, S.S. Characterization and Variation of Organic Carbon(OC) and Elemental Carbon(EC) in PM_(2.5) During the Winter in the Yangtze River Delta Region, China. Environ. Sci. 2018, 39, 961–971. [Google Scholar]
  37. Balachandran, S.; Pachon, J.E.; Lee, S.; Oakes, M.M.; Rastogi, N.; Shi, W.; Tagaris, E.; Yan, B.; Davis, A.; Zhang, X. Particulate and gas sampling of prescribed fires in South Georgia, USA. Atmosp. Environ. 2013, 81, 125–135. [Google Scholar] [CrossRef]
  38. Bozzetti, C.; El Haddad, I.; Salameh, D.; Daellenbach, K.R.; Fermo, P.; Gonzalez, R.; Cruz Minguillón, M.; Iinuma, Y.; Poulain, L.; Elser, M. Organic aerosol source apportionment by offline-AMS over a full year in Marseille. Atmosp. Chem. Phys. 2017, 17, 1–46. [Google Scholar]
  39. Park, S.H.; Gong, S.L.; Bouchet, V.S.; Gong, W.; Makar, P.A.; MORAN, M.D.; Stroud, C.A.; Zhang, J. Effects of black carbon aging on air quality predictions and direct radiative forcing estimation. Tellus 2011, 63, 1026–1039. [Google Scholar] [CrossRef] [Green Version]
  40. Singh, A.; Rastogi, N.; Patel, A.; Satish, R.V.; Singh, D. Size-Segregated Characteristics of Carbonaceous Aerosols over the Northwestern Indo-Gangetic Plain: Year Round Temporal Behavior. Aerosol Air Q. Res. 2016, 16, 1615–1624. [Google Scholar] [CrossRef] [Green Version]
  41. Ming, J.; Xiao, C.; Sun, J.; Kang, S.; Bonasoni, P. Carbonaceous particles in the atmosphere and precipitation of the Nam Co region, central Tibet. J. Environ. Sci. 2010, 22, 1748–1756. [Google Scholar] [CrossRef]
  42. Zhao, Z.; Wang, Q.; Xu, B.; Shen, Z.; Huang, R.; Zhu, C.; Su, X.; Zhao, S.; Long, X.; Liu, S. Black carbon aerosol and its radiative impact at a high-altitude remote site on the southeastern Tibet Plateau. J. Geophys. Res. Atmosp. 2017, 122, 5515–5530. [Google Scholar] [CrossRef]
  43. Xu, J.Z.; Zhang, Q.; Wang, Z.B.; Yu, G.M.; Ge, X.L.; Qin, X. Chemical composition and size distribution of summertime PM2.5 at a high altitude remote location in the northeast of the Qinghai–Xizang (Tibet) Plateau: Insights into aerosol sources and processing in free troposphere. Atmosp. Chem. Phys. 2015, 15, 5069–5081. [Google Scholar] [CrossRef]
  44. Zhang, Y.-L.; Liu, J.-W.; Salazar, G.A.; Li, J.; Zotter, P.; Zhang, G.; Shen, R.-R.; Schäfer, K.; Schnelle-Kreis, J.; Prévôt, A.S.H.; et al. Micro-scale (μg) radiocarbon analysis of water-soluble organic carbon in aerosol samples. Atmosp. Environ. 2014, 97, 1–5. [Google Scholar] [CrossRef] [Green Version]
  45. Duo, B.; Cui, L.; Wang, Z.; Li, R.; Zhang, L.; Fu, H.; Chen, J.; Zhang, H.; Qiong, A. Observations of atmospheric pollutants at Lhasa during 2014-2015: Pollution status and the influence of meteorological factors. J. Environ. Sci. (China) 2018, 63, 28–42. [Google Scholar] [CrossRef]
  46. Li, C.; Chen, P.; Kang, S.; Yan, F.; Hu, Z.; Qu, B.; Sillanpää, M. Concentrations and light absorption characteristics of carbonaceous aerosol in PM 2.5 and PM 10 of Lhasa city, the Tibetan Plateau. Atmos. Environ. 2016, 127, 340–346. [Google Scholar] [CrossRef]
  47. Liu, J.; Li, J.; Zhang, Y.; Liu, D.; Ding, P.; Shen, C.; Shen, K.; He, Q.; Ding, X.; Wang, X. Source apportionment using radiocarbon and organic tracers for PM2.5 carbonaceous aerosols in Guangzhou, South China: Contrasting local- and regional-scale haze events. Environ. Sci. Technol. 2014, 48, 12002–12011. [Google Scholar] [CrossRef] [PubMed]
  48. Cong, Z.; Kang, S.; Kawamura, K.; Liu, B.; Wan, X.; Wang, Z.; Gao, S.; Fu, P. Carbonaceous aerosols on the south edge of the Tibetan Plateau: Concentrations, seasonality and sources. Atmosp. Chem. Phys. 2015, 15, 1573–1584. [Google Scholar] [CrossRef]
  49. Long, S.; Zeng, J.; Li, Y.; Bao, L.; Cao, L.; Liu, K.; Xu, L.; Lin, J.; Liu, W.; Wang, G.; et al. Characteristics of secondary inorganic aerosol and sulfate species in size-fractionated aerosol particles in Shanghai. J. Environ. Sci. 2014, 26, 1040–1051. [Google Scholar] [CrossRef]
  50. Stein, A.F.; Draxler, R.R.; Rolph, G.D.; Stunder, B.J.B.; Cohen, M.D.; Ngan, F. NOAA’s HYSPLIT Atmospheric Transport and Dispersion Modeling System. Bull. Am. Meteorol. Soc. 2016, 96, 2059–2077. [Google Scholar] [CrossRef]
  51. Zhang, N.; Cao, J.; Wang, Q.; Huang, R.; Zhu, C.; Xiao, S.; Wang, L. Biomass burning influences determination based on PM 2.5 chemical composition combined with fire counts at southeastern Tibetan Plateau during pre-monsoon period. Atmosp. Res. 2018, 206, 108–116. [Google Scholar] [CrossRef]
  52. Bonasoni, P.; Laj, P.; Marinoni, A.; Sprenger, M.; Angelini, F.; Arduini, J.; Bonafè, U.; Calzolari, F.; Colombo, T.; Decesari, S. Atmospheric Brown Clouds in the Himalayas: First two years of continuous observations at the Nepal Climate Observatory-Pyramid (5079 m). Atmosp. Chem. Phys. 2010, 10, 7515–7531. [Google Scholar] [CrossRef]
  53. Zhou, W.; Yang, S.; Jiang, X.; Guo, Q. Estimating planetary boundary layer height over the Tibetan Plateau using COSMIC radio occultation data. Acta Meteorol. Sin. 2018, 76, 117–133. [Google Scholar]
  54. Zhao, T.L.; Gong, S.L.; Huang, P.; Lavoué, D. Hemispheric transport and influence of meteorology on global aerosol climatology. Atmosp. Chem. Phys. 2012, 12, 7609–7624. [Google Scholar] [CrossRef] [Green Version]
  55. Han, Y.; Sun, H.; Liu, J.; Zhao, T.; Gong, S.L. Study on Simulated Seasonal Variations of Black Carbon Aerosol Transport and Depositions over the Tibetan Plateau. J. Arid Meteorol. 2014, 91, 22–25. [Google Scholar]
  56. Zhao, Z.; Cao, J.; Shen, Z.; Xu, B.; Zhu, C.; Chen, L.W.A.; Su, X.; Liu, S.; Han, Y.; Wang, G. Aerosol particles at a high-altitude site on the Southeast Tibetan Plateau, China: Implications for pollution transport from South Asia. J. Geophys. Res.-Atmosp. 2013, 118, 11360–11375. [Google Scholar] [CrossRef]
  57. Sang, X.; Zhang, Z.; Chan, C.; Engling, G. Source categories and contribution of biomass smoke to organic aerosol over the southeastern Tibetan Plateau. Atmos. Environ. 2013, 78, 113–123. [Google Scholar] [CrossRef]
  58. Guo, H.; Lei, L. Vegetation greenness trend (2000 to 2009) and the climate controls in the Qinghai-Tibetan Plateau. J. Appl. Remote Sens. 2013, 7, 3572. [Google Scholar]
  59. Hu, T.; Cao, J.; Zhu, C.; Zhao, Z.; Liu, S.; Zhang, D. Morphologies and elemental compositions of local biomass burning particles at urban and glacier sites in southeastern Tibetan Plateau: Results from an expedition in 2010. Sci. Total Environ. 2018, 628–629, 772–781. [Google Scholar] [CrossRef]
  60. Chen, P.; Kang, S.; Bai, J.; Sillanpää, M.; Li, C. Yak dung combustion aerosols in the Tibetan Plateau: Chemical characteristics and influence on the local Atmosp. Environ. Atmosp. Res. 2015, 156, 58–66. [Google Scholar] [CrossRef]
  61. Yang, H.; Zhang, D.; Chu, B.; Zhang, W.; Xia, P.; Yuan, R.; Chen, M.; Min, D.U.; Lei, J.I.; Chen, X. Establishment and Analysis of Atmospheric Particulate Matter Source Spectra in the Typical City of Lhasa, Qinghai-Tibetan Plateau, China. Environ. Monit. China. 2017, 33, 46–54. [Google Scholar]
  62. Wu, D.; Shen, K.Y.; Ge, X.L.; Xia, J.R.; Liu, G.; Li, F.Y.; Yang, M. Characteristics of water-soluble organic carbon (WSOC) in atmospheric particulate matter at northern suburb of Nanjing. China Environ. Sci. 2017, 37, 3237–3246. [Google Scholar]
  63. Seinfeld, J.H.; Pandis, S.N. From air pollution to climate change. Atmosp. Chem. Phys. 2006, 429–443. [Google Scholar]
  64. Kumar, A.; Ram, K.; Ojha, N. Variations in carbonaceous species at a high-altitude site in western India: Role of synoptic scale transport. Atmosp. Environ. 2016, 125, 371–382. [Google Scholar] [CrossRef]
  65. Saud, T.; Gautam, R.; Mandal, T.K.; Gadi, R.; Singh, D.P.; Sharma, S.K.; Dahiya, M.; Saxena, M. Emission estimates of organic and elemental carbon from household biomass fuel used over the Indo-Gangetic Plain (IGP), India. Atmosp. Environ. 2012, 61, 212–220. [Google Scholar] [CrossRef]
  66. Zhang, H.; Wang, S.; Hao, J.; Wan, L. Chemical and size characterization of particles emitted from the burning of coal and wood in rural households in Guizhou, China. Atmosp. Environ. 2012, 51, 94–99. [Google Scholar] [CrossRef]
  67. Bano, S.; Pervez, S.; Chow, J.C.; Matawle, J.L.; Watson, J.G.; Sahu, R.K.; Srivastava, A.; Tiwari, S.; Pervez, Y.F.; Deb, M.K. Coarse particle (PM10–2.5) source profiles for emissions from domestic cooking and industrial process in Central India. Sci. Total Environ. 2018, 627, 1137–1145. [Google Scholar] [CrossRef]
  68. Srinivas, B.; Rastogi, N.; Sarin, M.M.; Singh, A.; Singh, D. Mass absorption efficiency of light absorbing organic aerosols from source region of paddy-residue burning emissions in the Indo-Gangetic Plain. Atmos. Environ. 2016, 125, 360–370. [Google Scholar] [CrossRef]
  69. Guo, Y. Carbonaceous aerosol composition over northern China in spring 2012. Environ. Sci. Pollut. Res. Int. 2015, 22, 10839–10849. [Google Scholar] [CrossRef]
  70. Li, J.; Pósfai, M.; Hobbs, P.V.; Buseck, P.R. Individual aerosol particles from biomass burning in southern Africa: 2, Compositions and aging of inorganic particles. J. Geophys. Res. Atmosp. 2003, 108. [Google Scholar] [CrossRef] [Green Version]
  71. Ordou, N.; Agranovski, I.E. Mass distribution and elemental analysis of the resultant atmospheric aerosol particles generated in controlled biomass burning processes. Atmosp. Res. 2017, 198, 108–112. [Google Scholar] [CrossRef]
  72. Ran, L.; Lin, W.L.; Deji, Y.Z.; La, B.; Tsering, P.M.; Xu, X.B.; Wang, W. Surface gas pollutants in Lhasa, a highland city of Tibet-current levels and pollution implications. Atmosp. Chem. Phys. 2014, 14, 10721–10730. [Google Scholar] [CrossRef]
Figure 1. (a) Topographic distribution in the latitude direction. (b) Topographic distribution in the longitude direction. (c) Locations of the sampling sites and typical emission sources on the Google Earth map. (d) The photo of the measurement site.
Atmosphere 10 00157 g001
Figure 2. Backward trajectory diagrams containing the fire information during the monsoon and non-monsoon seasons.
Atmosphere 10 00157 g002
Figure 3. The size distribution of atmospheric particulate matter (PM) mass concentration during the monsoon and non-monsoon seasons.
Atmosphere 10 00157 g003
Figure 4. Temporal variations of organic carbon (OC), elemental carbon (EC), and water-soluble organic carbon (WSOC) concentrations in the size-segregated aerosols during the sampling period.
Atmosphere 10 00157 g004
Figure 5. OC, EC, and WSOC mass concentrations of size-segregated aerosols during the monsoon and non-monsoon seasons.
Atmosphere 10 00157 g005