Article

Modeling Dust Direct Radiative Feedbacks in East Asia During the Last Glacial Maximum

1
Key Laboratory for Aerosol-Cloud-Precipitation of China Meteorological Administration, School of Atmospheric Physics, Nanjing University of Information Science and Technology, Nanjing 210044, China
2
State Key Lab of Loess and Quaternary Geology (SKLLQG), Institute of Earth Environment, Chinese Academy of Sciences, Xi’an 710061, China
3
Chinese Academy of Sciences (CAS), Center for Excellence in Quaternary Science and Global Change, Xi’an 710061, China
*
Author to whom correspondence should be addressed.
Atmosphere 2019, 10(3), 146; https://doi.org/10.3390/atmos10030146
Submission received: 2 February 2019 / Revised: 10 March 2019 / Accepted: 11 March 2019 / Published: 18 March 2019
(This article belongs to the Special Issue Mineral Dust: Sources, Atmospheric Processing and Impacts)

Abstract

:
In this study, using the fourth version of the Community Atmosphere Model (CAM4) with a bulk aerosol model parameterization (BAM) for dust size distribution (CAM4-BAM), East Asian dust and its direct radiative feedbacks (DRF) during the Last Glacial Maximum are analyzed by intercomparing results between the experiments with (Active) and without (Passive) the DRF. This CAM4-BAM captures the expected characteristics that the dust aerosol optical depth and loading over East Asia during the Last Glacial Maximum (LGM) were significantly greater compared to the current climate. A comparative analysis of the Active and Passive experiments reveals that consideration of the dust–radiation interaction can significantly reduce dust emissions and then weaken the whole dust cycle, including loading, transport, and dry and wet depositions over East Asia. Further analysis of the dust–radiation feedback shows that the DRF decreases surface sensible heat, mainly owing to the negative surface forcing induced by dust with a value of −11.8 W m−2. The decreased surface sensible heat weakens the turbulent energy within the planetary boundary layer and the surface wind speed, and then reduces the regional dust emissions. This process creates a negative DRF–emission feedback loop to affect the dust cycle during the LGM. Further analysis reveals that the dust emissions in the LGM over East Asia were more reduced, with amounts of −77.2 Tg season−1 by the negative DRF–emission feedback, compared to the current climate with −6.8 Tg season−1. The two ratios of this reduction to their emissions are close to −10.7% for the LGM and −7.5% for the current climate.

1. Introduction

Atmospheric dust has widespread impacts on climate, atmospheric chemistry, biogeochemical cycles, and human health, and has attracted a lot of attention. In the climate system, it can alter the Earth’s radiation balance via scattering and absorbing radiation in the atmosphere, act as nuclei for cloud formation, and fertilize ecosystems upon deposition [1,2,3]. Subsequently, changes in dust loading could yield a substantial radiative forcing of the climate system and then influence cycles of atmospheric components, such as water vapor [4,5] and CO2 [6,7], as well as itself [8,9].
Dust in the atmosphere can directly absorb and scatter thermal (longwave, LW) and solar (shortwave, SW) radiation, known as dust direct radiative forcing (DRF). The importance of DRF has been extensively recognized in current general circulation models [10,11,12]. Globally, the annual mean DRF of dust aerosols at the top of atmosphere (TOA) are estimated to be negative [13], but different in magnitude in different current model simulations. For example, Huneeus et al. [14] suggested that the value of DRF ranged from −0.30 to −0.6 W m−2 by the AeroCOM model. Mahowald et al. [15] deduced changes of −0.14 ± 0.11 W m−2 from the years 1750 to 2000. Kok et al. [9] noted that the DRF was underestimated in models, and revalued its value of −0.2 W m−2 between −0.48 and +0.20 W m−2. The impacts of changes in radiative forcing induced by dust aerosol on thermal stratification and air pressure lead to changes in surface wind speeds, feeding back to the dust cycles, including dust emission, loading, transport, and deposition. Miller et al. [16] and Pérez et al. [17] have described this feedback, noting that the DRF reduces the surface net radiation and enhances thermal stability of the planetary boundary layer (PBL), which decreases surface wind speeds.
East Asia is one of the main sources of atmospheric mineral dust, where abundant mineral dust is annually injected into the atmosphere and spread over the broad downwind areas (e.g., eastern China and the Pacific Ocean). The regional mean DRF is much larger (several times larger) than the global average due to the high loading of dust, mainly from the Taklimakan and Gobi Desert [18,19,20,21]. This strong DRF reduces the net surface radiative fluxes effectively and then cools the surface locally by up to 1 °C, which may increase local stability and is not favorable to the emission of dust [22]. Hence, East Asia is a proper and key area to investigate the dust cycle and its climatic effects.
The Last Glacial Maximum (LGM; about 21,000 years ago) is the most recent glacial period with an extremely cold, dry, and dusty climate. Compared to pre-industrial values, the LGM is characterized by significant drops in temperatures of several degrees, more markedly at high latitudes, associated with a massive reduction in the concentrations of greenhouse gases [23]. In this paper, we will show the ample evidence that dust emissions are profoundly impacted by such climatic conditions. Therefore, the LGM is an ideal target to explore natural aerosol (dust in particular) interactions with climate [24].
Several studies have quantified the change in dust loading during the LGM. Since atmospheric dust loadings during cold periods are generally much higher than those during warm periods [25], higher dust amounts were estimated during the LGM through different simulating models [26,27,28]. These model emissions (loading) range from ~2400 to ~16,100 Tg a−1 for the LGM, and between ~1100 and ~7100 Tg a−1 for the corresponding pre-industrial/current climate control cases, with a median increase by a factor of 2.0 in the LGM [24]. Moreover, of the studies simulating the LGM dust cycle, some also included climate feedback [27,29,30]. These existing model studies estimate the TOA DRF to be in a range between −0.02 and −3.2 W m−2. A few studies estimate the LGM-pre-industrial or present-day climate anomalies to range from −2.0 to 0.1 W m−2 [31,32]. Therefore, previous studies mostly calculated a negative forcing from dust during the LGM, and the feedback was stronger than with the current climate. The above-mentioned studies are mainly focused on the dust cycle and dust–climate feedback on a global scale. Nevertheless, earlier studies have pointed out that the fine dust deposition in the Greenland ice sheet during the LGM was 10 times as much as during the interglacial age, and chemical analysis indicates that the main source was Asia, not nearby North America [33,34], which implies that East Asia was an important source in the LGM. The feedbacks of dust–radiation over East Asia in the LGM should be paid more attention, perhaps due to the complexity of aerosol–radiation–climate feedbacks.
Here we use simulations with the fourth version of the Community Atmosphere Model (CAM4) with a bulk aerosol model parameterization (BAM) for the dust size distribution (CAM4-BAM) to explore the role of atmospheric dust during the LGM. This CAM4-BAM model has been updated by Albani et al. [31] to involve improvements in the representation of mineral dust, which could effectively represent the global dust cycle and assess the DRF on the atmospheric radiation balance. With this model, we have the opportunity to assess whether the dust cycle was enhanced or reduced by DRF over East Asia during the LGM, and to what extent the feedback of the dust cycle was enhanced compared to the current climate.
The structure of the paper is as follows: We describe the improved CAM4-BAM, the experimental design, and the mixing index in PBL in Section 2. The main results and further discussion are shown in Section 3. Summary and conclusions are finally shown in Section 4.

2. Methods

2.1. Model Description and Numerical Experiment Design

The CAM4 is the atmospheric component of the fourth version of the Community Climate System Model, which is documented in more detail by Neale et al. [33]. The CAM4 with a bulk aerosol model parameterization (BAM) for the dust size distribution (CAM4-BAM) adopts a sub-bin fixed size distribution of externally mixed aerosols, including dust, black carbon, organic carbon, sea salt, and sulfate [35]. The dust model coupled to the CAM4 is based on a representation of the major components of the dust cycle: Mobilization, transport, and deposition [28,36]. The dust size distribution is described by Mahowald et al. [37] with four size bins, with diameters of 0.1–1.0 μm (Bin1), 1.0–2.5 μm (Bin2), 2.5–5.0 μm (Bin3), and 2.0–10.0 μm (Bin4). Besides direct radiative forcing, modeled impacts of dust on climate include radiative impacts of dust on both snow and sea ice, which may change the snow or ice albedo and exert a significant positive radiative forcing [38,39]. The released version of the CAM4-BAM has had some bias in simulating the dust cycle and dust radiative forcing on global and regional scales [31]. Improvements to CAM4-BAM for the dust cycle were proposed based on three major aspects: The optimized soil erodibility maps with respect to each of the macroareas, updated optical properties of dust with realistic absorption parameters (including the LW effects, which were ignored for the release version of CAM4), and a new size distribution for dust emissions, which better represents the dust cycle and better simulates the global climate and the dust cycle during different periods, in climate equilibrium conditions [18,31].
In this study, we used the improved CAM4-BAM model with the finite volume dynamical core for the high horizontal resolution (0.9° × 1.25°) and 26 vertical levels to achieve the simulations for the present-day (PD) and LGM periods. It is noted that the model used here for the PD and LGM simulations is the same as Albani et al. [31], except for the fixed surface sea temperature (SST). Although dust and SST form a feedback in the coupled atmosphere–ocean model that also affects regional climate and the dust cycle [16,30], the feedback is too slow a response for our study, which focused on the dust fast responses (the direct effects of aerosol on land surface, clouds, and radiation (rapid adjustment)). The boundary conditions basically follow the Paleoclimate Modelling Intercomparison Project 3 (PMIP3) protocol for greenhouse gas concentrations, land, and ice sheets, and the use of pre-industrial vegetation [40]. The LGM simulation differs from the PD simulation in terms of the: (1) Insolation, which was modified for astronomic conditions of 21 kyr, (2) concentrations of CO2, CH4, and N2O, which were reduced according to ice core data following the PMIP protocol, (3) ice sheets and sea level, which were prescribed according to the ICE-5G reconstruction of 21 kyr [41], (4) soil erodibility maps, which were optimized for both PD and LGM model configurations based on DIRTMAP3 [42], and (5) vegetation cover, which was simulated for the LGM equilibrium climate with BIOME4 [43] and incorporated the effects of vegetation in the LGM in the soil erodibility map. To examine the dust–radiation interaction, a total of four simulations with 21 years (first year spin-up) were performed: The first two for the PD climate with (PD-Active) and without (PD-Passive) the DRF, and the latter two were the same as the first two, but for the LGM climate, as summarized in Table 1. “Active” and “Passive” mean the simulations with and without DRF, respectively. Based on these experiments, we used the results of the differences between “Active” and “Passive” experiments to investigate the climatic feedback of DRF and the dust cycle changes induced by DRF over eastern Asia. It is noteworthy that only the radiative effects of dust aerosols were considered here, and it was assumed that those of the other aerosols (black carbon, organic carbon, sulfate, and salt) were always passive in all simulations. The radiative forcing of dust in the snow was also ignored to isolate the DRF. In reality, the dust in the snow on the Tibetan Plateau may change the snow albedo and exert a significant positive radiative forcing on the dust cycle in East Asia [44]. Climatologies were based on the final 20 years of each simulation.

2.2. Atmospheric PBL Mixing Index

The gradient Richardson number (Ri) usually serves a proxy to evaluate the atmospheric turbulent stability within the mixing layer, and is defined as follows (Equation (1)):
R i = g θ ¯ Δ θ ¯ Δ z ( Δ u ¯ Δ z ) 2 + ( Δ v ¯ Δ z ) 2
where Δ z is the height increment over which a specific calculation of Ri is being made, g is the acceleration of gravity, θ ¯ is the mean virtual potential temperature within that height increment, and Δ u ¯ and Δ v ¯ are the mean wind speeds in the zonal and meridional directions within the height increment, respectively.
The Ri is an effective and classical index to diagnose turbulence and has been recorded in many textbooks on boundary layer turbulence [45,46]. It can be interpreted as the ratio of the buoyancy term g θ ¯ Δ θ ¯ Δ z to the shear term ( Δ u ¯ Δ z ) 2 + ( Δ v ¯ Δ z ) 2 in the turbulent kinetic equation. When the Ri > 1, the turbulence is suppressed and the mixing layer development will be restrained [45]. When Ri < 1 and Ri > 0, a lower value indicates a higher degree of turbulence. In our study, we calculated the Ri values for pressures between 850 to 700 hPa levels over East Asia, as the altitude during the LGM was higher than that at PD.

3. Results

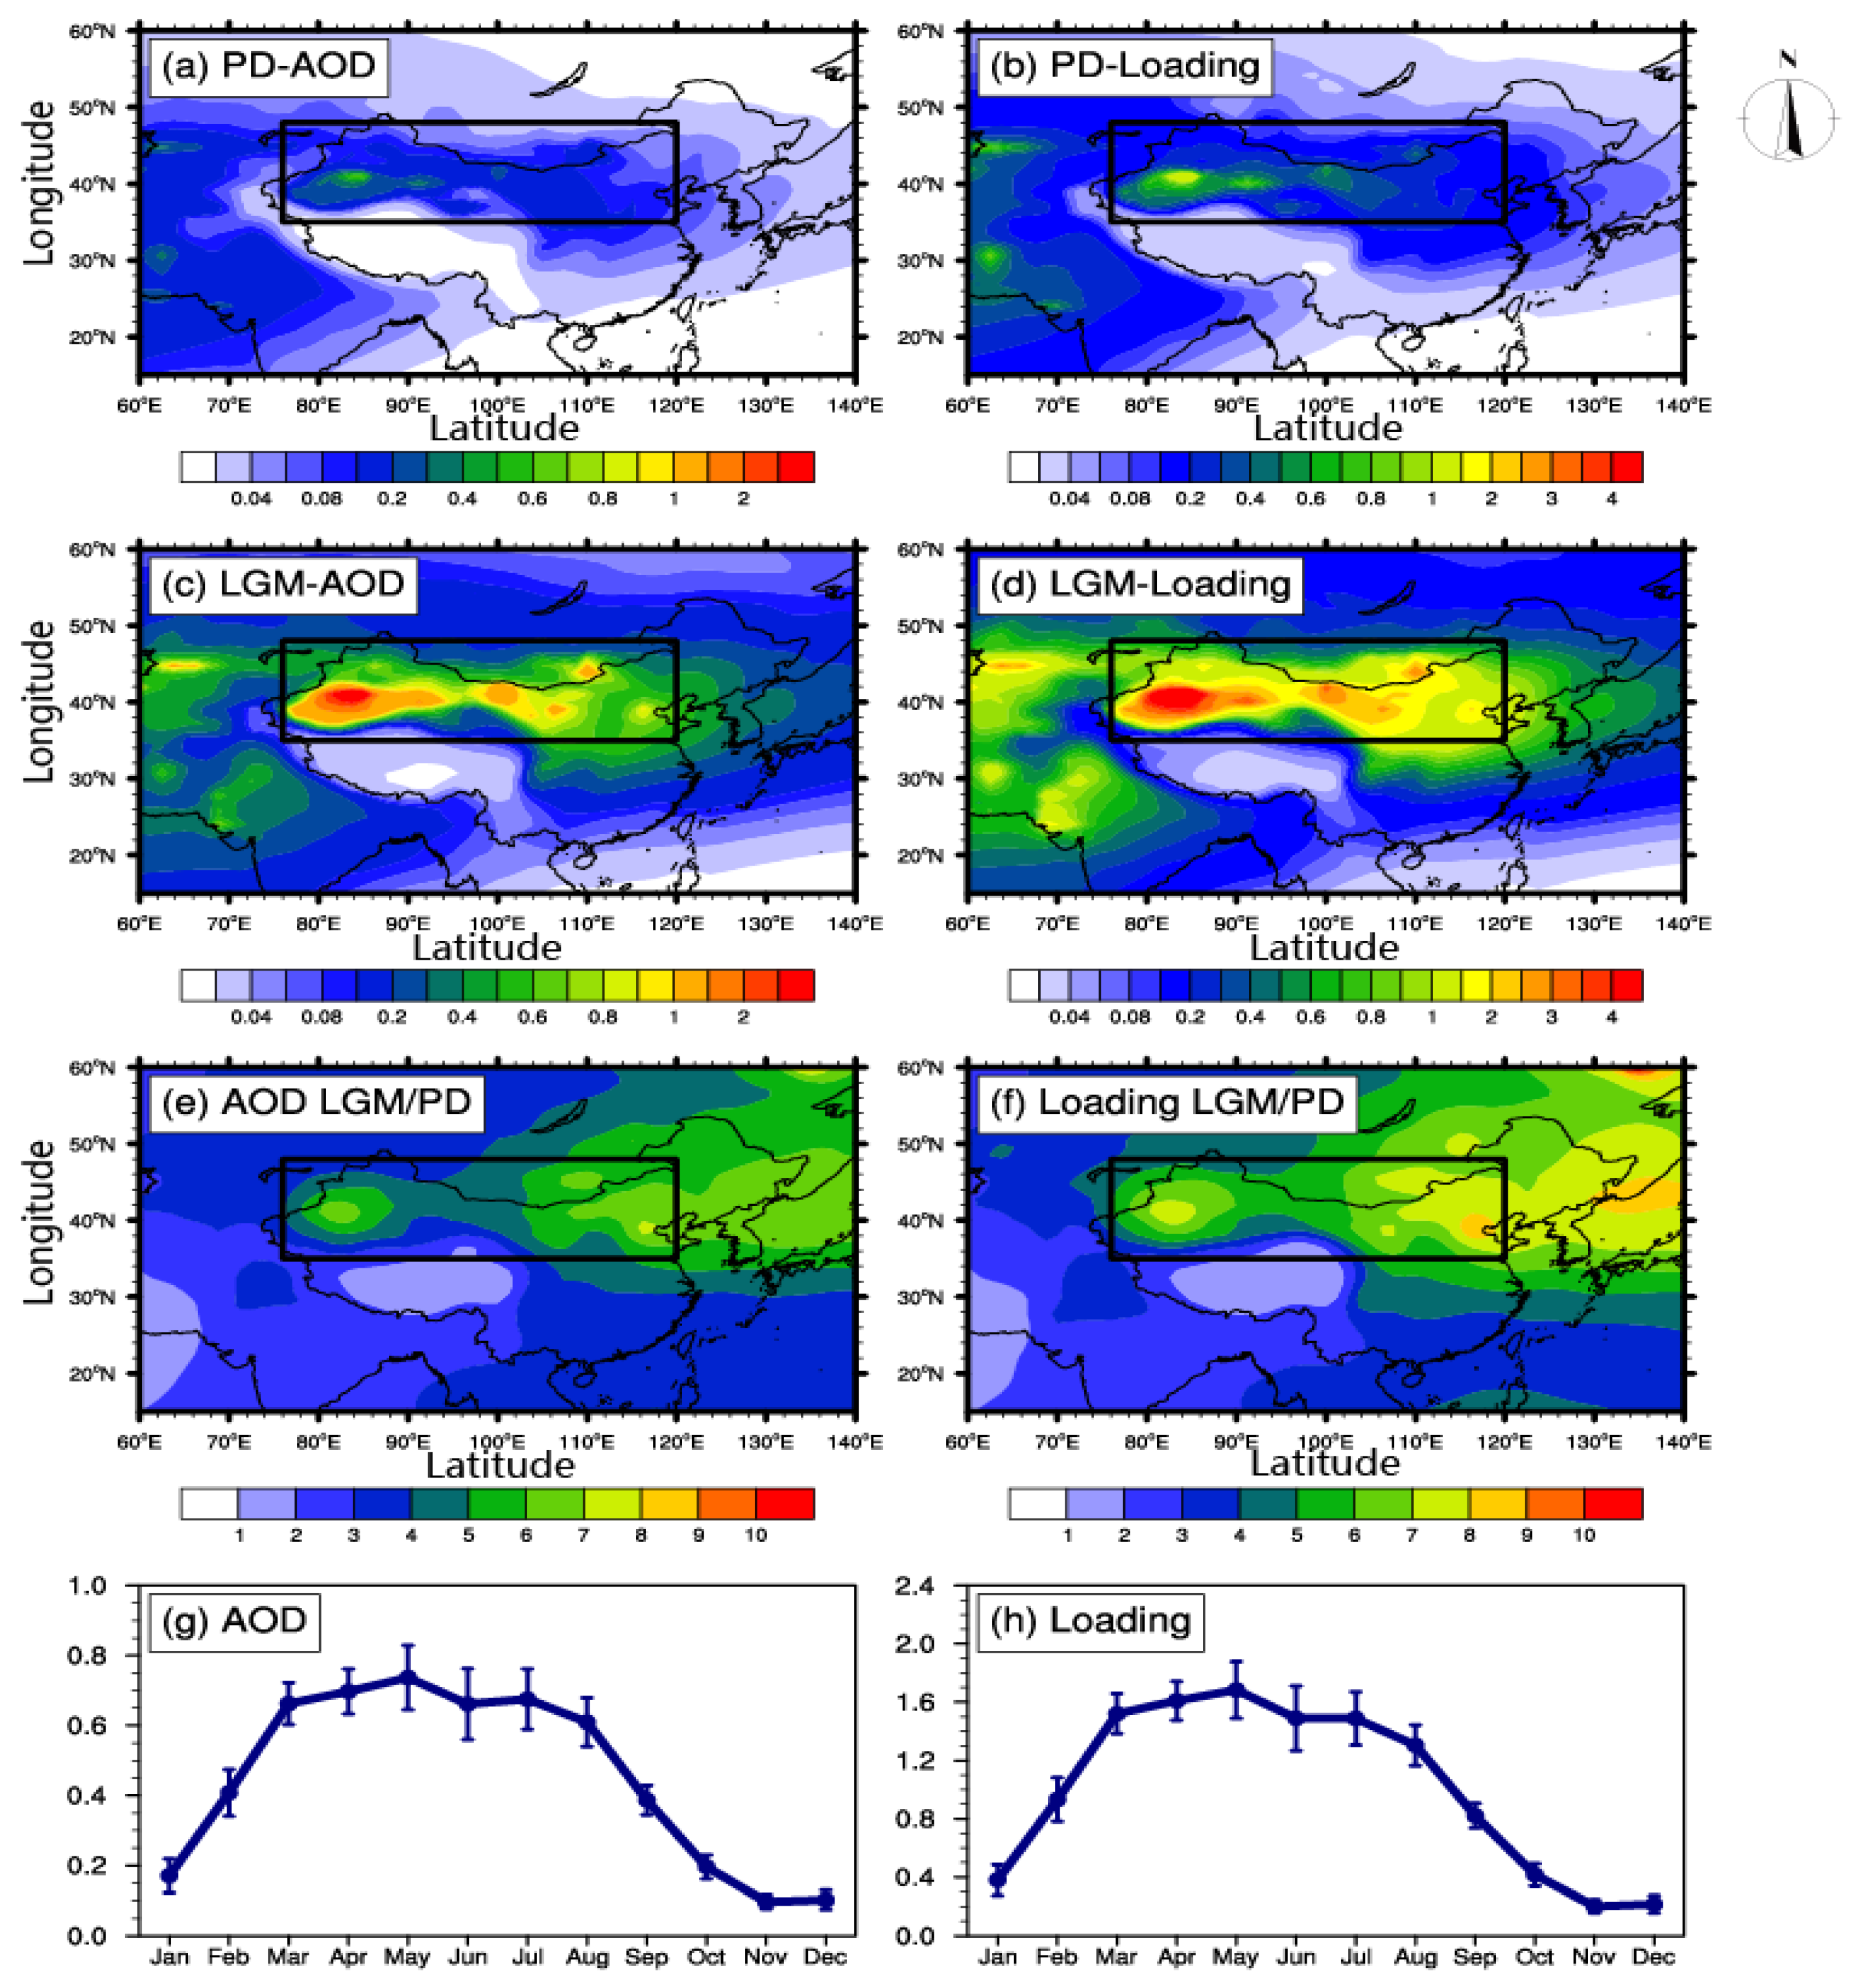
3.1. The Simulating Dust Climatology in PD and LGM

Table 2 shows the annual mean values of global dust emission, loading, and aerosol optical depth (AOD) in different models. Comparison with prior work shows large ranges in values. This large spread may be attributable to differences in the presentation of dust emissions and deposition mechanisms, as well as the differences in boundary conditions (including vegetation), the consideration of different aerosol size ranges, and lastly whether or not glaciogenic sources of dust [24], for example, the simulation of Mahowald et al. [27], excluded tuned glaciogenic sources. However, the values of emission, loading, and AOD simulated in our work have little difference from those of Albani et al. [31], and the emission and loading are of the same order of magnitude as the results of Takemura et al. [29] and the MIROC-ESM model (Coupled Model Intercomparison Project phase 5, CMIP5) [47].
The CAM4-BAM reconstructions estimate higher global dust loading during the LGM than PD. Figure 1 shows the March–April–May (MAM) averaged dust AOD at 550 nm, and loading in the PD and LGM simulations. In the PD, the dominant AOD high value center is Northwest China, with a maximum value above 0.1 (Figure 1a). The dust loading has a mean value of 0.1–0.6 g m−2 spreading from the west to the east in East Asia, and in Taklimakan it exceeds 1 g m−2 (Figure 1b). Compared to the PD climate, the values of dust AOD over the corresponding regions intensify significantly by an average factor of 4.2 during the LGM. The loading also increases by five times (Figure 1e,f), with a notable increase in the Taklimakan region and decreases from this region to the widespread downwind areas (Figure 1c,d). The spatial pattern of dust AOD and loading in the PD simulation is virtually identical to that in the LGM simulations. The global averaged LGM/PD ratio is 2.0, which is close to the LGM/Preindustrial (PI) ratio of 2.2 in simulations of Albani et al. [31]. However, Albani et al. did not plot the distribution of the ratio. Hopcroft et al. [32] show the worldwide LGM/PI ratio of dust loading using the HadGEM model, and the ratio over East Asia similarly ranges from 2 to 7. Figure 1g,h shows the monthly dust AOD and loading averaged over East Asia from the CAM4-BAM model, respectively. Both the dust AOD and loading have the largest values (AOD > 0.65, Loading > 1.5 g m−2) in MAM (March–April–May), indicating that the largest dust cycle is in MAM. Hence, in the following subsection, we will concentrate on the season of MAM to analyze the dust cycle and radiative forcing of dust over East Asia.

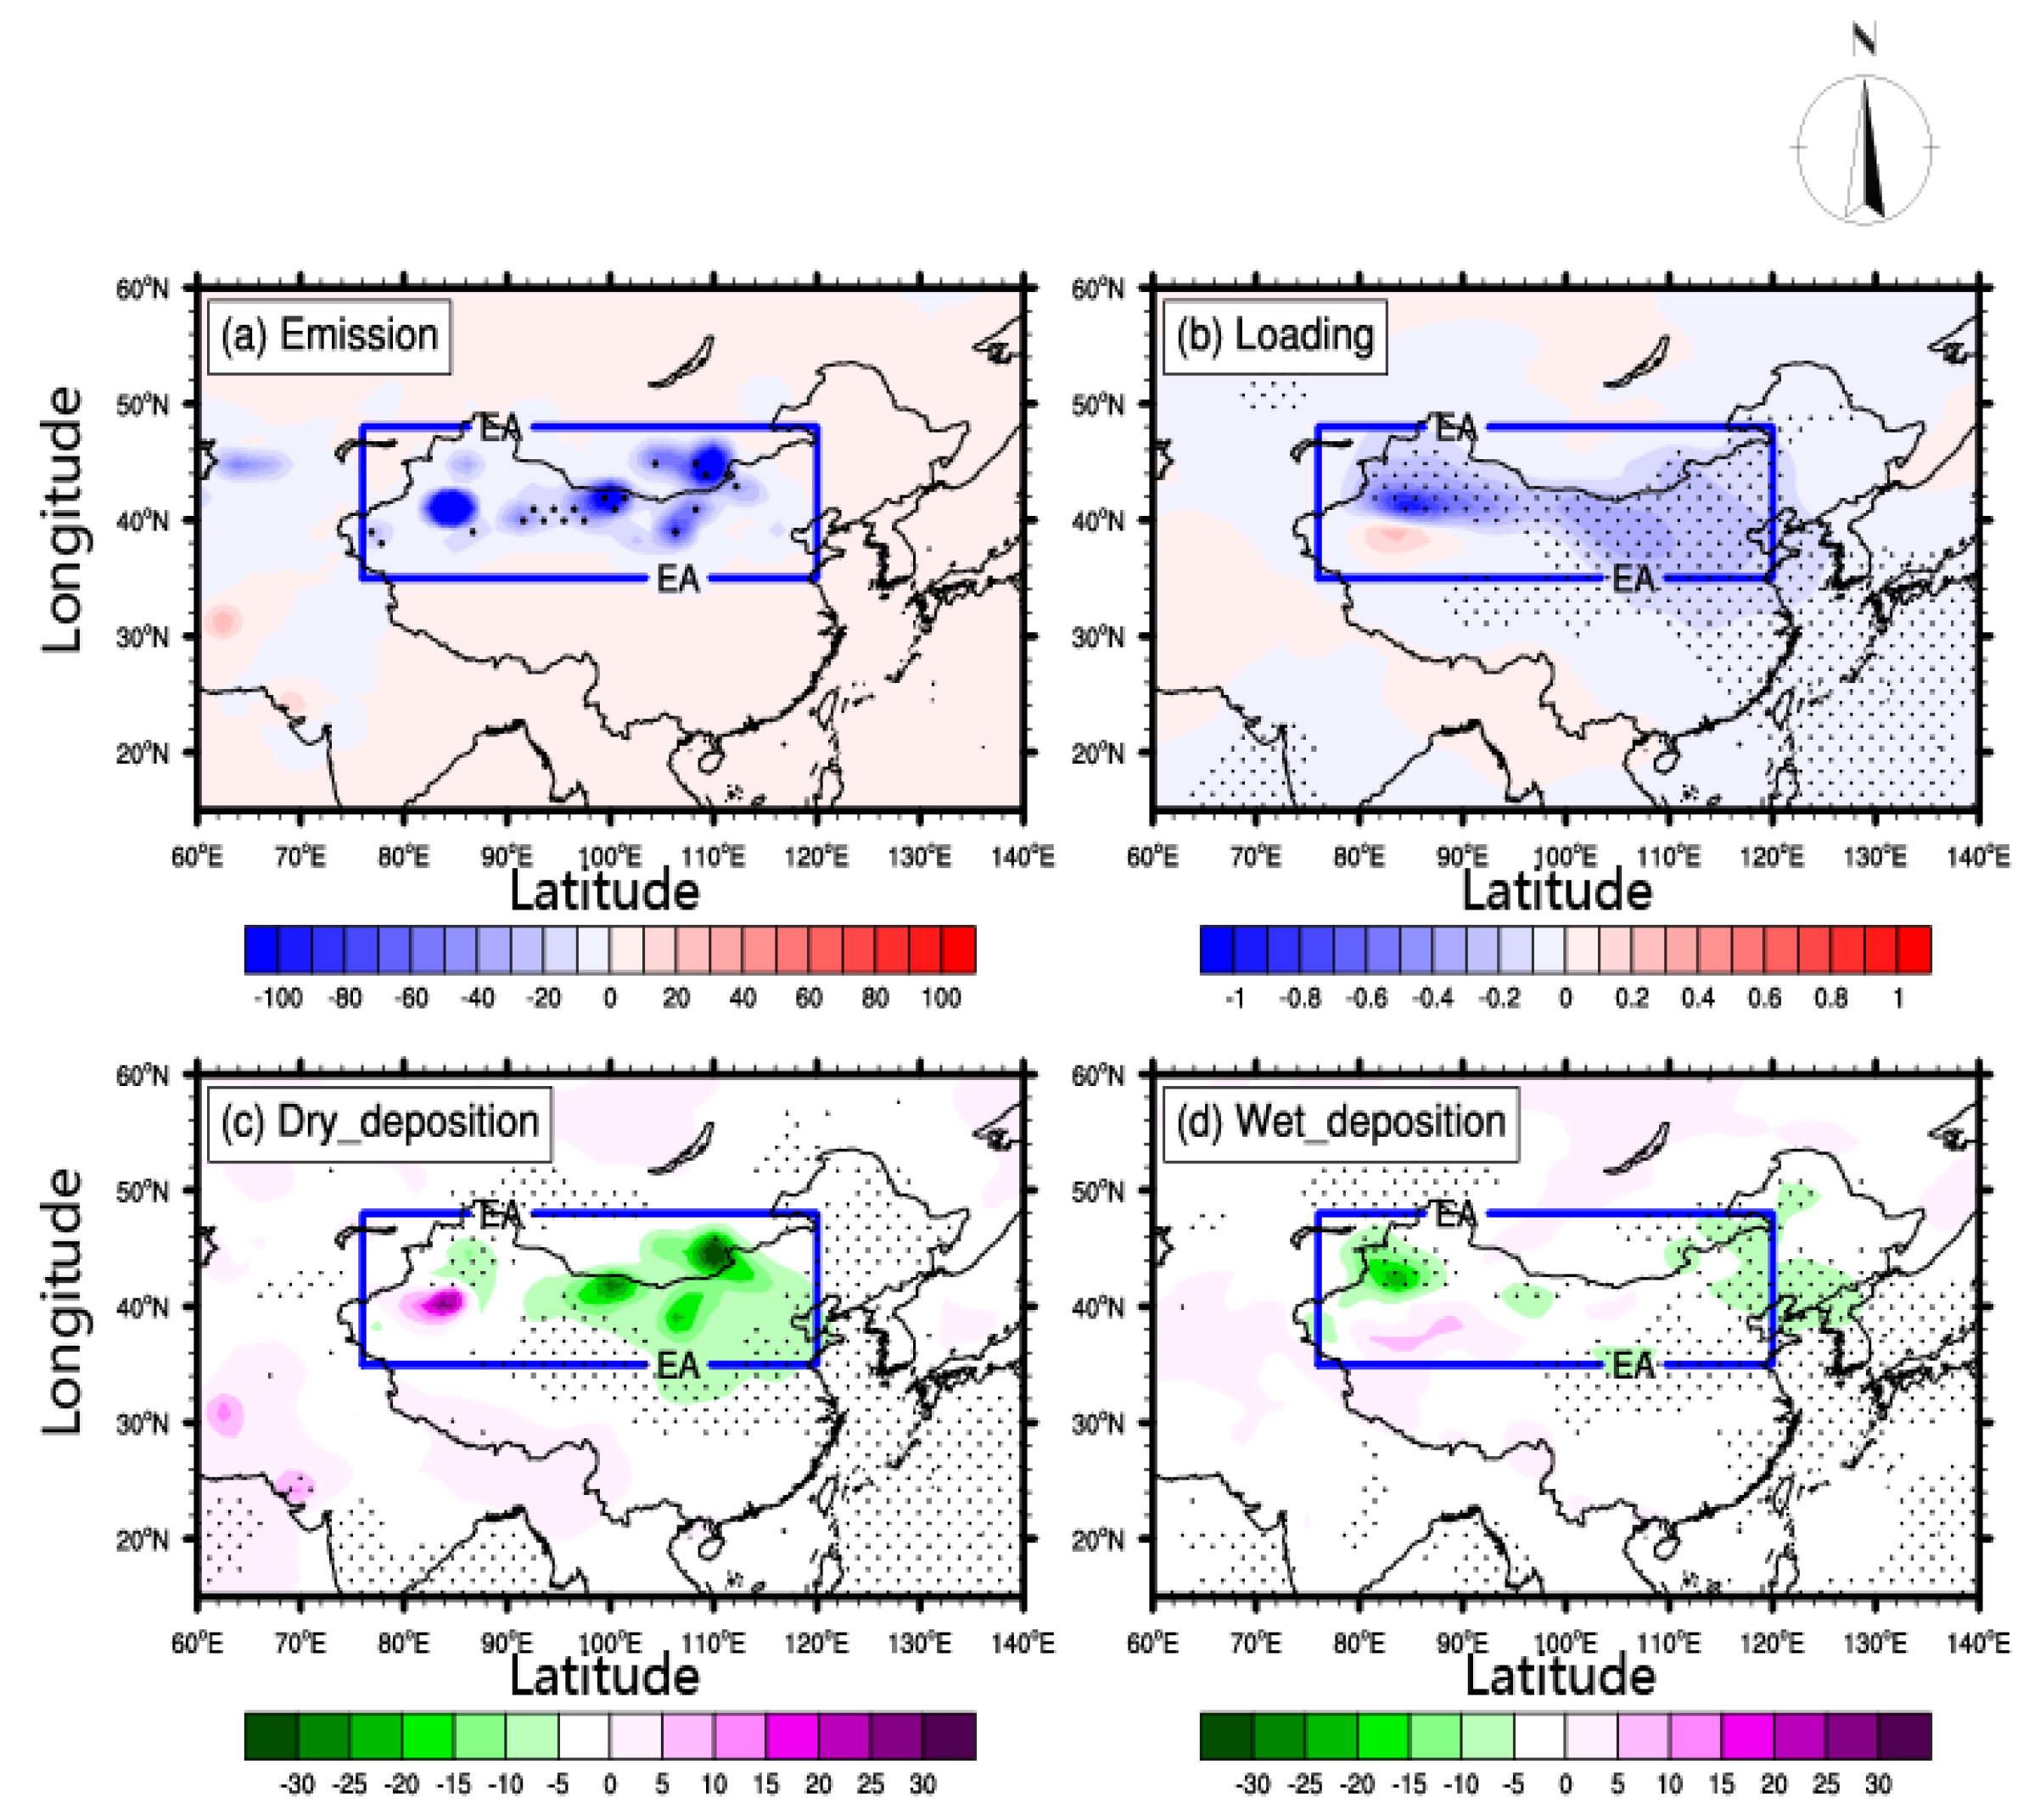
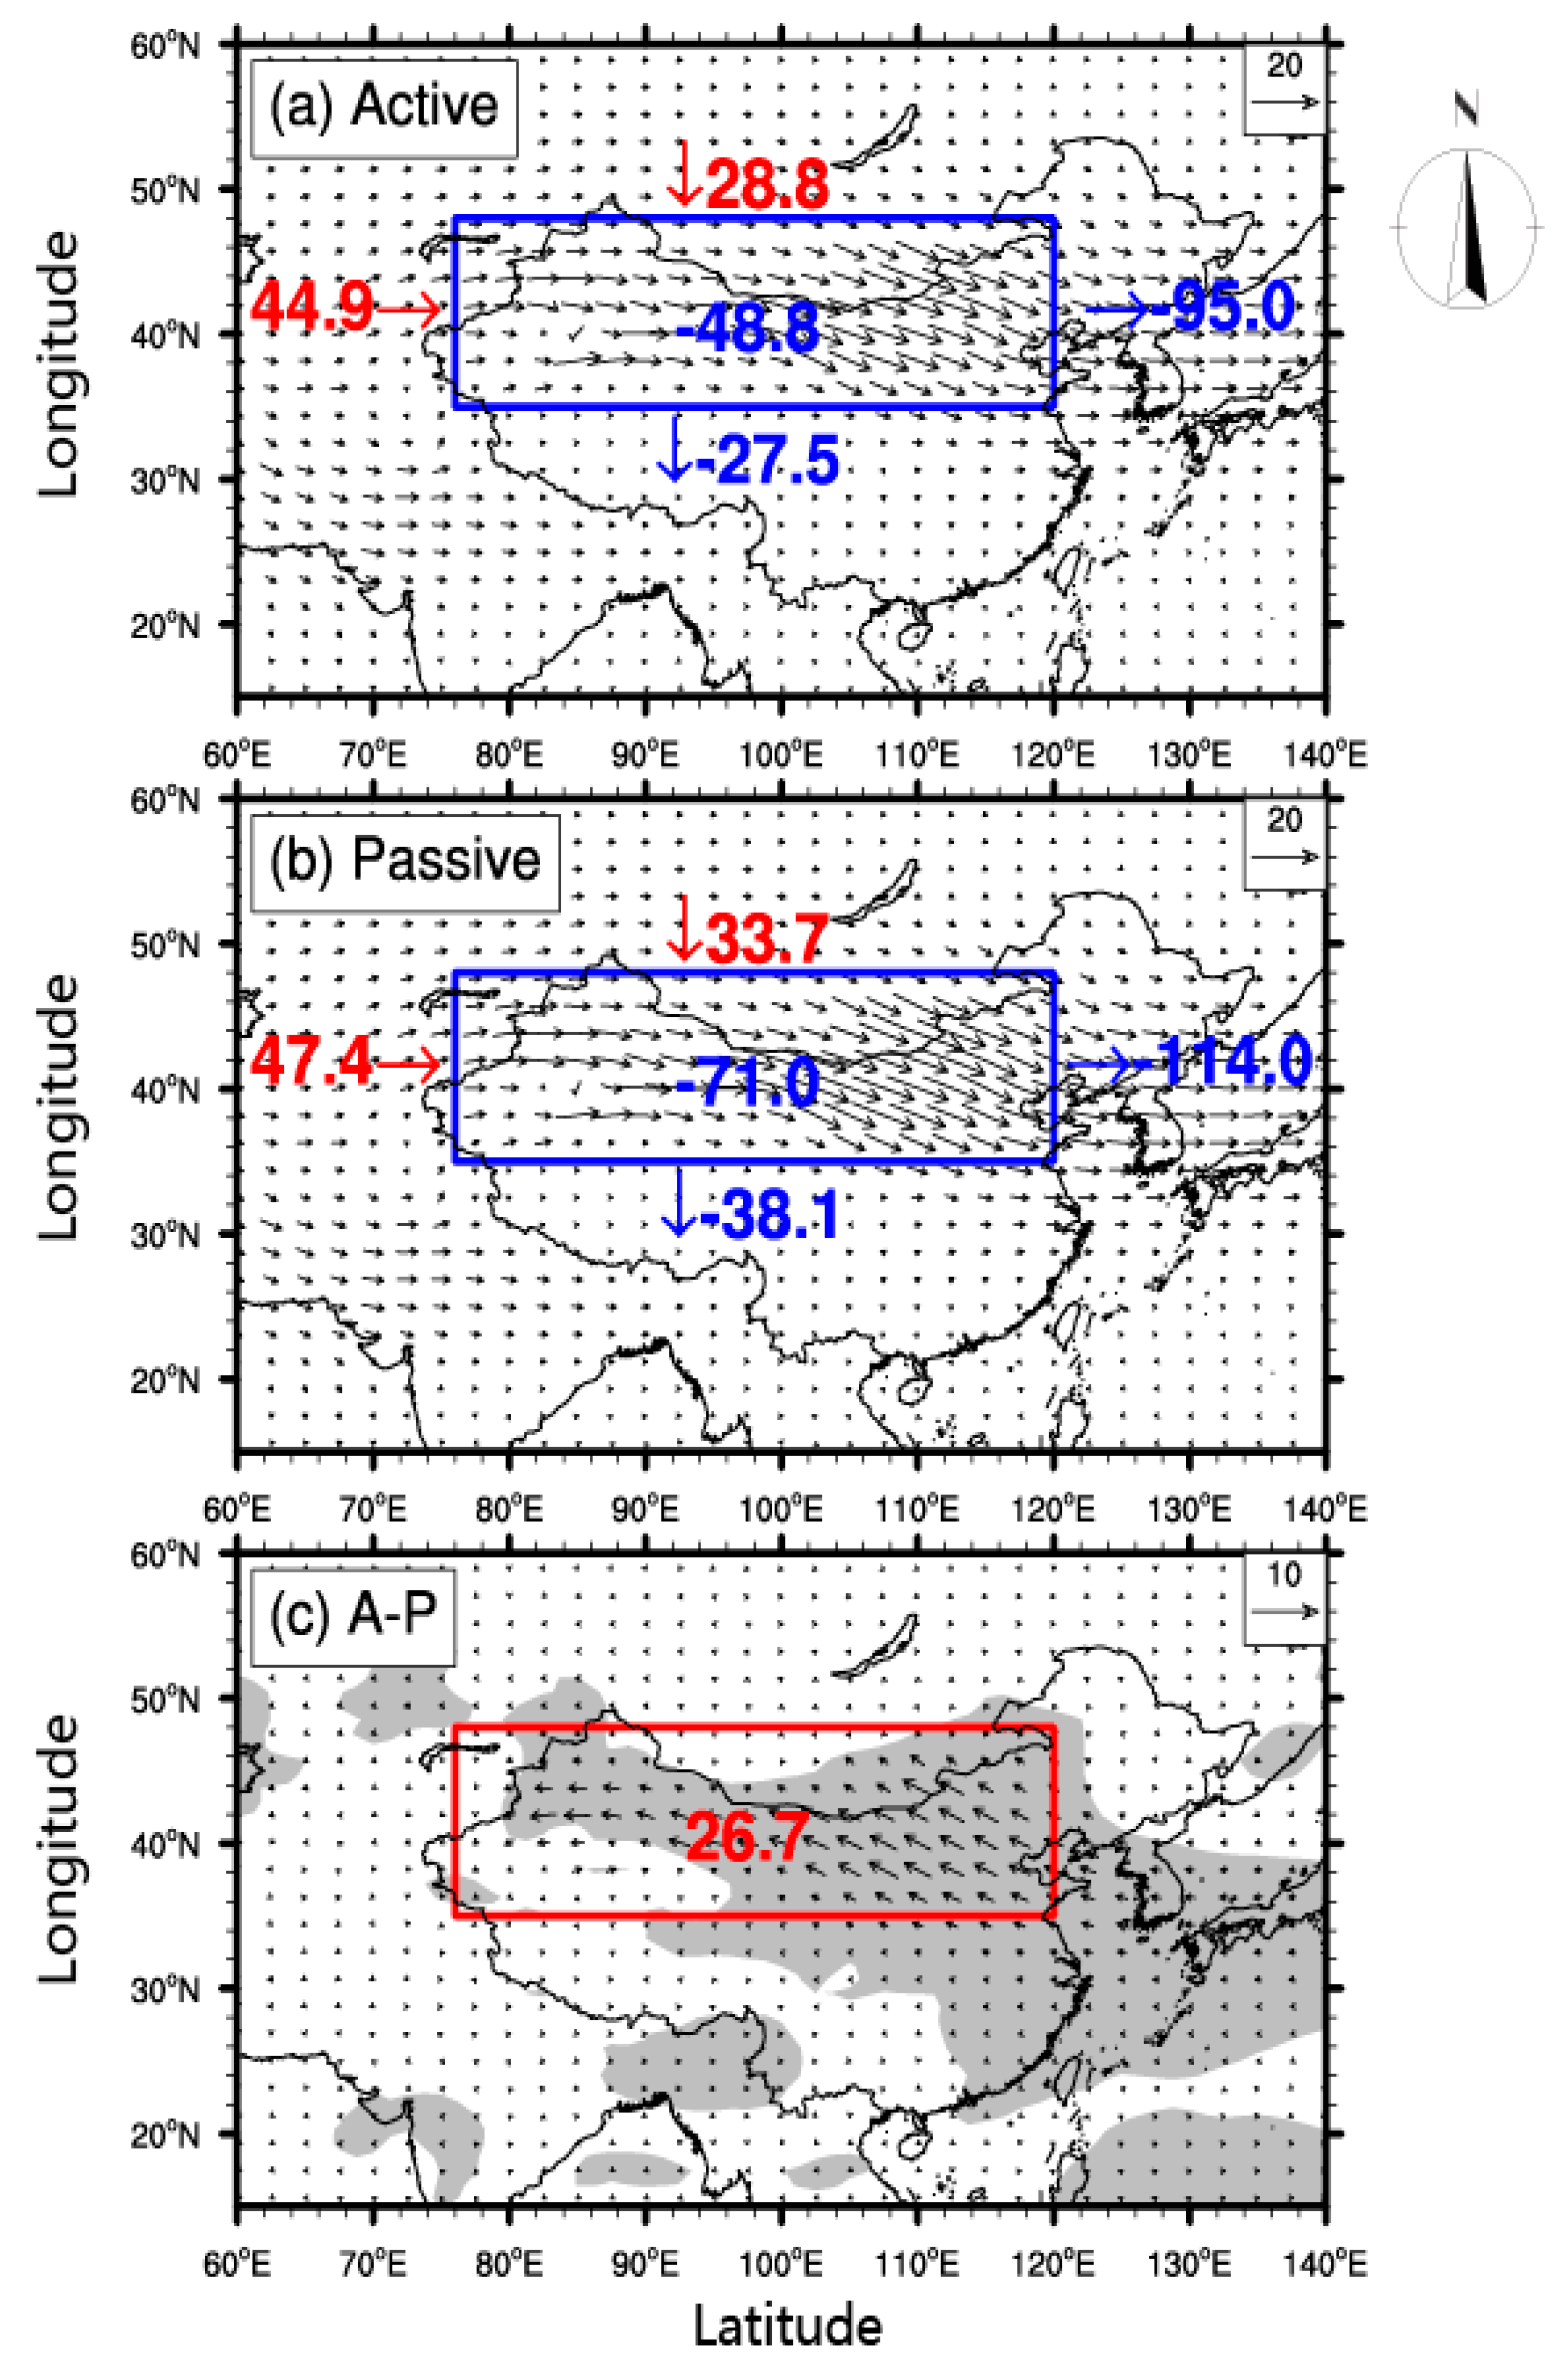
3.2. Changes in the Dust Cycle Induced by DRF

It is well known that the DRF can influence its own cycle via inducing atmospheric thermal structure and surface winds [21,48,49]. This subsection investigates changes in the key processes of the dust cycle through the LGM active minus passive experiments to identify the extent of DRF influence.
Figure 2 compares the differences in the MAM-mean dust cycle induced by DRF in the LGM (Active–Passive) over East Asia, including dust emissions, loading, and dry and wet depositions. The figure shows that the dust emissions over East Asia all significantly decrease due to the DRF effect (Figure 2a). The dust loading, and dry and wet depositions almost decrease over the entirety of East Asia except a small part in the west (Figure 2b–d). The regional means for these variables over East Asia are summarized in Table 3. The DRF decreases the dust emissions over this region by 10.7%, which is 78.2 Tg season−1. The corresponding dry and wet depositions are also decreased over this region by the DRF, with rates of 6.8%, 14.6%, respectively. Consequently, as the above processes of the dust cycle weaken, the dust loading is also reduced by 10.2% over East Asia due to the effect of DRF.
To measure the influence of the DRF on dust transport, the three-month (MAM) averaged dust transport flux (the dust concentration multiplied by the wind speed) was computed through the vertical sections from the surface up to the model top (Figure 3). This flux value was widely used to estimate the amount and direction of dust transport [50,51]. In both active and passive experiments, as the prevailing mid-latitude free-tropospheric winds in MAM are westerly [52], the dust over East Asia generally appears a pattern of zonal transport. The major branch of dust transport flux stretches from western China to Mongolia and to the regions of northeastern China and Korea (Figure 3a,b). The dust transport calculations could be biased if only monthly averages are included. However, driven by the mid-latitude prevailing westerlies [52], the dust transport presented a climatological pattern in the zonal direction in both LGM Active and Passive simulations. Therefore, the calculation of seasonal dust transport over East Asia could be generally acceptable in our study on climate changes (not dust episodes), based on the differences between the LGM Active and Passive experiments. Figure 3c shows the difference of the dust transport flux between LGM Active and Passive experiments. Reverse westward transport of dust was found in East Asia, indicating that the DRF can also weaken the dust transport. The MAM net masses of dust transported through the vertical sections at all borders of the East Asia region were also calculated. Since East Asia is mostly located in the mid-latitudes, it could be expected that the dust transport over East Asia is dominant in the eastward direction along the mid-latitude westerly belt. The meridional transport of dust is not significant, as its values at the northern (input) and southern (output) borders are nearly balanced in both the LGM active and passive simulations (Figure 3a,b). The dust imports (active: 44.9 Tg season−1, passive: 47.4 Tg season−1) across the western border, together with the strong local emission, provide the largest transport mass to the downwind regions, resulting in strong exports in the eastern border in both LGM Active (95.0 Tg season−1) and Passive (114.0 Tg season−1) experiments. Based on the net transport masses across all borders, East Asia is a net “exporting” region of dust during the LGM, with about −48.8 Tg in MAM (Figure 3a). Compared with the LGM Passive simulation, the net export of dust over East Asia reduced by 27.0 Tg season−1 in the Active simulation (Figure 3c), implying that the dust transport is also weakened by the DRF effect.

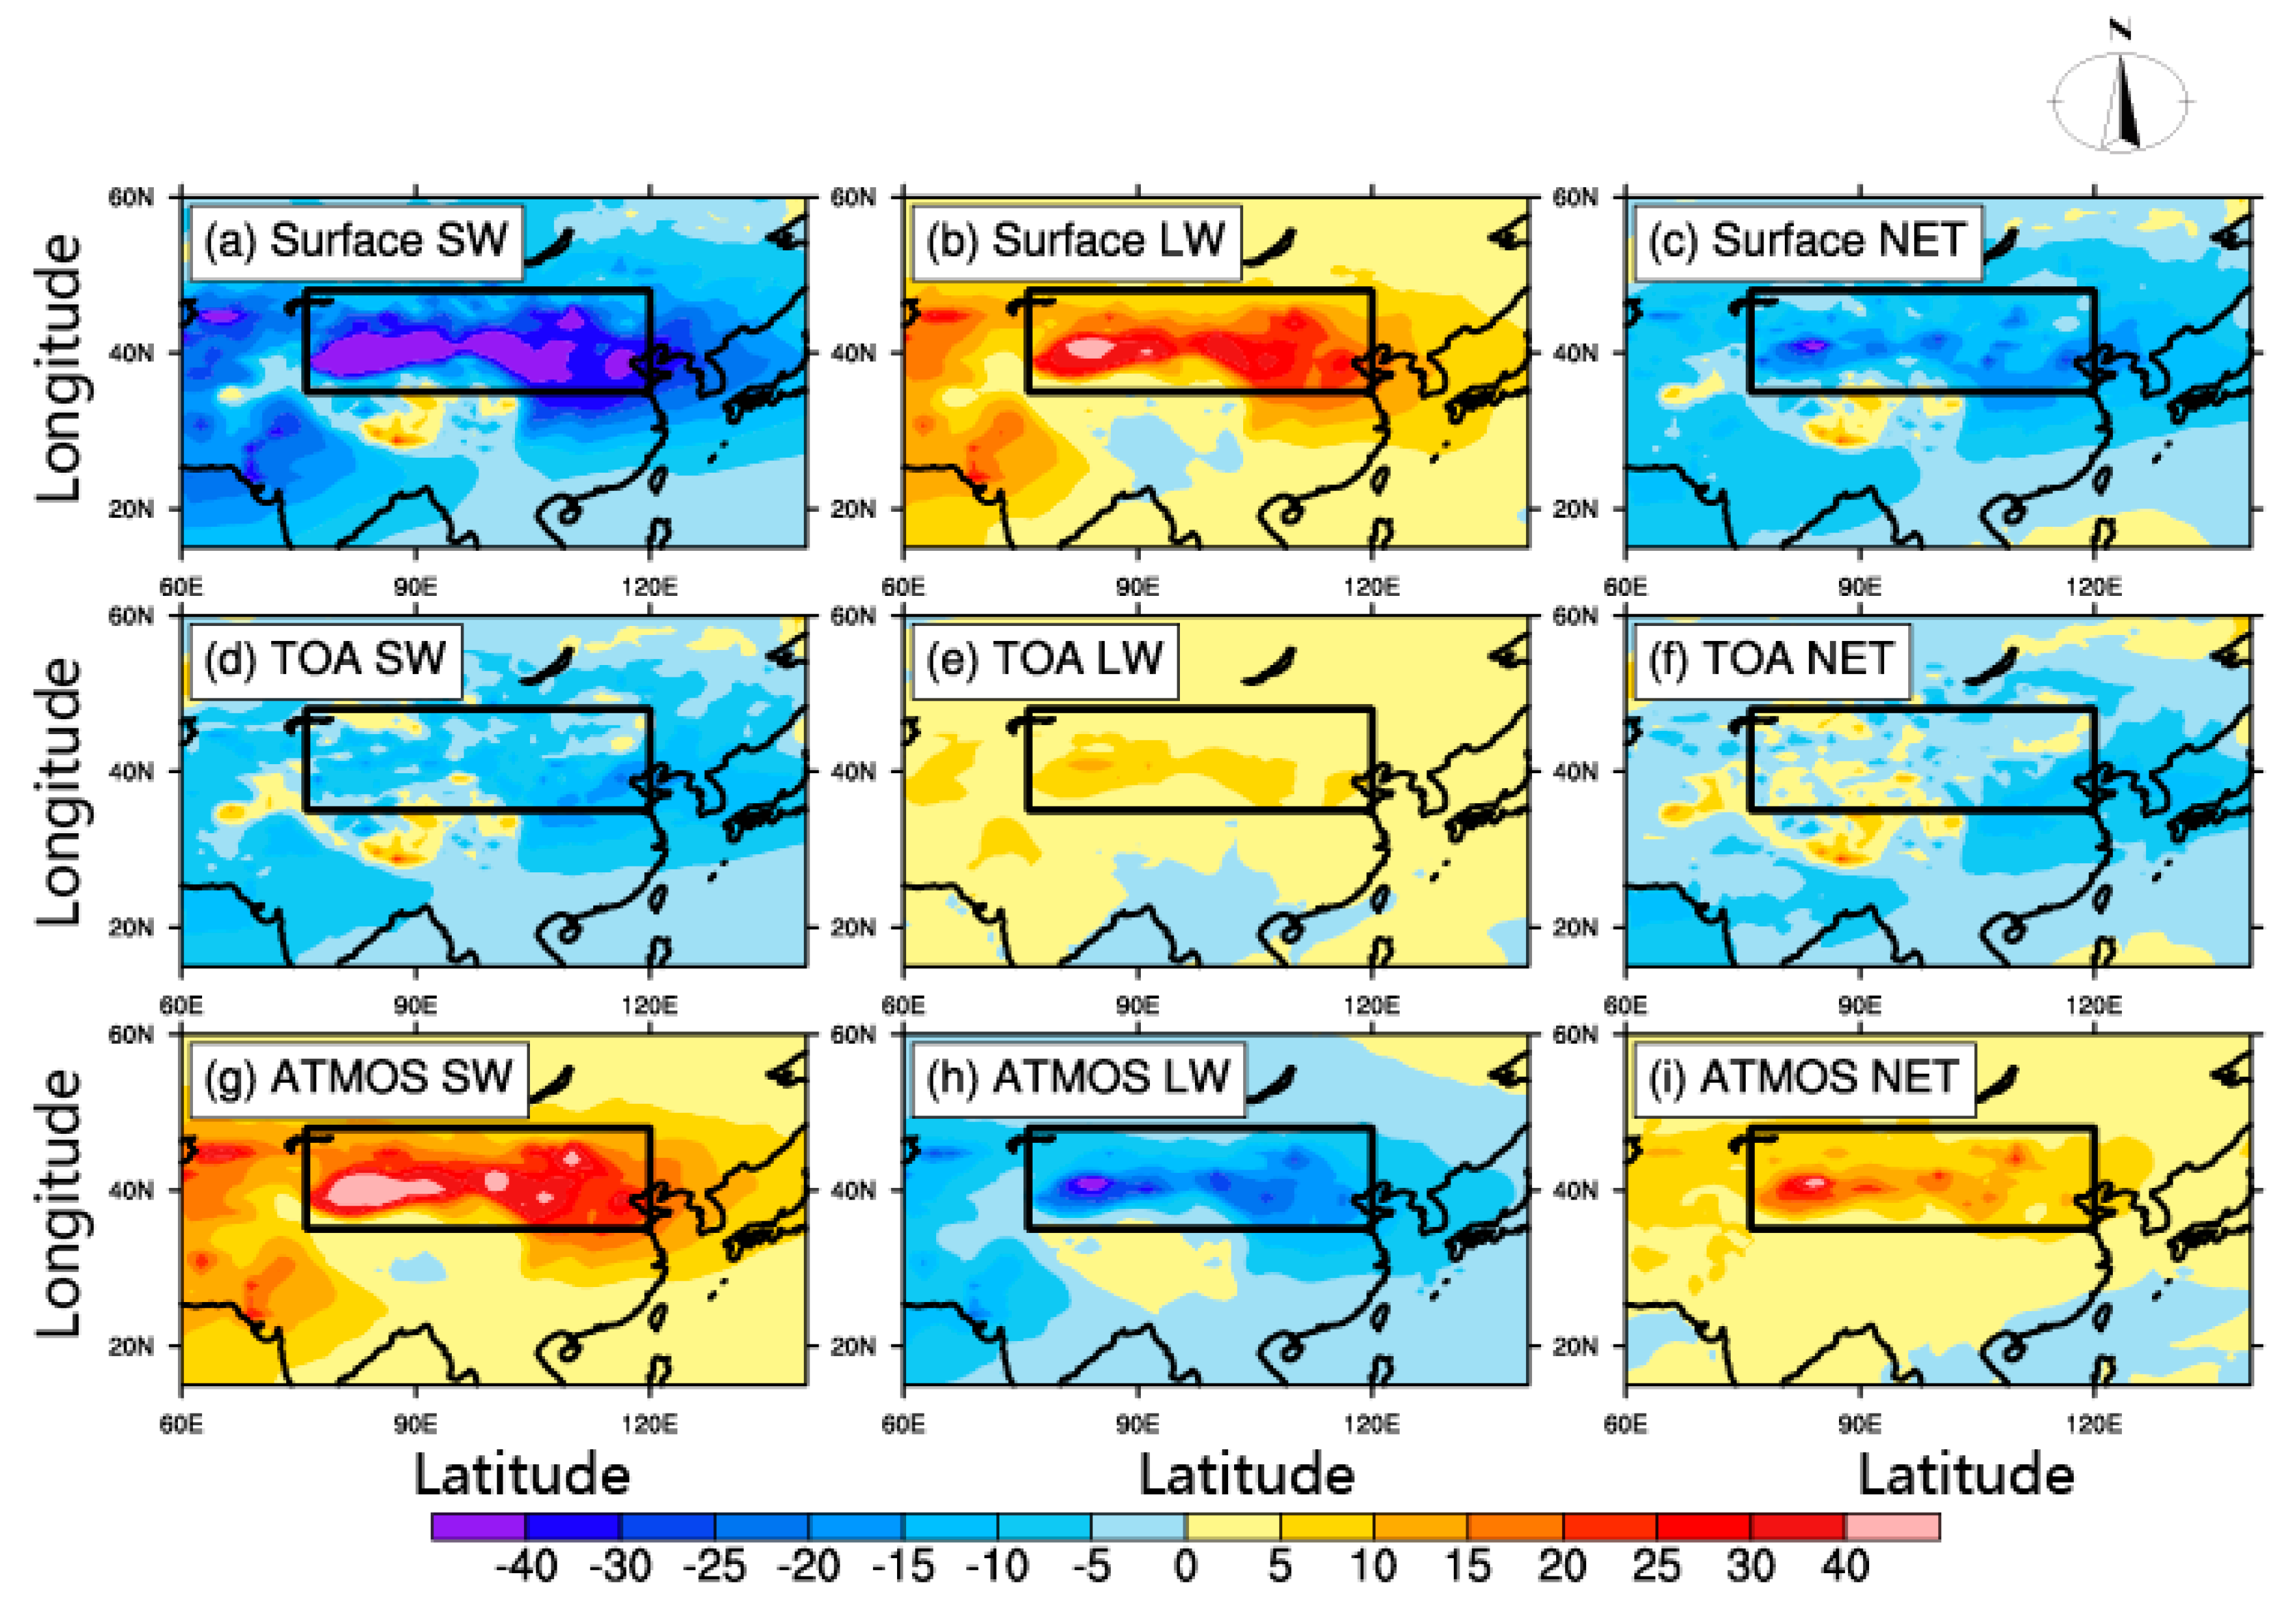
3.3. Dust Radiative Forcing and Dust Radiative Feedbacks

Figure 4 shows the spatial distributions of differences in MAM dust radiative forcing between the LGM Active and Passive numerical experiments, including shortwave (SW), longwave (LW), and net (SW + LW) components (at the surface, at the TOA, and in the atmosphere) for clear-sky radiative forcing. It is noted that the difference in the radiative forcing is significant almost everywhere over East Asia (not shown in the figures). The corresponding regional averaged values over East Asia are summarized in Table 4. The regional averaged SW DRF of dust is negative at the surface (−28.9 W m−2), while the LW DRF is positive (17.1 W m−2), offsetting to some extent the SW effect (Table 4). Consequently, there is a net negative radiative forcing at the surface (−11.8 W m−2) over eastern Asia, where it is much larger and statistically significant over the Taklimakan and Gobi deserts (Figure 4a). This is mainly because the high scattering efficiency of large amounts of dust aerosols over these two dust source regions results in a larger surface negative radiative forcing. The SW of dust forcing at the TOA is negative (−7.0 W m−2) over East Asia, but the LW forcing is positive (4.4 W m−2) since the dust aerosols trap the outgoing longwave radiation at the TOA (Figure 4e). Additionally, the net radiative forcing by dust aerosols in the atmosphere is positive over East Asia by the combined effects of high scattering for SW and trapping of outgoing LW forcing. The spatial distribution of all-sky radiative forcing shares a similar pattern compared to the clear-sky conditions (not shown). The magnitudes of the all-sky radiative forcing at the surface, at the TOA, and in the atmosphere are slightly smaller than those in the clear-sky in Table 4, resulting from the perturbations of cloud radiative forcing induced by dust radiative feedback. Albani et al. [24] summarized the global averaged net TOA DRF in the existing model studies for LGM, including both the SW and LW in a range between −0.02 and −3.20 W m−2. Our global averaged DRF at the TOA is −0.32 W m−2, which is the same as the result from Albani et al. [31], and is within the range estimated by other models. It is evident that the DRF over East Asia is quite a lot larger than the global average, which probably links to the higher local dust loading.
Figure 5 shows the corresponding changes in the surface sensible heat flux and the surface wind speed induced by DRF in MAM. The surface negative net radiative forcing (Figure 4c) causes a reduction in the sensible heat flux from the ground into the atmosphere over East Asia (Figure 5a). The generation of turbulent energy was highly correlated with the heat flux (mainly sensible heat fluxes) produced by radiation and the momentum flux caused by wind shear [42]. As presented in Section 2.2, the Ri could describe the turbulent stability not only from the perspective of thermal forces, but also from the perspective of mechanical forces. The spatial distributions of the Ri in two types of LGM simulations are shown in Figure 6. The values of Ri over East Asia are all less than 1.0, indicating the strong turbulence and mixing in the low-level atmosphere during LGM. This strong mixing condition leads the strong dust emission and then high loading in the same period (Figure 2d). The regional mean Ri over East Asia in the Active simulation (Ri = 0.72) is larger than that in Passive simulation (Ri = 0.64), implying that the DRF has increased the stability and lowered the mixing in the PBL. This reduced mixing would cause less acceleration at the surface, consistent with the negative wind anomaly (Figure 5b). Hence, the decreased surface wind speed can reduce the emission flux of dust aerosols, leading to the weakened dust cycle (Figure 2 and Figure 3c). This PBL mechanism associated with the dust emission feedback has been proposed by Miller et al. [16] and Heinold et al. [53].
The negative dust–DRF–emission feedback during the LGM has been investigated in our study. The following question is to what extent this feedback was strengthened in the LGM compared to the current climate. The key processes of dust cycles in MAM for the dust regions over East Asia in PD Active–Passive experiments are summarized in Table 5. Compared to the counterparts in the LGM (Table 3), the magnitudes of the dust emission, dry and wet depositions, and loading in both LGM simulations have all increased by a factor of about eight. Specially, the dust emissions in the LGM over East Asia are reduced by amounts of −77.2 Tg season−1 by the negative DRF–emission feedback, compared to the current climate with −6.8 Tg season−1. But the two ratios of these reductions to their emissions are close, with −10.7% for the LGM and −7.5% for the current climate.
Figure 7 presents the seasonal changes in dust emissions changes induced by the DRF, with seasonal reduction amounts of 78.2, 12.6, 23.6, and 26.0 Tg in spring (MAM), summer (JJA), autumn (SON), and winter (DJF), respectively. Evidently, the decrease in the spring (MAM) dust emission dominated, accounting for 56% of the annual decrease in dust emissions. Therefore, we focus on the DRF and its feedbacks on the dust cycle during MAM in this study.

4. Summary and Conclusions

In this paper, the improved CAM4-BAM by Albani et al. [31] was used to evaluate the East Asian dust cycle during LGM. The two numerical experiments were completed and intercompared with and without the dust direct radiative effects (DRF) for LGM and PD, respectively. Their differences were used to study the radiative feedbacks of dust aerosols over East Asia during these two periods.
Our results showed that the dust AOD and loading over East Asia exhibited a significant increase in LGM compared to current climate by a factor of five, or even to eight in dust source areas. According to the differences between the LGM Active and Passive experiments, the dust emissions, loading, and dry and wet depositions over East Asia have been weakened significantly with the DRF. Over East Asia, the DRF decreases the surface sensible heat, mainly owing to the negative surface forcing. The decreased surface sensible heat weakens the turbulent energy in the planetary boundary layer (PBL), which is reflected by the value of Ri. The surface wind speed has been significantly reduced by the PBL mechanism, which then weakens the regional dust emissions. With this PBL mechanism, this process can create a negative DRF–emission feedback loop to affect the dust cycle. Further analysis reveals that the dust emissions in the LGM over East Asia are reduced by amounts of −77.2 Tg season−1 by the negative DRF–emission feedback, compared to the current climate with −6.8 Tg season−1. However, the two ratios of these reductions to their emissions are close, with -10.7% for the LGM and −7.5% for the current climate.
More recently, the radiative forcing in dust-in-snow over the Tibetan Plateau enhances the dust cycle over East Asia, especially increasing the dust emissions significantly, and hence creating a positive feedback [41]. Since the LGM climate is an ideal target to test the inclusion of new processes in models, the positive feedback of dust-in-snow in the LGM can offer a unique opportunity to improve understanding of the mechanisms controlling the global dust cycle, which will be our future work.

Author Contributions

X.X. and X.C. conceived and designed the experiments; X.X. performed the experiments; X.C. analyzed the data and wrote the manuscript; Z.S., X.L. (Xinzhou Li), X.L. (Xiaodong Liu), and T.Z. commented on the manuscript.

Funding

This work was jointly supported by National Key Research and Development Program of China (2016YFA0601904), the Strategic Priority Research Program of Chinese Academy of Sciences (XDA20070103), the National Natural Science Foundation of China (41690115), the Key Project of Air Pollution Cause and Control (DQGG0104), and the Program for Postgraduates Research and Innovation in Universities of Jiangsu Province (KYLX15_0863).

Conflicts of Interest

The authors declare no conflict of interest.

References

  1. Carslaw, K.S.; Boucher, O.; Spracklen, D.V.; Mann, G.W.; Rae, J.G.L.; Woodward, S.; Kulmala, M. A review of natural aerosol interactions and feedbacks within the Earth system. Atmos. Chem. Phys. 2010, 10, 1701–1737. [Google Scholar] [CrossRef] [Green Version]
  2. DeMott, P.J.; Prenni, A.J.; Liu, X.; Kreidenweis, S.M.; Petters, M.D.; Twohy, C.H.; Richardson, M.S.; Eidhammer, T.; Rogers, D.C. Predicting global atmospheric ice nuclei distributions and their impacts on climate. Proc. Natl. Acad. Sci. USA 2010, 107, 11217–11222. [Google Scholar] [CrossRef] [PubMed] [Green Version]
  3. Mahowald, N.; Albani, S.; Kok, J.F.; Engelstaeder, S.; Scanza, R.; Ward, D.S.; Flanner, M.G. The size distribution of desert dust aerosols and its impact on the Earth system. Aeolian Res. 2014, 15, 53–71. [Google Scholar] [CrossRef] [Green Version]
  4. Liu, X.; Shi, X.; Zhang, K.; Jensen, E.J.; Gettelman, A.; Barahona, D.; Nenes, A.; Lawson, P. Sensitivity studies of dust ice nuclei effect on cirrus clouds with the Community Atmosphere Model CAM5. Atmos. Chem. Phys. 2012, 12, 12061–12079. [Google Scholar] [CrossRef] [Green Version]
  5. Lau, K.M.; Kim, K.M.; Sud, Y.C.; Walker, G.K. AGCM study of responses of the atmospheric water cycle of West Africa and the Atlantic to Saharan dust radiative forcing. Ann. Geophys. 2009, 27, 4023–4037. [Google Scholar] [CrossRef]
  6. Chappell, A.; Webb, N.P.; Butler, H.J.; Strong, C.; Mctainsh, G.H.; Leys, J.; Rossel, R.A.V. Soil organic carbon dust emission: An omitted global source of atmospheric CO2. Glob. Chang. Biol. 2013, 19, 3238–3244. [Google Scholar] [CrossRef] [PubMed]
  7. Bopp, L.; Kohfeld, K.E.; Le Quere, C.; Aumont, O. Dust impact on marine biota and atmospheric CO2 during glacial periods. Paleoceanography 2003, 18, 1046. [Google Scholar] [CrossRef]
  8. Shao, Y.; Wyrwoll, K.H.; Chappell, A.; Huang, J.P.; Lin, Z.H.; McTainsh, G.H.; Mikami, M.; Tnaka, T.Y.; Wang, X.L.; Yoon, S. Dust cycle: An emerging core theme in Earth system science. Aeolian Res. 2011, 2, 181–204. [Google Scholar] [CrossRef]
  9. Kok, J.F.; Ward, D.S.; Mahowald, N.M.; Evan, A.T. Global and regional importance of the direct dust-climate feedback. Nat. Commun. 2018, 9, 241. [Google Scholar] [CrossRef] [Green Version]
  10. Miller, R.L.; Tegen, I. Climate response to soil dust aerosols. J. Clim. 1998, 11, 3247–3267. [Google Scholar] [CrossRef]
  11. Yue, X.; Wang, H.; Wang, Z.; Fan, K. Simulation of dust aerosol radiative feedback using the global transport model of dust: 1. Dust cycle and validation. J. Geophys. Res. 2009, 114, D10202. [Google Scholar] [CrossRef]
  12. Richter, D.; Gill, T. Challenges and opportunities in atmospheric dust emission, chemistry, and transport. Bull. Am. Meteorol. Soc. 2018, 99, es115–es118. [Google Scholar] [CrossRef]
  13. Intergovernmental Panel on Climate Change (IPCC). The physical Science Basis. Contribution of Working Group I to the Fifth Assessment Report of the Intergovernmental Panel on Climate Change; Cambridge Univ. Press: Cambridge, UK; New York, NY, USA, 2013; Chapter 5; p. 51. [Google Scholar]
  14. Huneeus, N.; Schulz, M.; Balkanski, Y.; Griesfeller, J.; Prospero, J.; Kinne, S.; Zender, C.S. Global dust model intercomparison in AeroCom phase I. Atmos. Chem. Phys. 2011, 11, 7781–7816. [Google Scholar] [CrossRef] [Green Version]
  15. Mahowald, N.M.; Kloster, S.; Engelstaedter, S.; Moore, J.K.; Mukhopadhyay, S.; McConnell, J.R.; Albani, S.; Doney, S.C.; Bhattacharya, A.; Curran, M.A.J. Observed 20th century desert dust variability: Impact on climate and biogeochemistry. Atmos. Chem. Phys. 2010, 10, 10875–10893. [Google Scholar] [CrossRef]
  16. Miller, R.L.; Perlwitz, J.; Tegen, I. Feedback upon dust emission by dust radiative forcing through the planetary boundary layer. J. Geophys. Res. Atmos. 2004, 109, D24209. [Google Scholar] [CrossRef]
  17. Pérez, C.; Nickovic, S.; Pejanovic, G.; Baldasano, J.M.; Ozsoy, E. Interactive dust-radiation modeling: A step to improve weather forecasts. J. Geophys. Res. Atmos. 2006, 111, D16206. [Google Scholar] [CrossRef]
  18. Xie, X.N.; Liu, X.D.; Che, H.Z.; Xie, X.X.; Wang, H.L.; Li, J.D.; Shi, Z.G.; Liu, Y.G. Modeling East Asian dust and its radiative feedbacks in CAM4-BAM. J. Geophys. Res. Atmos. 2018, 123, 1079–1096. [Google Scholar] [CrossRef]
  19. Gu, Y.; Xue, Y.; De Sales, F.; Liou, K.N. A GCM investigation of dust aerosol impact on the regional climate of North Africa and South/East Asia. Clim. Dynam. 2016, 46, 2353–2370. [Google Scholar] [CrossRef]
  20. Guo, J.; Yin, Y. Mineral dust impacts on regional precipitation and summer circulation in East Asia using a regional coupled climate system model. J. Geophys. Res. Atmos. 2015, 120, 10378–10398. [Google Scholar] [CrossRef]
  21. Han, Z.W.; Li, J.W.; Xia, X.G.; Zhang, R.J. Investigation of direct radiative effects of aerosols in dust storm season over East Asia with an online coupled regional climate-chemistry-aerosol model. Atmos. Environ. 2012, 54, 688–699. [Google Scholar] [CrossRef]
  22. Zhang, D.F.; Zakey, A.S.; Gao, X.J.; Giorgi, F.; Solmon, F. Simulation of dust aerosol and its regional feedbacks over East Asia using a regional climate model. Atmos. Chem. Phys. 2009, 9, 1095–1110. [Google Scholar] [CrossRef] [Green Version]
  23. Petit, J.R.; Jouzel, J.; Raynaud, D.; Barkov, N.I.; Barnola, J.M.; Basile, I.; Bender, M.; Chappellaz, J.; Davis, M.; Delaygue, G.; et al. Climate and atmospheric history of the past 420,000 years from the Vostok ice core, Antarctica. Nature 1999, 399, 429. [Google Scholar] [CrossRef]
  24. Albani, S.; Balkanski, Y.; Mahowald, N.; Winckler, G.; Maggi, V.; Delmonte, B. Aerosol-climate interactions during the last glacial maximum. Curr. Clim. Chang. Rep. 2018, 4, 99–114. [Google Scholar] [CrossRef]
  25. Petit, J.R.; Mourner, L.; Jouzel, J.; Korotkevich, Y.S.; Kotlyakov, V.I.; Lorius, C. Palaeoclimatological and chronological implications of the Vostok core dust record. Nature 1990, 343, 56–58. [Google Scholar] [CrossRef]
  26. Mahowald, N.M.; Kohfeld, K.; Hansson, M.; Balkanski, Y.; Harrison, S.P.; Prentice, I.C.; Schulz, M.; Rodhe, H. Dust sources and deposition during the last glacial maximum and current climate: A comparison of model results with paleodata from ice cores and marine sediments. J. Geophys. Res. Atmos. 1999, 104, 15895–15916. [Google Scholar] [CrossRef] [Green Version]
  27. Mahowald, N.M.; Yoshioka, M.; Collins, W.D.; Conley, A.J.; Fillmore, D.W.; Coleman, D.B. Climate response and radiative forcing from mineral aerosols during the last glacial maximum, pre-industrial, current and doubled-carbon dioxide climates. Geophys. Res. Lett. 2006, 33, L20705. [Google Scholar] [CrossRef]
  28. Lunt, D.J.; Valdes, P.J. Dust deposition and provenance at the last glacial maximum and present day. Geophys. Res. Lett. 2002, 29, 2085. [Google Scholar] [CrossRef]
  29. Takemura, T.; Egashira, M.; Matsuzawa, K.; Ichijo, H.; Oishi, R.; Abeouchi, A. A simulation of the global distribution and radiative forcing of soil dust aerosols at the last glacial maximum. Atmos. Chem. Phys. 2009, 9, 3061–3073. [Google Scholar] [CrossRef]
  30. Yue, X.; Wang, H.J.; Liao, H.; Jiang, D.B. Simulation of the direct radiative effect of mineral dust aerosol on the climate at the Last Glacial Maximum. J. Clim. 2011, 24, 843–858. [Google Scholar] [CrossRef]
  31. Albani, S.; Mahowald, N.M.; Perry, A.T.; Scanza, R.A.; Zender, C.S.; Heavens, N.G.; Maggi, V.; Kok, J.F.; Otto-Bliesner, B.L. Improved dust representation in the community atmosphere model. J. Adv. Model. Earth Syst. 2014, 6, 541–570. [Google Scholar] [CrossRef]
  32. Hopcroft, P.O.; Valdes, P.J.; Woodward, S.; Joshi, M.M. Last glacial maximum radiative forcing from mineral dust aerosols in an Earth System model. J. Geophys. Res. Atmos. 2015, 120, 8186–8205. [Google Scholar] [CrossRef]
  33. Neale, R.B.; Richter, J.H.; Conley, A.J.; Park, S.; Lauritzen, P.H.; Gettelman, A.; Williamson, D.L.; Rasch, P.J.; Vavrus, S.J.; Taylor, M.A.; et al. Description of the NCAR Community Atmosphere Model (CAM 4.0) (NCAR Tech. Note, TN–485); National Center for Atmospheric Research: Boulder, CO, USA, 2010. [Google Scholar]
  34. Zender, C.S.; Bian, H.; Newman, D. Mineral dust entrainment and deposition (DEAD) model: Description and 1990s dust climatology. J. Geophys. Res. 2003, 108, 4416. [Google Scholar] [CrossRef]
  35. Tie, X.; Madronich, S.; Walters, S.; Edwards, D.P.; Ginoux, P.; Mahowald, N.; Brasseur, G. Assessment of the global impact of aerosols on tropospheric oxidants. J. Geophys. Res. 2005, 110, D03204. [Google Scholar] [CrossRef]
  36. Ganopolski, A.; Calov, R.; Claussen, M. Simulation of the last glacial cycle with a coupled climate ice-sheet model of intermediate complexity. Clim. Past 2010, 6, 229–244. [Google Scholar] [CrossRef] [Green Version]
  37. Mahowald, N.M.; Muhs, D.R.; Levis, S.; Rasch, P.J.; Yoshioka, M.; Zender, C.S.; Luo, C. Change in atmospheric mineral aerosols in response to climate: Last glacial period, preindustrial, modern, and doubled carbon dioxide climates. J. Geophys. Res. 2006, 111, D10202. [Google Scholar] [CrossRef]
  38. Bauer, E.; Ganopolski, A. Sensitivity simulations with direct shortwave radiative forcing by aeolian dust during glacial cycles. Clim. Past 2014, 10, 1333–1348. [Google Scholar] [CrossRef] [Green Version]
  39. Albani, S.; Mahowald, N.M.; Murphy, L.N.; Raiswell, R.; Moore, J.K.; Anderson, R.F.; McGee, D.; Bradtmiller, L.I.; Delmonte, B.; Hesse, P.P. Paleodust variability since the Last Glacial Maximum and implications for iron inputs to the ocean. Geophys. Res. Lett. 2016, 43, 3944–3954. [Google Scholar] [CrossRef] [Green Version]
  40. Brady, E.C.; Otto-Bliesner, B.L.; Kay, J.E.; Rosenbloom, N. Sensitivity to glacial forcing in the CCSM4. J. Clim. 2013, 26, 1901–1925. [Google Scholar] [CrossRef]
  41. Peltier, W.R. Global glacial isostasy and the surface of the ice-age Earth: The ICE-5G (VM2) model and GRACE. Annu. Rev. Earth Planet Sci. 2004, 32, 111–149. [Google Scholar] [CrossRef]
  42. Maher, B.A.; Prospero, J.M.; Mackie, D.; Gaiero, D.; Hesse, P.P.; Balkanski, Y. Global connections between aeolian dust, climate and ocean biogeochemistry at the present day and at the last glacial maximum. Earth Sci. Rev. 2010, 99, 61–97. [Google Scholar] [CrossRef]
  43. Kalplan, J.O.; Bigelow, N.H.; Prentice, I.C.; Harrison, S.P.; Bartlein, P.J.; Christensen, T.R.; Cramer, W.; Matveyeva, N.V.; McGuire, A.D.; Murray, D.F.; et al. Climate change and Arctic ecosystems: 2. Modeling, paleodata-model comparisons, and future projections. J. Geophys. Res. Atmos. 2003, 108, 8171. [Google Scholar] [CrossRef]
  44. Xie, X.N.; Liu, X.D.; Che, H.Z.; Xie, X.X.; Li, X.Z.; Shi, Z.G.; Wang, H.L.; Zhao, T.L.; Liu, Y.G. Radiative feedbacks of dust-in-snow over eastern Asia in CAM4-BAM. Atmos. Chem. Phys. 2018, 18, 12683–12698. [Google Scholar] [CrossRef]
  45. Stull, R. An Introduction to Boundary Layer Meteorology; Kluwer Academic Publishers: Dordrecht, The Netherlands, 1988; pp. 405–440. [Google Scholar]
  46. Garratt, J. The Atmospheric Boundary Layer; Cambridge University Press: Cambridge, UK, 1994; p. 316. [Google Scholar]
  47. JAMSTEC; AORI; NIES. MIROC-ESM Model Output Prepared for CMIP5 lgm, Served by ESGF. World Data Center for Climate (WDCC) at DKRZ. 2015. Available online: https://doi.org/10.1594/WDCC/CMIP5.MIMElg (accessed on 15 March 2019).
  48. Colarco, P.R.; Nowottnick, E.P.; Randles, C.A.; Yi, B.Q.; Yang, P.; Kim, K.M.; Smith, J.A.; Bardeen, C.G. Impact of radiatively interactive dust aerosols in the NASA GEOS-5 climate model: Sensitivity to dust particle shape and refractive index. J. Geophys. Res. Atmos. 2014, 119, 753–786. [Google Scholar] [CrossRef] [Green Version]
  49. Heinold, B.; Tegen, I.; Schepanski, K.; Hellmuth, O. Dust radiative feedback on Saharan boundary layer dynamics and dust mobilization. Geophys. Res. Lett. 2008, 35, L20817. [Google Scholar] [CrossRef]
  50. Zhao, T.L.; Gong, S.L.; Zhang, X.Y.; Blanchet, J.P.; Mckendry, I.G.; Zhou, Z.J. A simulated climatology of Asian dust aerosol and its trans-Pacific transport. Part I: Mean climate and validation. J. Clim. 2006, 19, 88–103. [Google Scholar] [CrossRef]
  51. Gong, S.L.; Zhang, X.Y.; Zhao, T.L.; Zhang, X.B.; Barrie, L.A.; Mckendry, I.G.; Zhao, C.S. A simulated climatology of Asian dust aerosol and its trans-Pacific transport. Part II: Interannual variability and climate connections. J. Clim. 2006, 19, 104–122. [Google Scholar] [CrossRef]
  52. Wang, N.; Jiang, D.; Lang, X. Northern westerlies during the Last Glacial Maximum: Results from CMIP5 simulations. J. Clim. 2018, 31, 1135–1153. [Google Scholar] [CrossRef]
  53. Heinold, B.; Helmert, J.; Hellmuth, O.; Wolke, R.; Ansmann, A.; Marticorena, B.; Laurent, B.; Tegen, I. Regional modeling of Saharan dust events using LM-MUSCAT: Model description and case studies. J. Geophys. Res. Atmos. 2007, 112, D11204. [Google Scholar] [CrossRef]
Figure 1. Spatial distributions of the March–April–May (MAM) averaged dust AOD at 550 nm and loading derived from the present-day (PD) and Last Glacial Maximum (LGM) Active experiments. (a) AOD for PD, (c) AOD for LGM, (b) dust loading for PD, unit: g m−2 (d) dust loading for LGM, unit: g m−2, and (e) AOD and (f) loading for LGM/PD. The black rectangle contains the target area of East Asia (35–48° N; 76–120° E). Monthly dust (g) AOD and (h) loading (unit: g m−2) averaged over East Asia.
Atmosphere 10 00146 g001
Figure 2. Differences in MAM mean of (a) dust emissions (unit: g m−2 season−1), (b) dust loading (unit: g m−2), (c) dust dry deposition (unit: g m−2 season−1), and (d) dust wet deposition (unit: g m−2 season−1) between the LGM Active and Passive experiments. The blue rectangle contains the target area of East Asia (EA, 35–48° N; 76–120° E). The black dots represent the grid points with statistical significance above the 95% level.
Atmosphere 10 00146 g002
Figure 3. The dust transport flux through the vertical sections from the surface up to the model top in MAM (a) for the LGM Active and (b) LGM Passive (unit: g m−2 s−1) experiments. (c) The difference of the dust transport flux between the LGM Active and Passive experiments (unit: g m−2 s−1). The shadings (c) indicate the dust transport flux variations that are significant at the 95% confidence level. The net mass of dust transported in MAM through the borders of the East Asia region with the transport directions following the arrows (unit: Tg season−1).
Atmosphere 10 00146 g003
Figure 4. Differences in the radiative forcing (unit: W m−2) for clear-sky between the LGM Active and Passive experiments (ac) at the surface, (df) at the TOA, and (gi) in the atmosphere. Shown are net values with shortwave (SW, (a,d,g)), longwave (LW, (b,e,h)), and shortwave + longwave (NET, (c,f,i)) components in the MAM over East Asia (75° E–120° E and 35° N–48° N).
Atmosphere 10 00146 g004
Figure 5. Differences in (a) the surface sensible heat flux (W m−2) and (b) the surface wind speed (m s−1) between the LGM Active and Passive experiments in the MAM over East Asia. The black dots represent the grid points with statistical significance above the 95% level.
Atmosphere 10 00146 g005
Figure 6. Spatial distributions of the MAM averaged Ri derived from (a) the LGM Active and (b) the LGM Passive numerical experiments. The values in rectangles are the regional mean Ri over East Asia for the corresponding experiment.
Atmosphere 10 00146 g006
Figure 7. The reduction values in dust emissions (Tg season−1) in four seasons induced by the DRF including MAM, June–July–August (JJA), September–October–November (SON), and December–January–February (DJF).
Atmosphere 10 00146 g007
Table 1. Description of the model experiments in this work. Here, the “DRF” represents dust direct radiative forcing.
ExperimentsSimulated TimeDRF
Present-day Active21 years (1st year spin-up)Yes
Present-day Passive21 years (1st year spin-upNo
LGM Active21 years (1st year spin-up)Yes
LGM Passive21 years (1st year spin-up)No
Table 2. Simulated global dust emissions (Tg yr−1), dust loading (Tg), and dust AOD at 0.55 μm, and a summary of prior works for the LGM including the model with dust schemes in CMIP5/PMIP3.
Model/StudyEmissionLoadingAOD
Mahowald et al. [27]10,880620.096
Takemura et al. [29]620031-
Yue et al. [30]4579670.077
MIROC-ESM (CMIP5) [47]778134-
Albani et al. [31] (c4fn-lgm-s2)6705420.045
This work (LGM Active)6700420.040
Table 3. Dust budget in MAM for the dust regions over East Asia (35–48° N; 76–120° E) for the LGM Active and Passive experiments, as well as their difference (ratio).
Dust CycleActivePassiveDifference (Ratio)
Emission
(Tg season−1)
652.2730.4−78.2
(−10.7%)
Dry deposition
(Tg season−1)
370.8396.6−25.8
(−6.5%)
Wet deposition
(Tg season−1)
95.2111.6−16.4
(−14.6%)
Loading
(g m−2)
1.61.8−0.2
(−10.2%)
Table 4. Differences in the radiative forcing (unit: W m−2) in MAM for clear-sky and all-sky at the surface, at the TOA, and in the Atmosphere over East Asia for LGM Active–Passive Experiments.
Clear-Sky ForcingAll-Sky Forcing
Surface SW−29.0−24.5
Surface LW17.114.5
Surface NET−11.8−10.0
TOA SW−7.0−4.7
TOA LW4.43.3
TOA NET−2.7−1.4
ATMOS SW21.919.8
ATMOS LW−12.7−11.2
ATMOS NET9.18.7
Table 5. Dust budget in MAM for the dust regions over East Asia (35–48° N; 76–120° E) for the PD Active and Passive experiments, as well as their difference (ratio).
Dust CycleActivePassiveDifference (Ratio)
Emission
(Tg season−1)
83.490.3−6.8
(−7.5%)
Dry deposition
(Tg season−1)
41.243.9−2.7
(−6.6%)
Wet deposition
(Tg season−1)
15.015.5−0.5
(−3.0 %)
Loading
(mg m−2)
260.5273.3−12.8
(−3.7%)

