Article

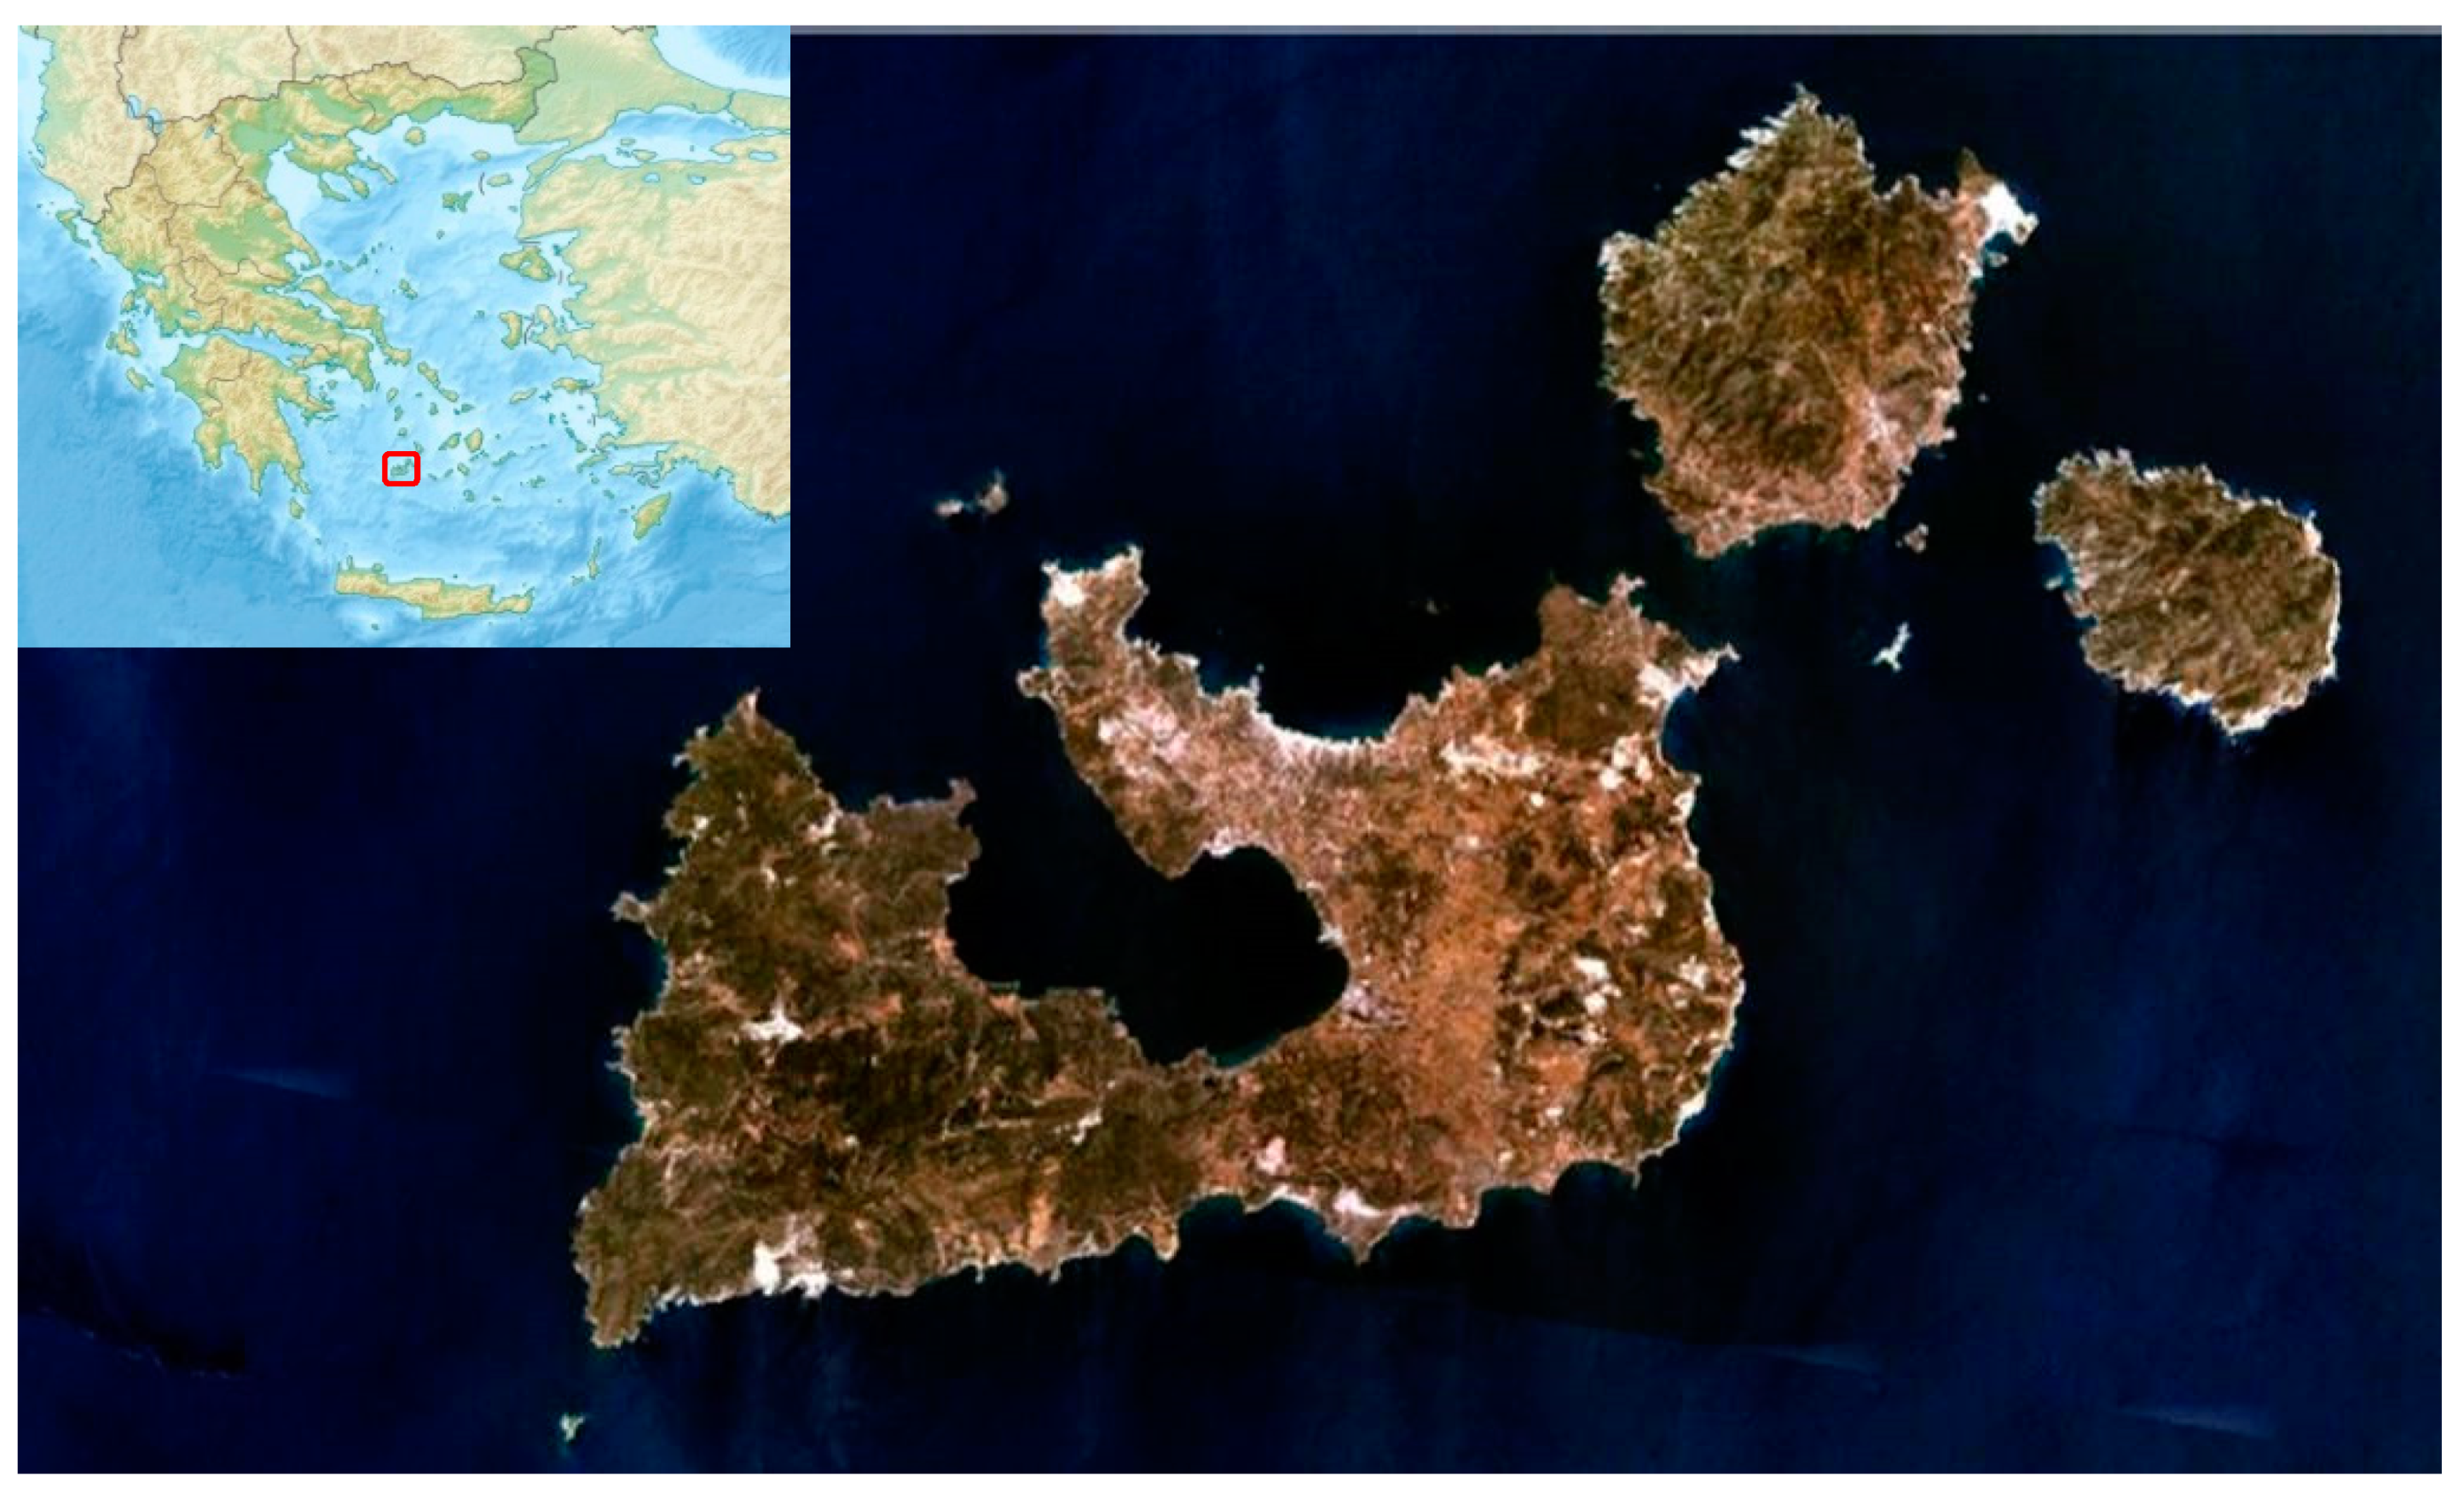
Present and Future Climate—Tourism Conditions in Milos Island, Greece

by
Panagiotis T. Nastos
1 and
Andreas Matzarakis
2,*
1
Laboratory of Climatology and Atmospheric Environment, Faculty of Geology and Geoenvironment, University of Athens, University Campus, GR-15784 Athens, Greece
2
Research Centre Human Biometeorology, German Meteorological Service, Stefan-Meier-Str. 4, D-79104 Freiburg, Germany
*
Author to whom correspondence should be addressed.
Atmosphere 2019, 10(3), 145; https://doi.org/10.3390/atmos10030145
Submission received: 9 February 2019 / Revised: 12 March 2019 / Accepted: 13 March 2019 / Published: 18 March 2019
(This article belongs to the Special Issue Tourism Climatology: Past, Present and Future)

Abstract

:
The objective of this study is to analyze the present and future climate-tourism conditions in Milos Island, Cyclades, Greece, by means of the assessment of the three climate components (physical, thermal, and aesthetic), which interprets the so-called climatic tourism potential. Milos Island is chosen as a representative island of the Cyclades complex in the Aegean Sea. Future climate change conditions are analyzed using the high-resolution simulations (grid size 0.11° × 0.11°) of the Regional Climate Model ALADIN 5.2 from Centre National de Recherche Meteorologiques, Meteo France (CNRM). The climate simulations concern the future periods 2021–2050 and 2071–2100 against the reference period 1961–1990, under two Representative Concentration Pathways, RCP4.5 and RCP8.5. Based on regional climate simulations, the tourism potential can be described in a meaningful and simple way by applying the Climate-Tourism-Information-Scheme (CTIS), which depicts detailed climate information that could be used by tourists to foresee the thermal comfort, aesthetic, and physical conditions for planning their vacations. More specifically, the thermal climate component is interpreted by the Physiologically Equivalent Temperature (PET), which is one of the most popular physiological thermal indices based on the human energy balance. The findings of the analysis could be used by stakeholders and the tourism industry in decision-making regarding the destination of Milos for tourism planning and touristic infrastructure development.

1. Introduction

Weather and climate are important factors for tourism decision-making [1,2,3,4]. As the environmental impact is very extensive, the attempt to promote off-peak tourism to traditional or other destinations represents one way of reducing the pressure on the environment [5]. On the other hand, an extension or a shift of the tourism period would be beneficial concerning the resilience and adaptation to global warming [6]. This is a crucial issue for touristic destinations in the Mediterranean, which is vulnerable to climate change, taking into account the climate projections by regional climate models [7]. The decision to make a trip is heavily influenced by the physical and economic potential of the person and by two important parameters: The preferences of the individuals configured by the climatic conditions prevailing in the place where they reside and the characteristics of the desired destination, such as the natural landscape, the cultural features, and the climate, that make it attractive [8,9]. In fact, climate and weather extremes, such as heat waves or storms, have a prominent ranking in the criteria for selecting a destination, but there are few empirical indications that express the interaction between weather and climate on the one hand and tourist and recreation on the other. In two other surveys, a distinction is made between tourism that is totally dependent on climate and tourism affected by climate [9,10]. As an example of the first case, the Mediterranean is referred to as the desired destination where the climate acts as an attraction pole for tourists seeking favorable weather conditions, while in the latter case the climate affects specific activities. Choosing a travel destination is a complex process that is influenced by many factors and is treated differently by each individual according to their needs and financial capabilities. Surveys have shown the tendency of those concerned to be informed about the weather they will encounter at their destination by meteorological reports. According to a survey, 81% of respondents reported they had been informed of the climate in the Mediterranean region before making hotel reservations [11,12]. It is of importance to prepare and protect tourists, domestic population, and at-risk groups (retired and sick people and children) against the changing climate [6,7,13].
Summer tourism can be described by the triple S (sun, sea, and sand). Many emerging tourism factors for the triple S are dependent on weather and climate [14]. An additional factor that could be added to the triple S, or used as single winter S, is snow, the main decision factor for winter tourism. The assessment of climate for tourism can be performed by indices, such as the Tourism Climate Index (TCI) developed by [15], the Climate Index for Tourism [16], and the Climate-Tourism/Transfer-Information-Scheme [17,18], among others. In order to assess the climatic tourism potential, air temperature and precipitation are not sufficient. For example, winter sports enthusiasts and tourists desire snow as well as sunny days, beneficial thermal conditions, and recreation in their holidays. Nowadays, the assessment can be performed by facets of climate in tourism (thermal, aesthetic, and physical facets) [1]. The thermal facet of climate could be interpreted by thermal indices, which contribute to better understand the interaction of thermal environmental on humans and are classified as direct (based on direct measurements of environmental variables), empirical (based on objective and subjective stress), or rational (based on calculations involving the human heat balance) indices [19]. The rational thermal indices (e.g., Physiologically Equivalent Temperature (PET) or the Universal Thermal Climate Index (UTCI)) are reliable and user-friendly indices for the assessment of the physiological thermal response of the human body to climatic conditions. In general, PET describes the effect of the thermal surroundings of the human body and includes the energy exchange between humans and environment and assesses the effect of the thermal environment [4,20,21,22,23,24,25]. UTCI was developed following the concept of an equivalent temperature and has been applied in recent human biometeorological studies [26].
The other two facets, aesthetic and physical, can be covered by simple and easy extracted parameters and factors from data records or networks [27]. A new development of a climate tourism assessment is the Climate-Tourism-Information-Scheme, which includes the most relevant and reliable parameters and tourism–climatological factors [13,14,17,18,28].
Tourism to destinations such as Greece is based, so far, mainly on the Mediterranean climate and the prevailing bioclimatic conditions which, if changed on the basis of regional climate models, may affect the attractiveness and competitiveness of the country in its tourist product and the decision-making process for holiday time and the area. The impacts of climate change are expected to be highly differentiated spatially and temporally, i.e., existing and potential tourism destinations are expected to have different impacts (positive or negative) that will also affect the distribution and diffusion of tourism in the geographical area and in time (also affecting seasonality).
The goal of our research is to describe in a useful and understandable way how climate-tourism conditions, based on regional climate simulations, can affect the decision-making for vacation time and area and how to access existing climate information not only for present but also for expected future climate conditions in Milos island, Greece. Milos island was chosen as a representative island of the Cyclades complex in the Aegean Sea, where the touristic period appears to be extended within the year due to favorable bioclimatic conditions. Tourism in Milos, until the 1980s, was not particularly developed due to mining activity that provided the necessary income to the inhabitants and gave the island a view that was in contrary to the image of a typical Cycladic tourist destination. Milos stands out for its unique natural beauty and has had many fanatic visitors in recent years, satisfying their interest in various types of tourism, such as religious and historical tourism (catacombs, archaeological sites, monuments of wars, industrial monuments), geological tourism (special geological formations, mines, the so-called Miloterranean Geo Walks), healing and spa tourism (existence of hot and thermal springs), eco-agrotourism (western Milos Natura Protection Area, ecological paths), and sea adventure tourism (diving, canoeing, sailing).
The impacts of climate change on tourism could be mitigated by an extension of the touristic period towards the cold season, when mild conditions are future projected, in order to achieve the resilience of the society. Thus, the key point is to disseminate the climate-tourism information of the most popular up-and-coming travel destinations, such as Milos island, or other islands with similar characteristics on the Aegean Archipelago, in a clear and easy way to stakeholders, the tourism industry, and, last but not least, to tourists, who want to make a decision for their vacations.

2. Materials and Methods

The island of Milos is a volcanic island (24.5 °E, 36.73 °N; Figure 1) due to extensive volcanic activity and is located in the Cyclades complex. During antiquity, Milos experienced acne due to its mineral wealth. It has been inhabited since the Neolithic era (7000 BC) and quickly became richer than the neighboring islands thanks to the obsidian stone, a black volcanic rock used by the residents in their weapons and tools. The population of Milos according to the last census of 2011 amounts to 4977 inhabitants. Its surface area is 151 km2, with 86% higher than 200 m and a coastline of 126 km. The coasts that are protected are those that belong to the Natura 2000 zone on the southeastern side of the island. The morphology of the island is varied, generally low and hilly. The western part of Milos is more mountainous, with higher altitudes and steeper slopes than its eastern part.
Milos Island has a Mediterranean climate (Csa, according to Köppen classification) with mild, rainy winters and warm to hot, dry summers. The mean climatic characteristics for the period 1955–2018 were acquired from the meteorological station of Milos operated by the Hellenic National Meteorological Service (Table 1). The mean annual temperature recorded in the aforementioned weather station is 17.79 °C, with mean monthly values ranging between 10.79 °C (February) and 25.65 °C (July). The mean minimum air temperature, 8.60 °C, is recorded in February, while the mean maximum 29.13 °C is recorded in July. The strongest winds appear in February, January, and December, while the north direction prevails through the year. The mean annual relative humidity is 65.84%, ranging from 54.60% (June) to 73.38% (December), and does not generally follow the corresponding variation of precipitation (perhaps due to the prevalence of northern winds). The mean cloudiness varies between 5.00 octas in January and 0.37 in July, with more cloudy days between December and February and fewer clouds in June to September. The mean precipitation ranges from 0.31 mm in July to 85.05 in December, while the annual mean is 408.08 mm.
The data used in the performed analysis interpreting the climate components (physical, thermalm and aesthetic) in tourism and recreation [1] concern mean daily values of air temperature, relative humidity, wind speed, cloudiness, and precipitation for the period 1961–2100, as estimated by the Regional Climate Model ALADIN 5.2 [29,30] from the Centre National de Recherche Meteorologiques, Meteo France (CNRM). At this point, it should be clarified that the model simulations of bioclimatic conditions concern mainly the coastal area of Milos due to the specified grid size (0.11° × 0.11°; approximately 12 km × 12 km) of the Regional Climate Model ALADIN 5.2. Thus, the estimated human thermal index PET (thermal facet of the climate) along with the other parameters (humidity, cloudiness, rain, and wind) interpreting the aesthetic and physical facets of the climate refer to the coastal zone, which fulfills the triple S for summer tourism. The estimated bioclimatic conditions, present and future, differ from those that appear in the inland mountainous areas, especially in the western part of Milos. Nevertheless, we consider that the performed climate tourism assessment is representative for Milos island, of which the morphology is generally low and hilly.
The thermal facet of the climate is well described by the human thermal index Physiologically Equivalent Temperature (PET) (Table 2), which is based on human energy balance. It is equivalent to the air temperature at which, in a typical indoor setting (without wind and solar radiation), the heat balance of the human body (work metabolic rate, 80 W of light activity) that should be added to the basic metabolic rate (heat resistance of clothing, 0.9 clo, which is the reference clothing insulation value used for the formulation of PET) is maintained with core and skin temperatures equal to those of the under-assessment conditions [20]. The main meteorological parameters controlling the human energy balance concern air temperature, air humidity, wind speed, and mean radiant temperature of the surroundings. The aforementioned meteorological variables can be used for the calculation of PET by the radiation and energy balance model RayMan [13]. For bioclimatic purposes the wind velocity was adjusted according to the following formula [24,31]:
W S 1.1 =   W S h × ( 1.1 / h ) a ,
a = 0.12 × z 0 + 0.18 ,
where W S h is the wind speed (m/s) at the station’s height (h, usually 10 m), α is an empirical exponent depending on the surface roughness, and z 0 is the roughness length. Wind velocity was estimated at 1.1 m, which is the gravity center of the human body and builds the reference level for human biometeorological studies. The aforementioned values of roughness length for a specific terrain were derived from the European Wind Atlas [32]. The human thermal conditions, by means of the frequency (%) of PET classes per month, are presented in bioclimate diagrams (Figure 2, Figure 3 and Figure 4).
The other two components, the aesthetic and physical, can be interpreted by the Climate-Tourism-Information-Scheme (CTIS), which includes the most relevant and reliable parameters and tourism–climatological factors [13,17,18,28,33]. Since the presented results are based on model simulations and thus affected by the model’s uncertainties, a temporal resolution finer than one month is not considered useful. CTIS provides information on thermal components, such as cold stress (PET < 8 °C), thermal accessibility (18 °C < PET < 29 °C) and heat stress (PET > 35 °C), aesthetic components, such as sunny days (cloud cover < 4 octas) and fog (relative humidity > 93%), and physical components such as sultriness (vapor pressure > 18 hPa), dry days (precipitation < 1 mm), rainy days (precipitation > 5 mm), as well as stormy conditions (wind velocity > 8 m/s), which are the most appropriate in order to integrate and simplify climate information for tourism potential (Table 3). The analyzed bioclimatic parameters are presented in frequencies (%). Each colored column describes the corresponding frequency of any parameter. A frequency of 100% indicates that each day in a month is characterized by the respective condition listed on the right hand side (Figure 5, Figure 6 and Figure 7). A frequency of 50% corresponds to an occurrence of the indicated condition during 15 days, 10% to 3 days of the considered month etc. Further, in order that CTIS is easier to understand by tourists, the Climate Index for Tourism [11] is incorporated into the scheme. Thus, other than the frequencies (%) of the parameters interpreting the three climate components (thermal, aesthetic, and physical) in tourism and recreation, another visualization of CTIS is presented, where the probability CTIS scale is given in seven climate classes from “very poor” to “ideal”, indicating about 14% of probability to each class. For the factors of cold stress, heat stress, fog, sultriness, rainy, and windy days, higher probability means less favorable conditions (very poor conditions), while for thermal acceptability, sunny, and dry days, higher probability means more favorable conditions (ideal conditions). Thus, the positive and negative ranked factors ranging from “very poor” to “ideal” contributes comprehensively in decision making of a touristic destination. This specific quantification of climate can be carried out by using existing climate data sets or regional modeling projections based on climate simulations for the present or future time periods.
Future climate change conditions are analyzed using the high-resolution simulations (grid size 0.11°× 0.11°; approximately 12 km × 12 km) of the Regional Climate Model ALADIN 5.2 [29,30], from the Centre National de Recherche Meteorologiques, Meteo France (CNRM). For the Fifth Assessment Report of IPCC, the scientific community has defined a set of four new scenarios, denoted Representative Concentration Pathways (RCPs). They are identified by their approximate total radiative forcing in the year 2100 relative to 1750. These four RCPs include one mitigation scenario leading to a very low forcing level (RCP2.6), two stabilization scenarios (RCP4.5 and RCP6), and one scenario with very high greenhouse gas emissions (RCP8.5). The RCPs can thus represent a range of 21st-century climate policies, as compared with the no-climate policy of the Special Report on Emissions Scenarios (SRES) used in the Third Assessment Report and the Fourth Assessment Report. In the present study, the climate simulations concern the future periods 2021–2050 and 2071–2100 against the reference period 1961–1990, under RCP4.5 and RCP8.5. The RCP4.5 is developed by the MiniCAM modeling team at the Pacific Northwest National Laboratory’s Joint Global Change Research Institute (JGCRI) [34]. It is a stabilization scenario where total radiative forcing is stabilized before 2100 by employment of a range of technologies and strategies for reducing greenhouse gas emissions. Stabilization without overshoot pathway to 4.5 W/m2 at stabilization after 2100 (~650 ppm CO2eq; Carbon dioxide equivalent (CO2eq) is a term for describing different greenhouse gases in a common unit. For any quantity and type of greenhouse gas, CO2eq signifies the amount of CO2 which would have the equivalent global warming impact.). The scenario drivers and technology options are detailed [34]. Additional detail on the simulation of land use and terrestrial carbon emissions is given by [35]. The RCP8.5 is developed by the MESSAGE modeling team and the IIASA Integrated Assessment Framework at the International Institute for Applies Systems Analysis (IIASA), Austria. The RCP8.5 is characterized by increasing greenhouse gas emissions over time representative for scenarios in the literature leading to high greenhouse gas concentration levels. Rising radiative forcing pathway could lead to 8.5 W/m2 (~1370 ppm CO2 eq) by 2100. The underlying scenario drivers and resulting development path are based on the A2 scenario detailed in [36].

3. Results and Discussion

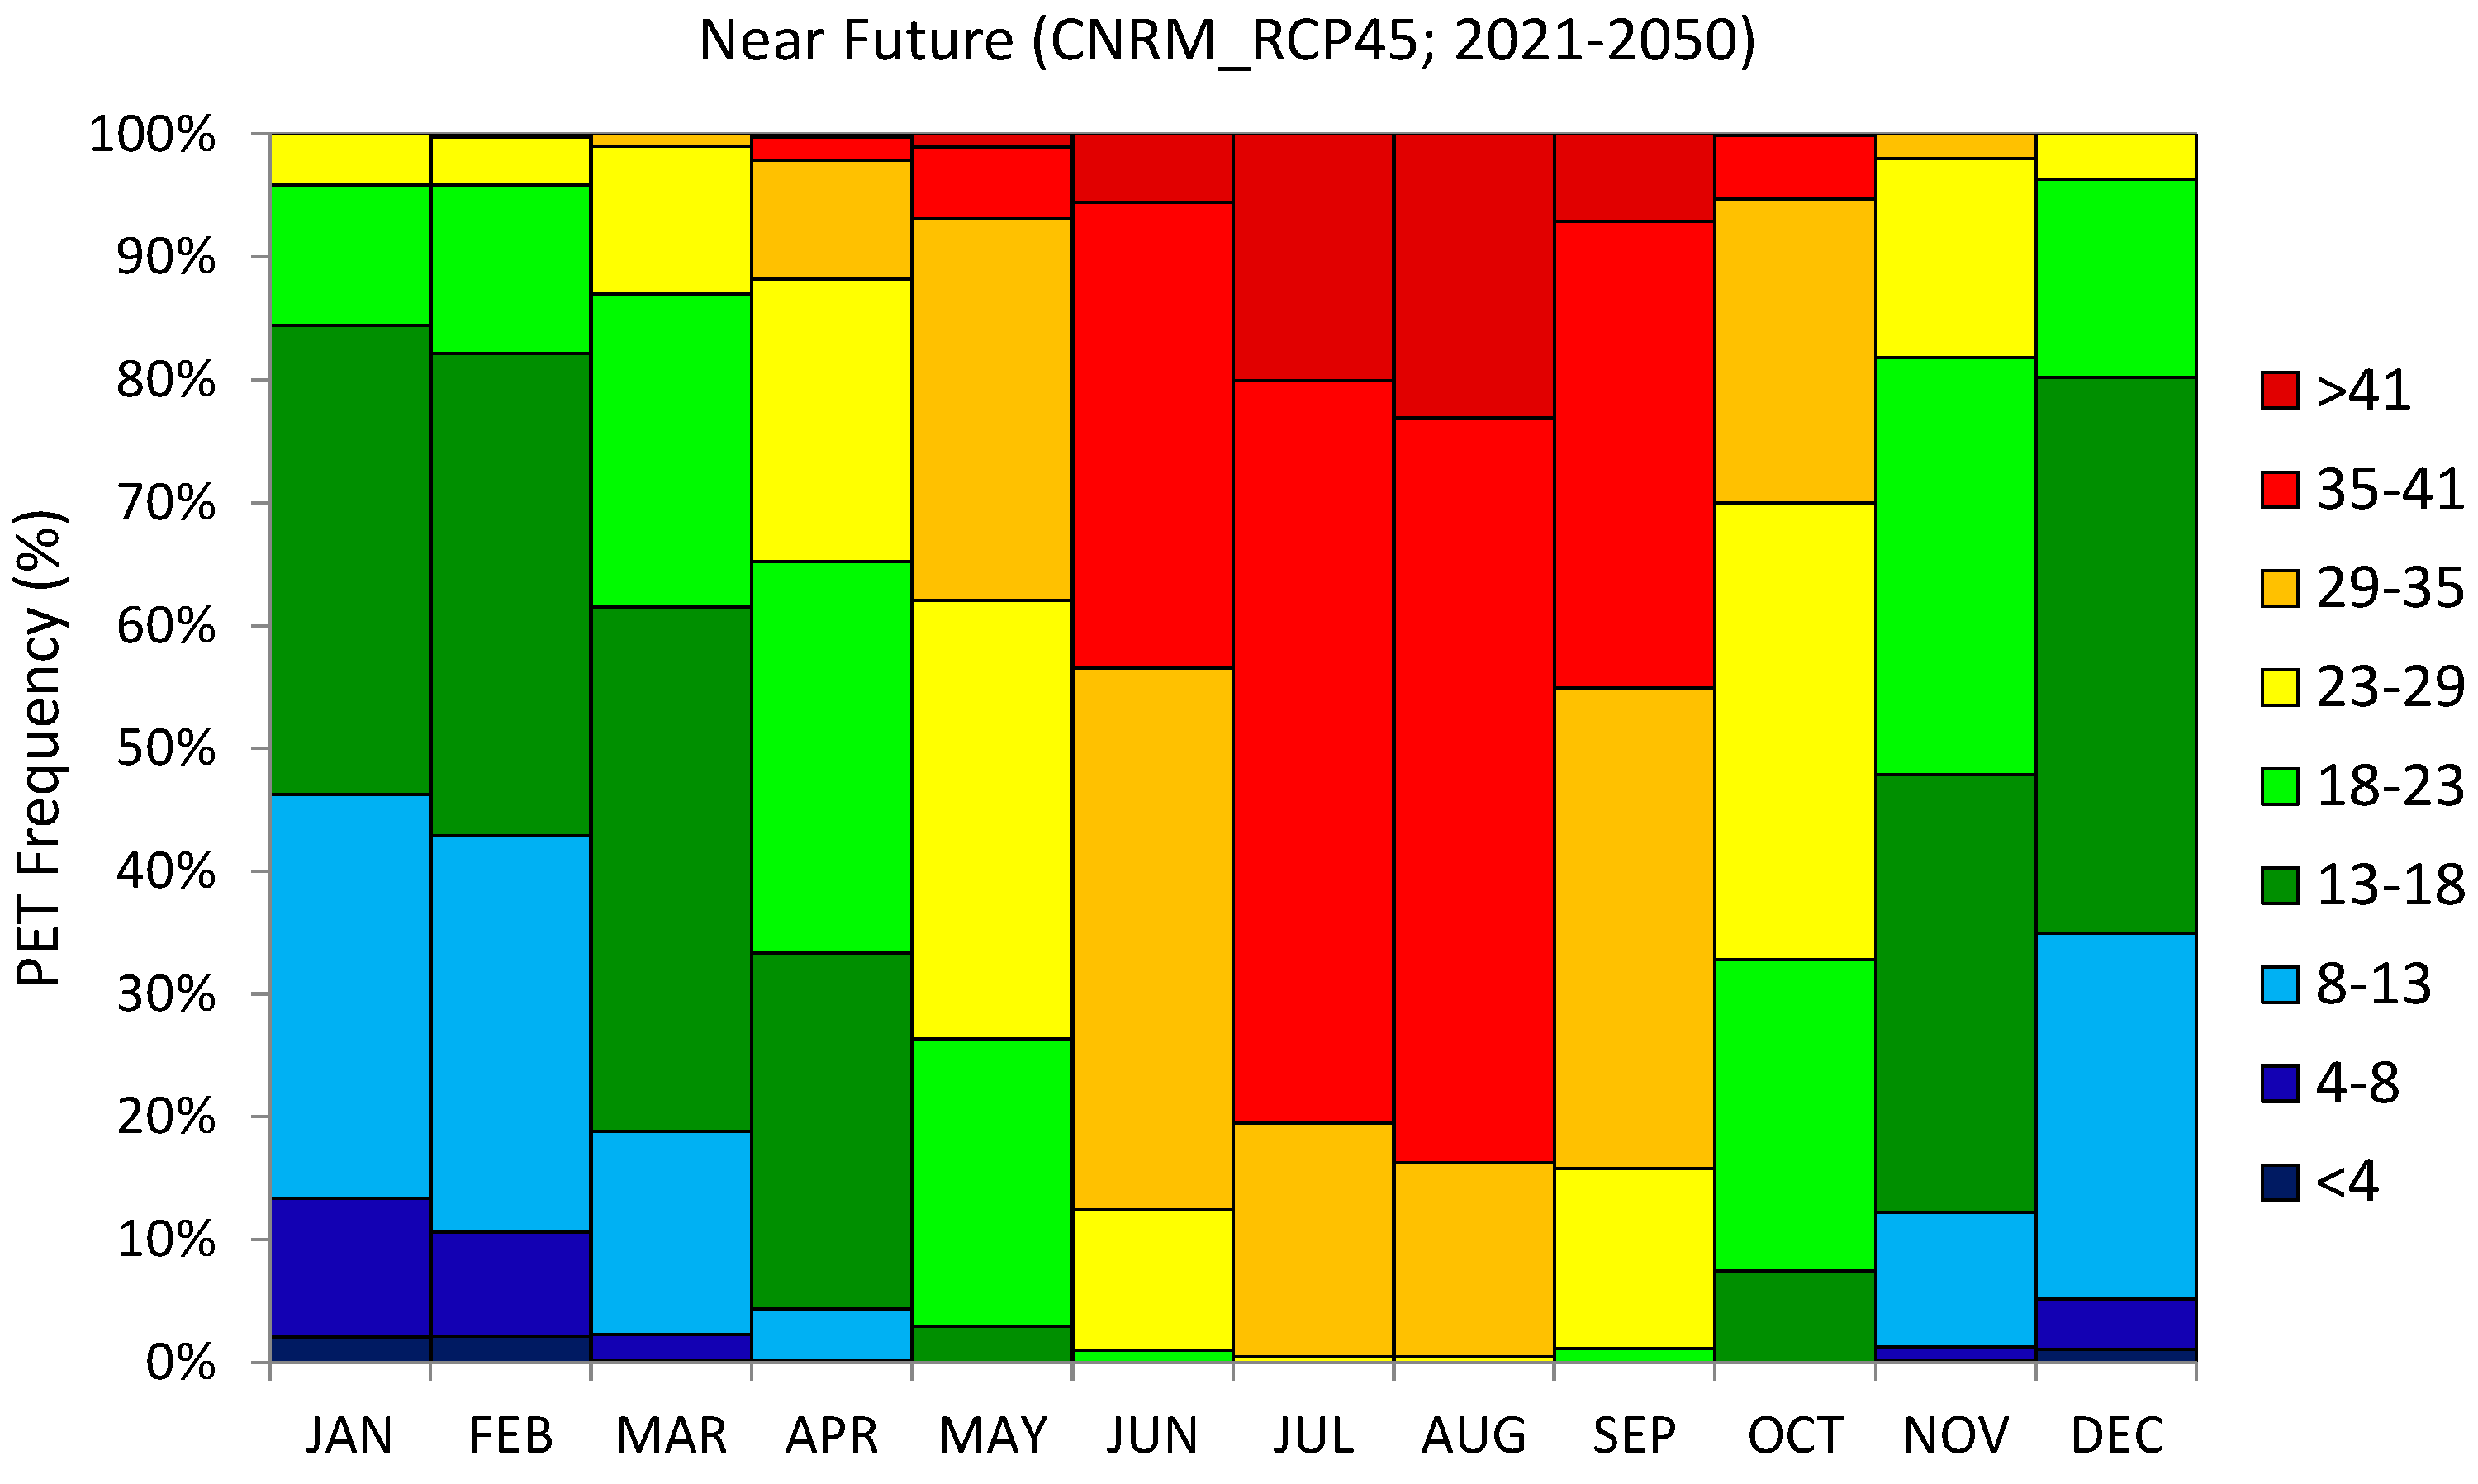
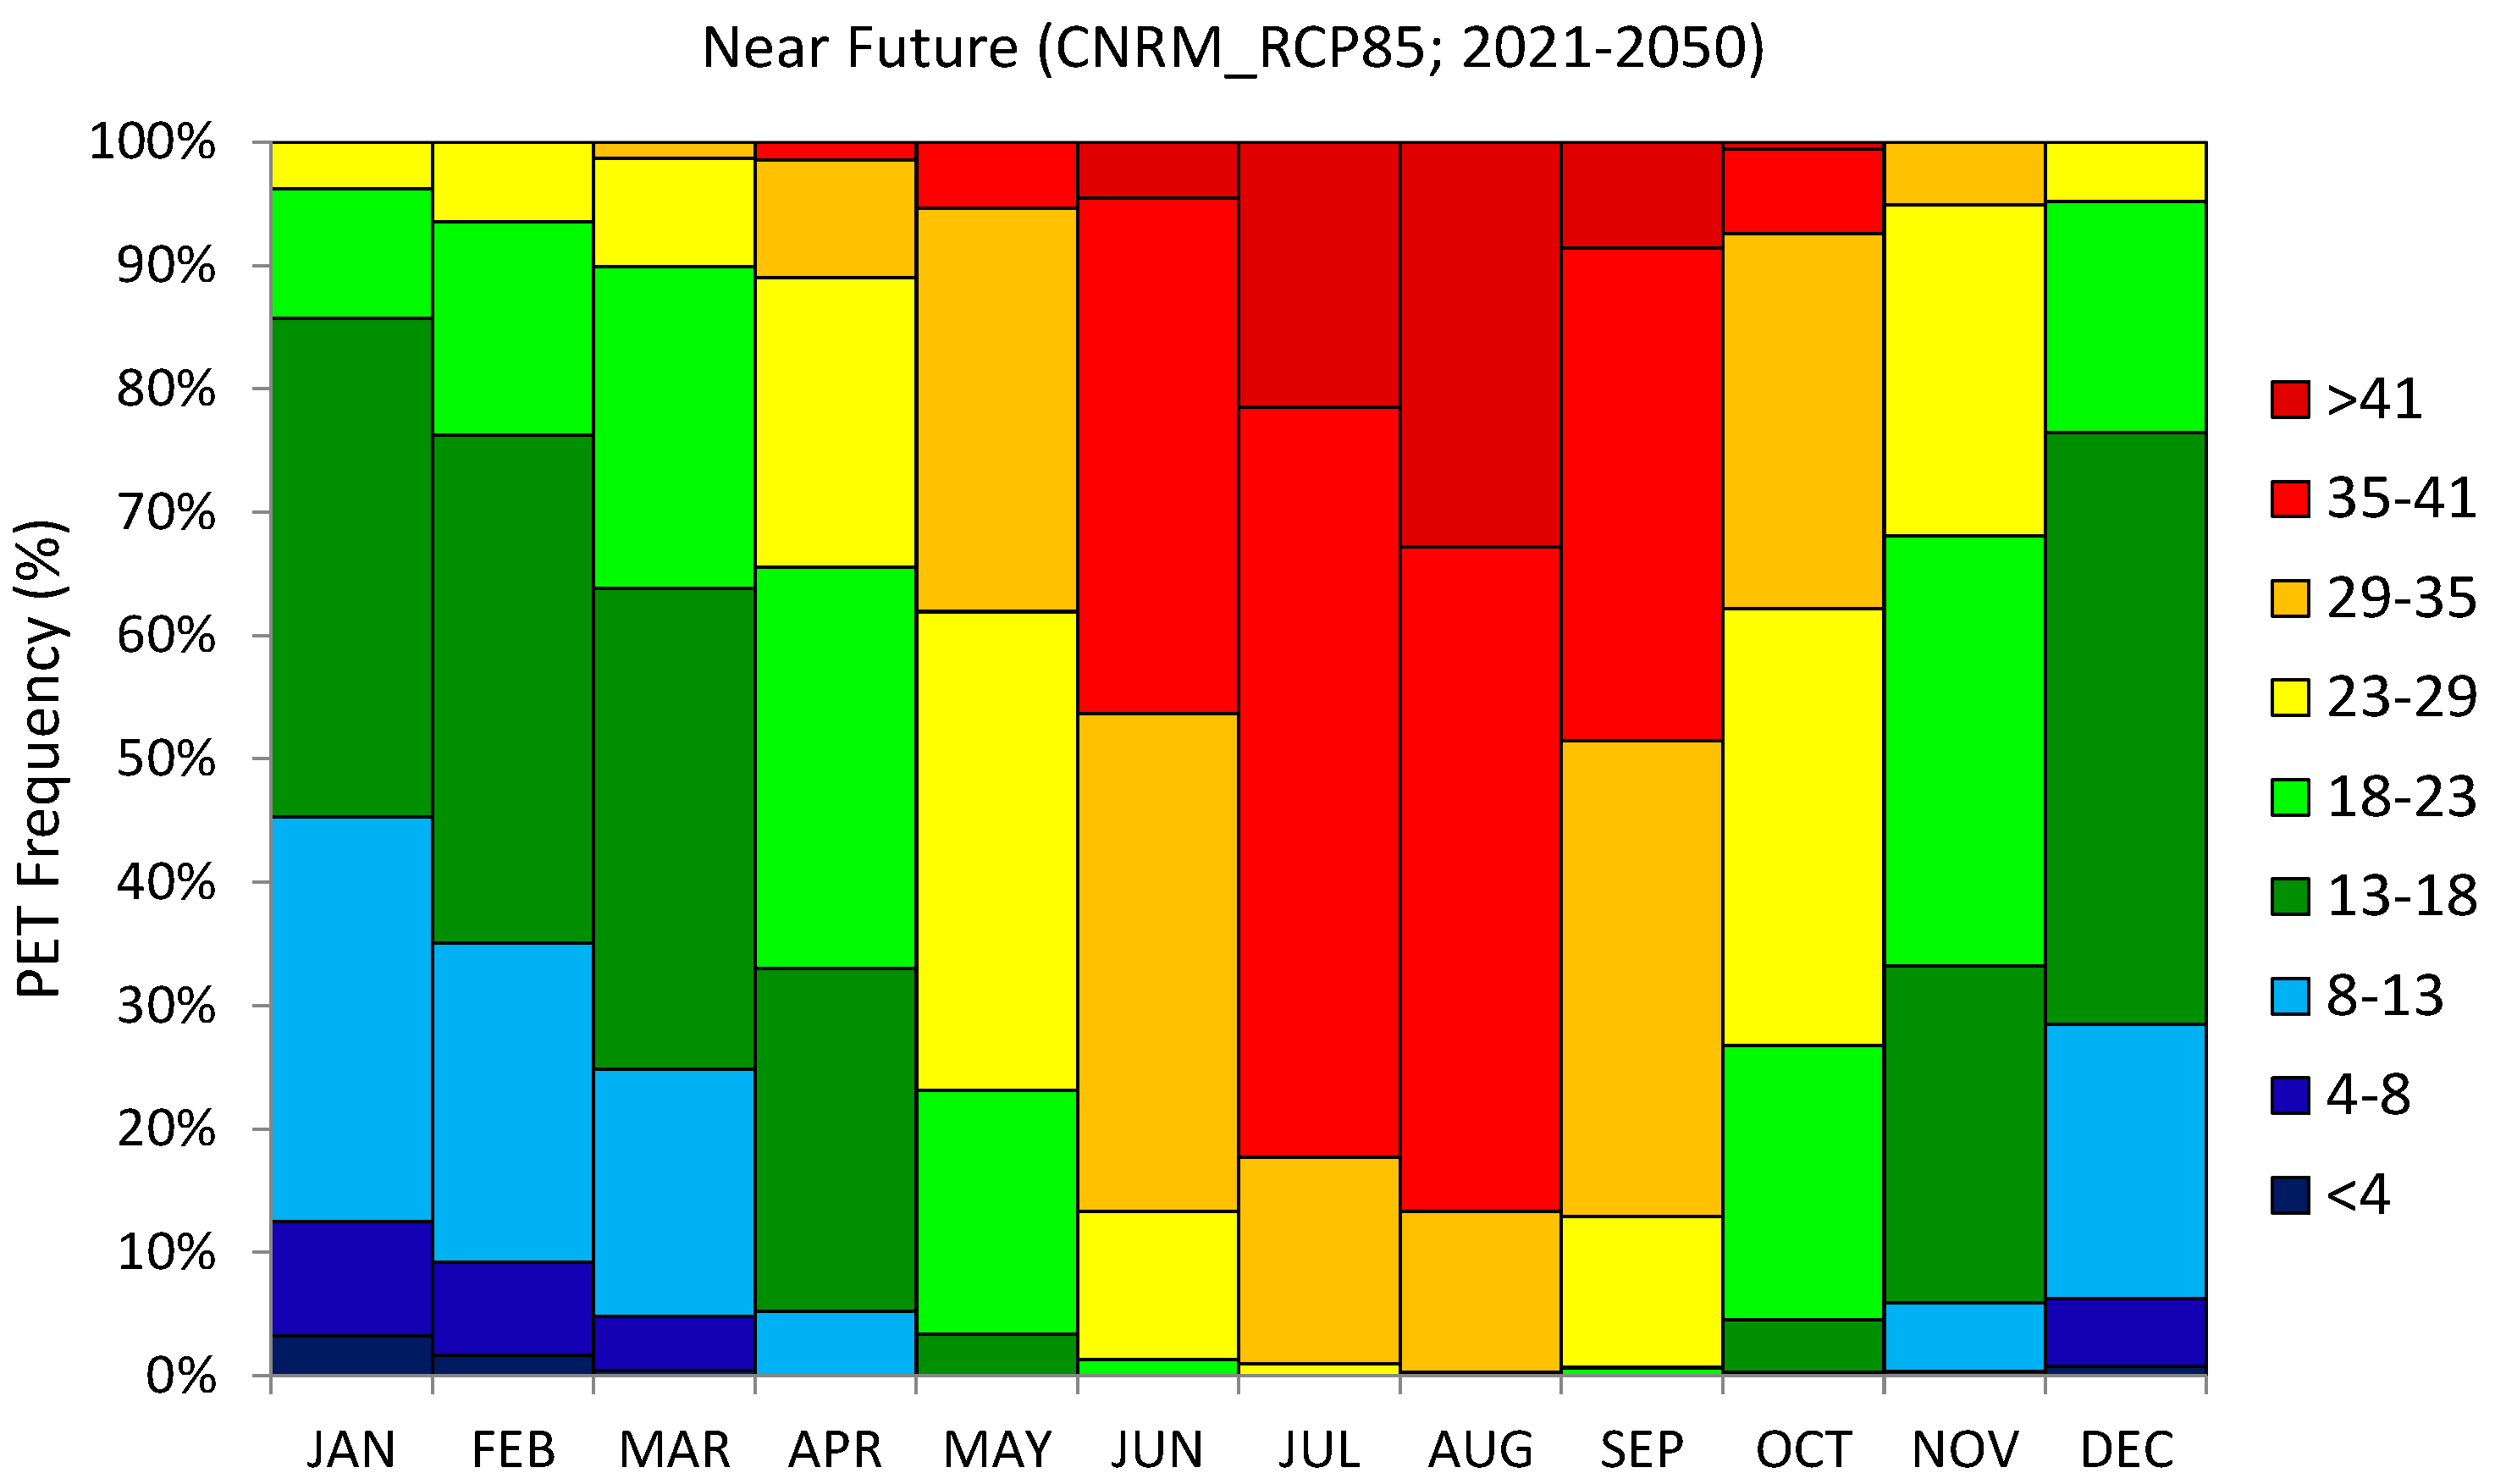
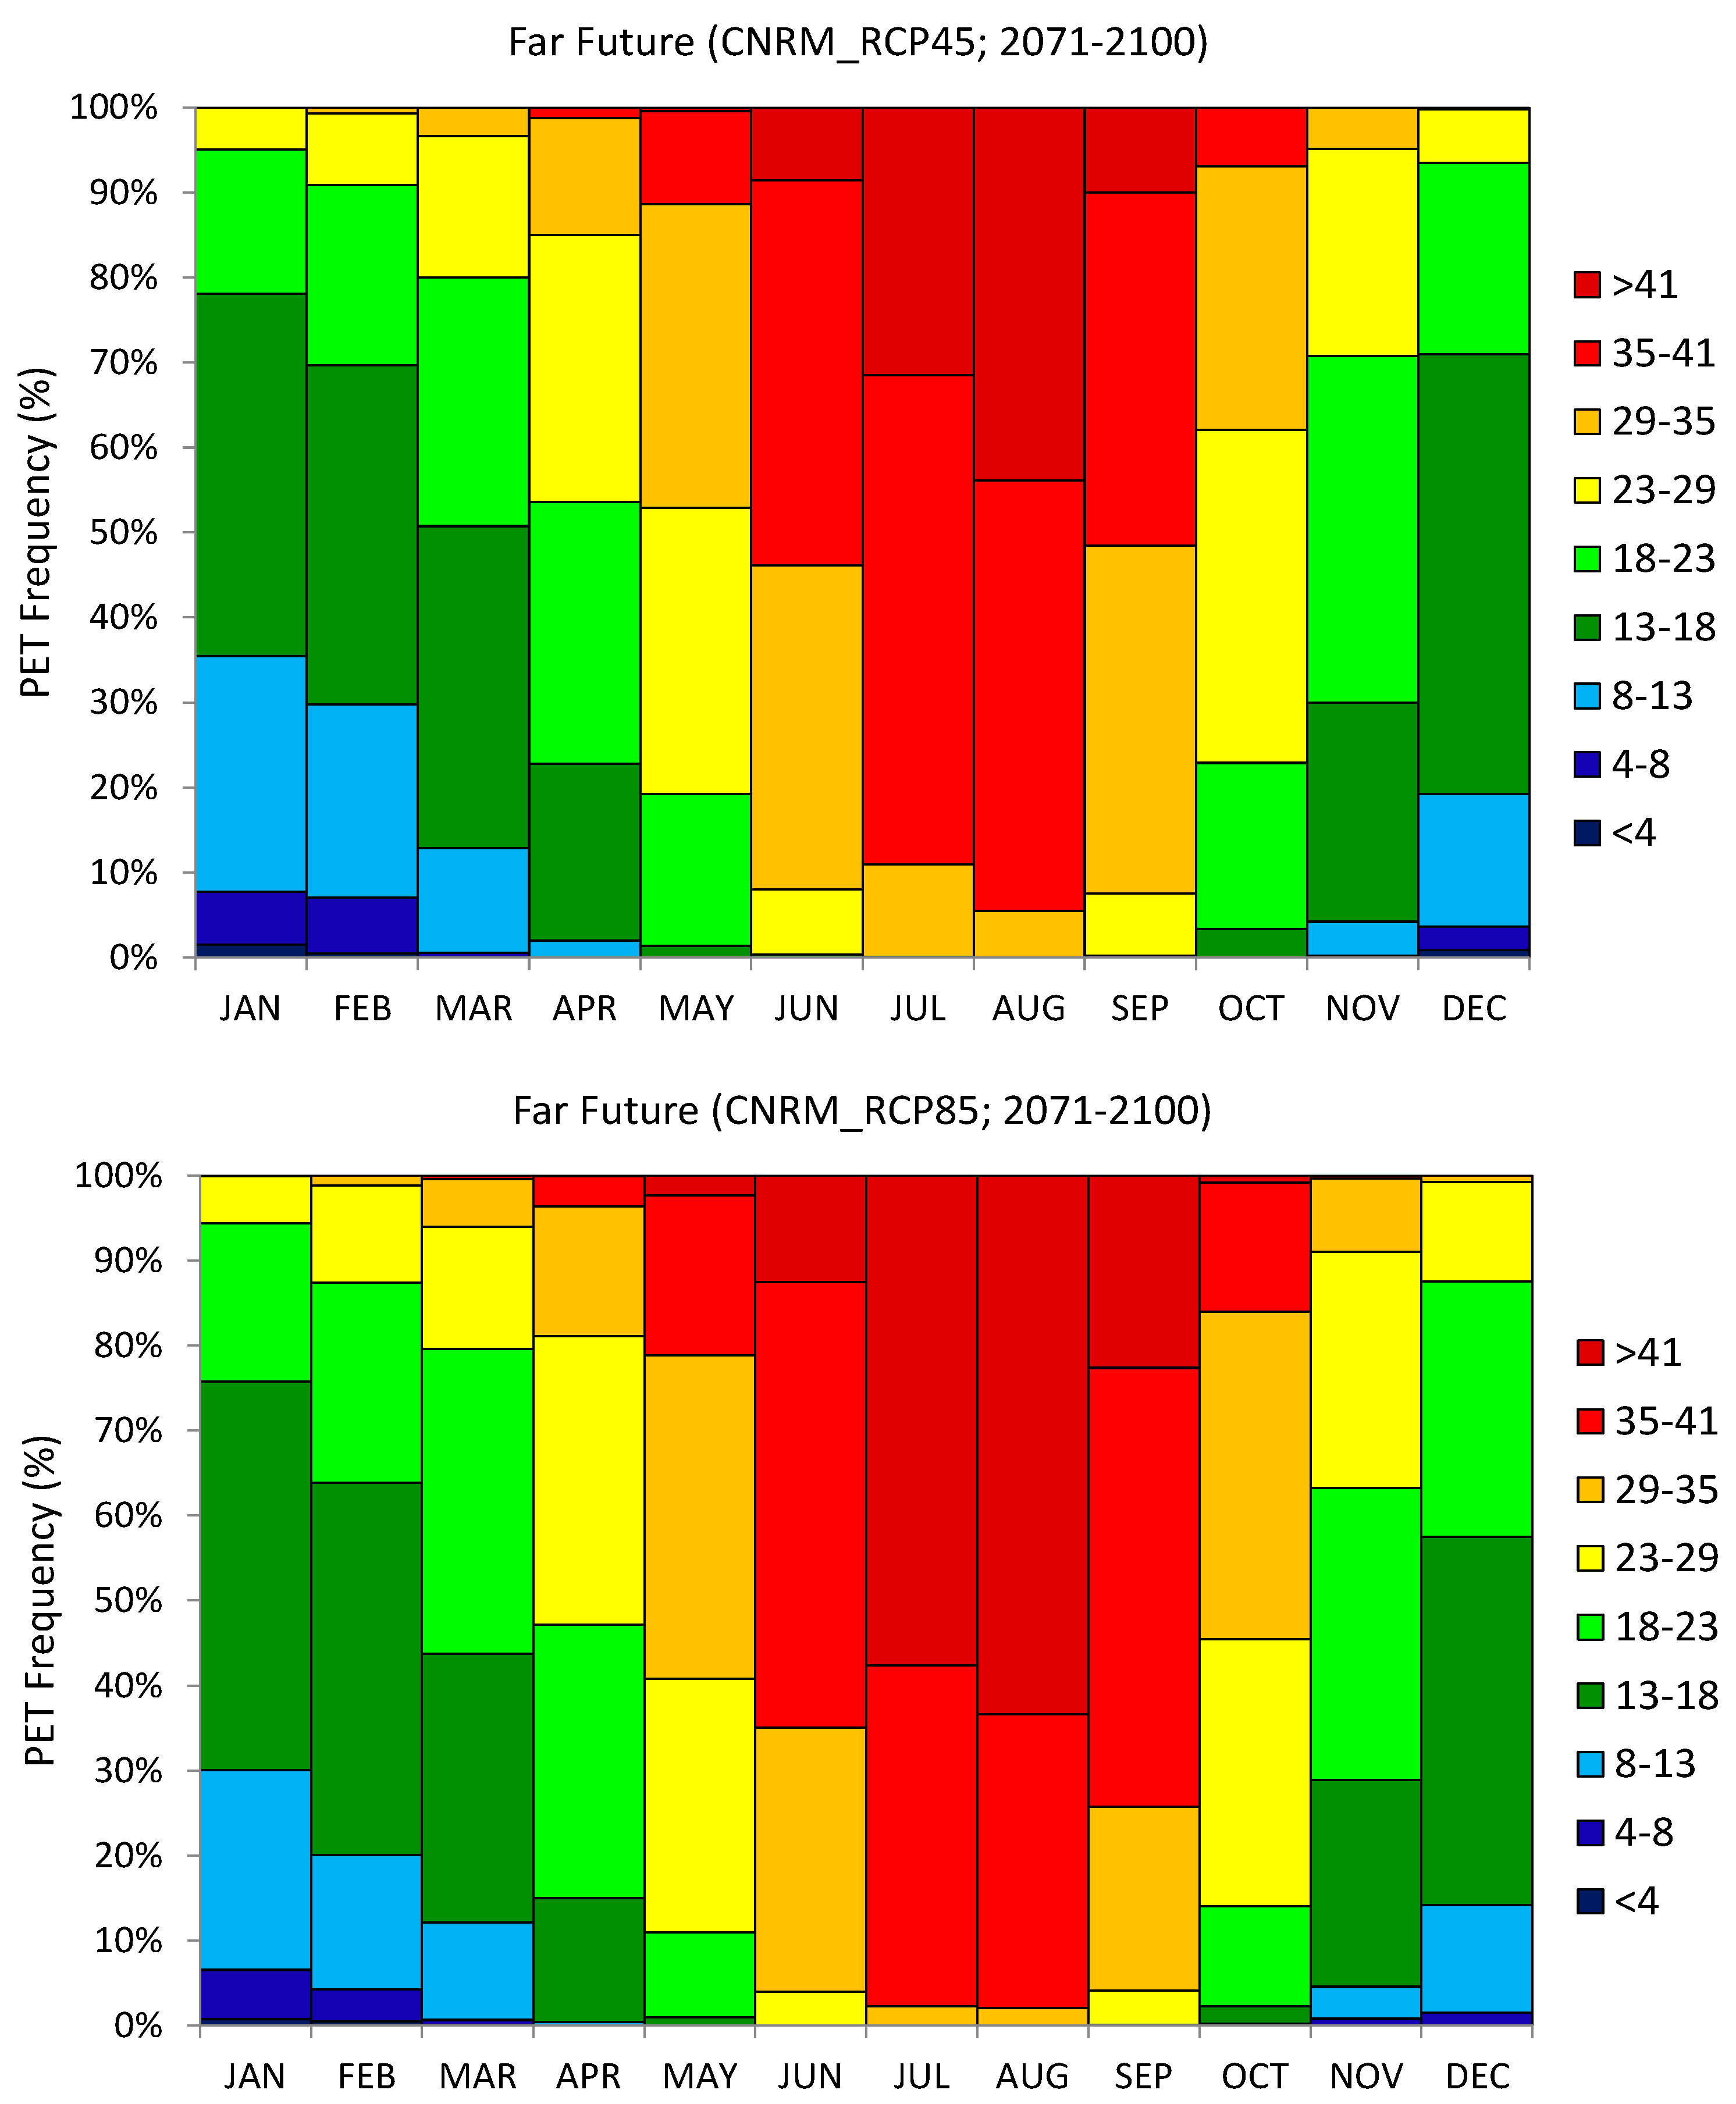
3.1. Present and Future Projected Human Thermal Conditions

The bioclimate diagram of PET classes for the present climate (Figure 2) depicts that cold stress conditions (PET < 8 °C), accounting for 15 days occur from November to April, reaching a maximum (17%) in January, followed by February (15%) and December (13%). The number of days with thermal comfort is 54 days per year, appearing from September to June, with a maximum frequency of 34% in April, followed by November (29%) and October (28%). No comfort class appears in July and August and only small frequencies (~3%) in June and September. The number of days with heat stress (PET > 35 °C) is about 61 days, occurring from May to October, with a maximum frequency of about 67% in July and August and minimal in May (4%) and October (3%).
In the near future (2021–2050), under the stabilized RCP4.5 scenario (Figure 3, upper graph), the number of days with cold stress will decrease by 5 days per year, meaning a 33% decrease, whereas heat stress will increase by 21 days (34%) and thermal comfort will slightly increase by almost 2 days (4%). Regarding the near future but for RCP8.5, which represents a scenario with very high greenhouse gas emissions (Figure 3, lower graph), the number of days with cold stress will decrease by 5 days, meaning a 33% decrease, whereas heat stress will increase by 24 days (39%) and thermal comfort will slightly increase by 3 days (6%). The distribution pattern of PET classes seems to change with respect to future projected heat stress against cold stress, which keeps almost the present frequencies. Specifically, the number of days with heat stress (PET > 35 °C) will increase by 13% (15%) in July and 15% (18%) in August for RCP4.5 and RCP8.5, respectively, whereas a decrease in cold stress of approximately 4% (5%) appears in January and February for the aforementioned RCPs, respectively.
The aforementioned changes will be further increased by the end of the 21st century (Figure 4). Specifically, in the far future (2071–2100), under the stabilized RCP4.5 scenario (Figure 4, upper graph), the number of days with cold stress will decrease by 9 days, meaning 60% decrease per year, whereas heat stress will increase by 33 days (54%) and thermal comfort will slightly increase by almost 7 days (13%). Regarding the far future but for RCP8.5, which represents a scenario with very high greenhouse gas emissions (Figure 4, lower graph), the number of days with cold stress will decrease by 11 days, meaning 73% decrease, whereas heat stress will increase by 54 days (89%) and thermal comfort will increase by 6 days (11%). Also, the distribution pattern of PET classes seems to change with respect to future projected heat stress against cold stress, which keeps almost the present frequencies. Specifically, the number of days with heat stress (PET > 35 °C) will increase by 22% (31%) in July and 26% (29%) in August for RCP4.5 and RCP8.5, respectively, whereas a decrease of approximately 9% (10%) appears in January and 7% (10%) in February for the aforementioned RCPs, respectively.

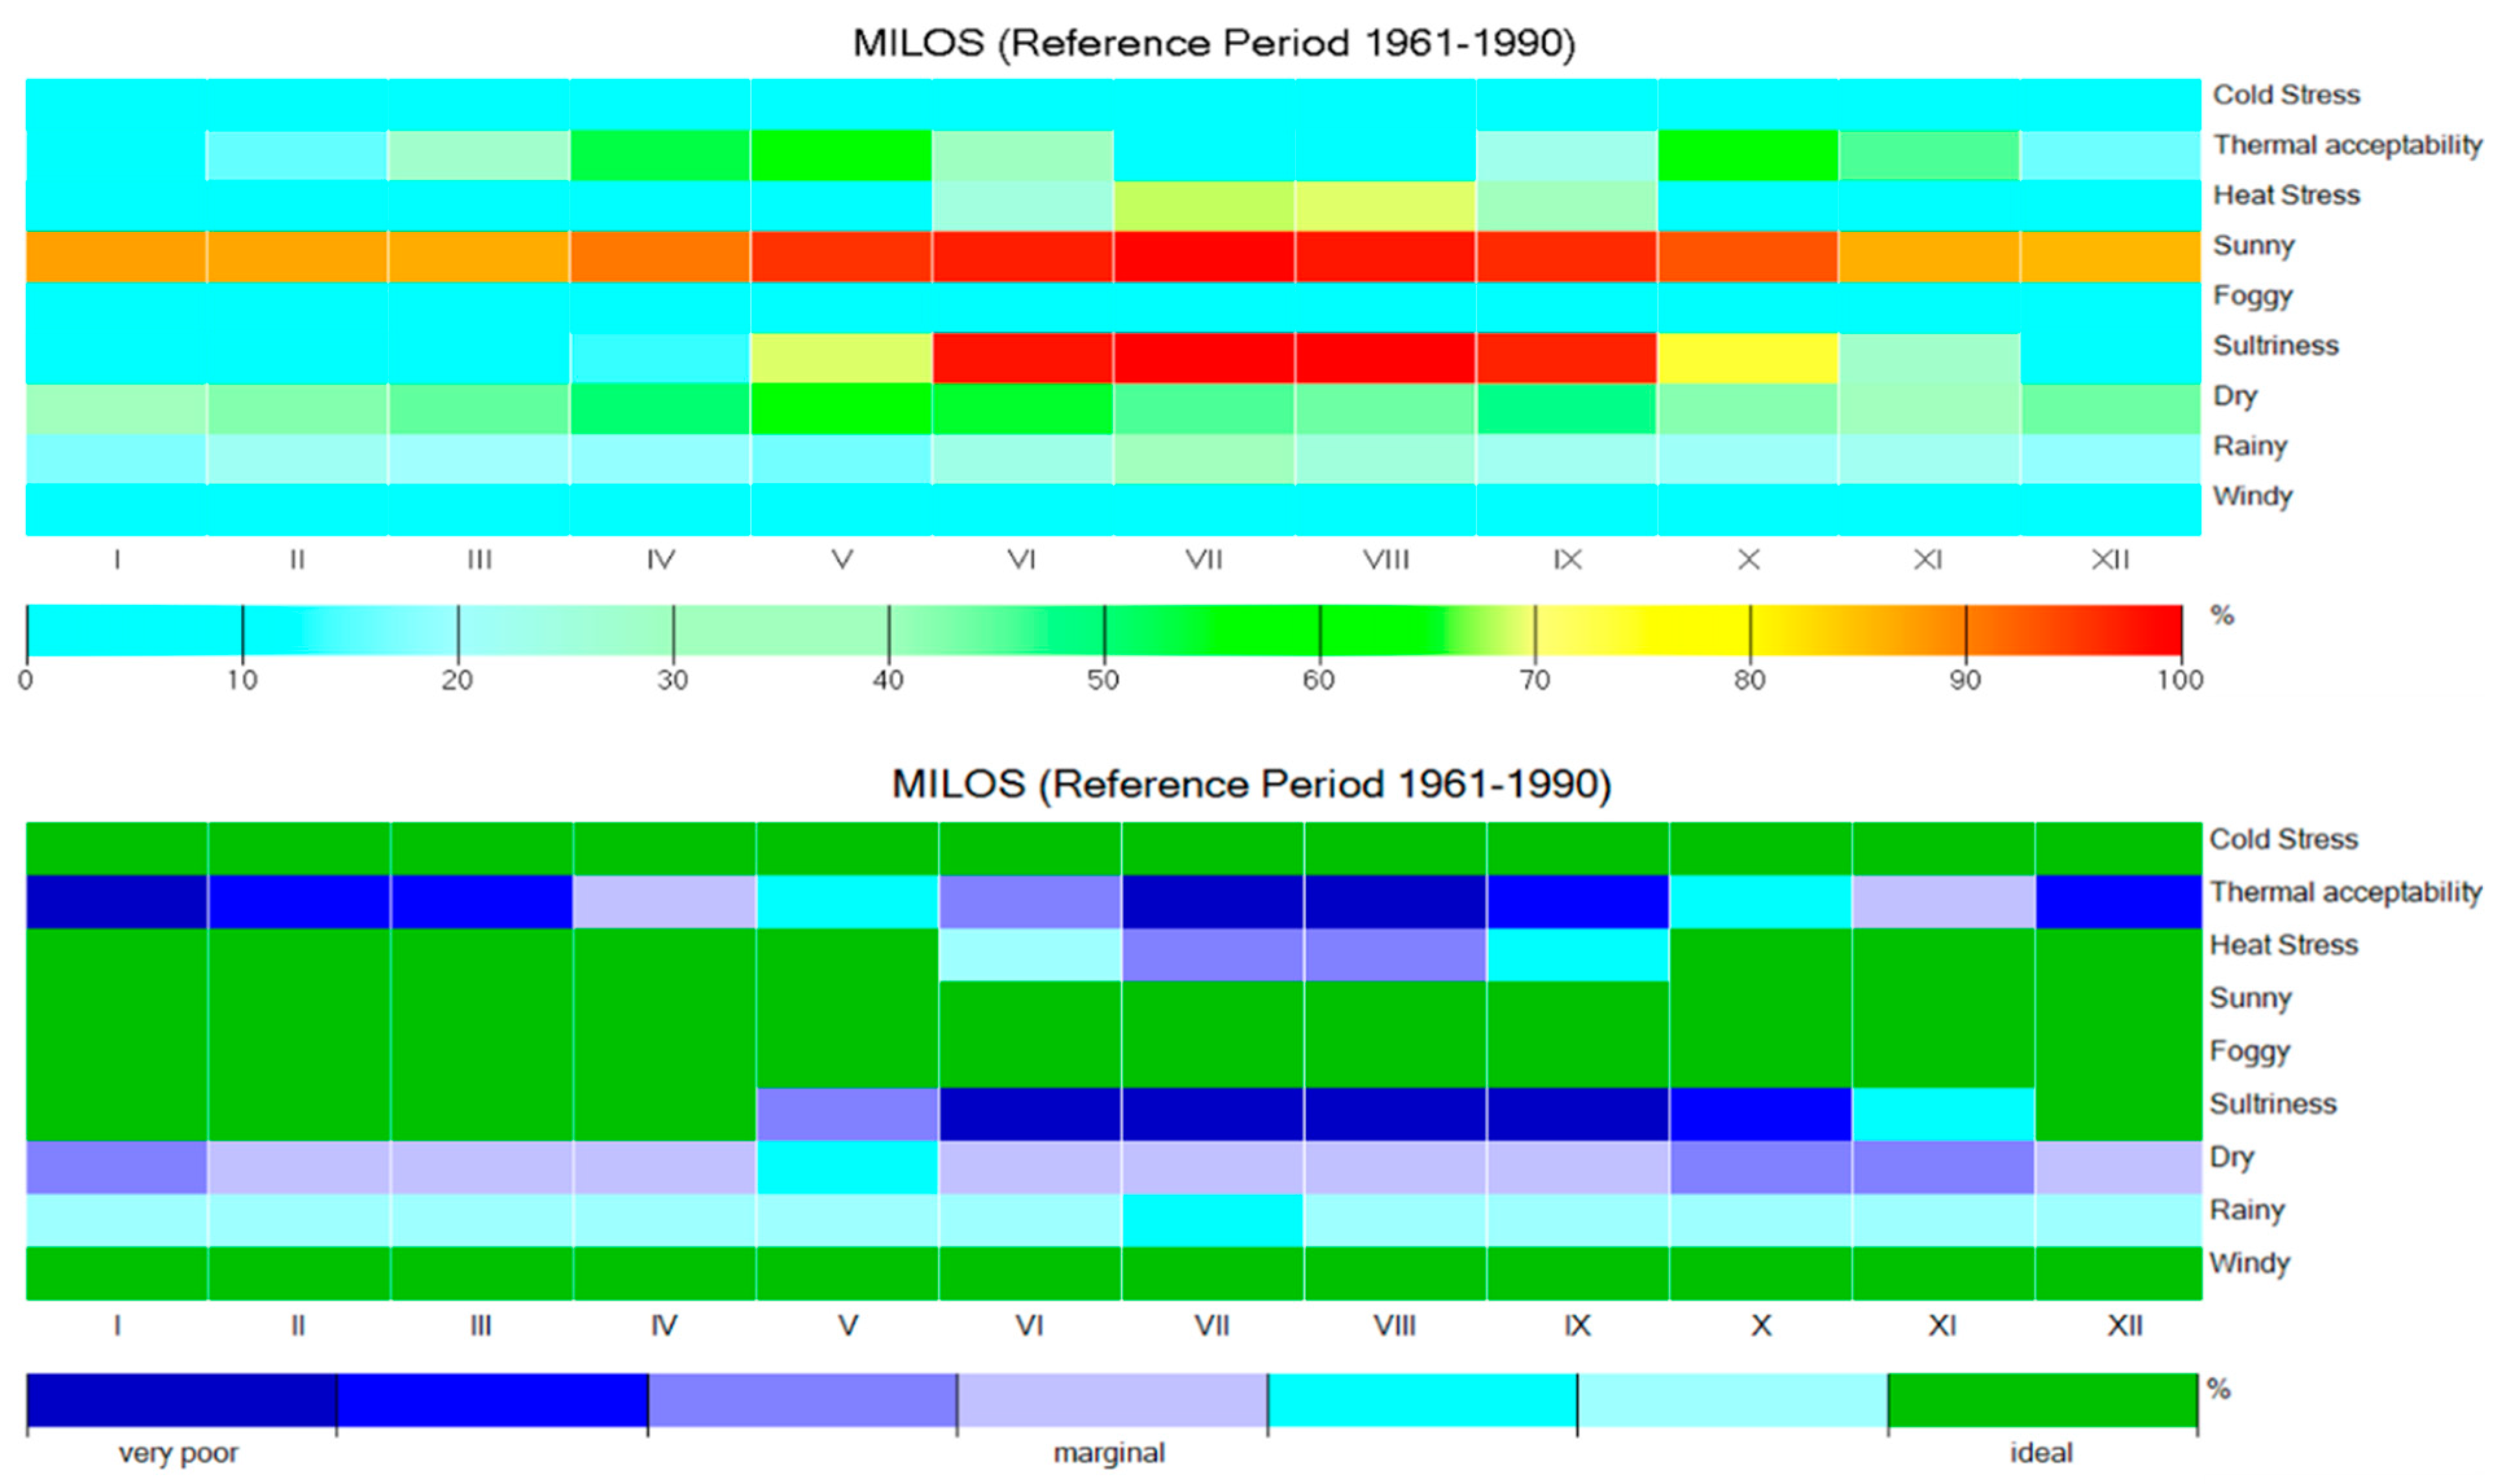
3.2. Climate–Tourism Information Scheme—Present and Future Projections

A comprehensive and user-friendly tool for tourism planning and recreation is CTIS. Concerning CTIS for the reference period (1961–1990), cold stress (PET < 0°C), fog (relative humidity > 93%) and windy conditions (wind velocity > 8m/s) hardly occur on Milos island (Figure 5). Thermal acceptability appears in May and October with a frequency of 62%, followed by April (53%), November (46%), June (29%), March (28%), and September (23%). Less thermal acceptability appear in July (2%) and August (2%), while in winter months the frequency of thermal acceptability ranges from 11% in January to 16% in February and December (Figure 5, upper graph). As mentioned before, another visualization of CTIS is presented, where the probability CTIS scale is given in seven climate classes from “very poor” to “ideal”, which gives about 14% of probability to each class. Taking into consideration this approach, one can easily understand that very poor thermal acceptability conditions appear both in winter and summer, against marginal in spring and autumn (Figure 5, lower graph). Heat stress is only pronounced in July (68%) and August (69%), followed by September (33%) and June (25%) (Figure 5, upper graph), posing marginal conditions in summer months against ideal environment for the rest of the year (Figure 5, lower graph). Sunny days appear throughout the year, with frequencies ranging from 86% in December to 99% in July, indicating ideal climate ranking. Very poor conditions (>97%) with respect to sultriness are depicted from June to September, even in October (74%) and May (69%), against ideal conditions for the rest of the months. The frequency of dry days ranges from 38% in November to 58% in May, thus marginal conditions can be considered. Hence, rainy days appear at low frequencies (17% in May to 32% in July) through the year.
The future projected changes in the aforementioned parameters included in CTIS for the near future (2021–2050) under RCP4.5 and RCP8.5 scenarios are illustrated in Figure 6. Regarding the near future, heat stress is expected to increase by 13%–15% (15%–18%) in July and August for RCP4.5 and RCP8.5, respectively, associated with a slight increase in its length; namely, an increase by 19% (22%) is projected in June against a lesser increase of 13% (17%) in September for the examined RCPs, respectively. Thermal acceptability conditions seem to shift from May to March (almost +10%) and from October to November, indicating an increase of 5% (17%) for the respective RCPs. Furthermore, the months from November to March will become more comfortable, whereas in summer, thermal acceptability is not expected anymore. Sultriness is likely to shift from June to April and from September to November; regarding RCP4.5, higher increases will appear in April (+19%) and May (+14%), followed by November (+10%) and October (+5%), against further changes with respect to RCP8.5, namely +26% (April and November), +19% (May), and 13% (October), indicating that an increase in frequency and the length of sultry conditions might be expected as well. Slight increases in dry days are projected mainly within the wet period of the year (October to March), as well as slight increases in rainy days within the warm period (June to September) of the year. Needless to say, cold stress, fog, and stormy conditions do not appear in the near future for both examined RCPs.
By the end of the 21st century the changes are expected to increase (Figure 7). Concretely, for the far future (2071–2100) under RCP4.5 and RCP8.5 scenarios, heat stress is expected to increase by 21%–26% (29%-30%) in July and August for RCP4.5 and RCP8.5, respectively, associated with a slight increase in its length; namely, an increase by 30% (41%) is projected in June against 19% (42%) in September for the examined RCPs, respectively. Thermal acceptability conditions seem to shift from May to March (+19%; +24%) and from October to November (21%; 17%) for the respective RCPs. Furthermore, the months from November to March will become more comfortable, whereas in summer, thermal acceptability is not expected anymore. Sultriness is likely to shift from June to April and from September to November; regarding RCP4.5, higher increases will appear in April (+40%) and November (+29%), followed by May (+22%) and October (+10%), against further changes with respect to RCP8.5, namely +53% (April), +34% (November), +25% (May), and +17% (October), indicating that an increase in frequency and the length of sultry conditions might be expected as well. Slight increases in dry days are projected mainly within the wet period of the year (October to March), as well as moderate increases (almost +5%) in rainy days within the warm period (June to September) of the year for both examined RCPs. Global warming caused by the increase of greenhouse gases in the earth’s atmosphere results in increased temperature, which in turns leads to enhanced surface water evaporation, especially over coastal areas. Taking into consideration that warm air is able to hold more water vapor than cold air, one could anticipate increased projected sultry climatic conditions. This is the case of Milos island, where sultry conditions are likely to increase both in the near and far future. This is expected to have a significant impact on beach tourism in Milos, typically associated, at present, with summer months. The bioclimatic simulations indicate that the triple S tourism in Milos will in future take place outside the current high season and will take on characteristics similar to the ones currently prevalent in warmer tourism regions of the planet. This, of course, will require an adjustment of Milos’s tourism product and services and a reformulation of tourism policy on a new basis. Special and alternative forms of tourism, together with a redefinition of the peak season for sun-and-sea tourism, can help the tourism industry overcome its current weaknesses.
The performed analysis shed light on an easy decision for tourism planning and recreation, based on comprehensive tools, such as CTIS and bioclimate diagrams of PET classes, applied successfully in other touristic destinations with different climatic characteristics [14]. A bioclimatic analysis on Crete island, Greece, for the present conditions, highlighted that heat stress appears from May to September over coastal areas (i.e., Heraklion), while thermal comfort exists for a longer period (March to October), indicating that an extension of the tourism period is possible. The mild periods of the year are suitable for other types of tourism, such as wellness and cultural tourism and therefore contribute to the extension of Crete’s tourism period [18]. The bioclimatic information for Hvar, an island off the Croatian Adriatic coast, based on CTIS revealed that on the Adriatic coast, pleasant bioclimatic conditions usually prevail in spring and autumn, or in the mountains in summer. Thus, depending on the specific activities of the tourists (i.e., hiking or riding) or on their health conditions (elderly and sensitive to summer heat), pleasant or even cool conditions would be more convenient than summer heat [33]. The integrated approach on climate tourism information, by means of CTIS, has been accomplished in Sun Moon Lake, one of the National Scenery Areas in Taiwan and the most popular destination region for both domestic and international tourists [17]. The results of the analysis showed that thermal comfort and thermal stress are similar for the whole year, while cold stress is only significant from November to March and moderate from June to August. Sultry and rainy conditions occur frequently during summer. The authors found that the more frequently visited periods are not the best time for visiting as tourists may suffer from cold stress or rainy periods in February and from July to August, while few tourists currently visit the area during the periods with comfortable climate. Therefore, climate-tourism information could play a significant role in choosing a travel destination in suitable periods of the year. The applied methodology interprets the climate-tourism components, such as thermal, aesthetic, and physical, so that users who are not familiar with complex terms of human biometeorology or climatology can clearly be informed for specific tourist destinations. This kind of analysis could be exploited by stake holders and tourism industries in order to promote or develop mitigation and adaptation strategies due to the oncoming climate change. It is worth noting that CTIS, along with bioclimate diagrams, visualize in a user-friendly way the holistic influence of climate on human thermal comfort, taking into consideration not only air temperature but also humidity, wind speed, and radiation fluxes by means of mean radiant temperature [2,5,24,33,37,38].

4. Summary and Conclusions

A comprehensive and thorough analysis has been implemented in the present study in order to interpret the present and future climate-tourism conditions on Milos island, Cyclades, Greece, by means of the assessment of the three climate components (physical, thermal, and aesthetic), for tourism planning and recreation. The tourism potential can be described in a user-friendly way by applying the Climate-Tourism-Information-Scheme (CTIS), which gives detailed climate information for tourists to foresee the thermal acceptability, aesthetic, and physical conditions for planning their vacations. Besides the bioclimate diagrams, by means of frequencies (%) of Physiologically Equivalent Temperature (PET) classes, shed light on thermal comfort conditions on Milos island. Future climate change conditions were analyzed using the high-resolution simulations (grid size 0.11° × 0.11°) of the Regional Climate Model ALADIN 5.2 from Centre National de Recherche Meteorologiques, Meteo France (CNRM). The climate simulations concerned the future periods 2021–2050 and 2071–2100 against the reference period 1961–1990, under two Representative Concentration Pathways, RCP4.5 and RCP8.5.
The findings of the performed methodology revealed that very poor thermal acceptability conditions appear both in winter and summer, against marginal in spring and autumn. Heat stress is only pronounced in July (68%) and August (69%), indicating marginal conditions in summer months against ideal environment for the rest of the year. Sunny days appear throughout the year against very poor conditions (>97%) with respect to sultriness from June to September, even in October (74%) and May (69%), against ideal conditions for the rest of the months. Marginal conditions can be considered regarding dry days while rainy days reveal rather ideal climate conditions. The future projected simulations based on RCM (Regional Climate Models) for the near future (2021–2050) under RCP4.5 and RCP8.5 scenarios show that heat stress is expected to increase in July and August, associated with a slight increase in its length. Thermal acceptability conditions seem to shift from May to March and from October to November. Furthermore, the months from November to March will become more comfortable, whereas in summer, thermal acceptability is not expected anymore. Sultriness is likely to shift from June to April and from September to November. More pronounced changes of the aforementioned parameters are expected by the end of the 21st century for both examined RCPs. Taking into account the aforementioned findings, the ideal months for the present conditions, with respect to triple S tourism, could be June and September, while in the near future, marginal (ideal) bioclimatic conditions are expected in June (May) and September (October). Regarding the far future, May and October are still fulfilling the bioclimatic criteria, but ideal conditions would be anticipated in April and even in November. Besides the triple S tourism, alternative forms of tourism, such as religious/historical tourism, geological tourism, healing/spa tourism and eco-agrotourism could take place in early spring and early winter. In conclusion, one could see that, apart from the increased heat stress mainly in summer months, the thermal acceptability will shift towards spring and autumn-early winter, giving the possibility of an extension of the touristic period, presupposing the appropriate development of touristic infrastructure.

Author Contributions

Conceptualization and writing—original draft preparation, P.T.N.; review and editing, A.M.

Funding

This research received no external funding.

Acknowledgments

The authors would like to thank the World Climate Research Programme’s Working Group on Regional Climate, and the Working Group on Coupled Modelling, former coordinating body of CORDEX and responsible panel for CMIP5. The author also thanks the climate modelling groups for producing and making available their model output.

Conflicts of Interest

The authors declare no conflict of interest.

References

  1. de Freitas, C.R. Tourism climatology: Evaluating environmental information for decision making and business planning in the recreation and tourism sector. Int. J. Biometeorol. 2003, 48, 45–54. [Google Scholar] [CrossRef] [PubMed]
  2. Didaskalou, E.; Nastos, P.; Matzarakis, A. The Development Prospects of Greek Health Tourism and the Role of the Bioclimate Regime of Greece. In Advances in Tourism Climatology; Matzarakis, A., de Freitas, C.R., Scott, D., Eds.; Berichte des Meteorologischen Institutes der Universität Freiburg: Freiburg, Germany, 2004; Volume 12, pp. 149–157. [Google Scholar]
  3. Scott, D. Why sustainable tourism must address climate change. J. Sustain. Tour. 2011, 19, 17–34. [Google Scholar] [CrossRef]
  4. Nastos, P.T.; Kapsomenakis, J.; Giannakopoulos, C.; Matzarakis, A.; Zerefos, C.S. Present and future projections of human-bioclimatic conditions over Peloponnese, based on regional climate model simulations. In E-Book of Proceedings, 12th International Conference of Meteorology, Climatology and Physics of the Atmosphere, Heraklion, Greece, 28–31 May 2014; Crete University Press: Rethymnon, Greece, 2014; Volume 2, pp. 293–298. [Google Scholar]
  5. Didaskalou, E.A.; Nastos, P.T. The role of climatic and bioclimatic conditions in the development of health tourism product. Anatolia 2003, 14, 107–126. [Google Scholar] [CrossRef]
  6. Nastos, P.T.; Kapsomenakis, J. Regional climate model simulations of extreme air temperature in Greece. Abnormal or common records in the future climate? Atmos. Res. 2014, 152, 43–60. [Google Scholar] [CrossRef]
  7. IPCC. Climate Change 2007: The Scientific Basis. Contribution of the Working Group I to the Fourth Assessment Report of the Intergovernmental Panel on Climate Change; Solomon, S., Qin, D., Manning, M., Chen, Z., Marquis, M., Avery, K.B., Tignor, M., Miller, H.L., Eds.; Cambridge University Press: Cambridge, UK, 2007. [Google Scholar]
  8. Kozak, M. Comparative analysis of tourist motivations by nationality and destinations. Tour. Manag. 2002, 23, 221–232. [Google Scholar] [CrossRef]
  9. Amelung, B.; Nicholls, S.; Viner, D. Implications of Global Climate Change for Tourism Flows and Seasonality. J. Travel Res. 2007, 45, 285–296. [Google Scholar] [CrossRef]
  10. Smith, K. The influence of weather and climate on recreation and tourism. Weather 1993, 48, 398–404. [Google Scholar] [CrossRef]
  11. Rutty, M.; Scott, D. Will the Mediterranean become too hot for tourism? A reassessment. Tour. Hosp. Plan. Dev. 2010, 7, 267–281. [Google Scholar] [CrossRef]
  12. Scott, D.; Lemieux, C. Weather and climate information for tourism. Procedia Environ. Sci. 2010, 1, 146–183. [Google Scholar] [CrossRef]
  13. Matzarakis, A. Assessment method for climate and tourism based on daily data. In Developments in Tourism Climatology; Matzarakis, A., de Freitas, C.R., Scott, D., Eds.; University of Freiburg: Freiburg, Germany, 2007; pp. 52–58. [Google Scholar]
  14. Matzarakis, A. Weather and climate related information for tourism. Tour. Hosp. Plan. Dev. 2006, 3, 99–115. [Google Scholar] [CrossRef]
  15. Mieczkowski, Z. The tourism climate index: A method for evaluating world climates for tourism. Can. Geogr. 1985, 29, 220–233. [Google Scholar] [CrossRef]
  16. de Freitas, C.R.; Scott, D.; McBoyle, G. A second generation climate index for tourism (CIT): Specification and verification. Int. J. Biometeorol. 2008, 52, 399–407. [Google Scholar] [CrossRef]
  17. Lin, T.P.; Matzarakis, A. Tourism climate and thermal comfort in Sun Moon Lake, Taiwan. Int. J. Biometeorol. 2008, 52, 281–290. [Google Scholar] [CrossRef]
  18. Matzarakis, A.; Nastos, P. Analysis of tourism potential for Crete Island, Greece. Glob. Nest J. 2011, 13, 142–150. [Google Scholar]
  19. Błazejczyk, K.; Epstein, Y.; Jendritzky, G.; Staiger, H.; Tinz, B. Comparison of UTCI to selected thermal indices. Int. J. Biometeorol. 2012, 56, 515–535. [Google Scholar] [CrossRef]
  20. Mayer, H.; Höppe, P.R. Thermal comfort of man in different urban environments. Theor. Appl. Climatol. 1987, 38, 43–49. [Google Scholar] [CrossRef]
  21. Höppe, P. The physiological equivalent temperature—A universal index for the biometeorological assessment of the thermal environment. Int. J. Biometeorol. 1999, 43, 71–75. [Google Scholar] [CrossRef]
  22. Matzarakis, A.; Mayer, H.; Iziomon, M.G. Applications of a universal thermal index: Physiologically equivalent temperature. Int. J. Biometeorol. 1999, 43, 76–84. [Google Scholar] [CrossRef]
  23. Bleta, A.; Nastos, P.T.; Matzarakis, A. Assessment of bioclimatic conditions in Crete Island, Greece. Reg. Environ. Chang. 2013, 14, 1967–1981. [Google Scholar] [CrossRef]
  24. Nastos, P.T.; Matzarakis, A. Human Bioclimatic Conditions, Trends, and Variability in the Athens University Campus, Greece. Adv. Meteorol. 2013, 2013, 976510. [Google Scholar] [CrossRef]
  25. Staiger, H.; Laschewski, G.; Matzarakis, A. Selection of Appropriate Thermal Indices for Applications in Human Biometeorological Studies. Atmosphere 2019, 10, 18. [Google Scholar] [CrossRef]
  26. Jendritzky, G.; de Dear, R.; Havenith, G. UTCI—Why another thermal index? Int. J. Biometeorol. 2012, 56, 421–428. [Google Scholar] [CrossRef]
  27. Matzarakis, A. Climate Change: Temporal and spatial dimension of adaptation possibilities at regional and local scale. In Tourism and the Implications of Climate Change: Issues and Actions; Schott, C., Ed.; Emerald Group Publishing: Bingley, UK, 2010; pp. 237–259. [Google Scholar]
  28. Matzarakis, A. Transfer of climate data for tourism applications—The Climate-Tourism/Transfer-Information-Scheme. Sustain. Environ. Res. 2014, 24, 273–280. [Google Scholar]
  29. Radu, R.; Deque, M.; Somot, S. Spectral nudging in a spectral regional climate model. Tellus A Dyn. Meteorol. Oceanogr. 2008, 60, 898–910. [Google Scholar] [CrossRef] [Green Version]
  30. Colin, J.; Déqué, M.; Radu, R.; Somot, S. Sensitivity study of heavy precipitations in Limited Area Model climate simulation: Influence of the size of the domain and the use of the spectral nudging technique. Tellus A Dyn. Meteorol. Oceanogr. 2010, 62, 591–604. [Google Scholar] [CrossRef]
  31. Kuttler, W. Stadtklima, Handbuch der Umweltveranderungen und Okotoxologie, Band 1B: Atmosphäre; Guderian, R., Ed.; Springer: New York, NY, USA, 2000; pp. 420–470. [Google Scholar]
  32. Troen, I.; Petersen, E. European Wind Atlas; National Laboratory: Roskilde, Denmark, 1989; p. 656. ISBN 87-550-1482-8.
  33. Zaninovic, K.; Matzarakis, A. The Biometeorological Leaflet as a means conveying climatological information to tourists and the tourism industry. Int. J. Biometeorol. 2009, 53, 369–374. [Google Scholar] [CrossRef]
  34. Clarke, L.E.; Edmonds, J.A.; Jacoby, H.D.; Pitcher, H.; Reilly, J.M.; Richels, R. Scenarios of greenhouse gas emissions and atmospheric concentrations. In Sub-Report 2.1A of Synthesis and Assessment Product 2.1. Climate Change Science Program and the Subcommittee on Global Change Research; Department of Energy, Office of Biological & Environmental Research: Washington, DC, USA, 2007. [Google Scholar]
  35. Wise, M.; Calvin, K.; Thomson, A.; Clarke, L.; Bond-Lamberty, B.; Sands, R.; Smith, S.J.; Janetos, A.; Edmonds, J. Implications of limiting CO2 concentrations for land use and energy. Science 2009, 324, 1183–1186. [Google Scholar] [CrossRef]
  36. Riahi, K.; Grόbler, A.; Nakicenovic, N. Scenarios of long-term socio-economic and environmental development under climate stabilization. Technol. Forecast. Soc. Chang. 2007, 74, 887–935. [Google Scholar] [CrossRef]
  37. VDI 3787. Part I: Environmental Meteorology, Methods for the Human Biometeorological Evaluation of Climate and Air Quality for the Urban and Regional Planning at Regional Level. Part I: Climate; Beuth: Berlin, Germany, 1998. [Google Scholar]
  38. Matzarakis, A.; Fröhlich, D.; Bermon, S.; Adami, P.E. Quantifying Thermal Stress for Sport Events—The Case of the Olympic Games 2020 in Tokyo. Atmosphere 2018, 9, 479. [Google Scholar] [CrossRef]
Figure 1. Milos Island, Cyclades, Greece. The red frame indicates the location of Milos in the Cyclades complex in the Aegean Sea. Milos is the main island in the image, obtained from World Wind, NASA.
Atmosphere 10 00145 g001
Figure 2. Bioclimate diagram for Milos island, indicating PET frequency (%) per month, for the reference period 1961–1990.
Atmosphere 10 00145 g002
Figure 3. Bioclimate diagram for Milos Island, indicating PET frequency (%) per month, for the near future 2021–2050, based on Centre National de Recherche Meteorologiques (CNRM) regional climate model for two Representative Concentration Pathways (RCPs), RCP4.5 (upper graph) and RCP8.5 (lower graph).
Atmosphere 10 00145 g003aAtmosphere 10 00145 g003b
Figure 4. Bioclimate diagram for Milos island, indicating PET frequency (%) per month, for the far future 2071–2100, based on CNRM regional climate model for two Representative Concentration Pathways, RCP4.5 (upper graph) and RCP8.5 (lower graph).
Atmosphere 10 00145 g004
Figure 5. Climate-Tourism-Information-Scheme (CTIS), expressed by probabilities (%, upper graph) and by suitability of climatic factors (lower graph) for Milos island, within the reference period 1961–1990.
Atmosphere 10 00145 g005
Figure 6. Climate-Tourism-Information-Scheme (CTIS), expressed by probabilities (%) and by suitability of climatic factors for Milos island for the near future 2021–2050, based on the CNRM regional climate model for two Representative Concentration Pathways, RCP4.5 (upper graphs) and RCP8.5 (lower graphs).
Atmosphere 10 00145 g006
Figure 7. Climate-Tourism-Information-Scheme (CTIS), expressed by probabilities (%) and by suitability of climatic factors for Milos island for the far future 2071–2100, based on the CNRM regional climate model for two Representative Concentration Pathways, RCP4.5 (upper graphs) and RCP8.5 (lower graphs).
Atmosphere 10 00145 g007
Table 1. Mean climatic characteristics for Milos island (1955–2018).
MonthsMean Temperature
(°C)
Mean Maximum Temperature
(°C)
Mean Minimum Temperature
(°C)
Mean Relative Humidity
(%)
Mean Cloudiness
(octas)
Mean Precipitation
(mm)
Prevailing Wind DirectionMean Wind Speed
(knots)
January10.8513.138.7172.535.0074.89N14.74
February10.7913.578.6071.194.8854.04N14.92
March12.1615.179.7169.974.3149.17N13.41
April15.2718.7012.3365.643.5822.50N10.93
May19.6123.4216.0260.232.4813.62N8.82
June23.9327.6120.0854.611.133.26N8.84
July25.6529.1322.3055.810.370.31N11.36
August25.3928.8622.2359.540.441.29N11.69
September22.8126.1719.9464.171.497.39N11.08
October18.9822.1016.6069.763.1937.79N11.91
November15.5618.3813.2773.174.3058.76N11.72
December12.5114.7710.3873.424.9385.05N13.91
Year17.7920.9215.0165.843.01408.08N11.94
Table 2. Threshold values of Physiologically Equivalent Temperature (PET) for different grades of thermal sensation and physiological stress on human beings, during standard conditions [22].
PET (°C)Thermal PerceptionPhysiological Stress Level
<4Very ColdExtreme Cold Stress
4–8ColdStrong Cold Stress
8–13CoolModerate Cold Stress
13–18Slightly CoolSlight Cold Stress
18–23ComfortableNo Thermal Stress
23–29Slightly WarmSlight Heat Stress
29–35WarmModerate Heat Stress
35–41HotStrong Heat Stress
>41Very HotExtreme Heat Stress
Table 3. Definition of parameters used in the Climate-Tourism-Information-Scheme [21].
ParameterThreshold
Cold stressPET < 8 °C
Thermal acceptability18 °C < PET < 29 °C
Heat stressPET > 35 °C
Sunny daysCloud cover < 4 octas
FogRelative humidity > 93%
SultrinessVapor pressure > 18 hPa
Dry days Precipitation ≤ 1 mm
RainPrecipitation > 5 mm
Stormy conditionsWind velocity > 8 m/s

