Article

Changes in Means and Extreme Events of Sea Surface Temperature in the East China Seas Based on Satellite Data from 1982 to 2017

1
Tianjin Meteorological Observatory, Tianjin 300074, China
2
National Marine Data and Information Service, Tianjin 300171, China
3
Laboratory for Climate Studies, National Climate Center, China Meteorological Administration, Beijing 100081, China
4
Collaborative Innovation Center on Forecast and Evaluation of Meteorological Disasters (CIC-FEMD), Nanjing University of Information Science & Technology, Nanjing 210044, China
*
Author to whom correspondence should be addressed.
Atmosphere 2019, 10(3), 140; https://doi.org/10.3390/atmos10030140
Submission received: 7 January 2019 / Revised: 5 March 2019 / Accepted: 5 March 2019 / Published: 14 March 2019
(This article belongs to the Special Issue Climate Change Impacts on Coastal Areas)

Abstract

:
Marginal seas are fundamental to humans for their importance in mariculture resources and commerce. Based on the NOAA 0.25 degree daily Optimum Interpolation (OI) sea surface temperature (SST) data set, spatiotemporal changes in mean and extreme SST in the East China Seas (ECSs) were examined for from 1982 to 2017. As a regional average, the annual mean SST has notably increased at a rate of 0.21 ± 0.08 °C per decade. The warming SST during 1982–2017 is probably related to the influence from a recent strengthening and westward extension of the WPSH. There are also notable warming trends in annual minimum and maximum SST. Spatially, the rapid warming of annual mean SSTs are located in the vicinity of the Yangtze Estuary, exceeding 0.2 °C per decade and part of the ECS-Kuroshio. This pattern may be largely affected by the spatial changes of minimum SST. Rapid warming of maximum SST can be found across the region, from the northern East China Sea (ECS) to the Bohai Sea. Since 1982, extreme hot days (EHDs) have undergone an obvious increasing trend, at a rate of 15.2 days per decade. Conversely, extreme cold days (ECDs) have been decreasing. Notably, the largest increase of EHDs appears in the western ECS and the Bohai Sea, which both have rich marine ecosystems. The trend of EHDs has a significant relationship to mean SST, suggesting that there will be a further increase in EHDs under continued warming in the ECSs. These findings emphasize the importance and urgency of strategies which should be planned for the adaptation and mitigation of specific types of extreme hot events in this region.

1. Introduction

Sea surface temperature (SST) is considered to be one of the most important indicators in quantifying climate change [1]. A rapid warming is expected to have a large impact on regional marine biodiversity, both at the ecosystem level and at the population level [2]. The Fifth Assessment Report of the Intergovernmental Panel on Climate Change affirmed that our warming of the climate system is unequivocal and its extremes are also changing [3]. To better adapt to climate warming and decision-making, an improved and detailed understanding of regional climate changes is required.
Part of the Northwest Pacific Ocean, the Bohai Sea, Yellow Sea, and East China Sea (ECSs) is located at one of the largest continental shelves in the world, with a large number of estuaries, gulfs, freshwater inputs, and maricultures. There have been much literature focused on the SST variability over the China Seas [4,5,6,7,8]. They found that the mean warming in the China Seas has been considerably faster than the global average. In addition, the ECSs are vulnerable to climate change, especially changes in climate extremes [4,6,9]. However, the previous studies covering the China Seas typically used reconstructed or reanalyzed monthly mean SST data sets. The detailed extreme hot and cold SST changes and their relationship with changes in SST annual ranges (ARs) remain unknown, owing to the lower spatial and temporal resolution of data sets. At present, extreme water temperature events can cause shifts in species ranges, local extinctions, and economic loss on aquaculture and seafood industries [9,10,11]. For instance, the rapid warming of the ECSs has been linked to frequent occurrences of harmful algae blooms and northward shifts of marine fishes [12]. A Chinese Marine Disaster Bulletin from 2012 [13] indicated that severely harmful algae occurred at the coast of the southern ECS, causing a direct economic loss of two billion RMB. Changes in the SST at shorter than seasonal scales and variations in the frequency of SST extreme events in sub-region scales should be taken into account when planning for strategies to mitigate these changes. Thus, the present study adds some new insights into understanding the inter-annual variations of annual mean, annual minimum, annual maximum SSTs, and AR averaged of the ECSs and spatial distribution of trends in the ECSs from 1982 to 2017. Meanwhile, extreme hot and cold events are also detected in detail during the study period. Finally, we will discuss the possible preliminary impacts on marine fisheries. The information through our work will improve the understanding of the hydrography and climate trends in this region and benefit fisheries and marine biological research.
The remainder of the paper is organized as follows. Following the introduction, Section 2 briefly introduces the study region, data sources, and methods. Section 3 describes the changes of mean SST and extreme SST. Changes in extreme events are conducted in the following section. A summary and discussion are given in Section 5.

2. Study Region, Data Source and Methods
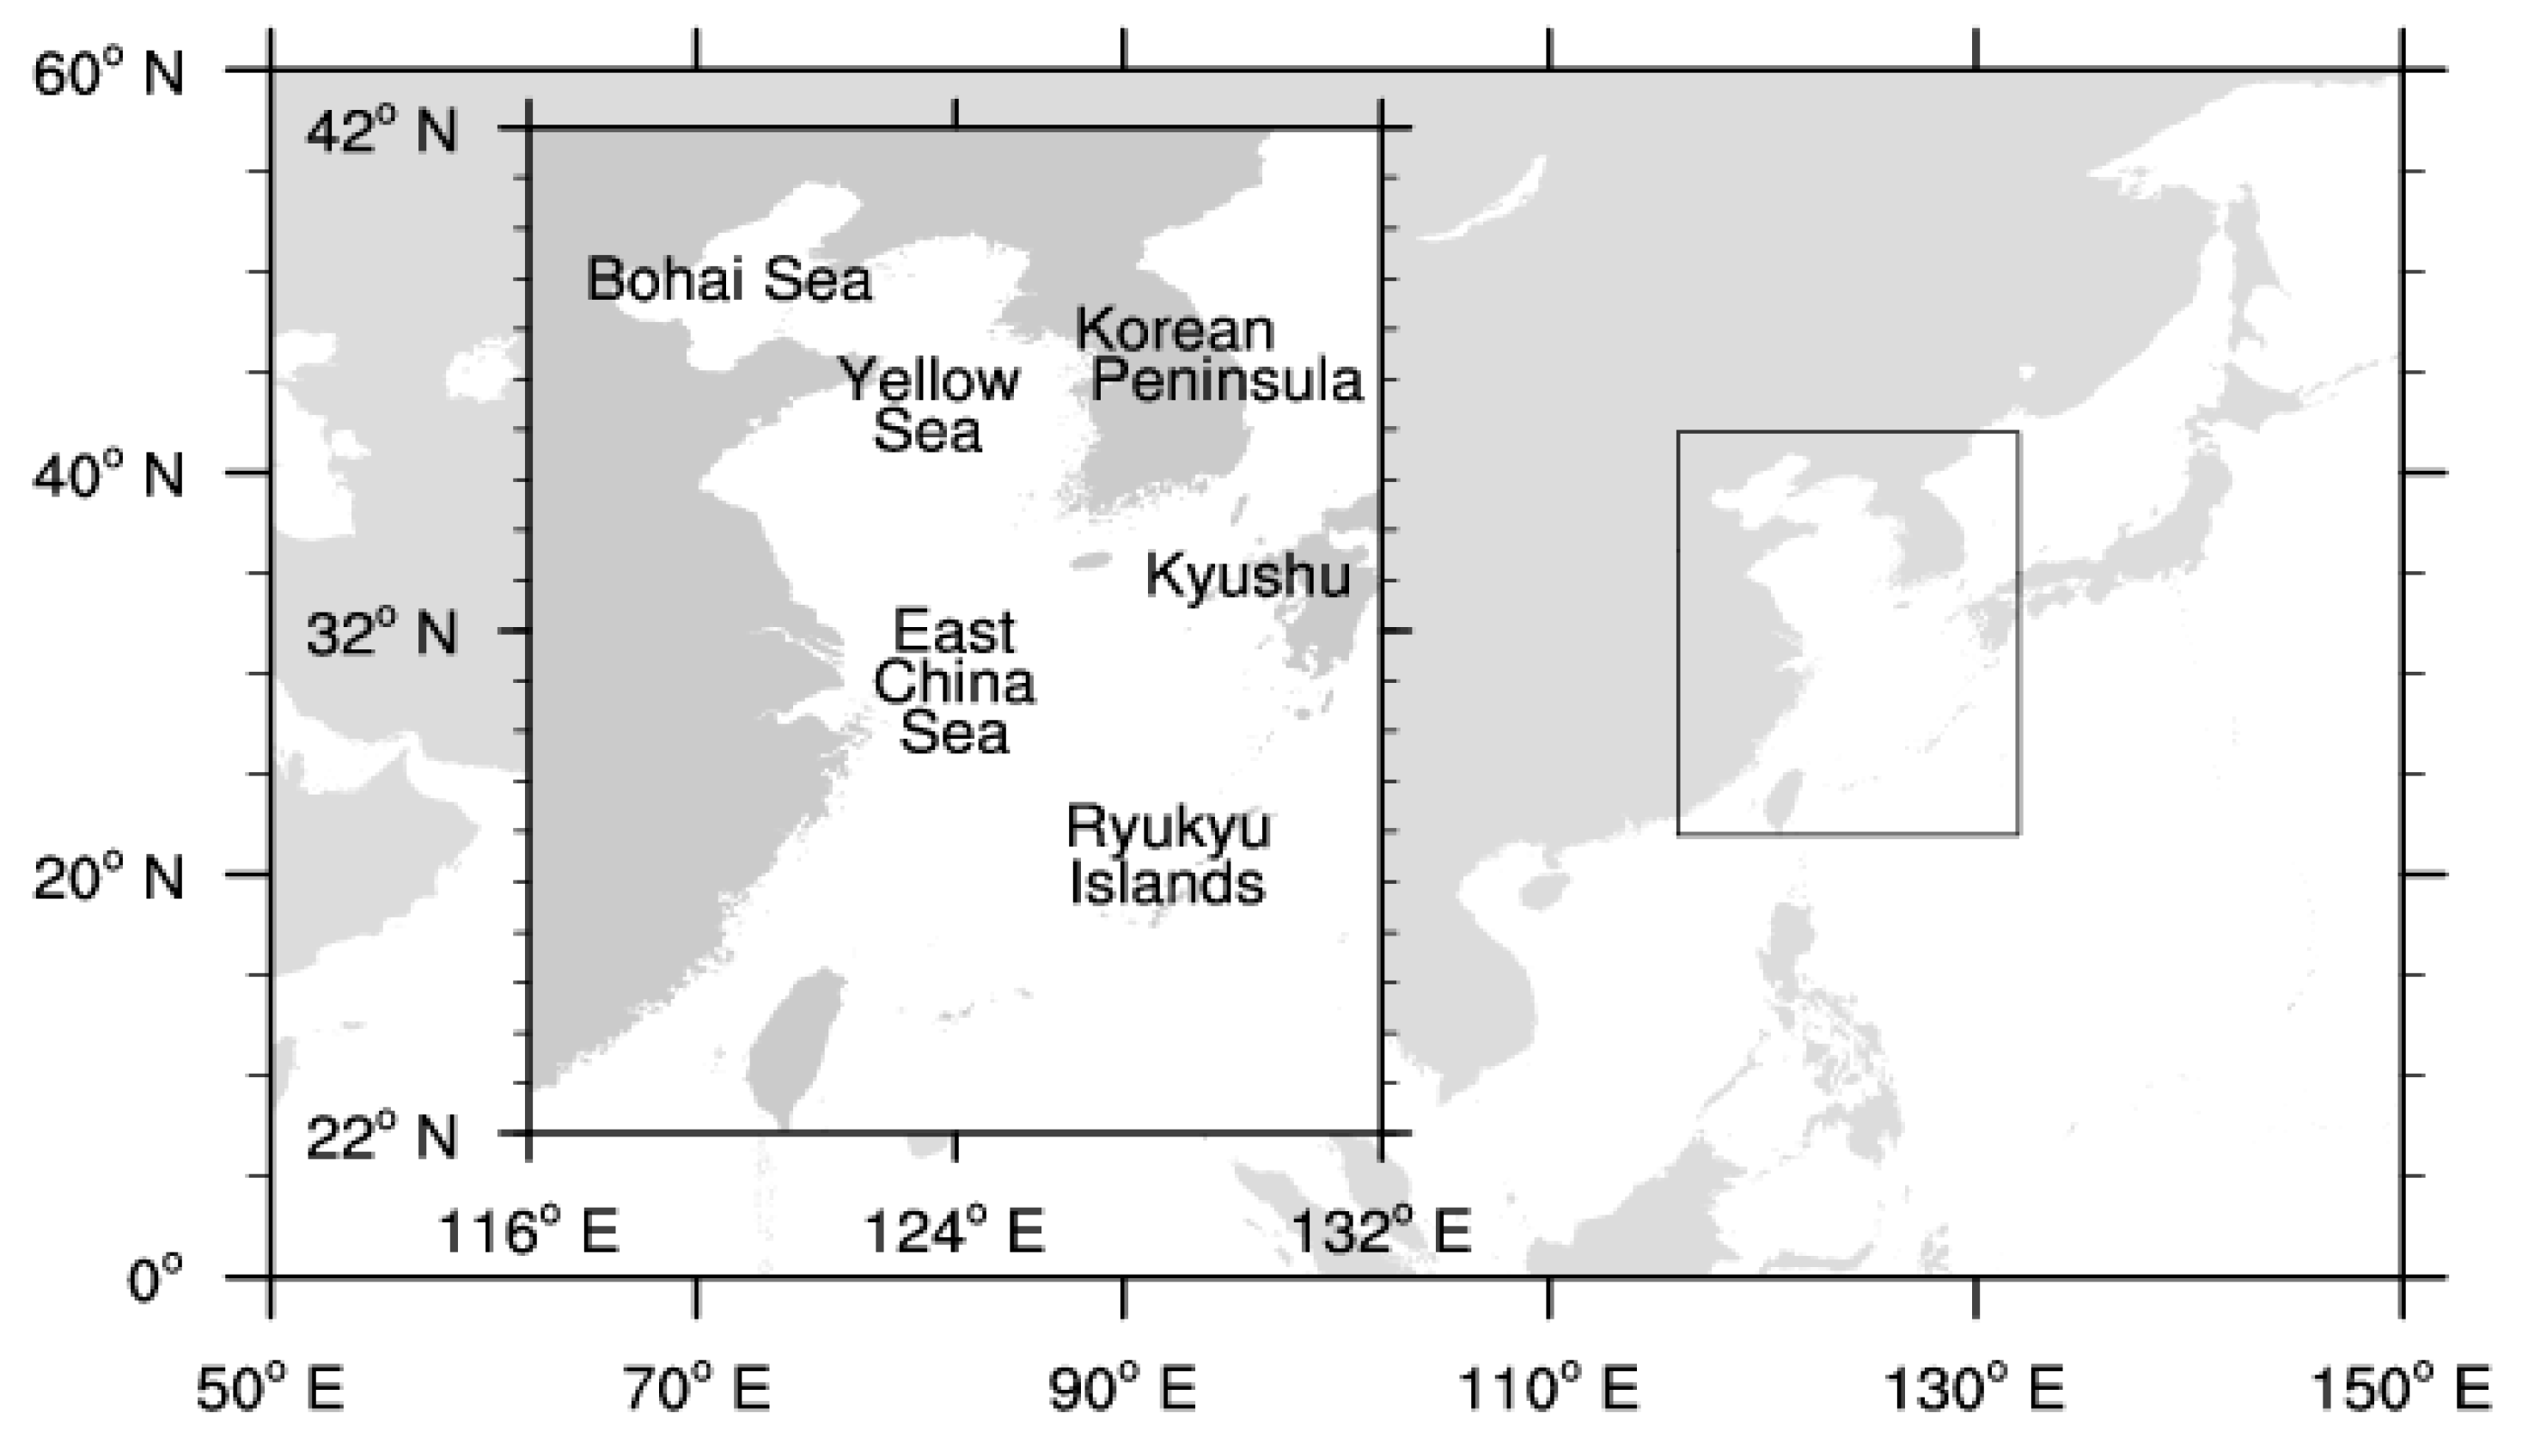
2.1. Study Region

The study region including the Bohai Sea, the Yellow Sea, and the East China Sea (ECS) is bounded by China, the Ryukyu (Nansei) Islands, Kyushu, and the Korean Peninsula (Figure 1). The study region also covered a vicinity area in order to show a better perspective for the SST variability, such as the SST variability in the ECS-Kuroshio. Thus, we approximated the study region in a range of 116–132° E and 22–42° N.

2.2. Data Source

A daily SST data set was acquired from the NOAA National Climatic Data Center (NCDC), available at https://www.ncdc.noaa.gov/oisst with a high spatial resolution of 0.25° × 0.25° from 1982–2017 [14]. This data set is derived from the Optimum Interpolation (OI) SST Analysis Product, referred herein as OISST v2, which uses SST data from an advanced very high-resolution radiometer infrared satellite from the Pathfinder satellite combined with buoy data, ship data, and sea ice data SST data sets. In order to apply the correction for bias in OISST, the satellite data have been classified into daytime and nighttime bins and corrected separately using the patterns of 15 days averaged by in situ SSTs using NOAA’s OI algorithm. The bias-corrected daytime and nighttime satellite SST, ship, and buoy SSTs are merged based on noise-to-signal ratio maps for each data type, which have averaged weights of 15.1, 15.1, 1.0, and 15.1, respectively. Therefore, it can be interpreted as the bulk SST at about 0.5 m depth [15].
In this paper, we use the Taylor diagram to provide a statistical summary of how well the OISST v2 represents the 19 stations-based observations along the coastal ECSs. In order to do the comparison and evaluation, OISST v2 has been interpolated to the stations’ locations. The correlation and standard deviation on the annual basis are computed and shown in a Taylor diagram (Figure 2). As seen in Figure 2, OISST v2 are clustered around the reference values (REF), except for 4 points (points 3, 13, 14, and 18). Most of them have positive correlations with observations in the range of 0.5~0.9. A total of 79% of these points has a lower standard deviation and smaller root mean square error, which suggests that OISST and in situ water temperatures in the coast area of China agree reasonably well. Additional analysis (not shown here) indicated that there is no statistically significant trend in the differences between the long-term water temperature records. OISST is currently the longest satellite data record that can be used to study long-term SST variability. This data set has been widely used in scientific researches [16,17,18,19]. The suitability of the data base to identify extreme events was previously shown in work of Lima and Wethdy and Liao et al. [16,20].

2.3. Annual Frequency of Extremely Cold and Hot Days

Extreme days were carried out for each pixel as follows: daily SST anomalies were calculated to remove the seasonal cycle. This was achieved by subtracting from the SST of a certain day (e.g., January 1, 1982) the mean temperature of that day (January 1) of the climatic baseline period of 1982–2011 [17,21]. Therefore, an extreme day can occur at any time of the year. An EHD (or ECD) is defined as a day with its SST anomaly above (or below for ECDs) the 90th (or 10th for ECDs) percentile of standardized anomaly of the climatic baseline period. Then, the number of EHDs (or ECDs) was calculated as the number of days per year with extremely high (low for ECDs) SST anomalies.

2.4. Testing for Significance of Correlations and Trends

When test the significance of correlation between two time series and the significance of the presence of trends in a time series, an important question requires consideration: how large sample correlations and sample trends need to be, even if the stochastic processes, which generate the series, are not correlated at all and exhibit no trends. Firstly, we have to make an assumption, namely the processes X and Y share no correlation, or segments of length L of the process have no trend. Standard procedures are available in the literature, namely p values for correlations and Mann–Kendall for trends [22,23] when there are “no correlations” between the underlying processes and trends can hardly appear in limited segments of an infinite stationary time series.
In the case of correlations, the assumption is that the underlying processes are stationary (free of systematic trends) and serially independent, that is, Xt and Xt+1 for any t are independent. In the case of trends, the assumption is the independence of X t . However, in geophysical cases, these assumptions are not satisfied—the result is that the null hypotheses are more often falsely rejected (i.e., in cases where there are no correlations or no trends [22] than stipulated by the significance level (normally 5%).
A practical remedy for avoiding such errors is to deal with normalized series (mean = 0, standard deviation = 1) X t (and Y t ) as follows:
(1)
“detrend” the time series before testing for correlations between two time series X t and Y t . Firstly, determining the linear fit f t X and f t Y , and then do the hypothesis testing with X t = X t f t X and Y t = Y t f t Y
(2)
“prewhiten” the time series, by first determining the sample autocorrelation α = 1 / L t X t X t + 1 of the time series X t of length L, and forming a series X t = X t α X t , and then testing for the null hypothesis of no trend.
For both cases, the standard routines are applied. If the null hypothesis is rejected at the stipulated significance level of 5%, then the sample trend f t X , or the sample correlation 1 / L t X t X t + 1 , is considered “significant”.

3. Annual SST Changes

Figure 3 shows the time series of regional averaged annual mean SST, maximum SST and minimum SST anomalies in the ECS from 1982 to 2017, as well as AR SST, which was defined as the difference between the annual maximum SST and minimum SST. The annual mean SST increased at a rate of 0.21 ± 0.08 °C per decade, significant at the 95% level (p < 0.05) (Figure 3a). The warming trend is higher than the global average SST warming rate of 0.15 ± 0.03 °C per decade from 1982 to 2017. Moreover, we found that the largest annual mean SST anomaly appeared in 1998, followed by the second largest SST anomaly in 2016. Both of the 1997/1998 and 2015/2016 El Niño events are by far the strongest El Niño events since the beginning of the 20th century [24,25]. The SST peaks were probably caused by the low-frequency El Niño/Southern Oscillation (ENSO) variabilities [26,27]. When ENSO is closely related to the East Asian Monsoon [28,29], it can lead to weaker than normal East Asian Winter Monsoon (EAWM) and a stronger west Pacific subtropical high (WPSH) [8,30,31,32], and also favors an abnormally high SST in the marginal seas.
The general warming may have been mainly caused by anthropogenic increase in atmospheric CO2 concentration [33], and partly by the urbanization effect around the observational stations. In this subsection, however, we further analyzed the possible relationship between the warming and the large-scale atmosphere circulation modes. As shown in Figure 4a–c, the WPSH indices of area and intensity notably increased during 1982–2017, in contrast to the westward extension index, which notably decreased with the longitude of the western edge of the WPSH ridge decreasing. The strengthening and westward extension of the WPSH could have caused strong descending motion and contributed considerably to the surface warming in study region. It is clear that the EAWM index shifted through several phases during 1982–2017 (Figure 4d). The EAWM index decreased during 1982–1997 and increased notably after 1998. During this whole period, there was no significant tendency for the EAWM index. Thus, an increasing SST during 1982–2017 is probably related to the influence from the recent strengthening and westward extension of the WPSH.
To better examine changes in the minimum and maximum SST over time, statistical distribution of the annual mean SST at two 18-year periods were calculated; one covering 1982–1999, and the other one covering 2000–2017 (Figure omitted). A shift in the annual mean SST was noticeable. The mean SST shifted by 0.35 °C, from 20.62 °C to 20.97 °C. Slight changes in mean climate can cause disproportionally larger changes in the intensity and frequency of extremes [34,35]. During this study period, the increasing rate of the annual minimum SST anomalies is 0.21 ± 0.18 °C per decade, significant at the 95% level (p < 0.05) (Figure 3b). The annual maximum SST increased at a rate of 0.20 ± 0.13 °C per decade, significant at the 95% level (p < 0.05) (Figure 3c). However, during the studied period, regional averaged AR SST showed an insignificant decreasing range trend of −0.02 ± 0.02 °C per decade (Figure 3d), which may due to the similar warming amplitudes of annual maximum and minimum SST.
Spatially, the significant high warming rates of the annual mean SST appear in the western ECS and part of the ECS-Kuroshio, exceeding 0.2 °C per decade (Figure 5a). In them, warming rates of the Yangtze River estuary are especially large, up to 0.4 °C per decade. The rapid warming in the western ECS coincides with the previous findings [7,8]. Studies pointed that the stream temperature in the vicinity of the Yangtze Estuary had increased by ~2 °C since 1986, thereby contributing to the extremely rapid warming observed in the western ECS [4,36]. However, the other significant warming at the ECS-Kuroshio has not been captured using the coarse SST grid dataset in the previous studies. There are weak cooling trends occurs in the west of the Korea Island in Figure 5a which were not clearly shown in the previous studies and needs a further investigation.
We also estimate the trends distribution of annual minimum and maximum SST in the study region (Figure 5b,c). Comparing to the rapid warming of minimum SST in the range of the ECS-Kuroshio and the Yangtze River estuary, the maximum SST shows clear increasing in the most part from the northern ECS to the Bohai Sea. The inter-annual SST variability in the ECSs is not only associated with large-scale climate oscillations in the Pacific (for instance, Pacific Decadal Oscillation, North Pacific Oscillation, East Asia Monsoon, ENSO, etc.) but also affect by many local processes, including the Yangtze River discharge, Kuroshio, and East Asian Monsoon, etc. The complex local processes may lead to regional differences in trends. Wu et al. [6] related the phenomenon of high SST increasing trend along the western Pacific marginal seas to the poleward shift and the intensification of the Kuroshio. In boreal winters, weakening northeasterly winds after 1982 would strengthen the northward advection of the Kuroshio and its cross-shelf currents into the ECS, due to a strong southward upper Ekman drift [31]. It is actually coincident with the finding that a rapid warming of annual minimum SST in the range of the ECS-Kuroshio. As shown in Figure 5d, there is an out-of-phase change on both sides of 30° N (Figure 5d). The AR SST is notably weakened in the band of the ECS-Kuroshio, with the decreasing center located at (127–128° E, 28-30° N). The decrease of the AR SST is associated with a rapid warming of the minimum SST and the slow warming of the maximum SST. AR SSTs in the Bohai Sea and the Yellow Sea are increasing, except some much small areas.

4. Changes in the Extreme Events and Their Relationship with Mean SST

In this section, we examine the changes of extreme SSTs based on the daily OISST v2. Figure 6 exhibits the time series of regional averaged annual EHDs and ECDs in the study region. The number of annual EHDs significantly increased, at a rate of 15.2 days per decade (significant at the 95% level, p < 0.05). In contrast, the number of annual ECDs remarkably decreased, at a rate of 10.5 days per decade (significant at the 95% level, p < 0.05). Annual EHDs and ECDs are positively (0.80) and negatively (-0.92) correlated with annual mean SST, respectively. In general, the increase of EHDs is accompanied by a decrease of ECDs (r = −0.76, p < 0.01). Therefore, the region with higher warming rates tends to have more EHDs and less ECDs. Spatially, significant increases in the frequency of EHDs were observed over the western ECS and the Bohai Sea (near shore areas even exceeding 20 days per decade), in association with a decrease in the frequency of ECDs simultaneously in Figure 7. This high rate is consistent with a rapid warming of annual mean SST in the western ECS. Lima and Wethey [17] studied trends of coastal warm and cold days in the world’s coastlines from 1982 to 2010 using OISST v2. They detected an increase in EHDs on the range of 10~20 days per decade and the decrease in ECDs on the range of 5~15 days per decade in the coastline of the China Seas, consistent with our finding of the rapid increase of EHDs in the coastal areas.

5. Summary and Discussions

Our main goal in this paper was to characterize the changes in mean and extreme SST in the ECSs. For this purpose, we used the NOAA OISST v2, which has high spatial and temporal resolutions. The analysis of SST variability in the ECSs successfully lead to a better understanding of this marine environment, including climate related hydrographic and ecosystem trends. The main findings of the present study can be summarized as follows:
(1)
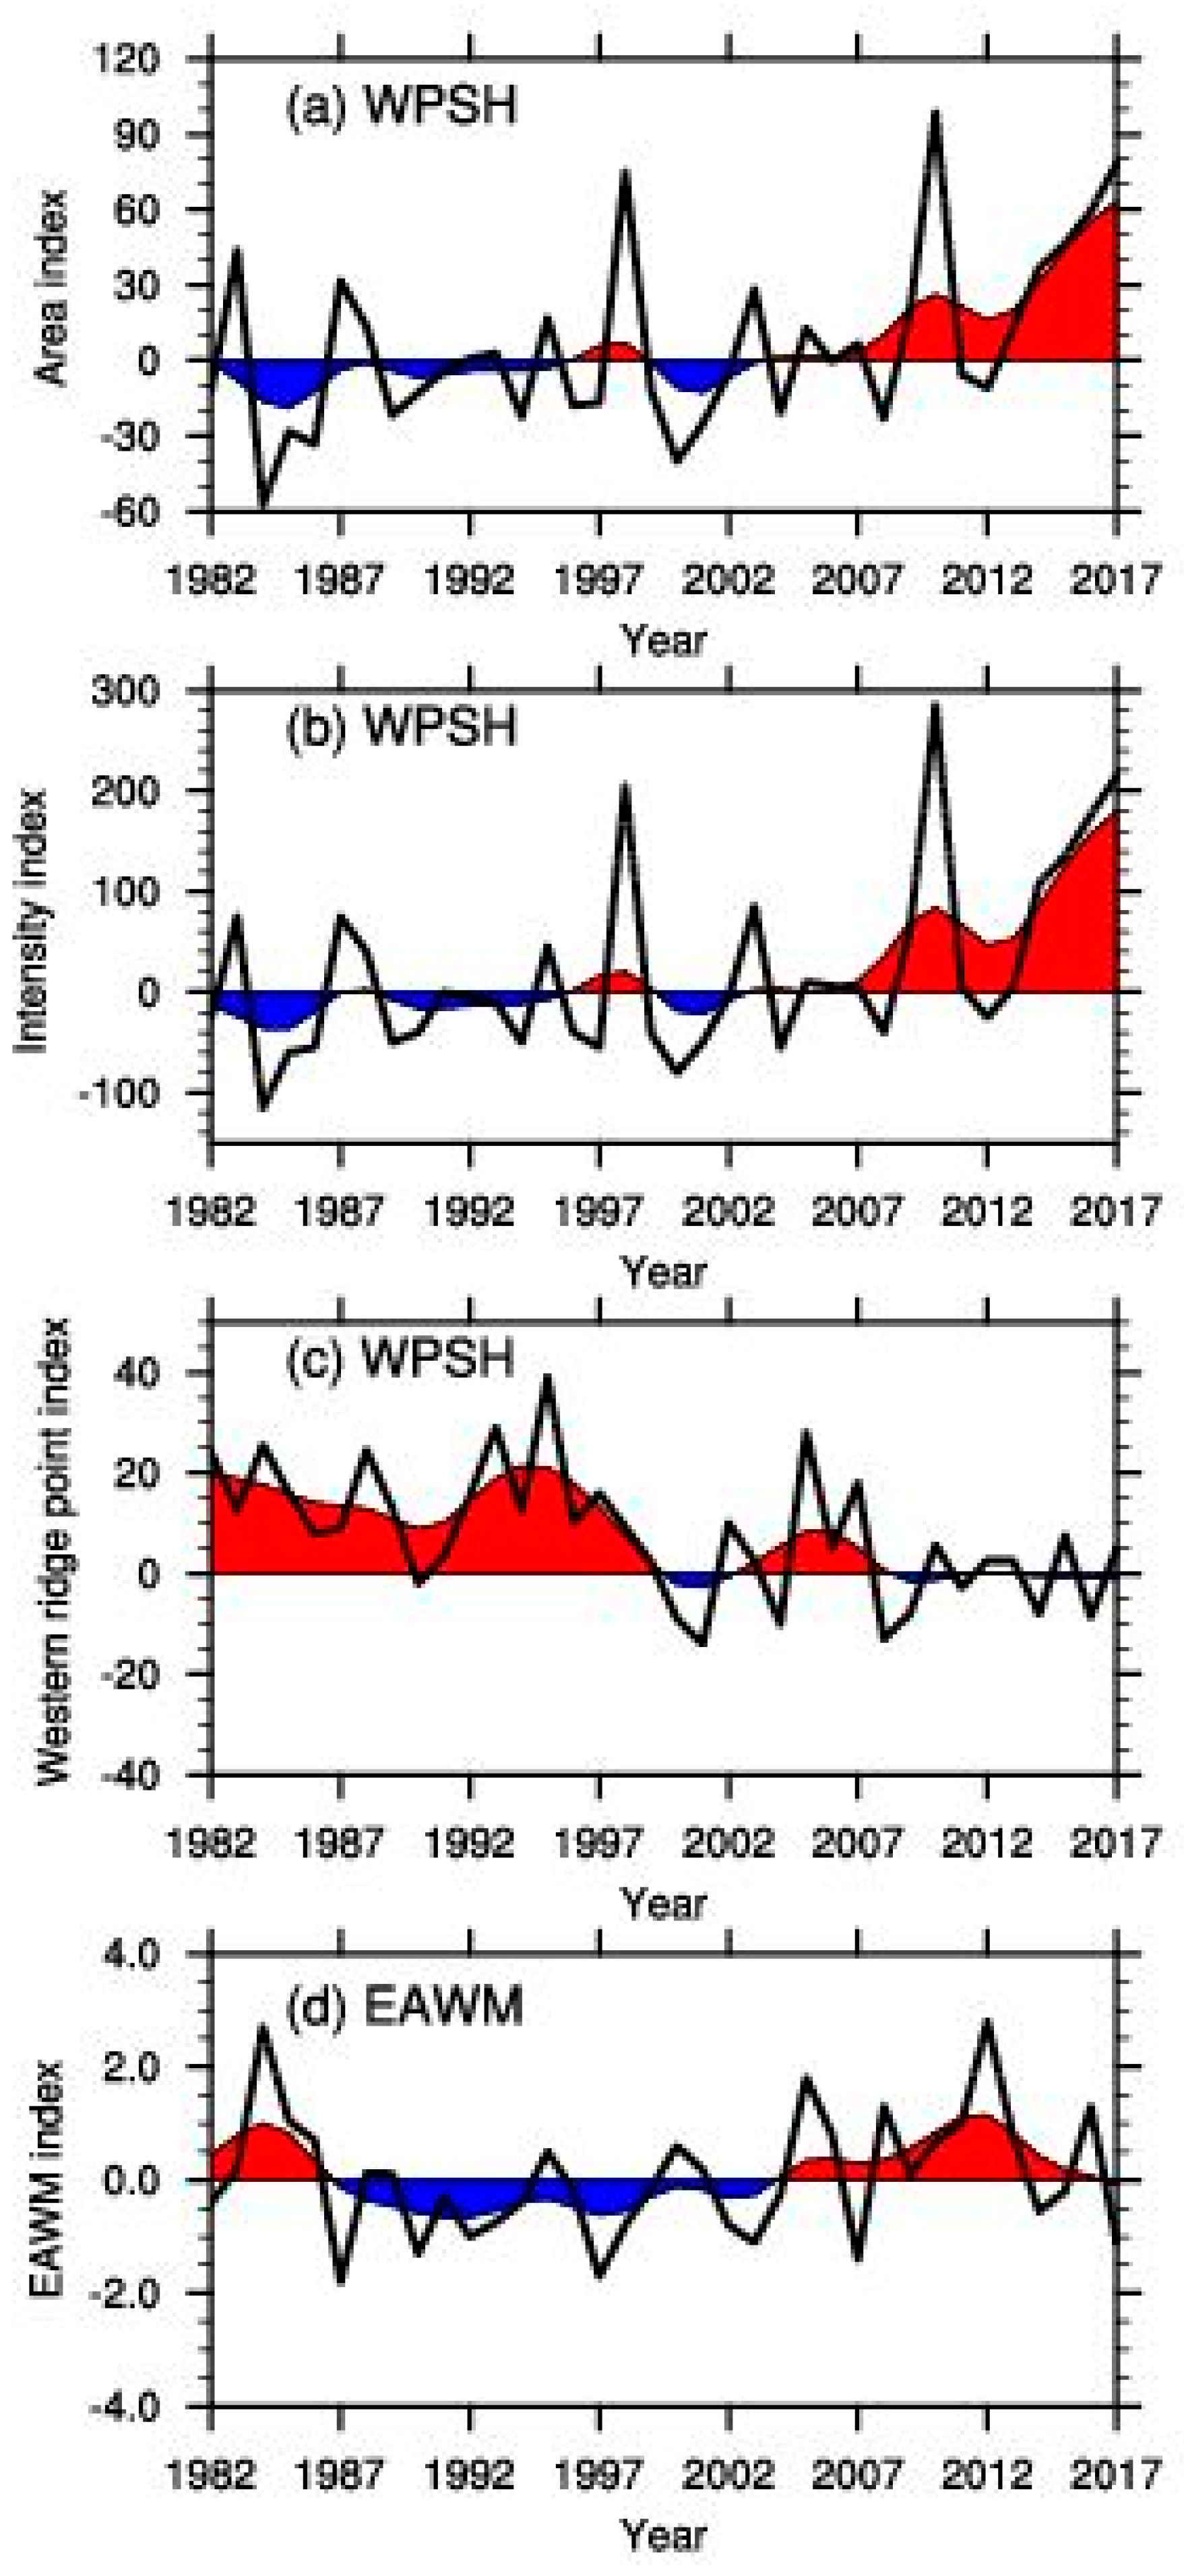
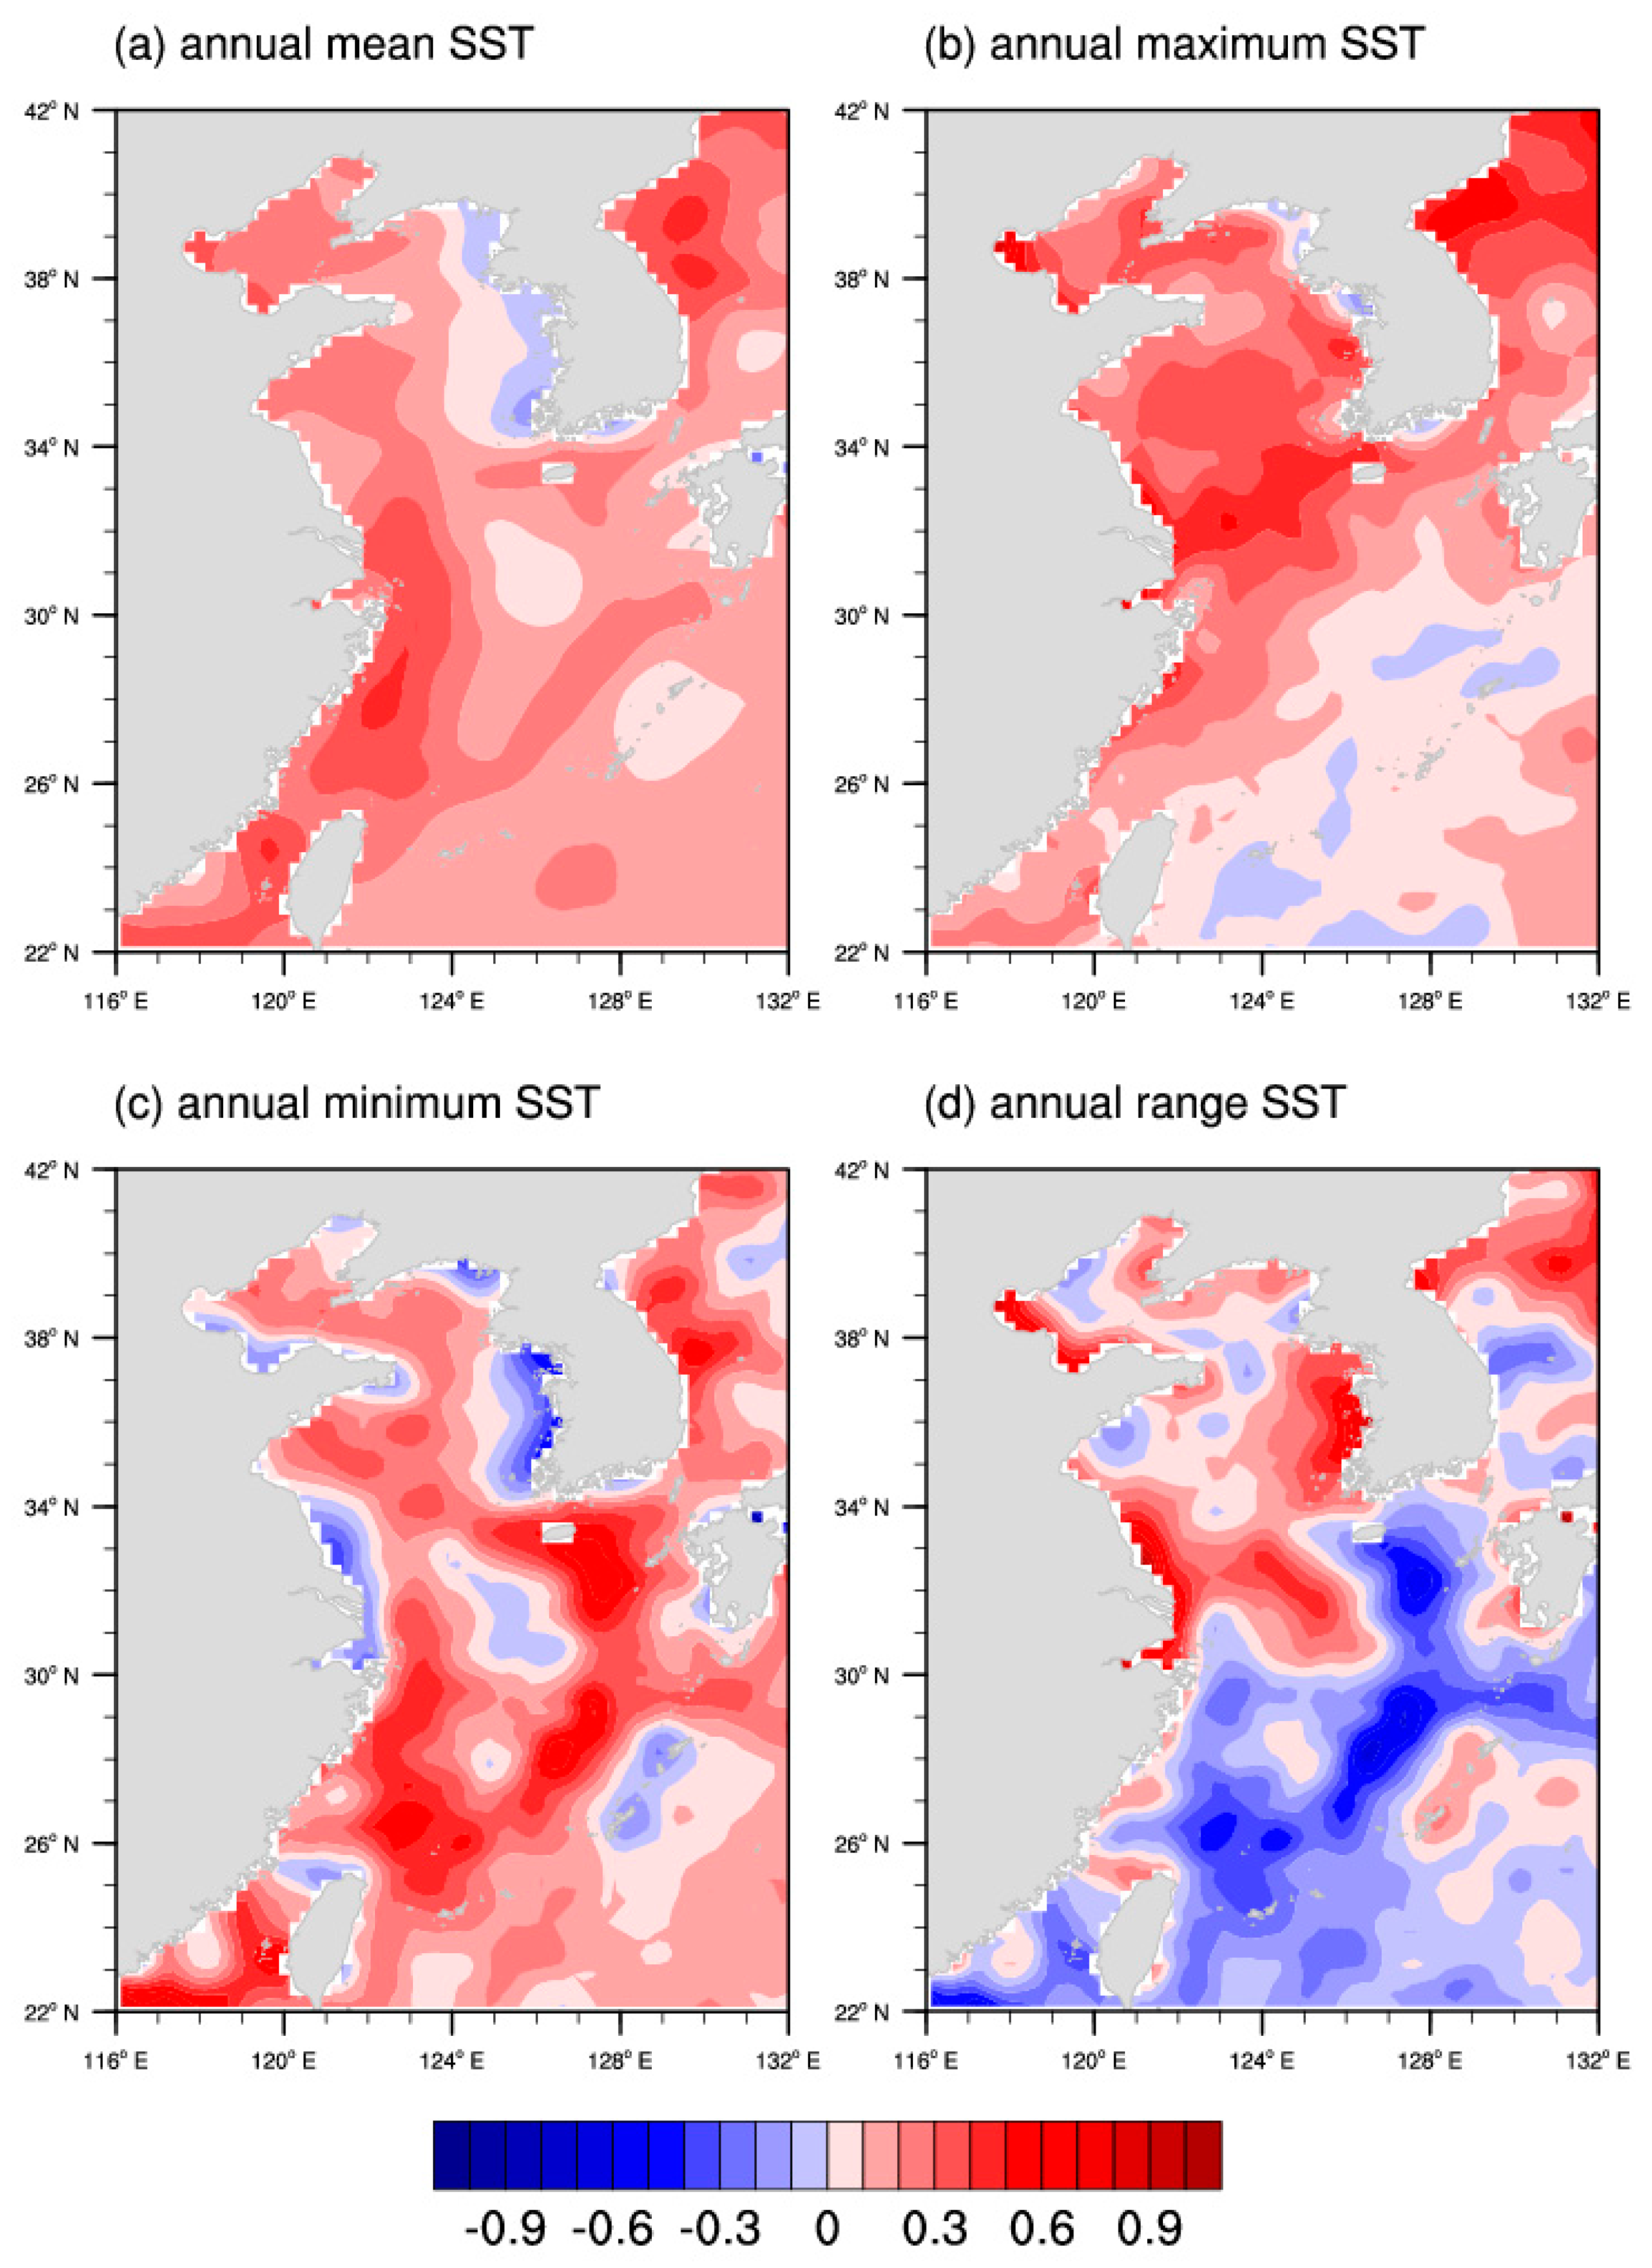
As a regional average, annual mean SSTA over the ECSs is subject to more notable warming trend, with a rate of 0.21 ± 0.08 °C per decade which is higher than the global mean trend based on the same data set during 1982–2017. The most significant warming was observed at the western ECS and the Bohai Sea. The warming SST during 1982–2017 is probably related to the influence from the recent strengthening and westward extension of the WPSH.
(2)
Our results indicate that there are significant warming tendencies in annual minimum SST and maximum SST. Compared to the rapid warming of maximum SST from the northern ECS to the Bohai Sea, the rapid warming of minimum SST mainly covers the western ECS and part of the ECS-Kuroshio. AR SST shows an out-of-phase change on both sides of 30° N during 1982–2017.
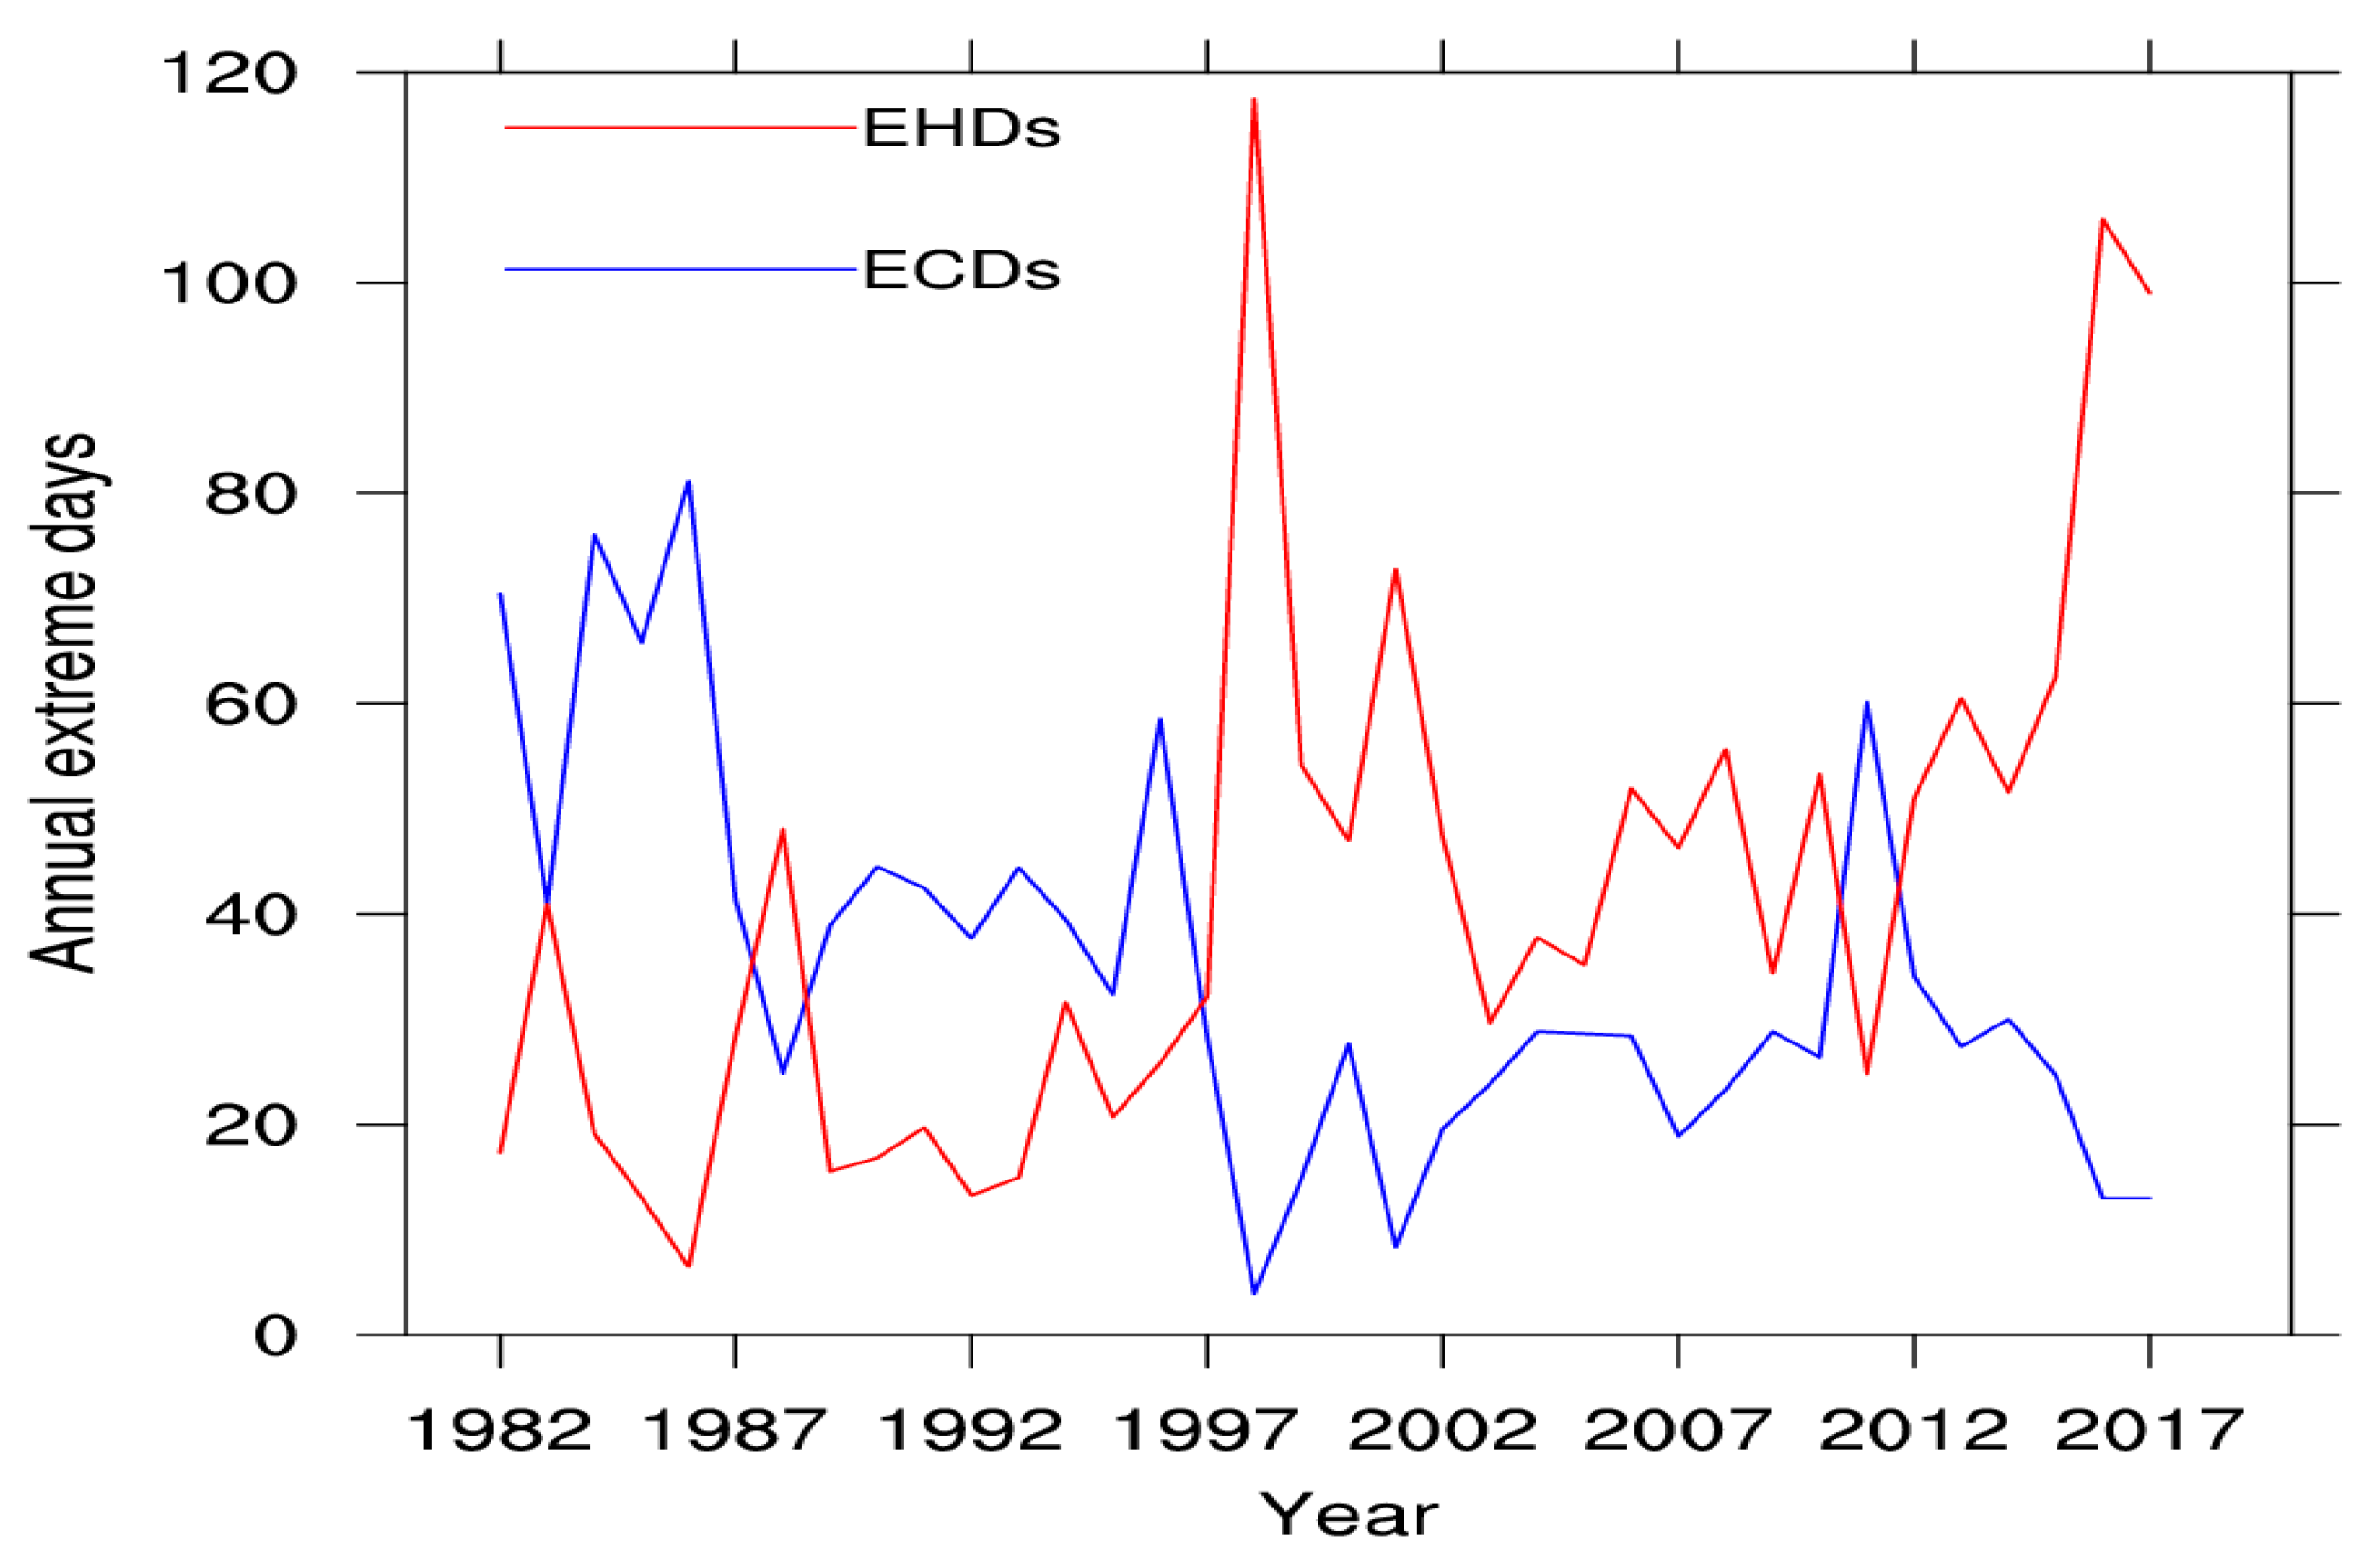
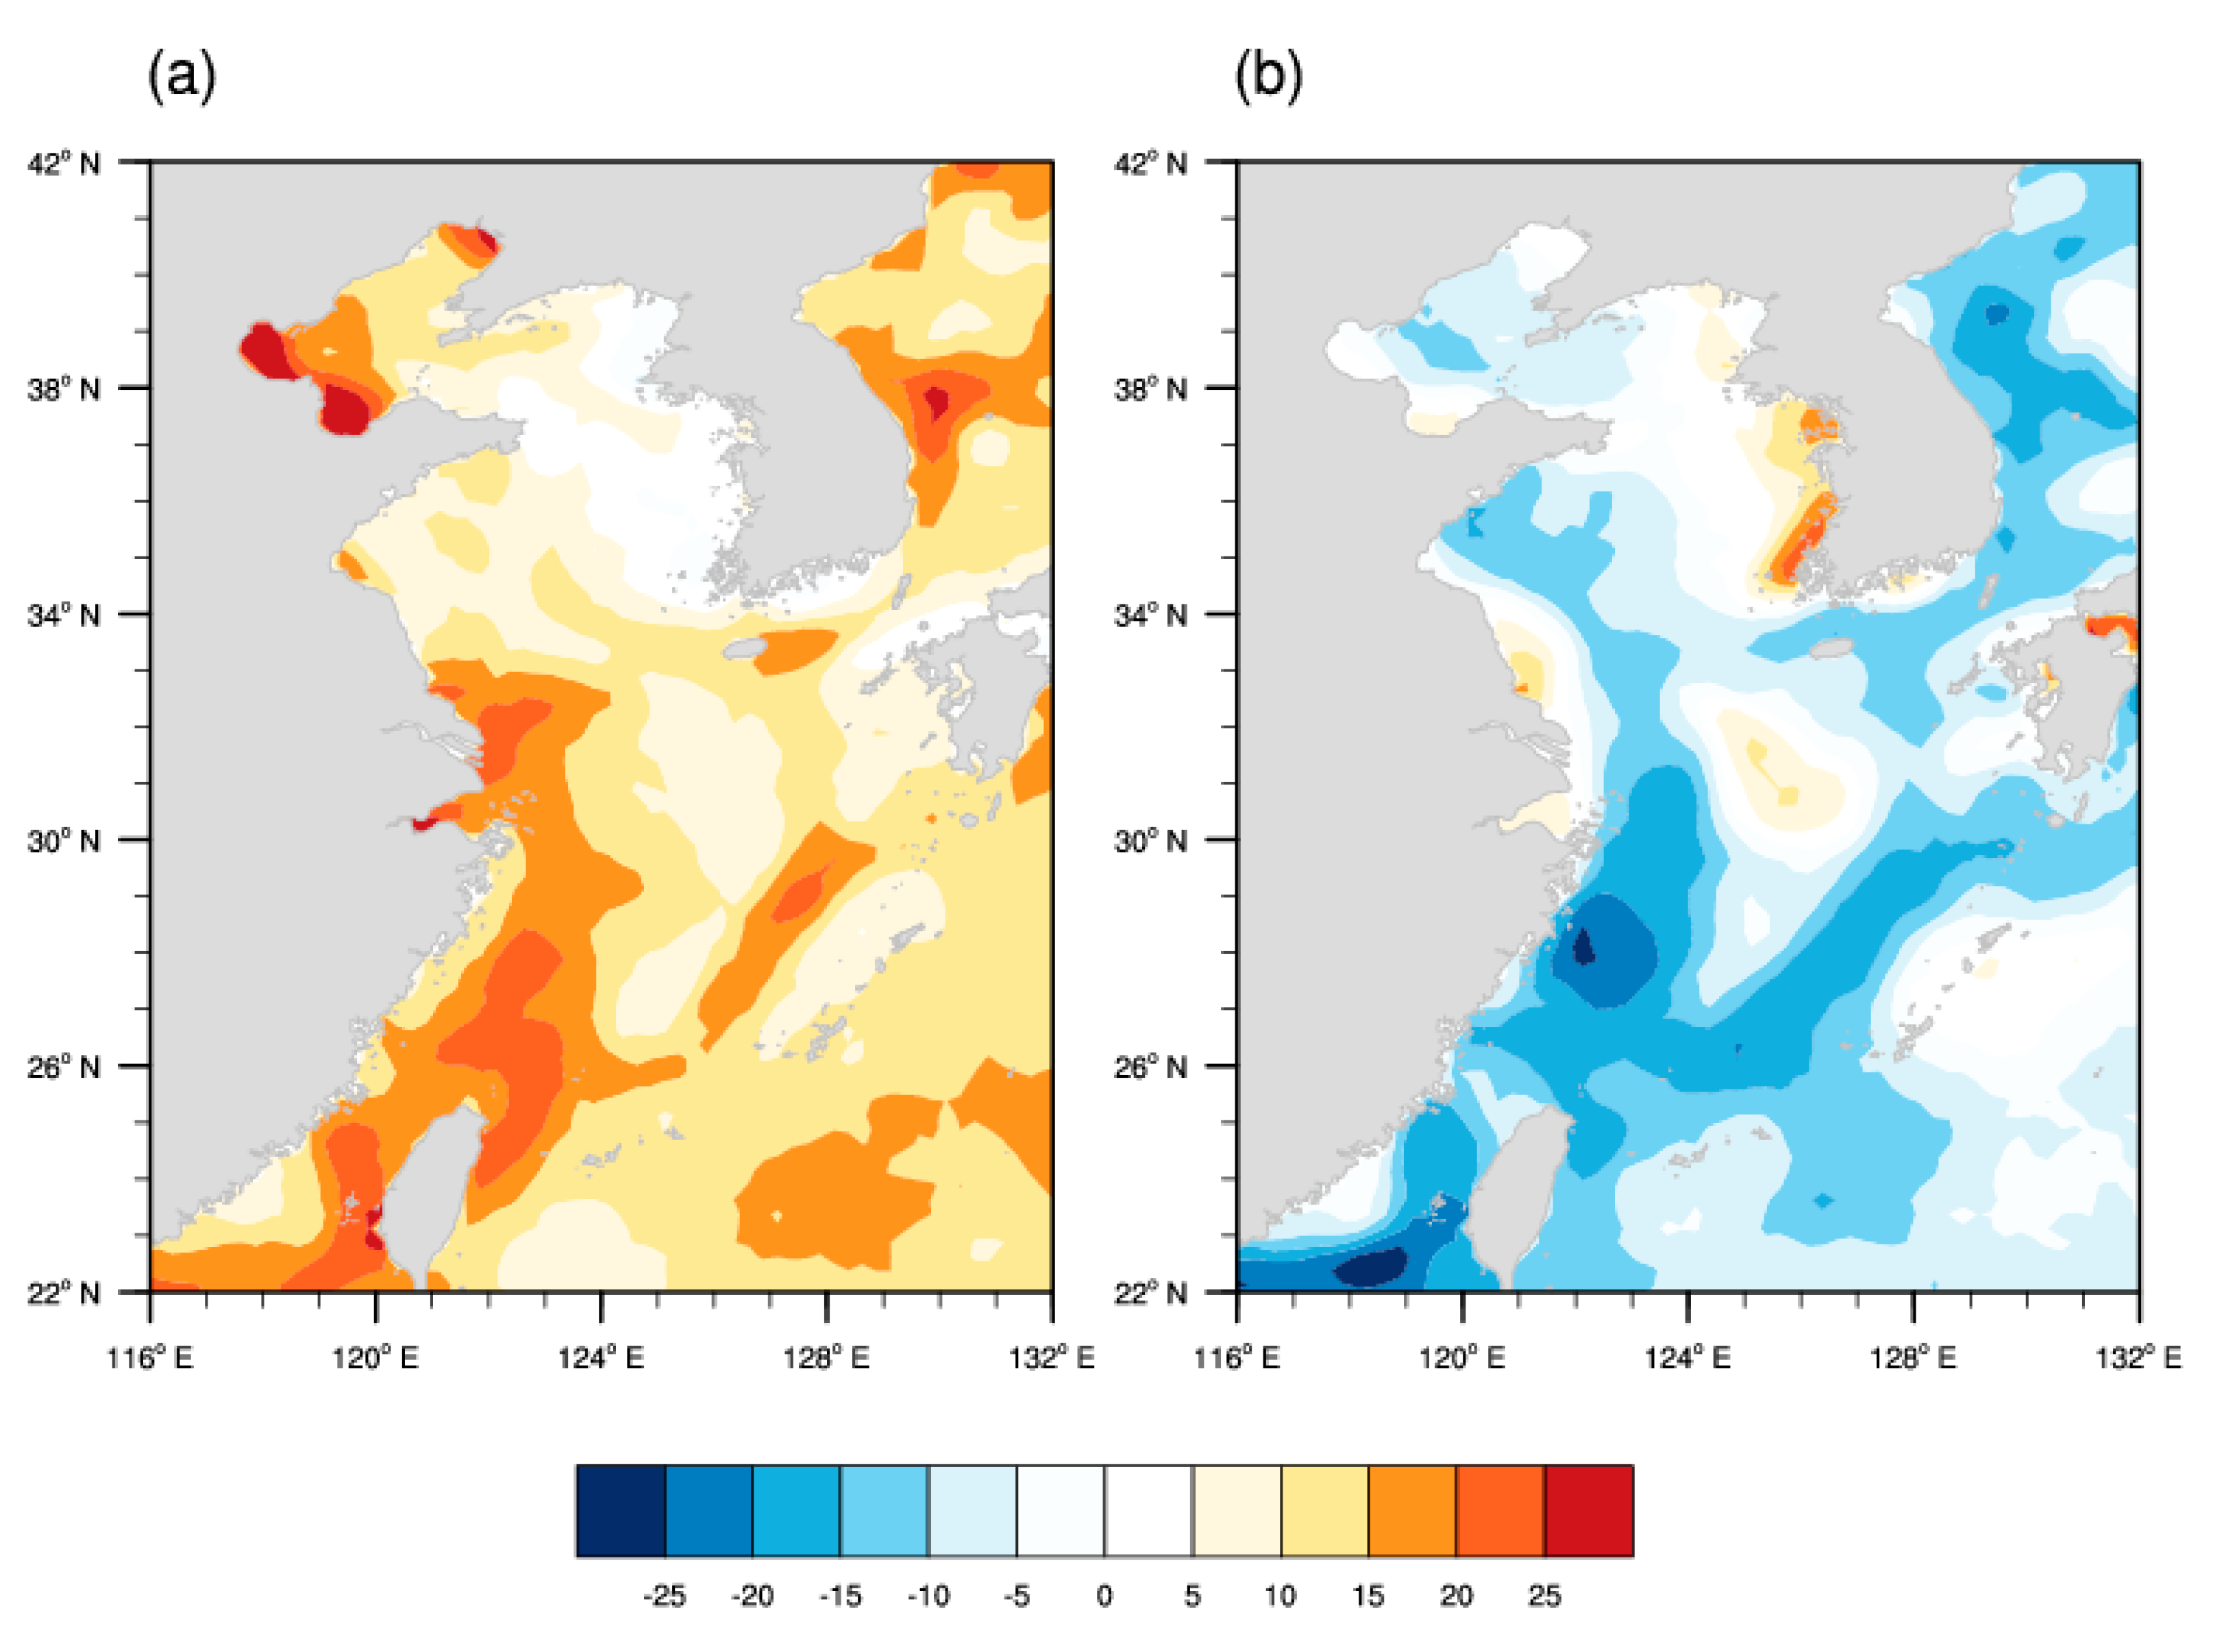
(3)
Rapid decreases in EHDs and increases in ECDs were detected in the ECSs from 1982 to 2017, at a rate of 15.2 days per decade and 10.5 days per decade, respectively. Spatially, the notable increases in the frequency of EHDs were observed in almost all of the ECSs, especially in the Bohai Sea and the western ECS, exceeding 20 days per decade.
Significantly higher SSTs above average in some area are implicated in dramatic changes to the physical, chemical and biological state of the marine environment. It is worth noting that our analysis indicates that the warming trend in the ECSs is greater than the trend of the global averaged SST. This finding is consistent with previous results based on different SST data sets [6,8]. The increase in SST makes the abundance of warm water species and the decrease of warm-temperate species in the Yangtze Estuary area [37,38,39]. Also, it can cause latitudinal shifts in species distributions [39]. Moreover, exposure and vulnerability to extreme events can destroy marine fishery assets and infrastructure. For instances, extreme higher water temperature can lead to abnormal metabolism of scallop, a cold-water species [40]. In the boreal summer of 2017, Zhangzi Island (122.7° E and 39° N) of the Yellow Sea had experienced more than 40 EHDs, with the maximum daily SST anomaly of 4.12 °C. Under such conditions, scallop could not absorb nutrients normally, resulting in malnutrition, bacterial infection and eventually inducing widespread mortality of scallops in this area.
Currently, the frequency and intensity of extreme events are increasing globally as a consequence of anthropogenic and natural climate change influence [3,33]. The latest research points out that the human-induced global warming has never stopped and the human influence is dominant in long-term warming [41]. In the present study, we found the likelihood of extreme hot events increases from 1982 to 2017 in the ECSs, especially in the sub-regions of the Bohai Sea and the western ECS. Given the continued global warming, there will be more frequency and intense extreme hot events in the study region. Given the information mentioned above, contemporary warming events are possibly superimposed onto the warming trends, increasing the risk of extreme SST events on marine ecosystem. Thus, better targeted strategies should be designed for an adaptation and mitigation against specific types of hot extremes as early as possible.

Author Contributions

Conceptualization, Q.W. and Y.L.; Methodology, Y.L. and Y.W.; Data analysis and discussion of the results, Q.W., Y.L. and Q.L.; Writing-Original Draft Preparation, Y.L., Y.L.; Writing-Review & Editing, Q.W.; Visualization, Q.L.; Supervision, Q.L.; Funding Acquisition, Q.L.

Funding

This research was funded by the Strategic Priority Research Program of Chinese Academy of Sciences (Grant No. XDA20100304) and the National Key Research Program of China (2016YFA0602200, 2012CB955203, 2013CB430202).

Conflicts of Interest

The authors declare no conflict of interest.

References

  1. Bojinski, S.; Verstraete, M.; Peterson, T.C.; Simmons, A.; Zemp, M. The concept of essential climate variables in support of climate research, applications, and policy. Bull. Am. Meteorol. Soc. 2014, 95, 1431–1443. [Google Scholar] [CrossRef]
  2. Giménez, L. Exploring mechanisms linking temperature increase and larval phenology: The importance of variance effects. J. Exp. Mar. Biol. Ecol. 2011, 400, 227–235. [Google Scholar] [CrossRef]
  3. IPCC. Climate change 2013: The physical science basis. In Contribution of Working Group I to the Fifth Assessment Report of the Intergovernmental Panel on Climate Change; Stocker, T.F., Qin, D., Plattner, G.-K., Tignor, M., Allen, S.K., Boschung, J., Nauels, A., Xia, Y., Bex, V., Midgley, P.M., Eds.; Cambridge University Press: Cambridge, UK, 2003; p. 1535. [Google Scholar]
  4. Belkin, I.M. Rapid warming of large marine ecosystem. Prog. Oceanogr. 2009, 81, 207–213. [Google Scholar] [CrossRef]
  5. Belkin, I.M.; Lee, M.-A. Long-term variability of sea surface temperature in Taiwan Strait. Clim. Chang. 2014, 124, 821–834. [Google Scholar] [CrossRef] [Green Version]
  6. Wu, L.X.; Cai, W.; Zhang, L. Enhanced warming over the global subtropical western boundary currents. Nat. Clim. Chang. 2012, 2, 161–166. [Google Scholar] [CrossRef] [Green Version]
  7. Liu, Q.Y.; Zhang, Q. Analysis on long-term change of sea surface temperature in the China Seas. J. Ocean Univ. China 2013, 12, 295–300. [Google Scholar] [CrossRef]
  8. Bao, B.; Ren, G.Y. Climatological characteristics and long-term change of SST over the marginal seas of China. Cont. Shelf Res. 2014, 77, 96–106. [Google Scholar] [CrossRef]
  9. Oliver, E.C.; Benthuysen, J.A.; Bindoff, N.L.; Hobday, A.J.; Holbrook, N.J.; Mundy, C.; Perkins-Kirkpatrick, S.E. The unprecedented 2015/16 Tasman Sea marine heatwave. Nat. Commun. 2017, 8, 16101. [Google Scholar] [CrossRef] [Green Version]
  10. Wernberg, T.; Bennett, S.; Babcock, R.C.; de Bettignies, T.; Cure, K.; Depczynski, M.; Dufois, F.; Fromont, J.; Fulton, C.J.; Hovey, R.K.; et al. Climate-drive regime shift of a temperature marine ecosystem. Science 2016, 353, 169–172. [Google Scholar] [CrossRef]
  11. Frölicher, T.L.; Laufkötter, C. Emerging risks from marine heat waves. Nat. Commun. 2018, 9, 650. [Google Scholar] [CrossRef]
  12. Cai, R.S.; Tan, H.J.; Qi, Q.H. Impacts of and adaptation to inter-decadal marine climate change in coastal China seas. Int. J. Clim. 2016, 36, 3770–3780. [Google Scholar] [CrossRef]
  13. State Oceanic Administration. Bulletin of Marine Disaster of China; State Oceanic Administration: Beijing, China, 2013.
  14. Banzon, V.; Smith, T.M.; Chin, T.M.; Liu, C.; Hankins, W. A long-term record of blended satellite and in situ sea-surface temperature for climate monitoring, modeling and environmental studies. Earth Syst. Sci. Data 2016, 8, 165–176. [Google Scholar] [CrossRef] [Green Version]
  15. Reynolds, R.W.; Smith, T.M.; Liu, C.; Chelton, D.B.; Casey, K.S.; Schlax, M.G. Daily high-resolutionblended analyses for sea surface temperature. J. Climate 2007, 20, 5473–5496. [Google Scholar] [CrossRef]
  16. Knapp, K.R.; Ansari, S.; Bain, C.L.; Bourassa, M.A.; Dickinson, M.J.; Funk, C.; Helms, C.N.; Hennon, C.C.; Holmes, C.D.; Huffman, G.J.; et al. Globally gridded satellite observations for climate studies. Bull. Am. Meteorol. Soc. 2011, 92, 893–907. [Google Scholar] [CrossRef]
  17. Lima, F.P.; Wethey, D.S. Three decades of high-resolution coastal sea surface temperatures reveal more than warming. Nat. Commun. 2012, 3, 704. [Google Scholar] [CrossRef] [Green Version]
  18. Park, K.A.; Lee, E.Y.; Chang, E.; Hong, S. Spatial and temporal variability of sea surface temperature and warming trends in the Yellow Sea. J. Mar. Syst. 2015, 143, 24–38. [Google Scholar] [CrossRef]
  19. Benthuysen, J.A.; Oliver, E.C.; Feng, M.; Marshall, A.G. Extreme marine warming across Tropical Australia during austral summer 2015–2016. J. Geophys. Res. 2018, 123, 1301–1326. [Google Scholar] [CrossRef]
  20. Liao, E.H.; Lu, F.; Yan, X.H.; Jiang, Y.; Kidwell, A.N. The coastal ocean response to the global warming acceleration and hiatus. Sci. Rep. 2015, 5, 16630. [Google Scholar] [CrossRef] [Green Version]
  21. Costoya, X.; Decastro, M.; Gómezgesteira, M.; Santos, F. Changes in sea surface temperature seasonality in the Bay of Biscay over the last decades (1982–2014). J. Mar. Syst. 2015, 150, 91–101. [Google Scholar] [CrossRef]
  22. Kulkarni, A.; Storch, H.V. Monte Carlo experiments on the effect of serial correlation on the Mann-Kendall-test of trends. Meteorol. Z. 1995, 4, 82–85. [Google Scholar] [CrossRef]
  23. Von Storch, H.; Zwiers, F.W. Statistical Analysis in Climate Research; Cambridge University Press: London, UK, 1999. [Google Scholar]
  24. Wolter, K.; Timlin, M.S. El Niño/Southern Oscillation behavior since 1871 as diagnosed in an extended multivariate ENSO index. Int. J. Clim. 2001, 31, 1074–1087. [Google Scholar] [CrossRef]
  25. Hu, S.; Fedorov, A.V. The extreme El Niño of 2015–2016 and the end of global warming hiatus. Geophys. Res. Lett. 2017, 44, 3816–3824. [Google Scholar] [CrossRef]
  26. Song, D.H.; Yu, H.M.; Bao, X.W. Analysis of the interannual variability of the eastern China Seas and its adjacent seas surface temperature. Period. Ocean Univ. China 2007, 37, 21–28, (In Chinese with English Abstract). [Google Scholar]
  27. Pei, Y.H.; Zhang, R.H.; Zhang, X.; Jiang, L.; Wei, Y. Variability of sea surface height in the South China Sea and its relationship to Pacific oscillations. Acta. Oceanol. Sin. 2015, 34, 80–92. [Google Scholar] [CrossRef]
  28. Zhang, Q.Y.; Tao, S.Y.; Chen, L.T. The inter-annual variability of East Asian summer monsoon and its association with pattern of general circulation over East Asia. Act. Meteorol. Sin. 2003, 61, 559–568, (In Chinese with English Abstract). [Google Scholar]
  29. Zhang, R.H.; Li, Q. Impact of sea temperature variability of tropical oceans on East Asian Monsoon. Meteorol. Mon. 2004, 30, 22–26, (In Chinese with English Abstract). [Google Scholar]
  30. Pei, Y.H.; Liu, X.H.; He, H.I. Interpreting the sea surface temperature warming trend in the Yellow Sea and East China Sea. Sci. China Earth Sci. 2017, 60, 1558–1568. [Google Scholar] [CrossRef]
  31. Cai, R.S.; Tan, H.J.; Kontoyiannis, H. Robust surface warming in offshore China Seas and its relationship to the East Asian Monsoon wind field and ocean forcing on interdecadal time scales. J. Clim. 2017, 30, 8987–9905. [Google Scholar] [CrossRef]
  32. Zhao, S.; Chang, F.M.; Li, T.G.; Zhuang, L.H.; Xiong, Z.F.; Xu, Y. Seasonal and Inter-Annual Anomalies of Sea Surface Temperature Offshore Northeastern Taiwan and Its Implication to Historical Climate Reconstructions. Earth Sci. 2018, 43, 851–861, (In Chinese with English Abstract). [Google Scholar]
  33. World Meteorological Organization (WMO). WMO Statement on the State of the Global Climate in 2017; World Meteorological Organization: Geneva, Switzerland, 2018; p. 35. [Google Scholar]
  34. Perkins, S.E.; Alexander, L.V. On the measurement of heat waves. J. Clim. 2013, 26, 4500–4517. [Google Scholar] [CrossRef]
  35. Perkins, S.E.; Alexander, L.V.; Nairn, J.R. Increasing frequency, intensity and duration of observed global heatwaves and warm spells. Geophys. Res. Lett. 2012, 39, 20714. [Google Scholar] [CrossRef]
  36. Zhou, X.Y.; Hu, D.B.; Wang, C.Z. Seasonal and interannual SST variations in the Changjiang Estuary. Period. Ocean Univ. China 2005, 35, 357–362, (In Chinese with English Abstract). [Google Scholar]
  37. Li, Y.; Xu, Z.L.; Gao, Q. Effects of global warming on Sagitta crassa and Sagitta enflata in the Changjiang Estuary during different years. Acta Ecol. Sin. 2009, 29, 4773–4780, (In Chinese with English Abstract). [Google Scholar]
  38. Ma, Z.L.; Xu, Z.L.; Zhou, J. Effect of global warming on the distribution of Lucifer intermedius and L. hanseni (Decapoda) in the Changjiang estuary. Prog. Nat. Sci. 2009, 19, 1389–1395, (In Chinese with English Abstract). [Google Scholar] [CrossRef]
  39. Xu, Z.L. Ecological characters of Euchaeta Concinna (Copepod) in the East China Sea. Oceanol. Limnol. Sin. 2006, 32, 97–104, (In Chinese with English Abstract). [Google Scholar]
  40. Liu, C. The Effect of Temperature on the Fitness Characters of Bottom Sowed Yesso Scallop; University of Chinese Academy of Sciences: Shenzhen, China, 2016. [Google Scholar]
  41. Medhaug, I.; Stolpe, M.B.; Fischer, E.M.; Knutti, R. Reconciling controversies about the ‘global warming hiatus’. Nature 2017, 545, 41–47. [Google Scholar] [CrossRef]
Figure 1. Map showing the geographical location of the study region, including the Bohai Sea, the Yellow Sea, the East China Sea, and adjacent seas.
Atmosphere 10 00140 g001
Figure 2. Taylor diagram of the annual mean SSTs from OISST v2 compared with 19 stations-based observations, REF stands for reference values of SST observations. The radial distance from the origin is proportional to the standard deviation ratio. The triangles and circle denote the bias between OISST and stations-based observations.
Atmosphere 10 00140 g002
Figure 3. Time series of the regional averaged annual mean SST (a), annual minimum SST (b), annual maximum SST (c) anomalies and AR SST (d) in the ECSs from 1982–2017 (Units: °C, 1982–2011 base period). The black dashed lines are the linear trend lines based on the least squares estimator.
Atmosphere 10 00140 g003
Figure 4. Time series of summer mean (black lines) and 9 year running mean (shaded lines) indices from 1982–2017 of the west Pacific subtropical high (WPSH): area (a), intensity (b), westward extension (c), and time series of the East Asia winter monsoon Index (d). Data are all from the Chinese National Climate Center (CNCC).
Atmosphere 10 00140 g004
Figure 5. Linear trends spatial distribution of (a) annual mean SST, (b) annual maximum SST, (c) annual minimum SST, (d) AR SST in the ECSs (Units: °C per decade).
Atmosphere 10 00140 g005
Figure 6. Regional averaged annual EHDs (red line) and ECDs (blue line) from 1982 to 2017 in the study region (units: days).
Atmosphere 10 00140 g006
Figure 7. Linear trends of the annual EHDs (a) and annual ECDs (b) during 1982–2017 (Units: days per decade).
Atmosphere 10 00140 g007

