Article

Simulation of an Asian Dust Storm Event in May 2017

1
College of Meteorology and Oceanography, National University of Defense Technology, Nanjing 211101, China
2
Key Laboratory of Dark Matter and Space Astronomy, Purple Mountain Observatory, Chinese Academy of Sciences (CAS), Nanjing 210034, China
3
Fujian Meteorological Service Center, Fuzhou 350001, China
*
Author to whom correspondence should be addressed.
Atmosphere 2019, 10(3), 135; https://doi.org/10.3390/atmos10030135
Submission received: 30 January 2019 / Revised: 8 March 2019 / Accepted: 9 March 2019 / Published: 13 March 2019
(This article belongs to the Special Issue Urban Particulate Matters: Composition, Sources, and Exposure)

Abstract

:
Dust particles in the atmosphere play an important role in air pollution, climate change, and biogeochemical cycles. Some of the dominant sources of dust in mid-latitude regions are in Asia. An intense dust storm engulfed Northern China at the beginning of May 2017, and PM10 mass concentrations of 1500–2000 μg m−3 were measured near the dust source region. We combined numerical simulations, air quality monitoring data, and satellite retrievals to investigate dust emission and transport during this event. We found that the event was closely related to cold front activity, characterized by increased wind speed, which increased dust emission. We improved the dust scheme using a local dust size distribution to better simulate the dust emission flux. We found that accurate parametrization of the dust size distribution was important to effectively simulate both dust emission and ambient particle concentration. We showed that using a local dust size distribution substantially improved the accuracy of the simulation, allowing both the spatial distribution of pollution caused by the dust storm and temporal variability in the pollution to be captured.

1. Introduction

Atmospheric aerosols play a vital role in air quality and climate change, and also negatively affect human health [1,2]. Mineral dust particles emitted in arid and semiarid regions are some of the most abundant aerosol particles in the troposphere. After being emitted into the atmosphere, dust aerosols usually undergo cross-regional transport because they have relatively long lifetimes in the atmosphere [3]. High concentrations of dust in the atmosphere generally cause rapid deterioration in visibility in the affected region, particularly the source region and in areas downwind [4]. Dust in the atmosphere can perturb the radiative energy balance of the Earth–atmosphere system by absorbing and scattering both long-wave and short-wave radiation [5,6]. Dust in the atmosphere also affects boundary layer meteorology [7]. It has been found in many previous studies that mineral dust in the atmosphere has a high enough surface area for heterogeneous reactions involving trace gases to occur to affect chemical and physical processes on the regional or even global scale [8]. The deposition of mineral dust is a major source of several important nutrients, including iron and phosphorus, and mineral dust deposited from the atmosphere affects global biogeochemical cycles [9].
It has been estimated that annual mineral dust emissions range from 1000 to 3000 Tg y−1 [10]. East Asia (which contains the Gobi Desert, Hobq Desert, Kumutage Desert, Mu Us Desert, and Taklimakan Desert) is one of the main sources of dust in mid-latitude regions. It was previously found that dust emissions in East Asia could be ~800 Tg y−1, almost 50% of global annual dust emissions [11]. Anthropogenic regional climate change is causing desertification and is causing the area covered by desert and sand to increase by 2460 km2 y−1 [12]. Frequent dust storms occur in China in spring, particularly in Northern and Western China [13].
Numerical modeling is a systematic approach to identifying regions that supply dust to the atmosphere and to evaluating the effects of dust storms in different areas. It is essential to use such models to estimate dust emission rates to allow dust transport and the environmental and climate effects of dust to be assessed. Dust emission intensity is strongly dependent on meteorological conditions and land surface characteristics [14]. Large-scale dust emission rate estimates rely on an appropriate dust emission parameterization scheme being used. Several dust emission flux estimation parameterization schemes have been proposed. Shao and Dong (2006) summarized several widely used dust emission flux estimation parameterization schemes and found that the development of such schemes is related to the integration of monitoring and satellite remote sensing data.
There are still many uncertainties related to dust emission estimates, but the uncertainties are different for different regions [15,16]. Dust concentrations in East Asia are usually underestimated by regional and global models, suggesting that these models need to be modified. The Goddard Global Ozone Chemistry Aerosol Radiation and Transport (GOCART) model, developed by the Georgia Institute of Technology, is one of most widely used dust emission schemes and has been embedded into many regional and global chemical transport models [17], including the Weather Research and Forecasting coupled with the Chemistry model (WRF-Chem). This scheme is based on a complex parameterization that assumes that dust uplift is mainly initiated by saltation bombardment. It has performed well when estimating dust emission fluxes in several regions around the world [18]. However, it has clear limitations when applied to East Asia. For example, it has been found in previous studies of Asian dust storms that the GOCART dust emission scheme markedly underpredicts particle concentrations and aerosol optical depths compared with in situ observations and satellite retrievals. Subsequent estimates of long-range transport and the environmental effects of dust have therefore suffered from large uncertainties [19]. Many atmospheric processes involving dust particles (including diffusion, dry deposition, interactions with clouds, and transport) are dependent on the particle size because the particle size determines the atmospheric lifetime of a particle [20]. Assumptions related to the particle size distribution in a dust emission parameterization scheme have been found to play important roles in determining the atmospheric concentrations of dust [21]. Dust particles in different regions are characterized by distinct particle size distributions, which may vary widely [22]. Current dust emission schemes are based on measurements made in regions outside Asia. For example, the widely used GOCART scheme uses a particle size distribution based on measurements made in the Midwest USA and in the Sahara [23]. Using a local dust particle size distribution may allow dust emission fluxes and transport in Asia to be better characterized.
An intense dust storm engulfed Northern China at the beginning of May 2017, dramatically decreasing air quality in many cities, including Beijing. Most monitoring stations in Beijing measured PM10 concentrations >1000 µg m−3 on 4 May 2017. The Gansu, Hebei, Shandong, Heilongjiang and Jilin Provinces were also blanketed by this dust storm. We investigated dust emission and transport during this dust storm by combining numerical simulations, air quality monitoring data, and satellite retrievals. The dust emission flux was simulated more effectively than would otherwise have been possible by improving the GOCART dust scheme using a local particle size distribution. We compared our estimated dust emission fluxes with observed dust emission fluxes. Here, we describe the in situ observational data, remote sensing data, and regional chemical transport model, and we describe how the numerical simulations were configured and designed. We validated the model results using available measurements and analyzed the emission characteristics and transport pathways during the May 2017 dust storm. We also evaluated the improved GOCART scheme and assessed the importance of accurately parameterizing the dust size distribution.

2. Data and Methods

2.1. Data

Several observations were used to validate the ability of the model to reproduce the meteorology of and particle pollution caused by the dust storm. We collected ground-based hourly meteorological data, including 2 m air temperatures and 10 m wind speeds from the Integrated Surface Hourly Data archive held by the National Climatic Data Center. The hourly air quality index, acquired from online ambient air monitoring data released by the Ministry of Environmental Protection, was used to obtain PM10 concentrations to compare with our simulations. Data from two monitoring stations in the dust source regions (Baotou Station in the Inner Mongolia Autonomous Region and Yinchuan Station in the Ningxia Hui Autonomous Region) were used to validate the simulated dust emission fluxes. Particle concentrations were continually measured at these stations during the study period using an E-Sampler (Met One Instruments, Grants Pass, OR, USA). Satellite data for 550 nm aerosol optical depths (AODs) were retrieved from the moderate resolution imaging spectroradiometer (MODIS) dataset. These data had a horizontal resolution of 1°, and were used to verify the simulated spatial distributions of the dust.

2.2. Numerical Simulation

The WRF-Chem model (version 3.6.1), which simulates trace gases, particulates, and meteorological fields [24], was used. Carbon Bond mechanism software version Z (CBMZ) for gas-phase chemistry and the model for simulating aerosol interactions and chemistry (MOSAIC) were used in the simulations. The MOSAIC aerosol scheme was applied using a sectional approach [25,26]. The dust particle size distribution was divided into discrete dry particle diameter size bins 0.039–0.156, 0.156–0.625, 0.625–2.5, and 2.5–10.0 μm. The GOCART dust emission scheme [17] was coupled with the CBMZ and MOSAIC. As mentioned by Ginoux et al. (2001), the GOCART scheme calculates the dust emission flux from the surface, F (μg m−2 s−1), using the equation
F = C S s p u 10 m 2 ( u 10 m u t )   ( u 10 m u t ) ,
where C is an empirical proportionality constant equal to 1 μg s2 m−5, S is the source function (based on the erodibility of soil by wind), Sp is the fraction of each erodible dust size class (including clay, silt, and sand fractions, which have different particle size ranges), u10m is the horizontal wind speed at 10 m (from meteorological data), and ut is the threshold velocity (which will depend on both the particle size and soil moisture content).
The dust size distributions in the default GOCART scheme generally markedly overestimated the diameters of dust particles derived from Chinese desert regions. We therefore modified the size distribution for Asian dust sources using available measurements for East Asia based on recommendations made in a previous publication [27]. The dust emission mass fluxes were calculated, then the GOCART module allocated all newly emitted dust into size bins according to specific ratios. The ratios for the eight size bins, 0.039–0.078, 0.078–0.156, 0.156–0.312, 0.312–0.625, 0.625–1.25, 1.25–2.5, 2.5–5.0, and 5.0–10.0 μm, were 9.4 × 10⁻⁴, 1.8 × 10⁻³, 3.7 × 10⁻³, 7.5 × 10⁻³, 6.6 × 10⁻², 3.23 × 10⁻¹, 2.41 × 10⁻¹, and 3.55 × 10⁻¹, respectively.
The simulation domain covered North China, including the Gobi Desert, which was the main source of dust during the event simulated in this study (Figure 1). We used 280 × 230 grid points at a horizontal resolution of 20 km × 20 km and 30 vertical layers, with the top layer at 50 hPa. The initial meteorological fields and lateral boundary conditions were taken from the National Center for Environmental Prediction final analysis dataset, with a spatial resolution of 1° × 1° and a temporal interval of 6 h. The initial chemical composition and boundary conditions were taken from the default profiles of the WRF-Chem model, and were the same used by McKeen et al. (2002) based on averages of mid-latitude aircraft profiles acquired in several field studies over the eastern Pacific Ocean. The simulation period was 20 April to 10 May 2017, and the first ten days were the spin-up time. The domain settings and configuration options are shown in Table 1.
The simulation was evaluated by comparing various datasets with our simulation results. The normalized mean bias (NMB) was used to evaluate the model performance. The NMB was calculated using the equation
NMB = i = 1 N ( S i m O b s ) i = 1 N O b s ,
where N is the number of valid datapoints, Sim are the simulated meteorological fields or particle concentrations, and Obs are the observed meteorological fields or particle concentrations.

3. Results and Discussion

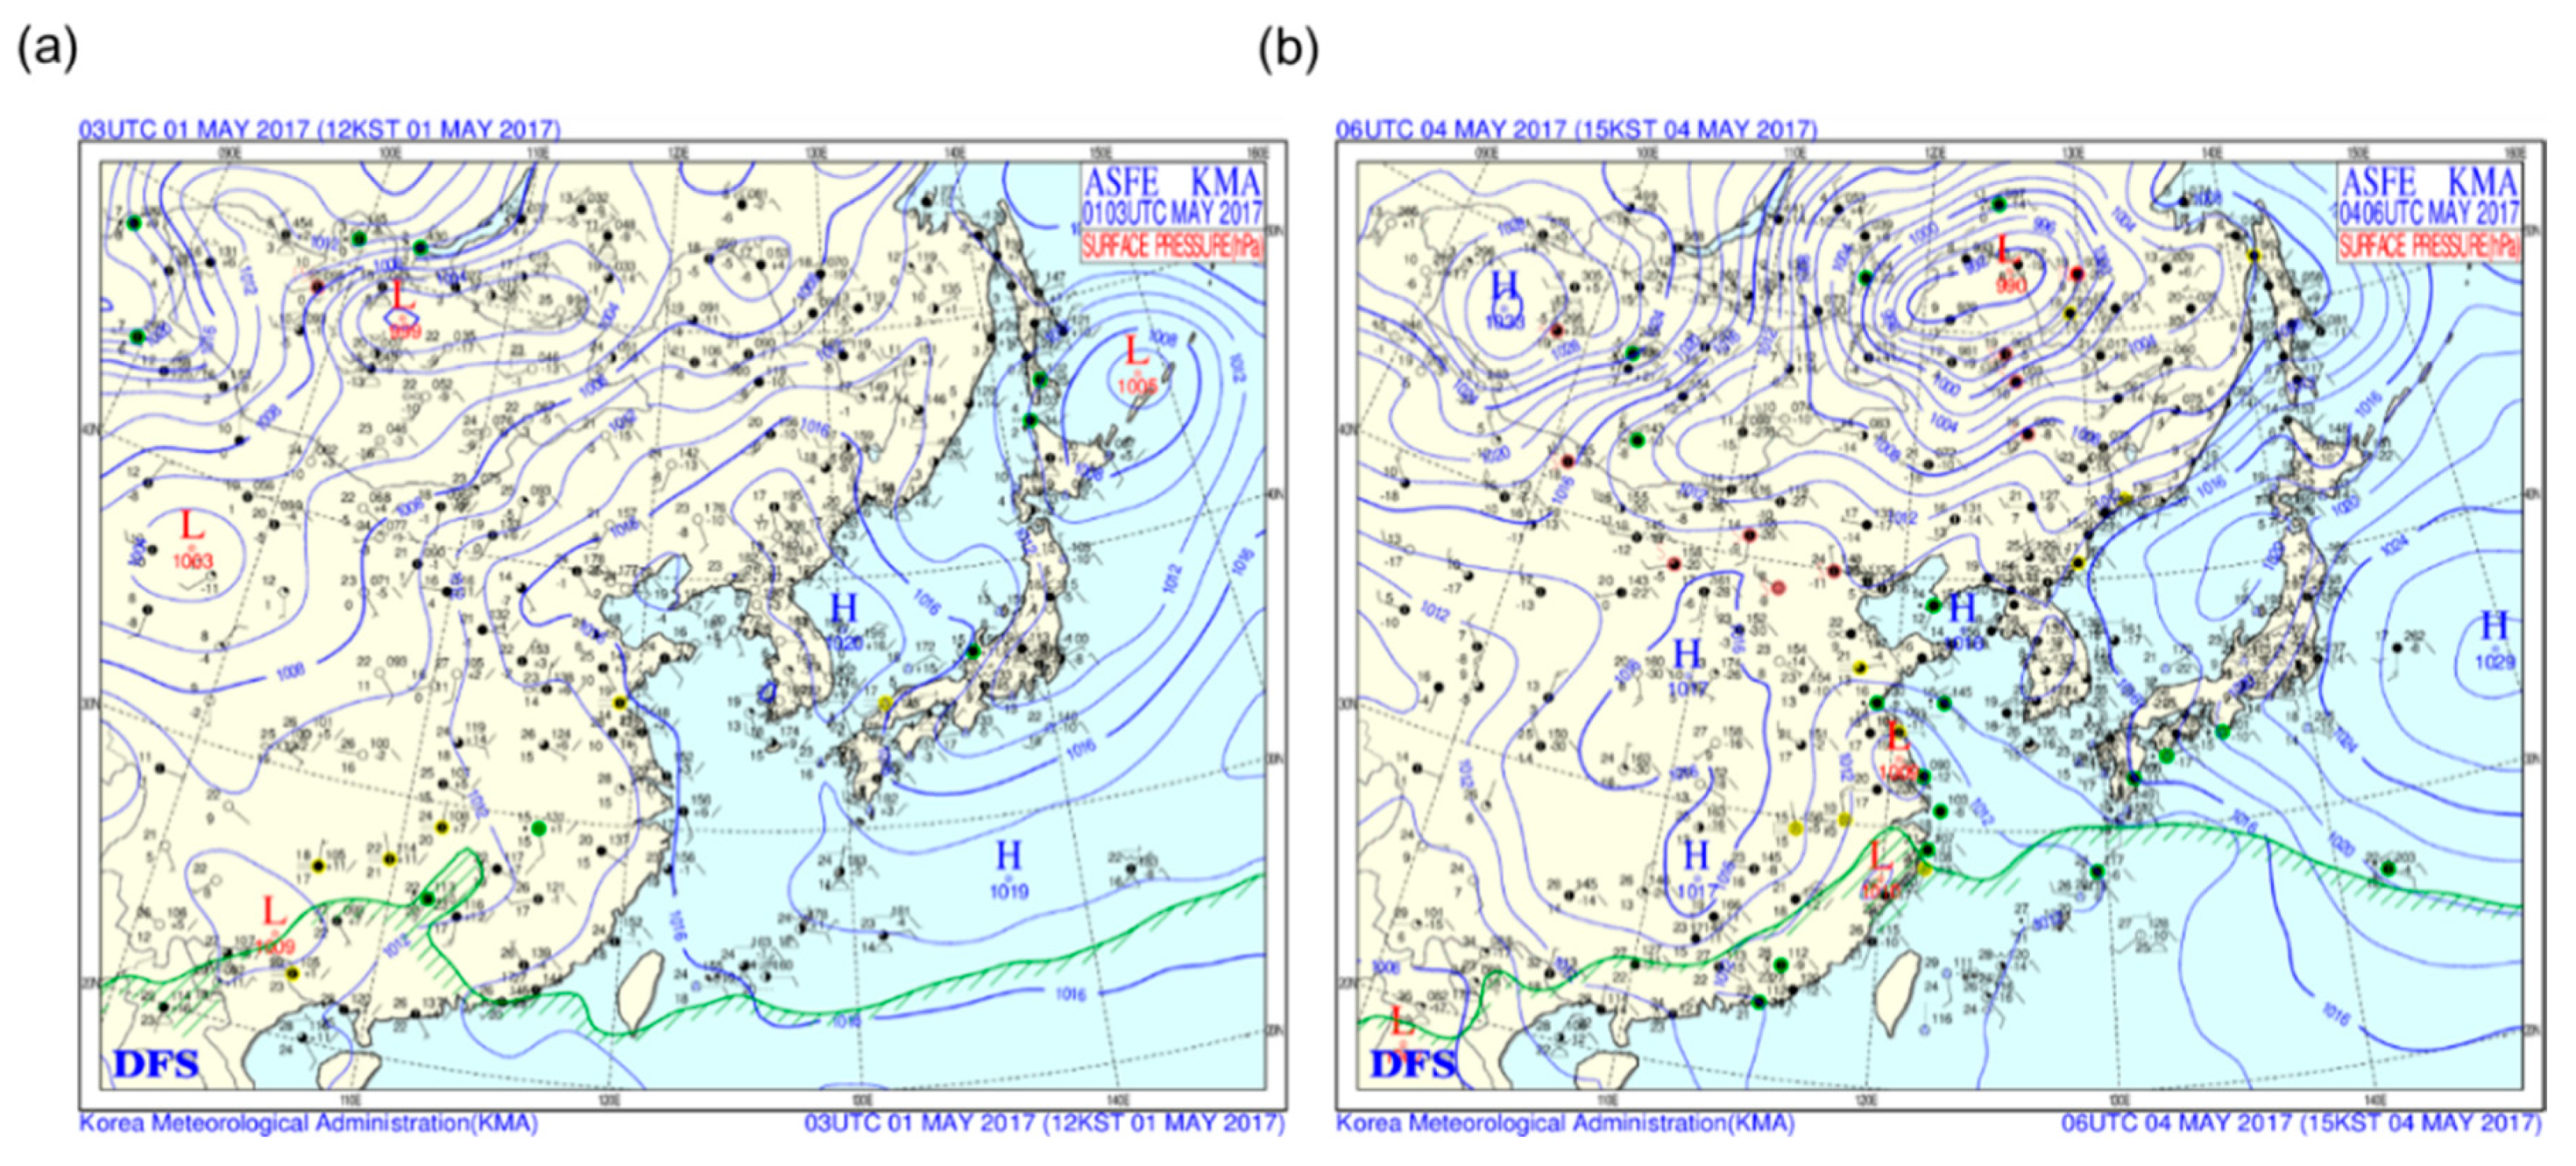
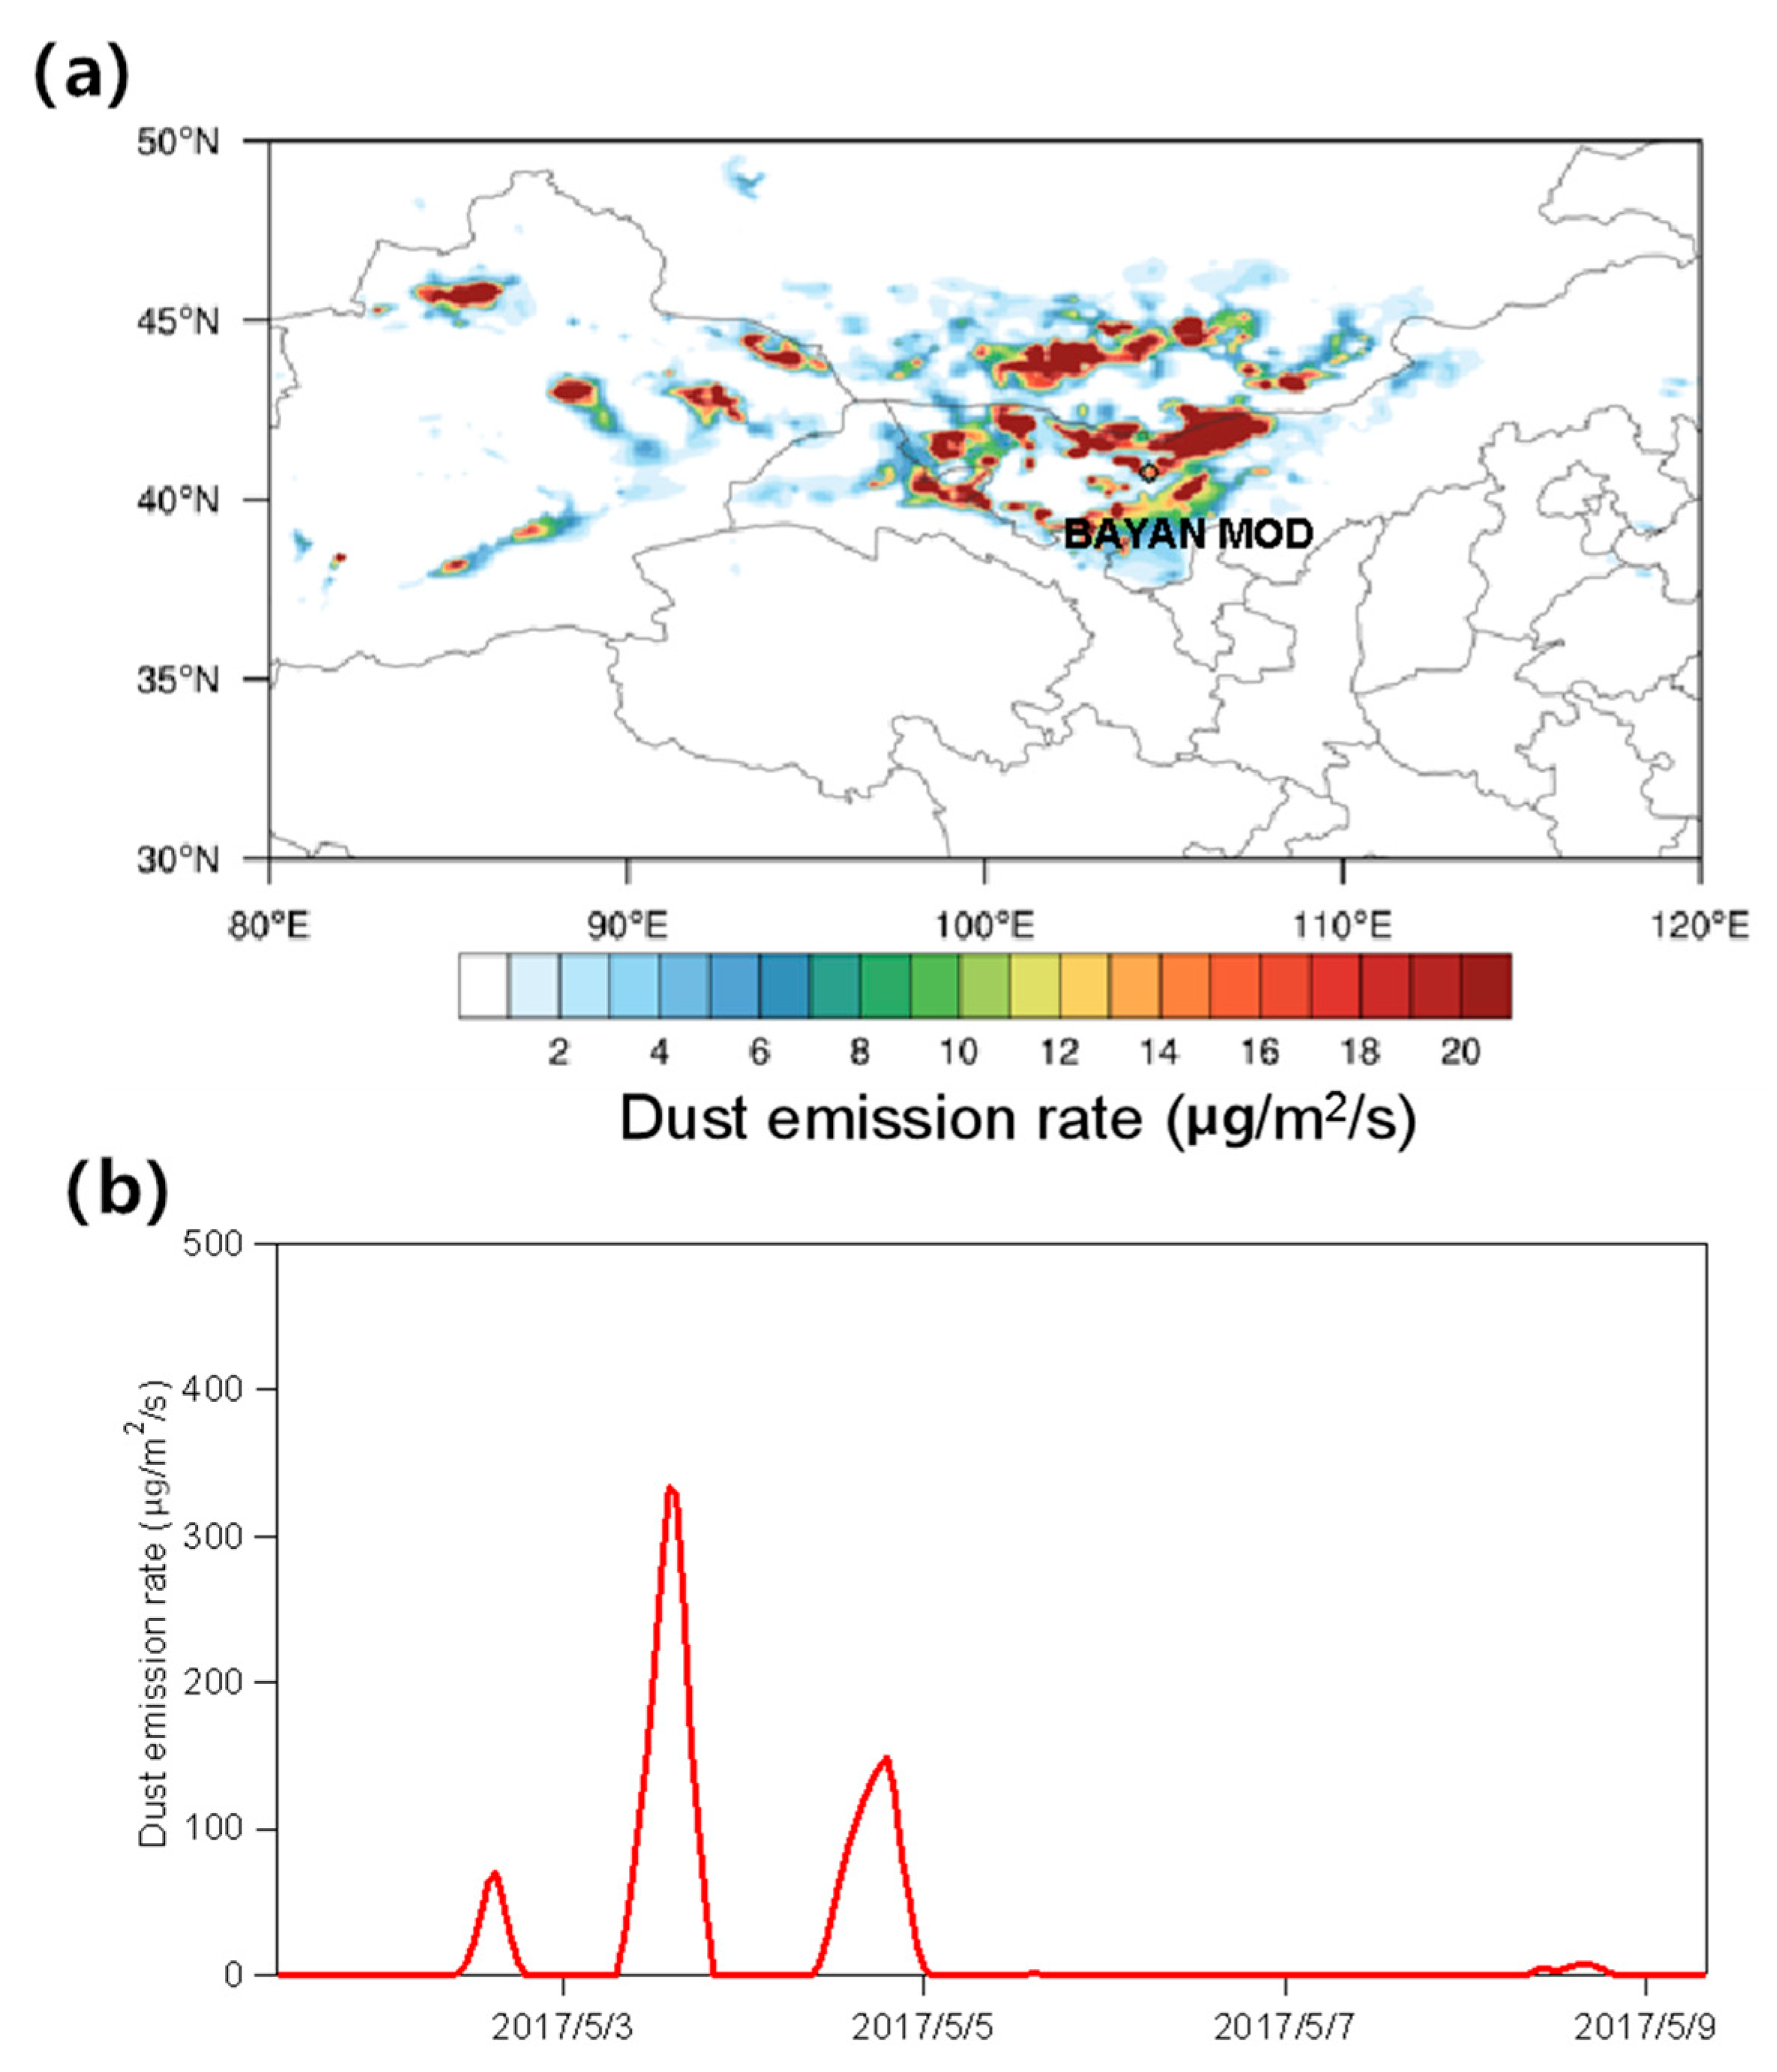
3.1. Synoptic Conditions during the Dust Storm Event

The synoptic weather evolution before and during the dust storm are shown in Figure 2, and the PM10 concentration time series for before and during the dust storm are shown in Figure 3. Temporal variations in the PM10 concentrations at the two stations near the dust source region indicated that the dust storm became more intense on 4 and 5 May 2017. For example, the PM10 concentrations on 5 May at Yinchuan Station, downwind of the Gobi Desert, reached 1600 μg m−3. The PM10 concentrations at Baotou in the Inner Mongolia Autonomous Region were >1500 μg m−3 for more than 30 h on 4 and 5 May 2017. The PM10 concentrations at both sites are usually <200 μg m−3, based on PM10 concentrations measured before 4 May and after 6 May 2017. The dust storm at the beginning of May 2017 therefore dramatically decreased the air quality and quickly increased the PM10 concentrations in the dust source region and surrounding areas.
Dust emissions are, to a large extent, determined by weather conditions [13,28]. The weather charts shown in Figure 2 indicate that the atmospheric pressure gradient before the dust event was quite weak before 2 May 2017 but became more intense during the dust storm. A strong pressure gradient was measured at the surface around 40–50° N and 100–110° E on 4 and 5 May. This pressure-affected area gradually moved south following a trough in the upper atmosphere with well-developed baroclinicity, creating a dynamic environment.

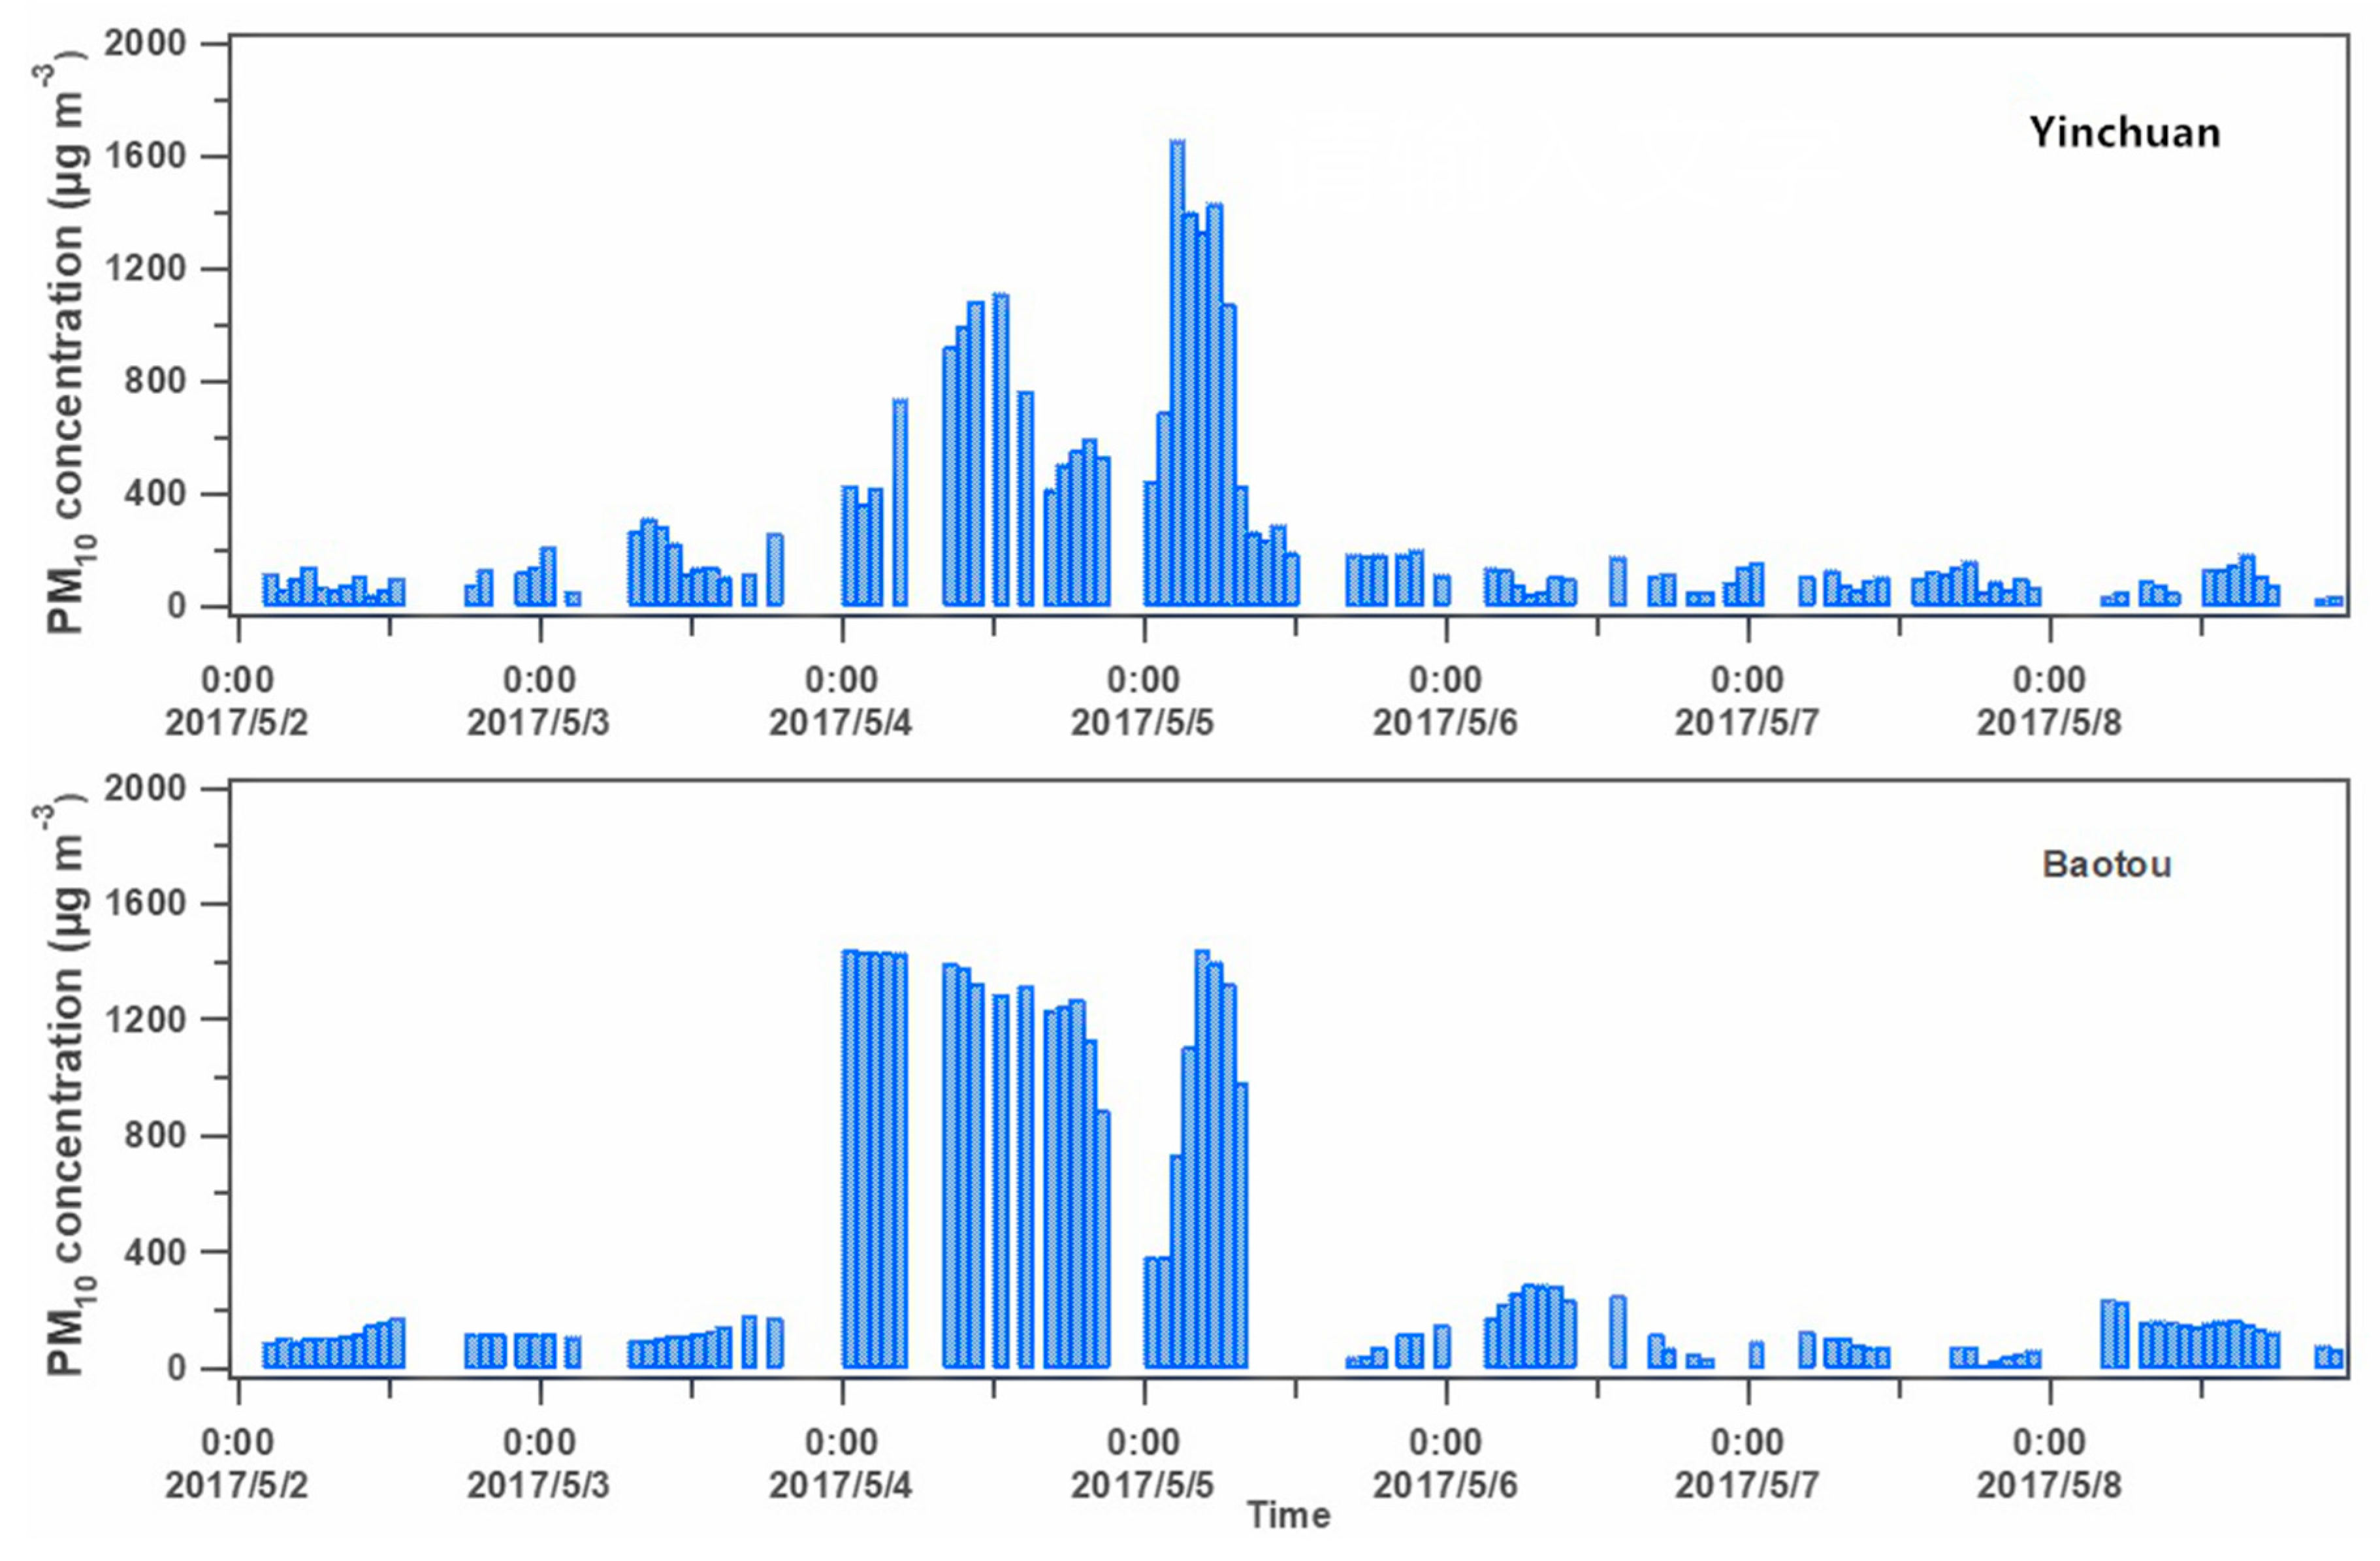
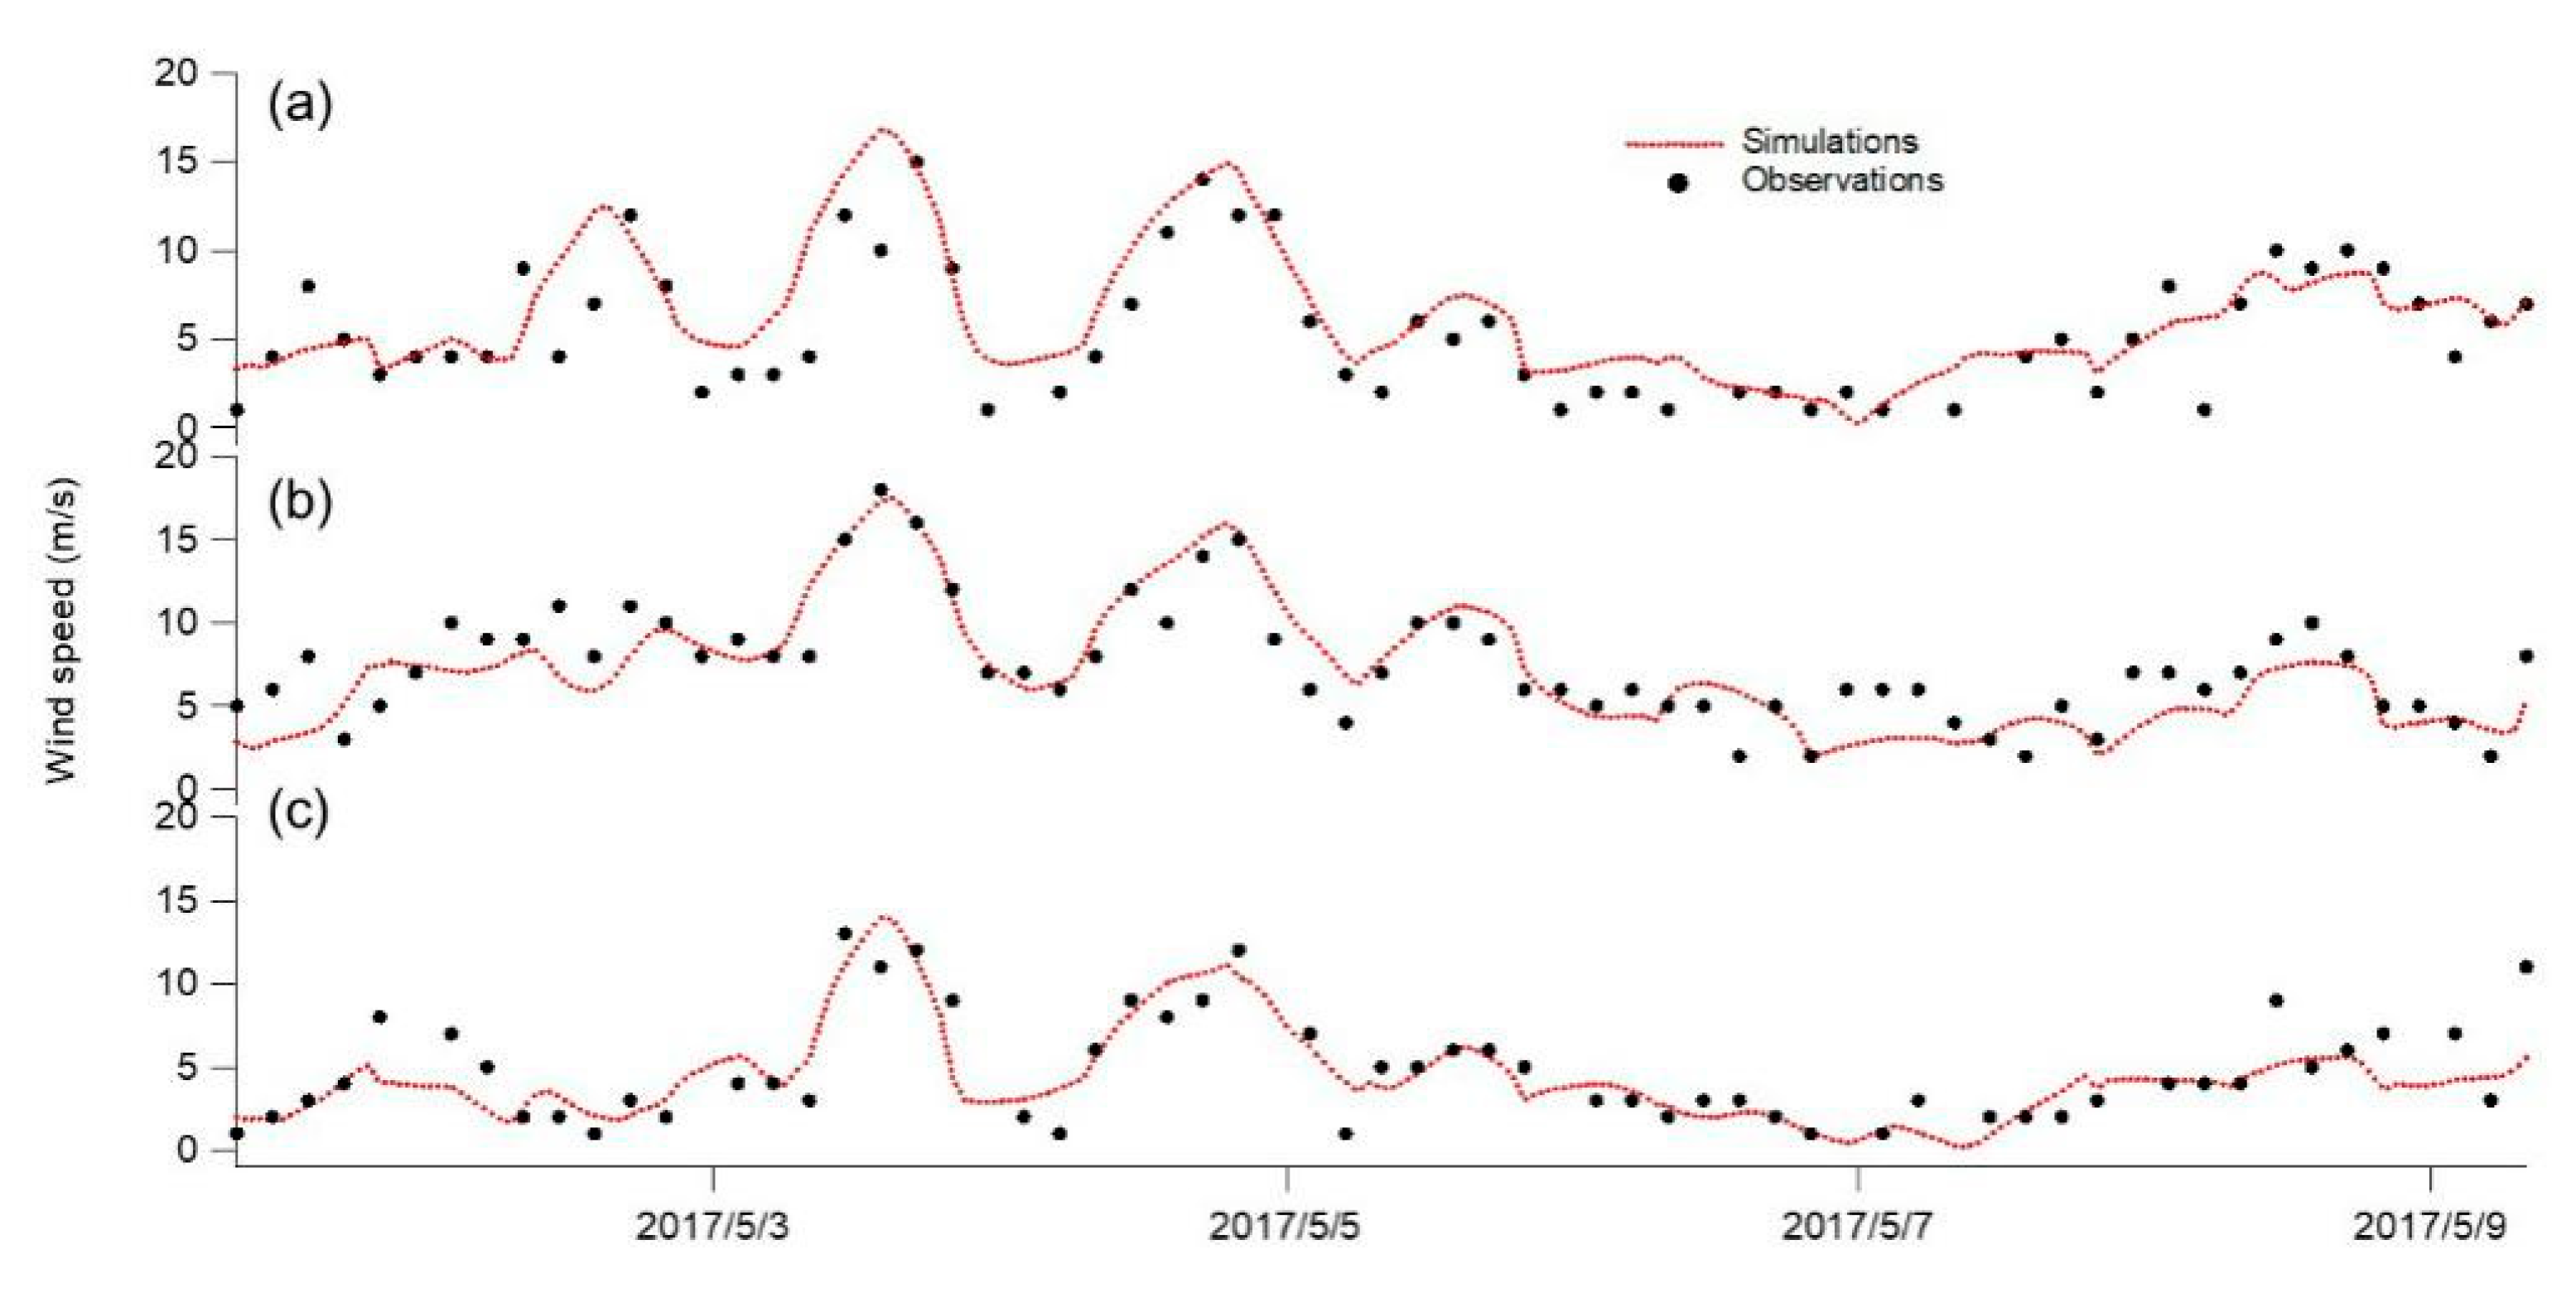
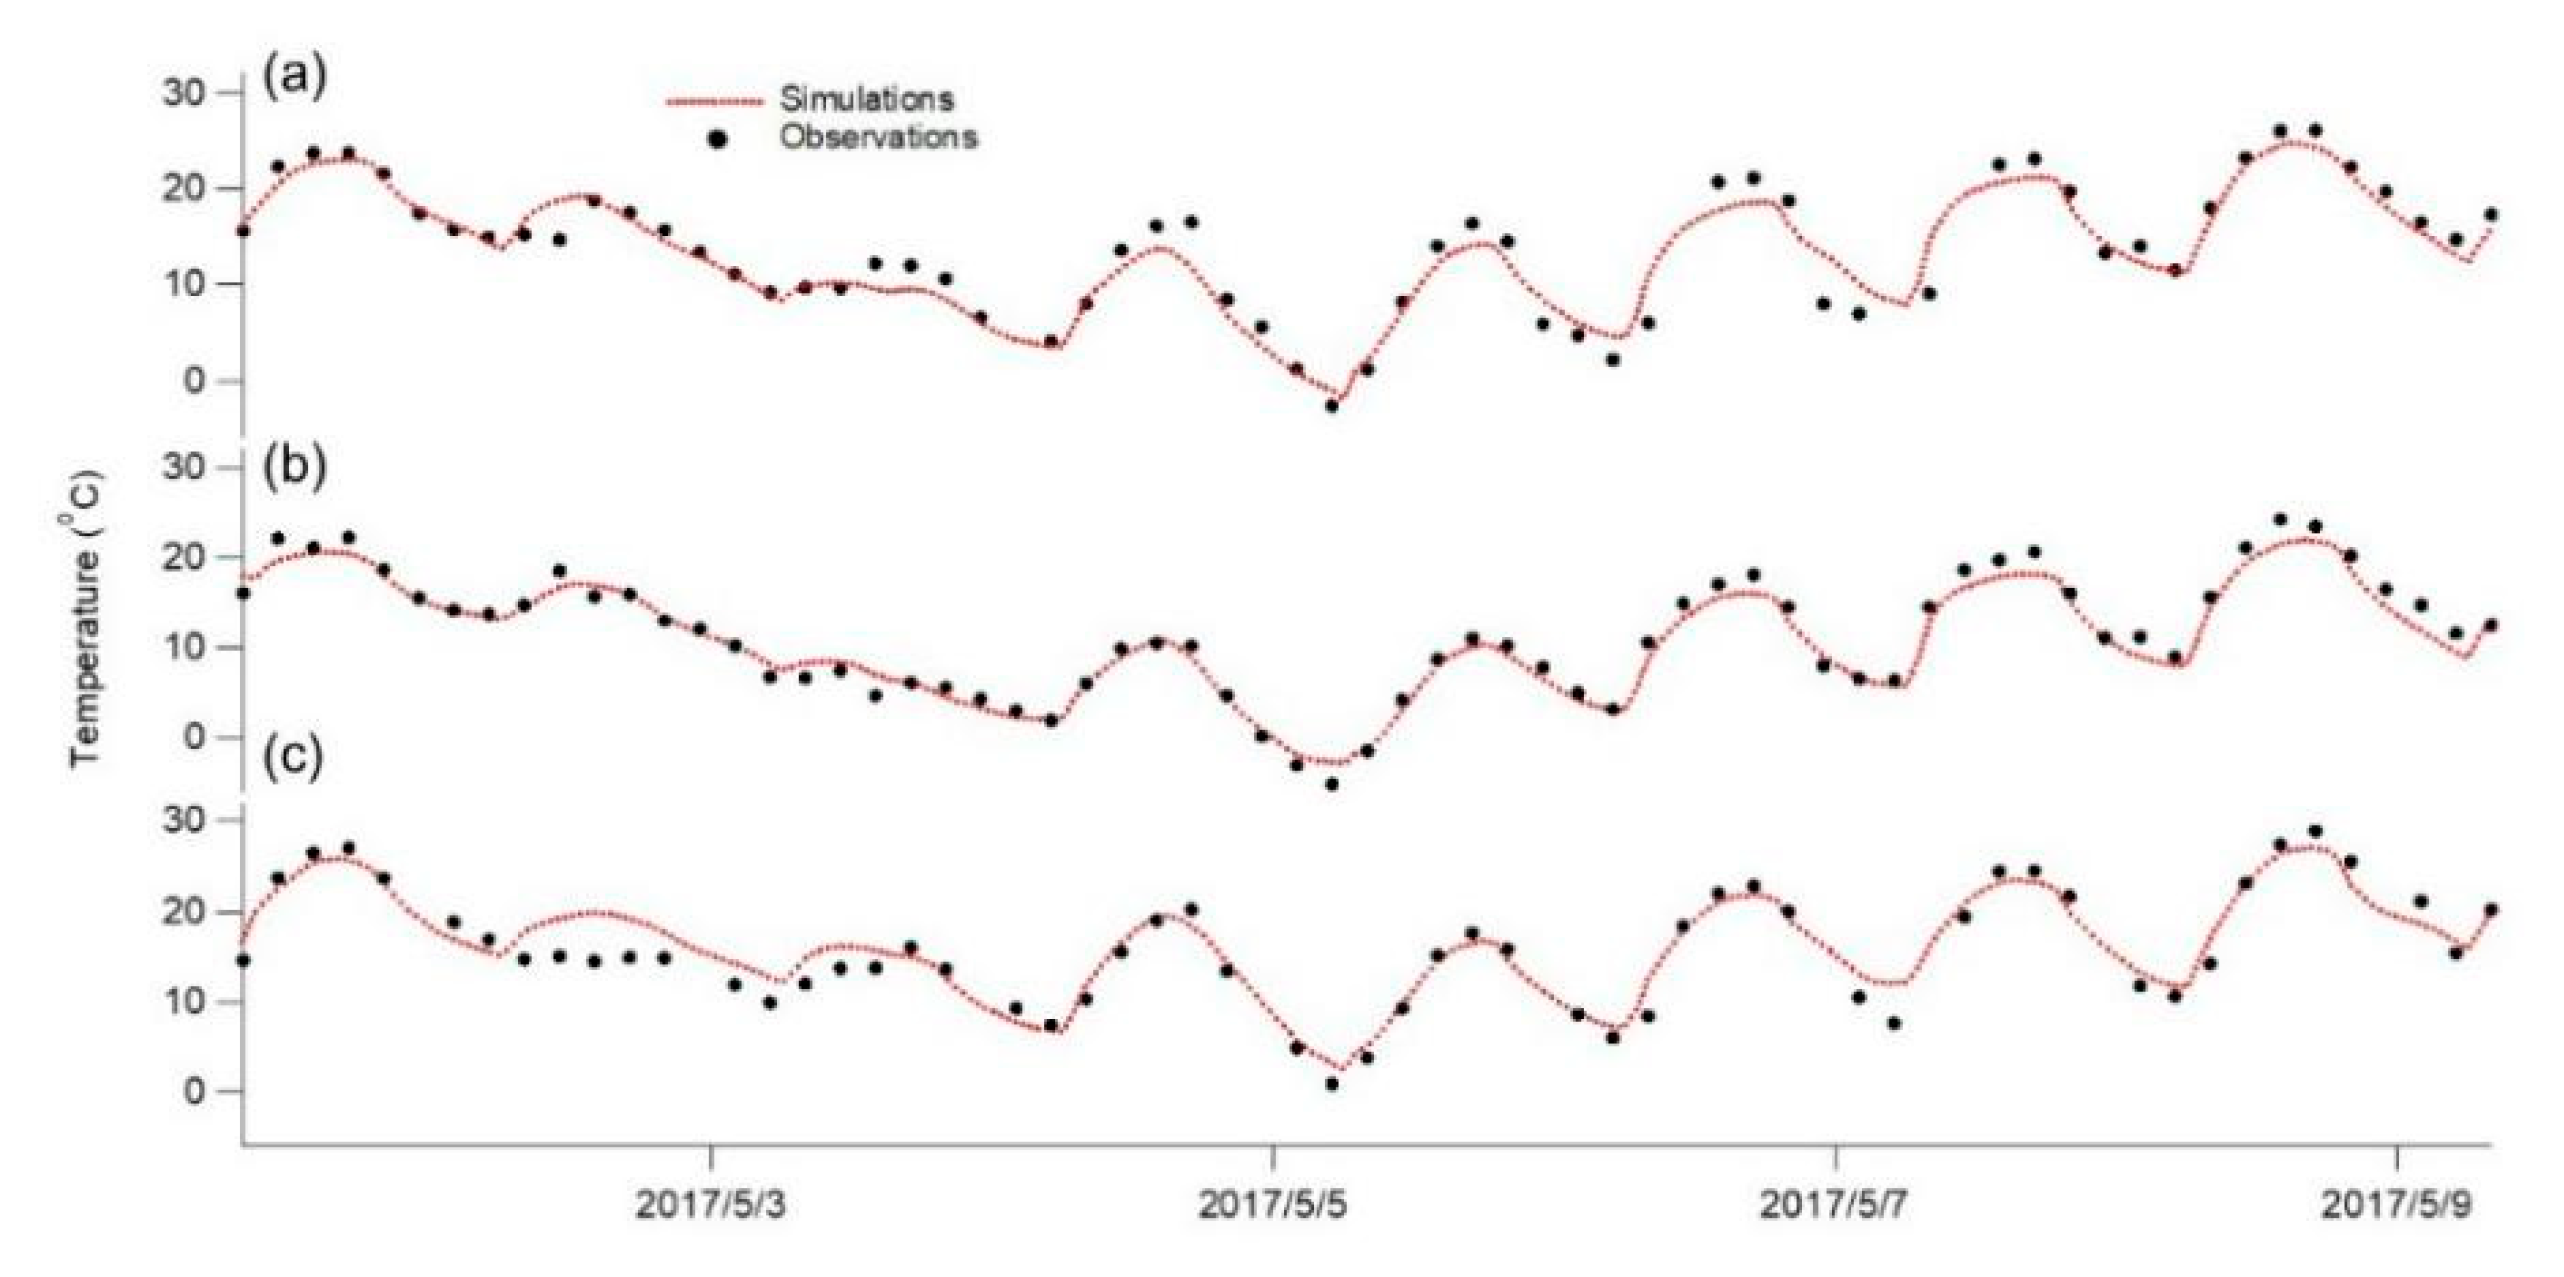
3.2. Analysis of Meteorological Conditions and Model Validation

Meteorological conditions, particularly the wind speed near the surface, affected the dust emission intensity. The model performance was evaluated by comparing the observed wind speed and 2 m air temperature at three automatic weather stations (Bayan Mod (104.5° E, 40.75° N), Hails (106.38° E, 41.45° N), and Jartai (105.75° E, 39.78° N)) with the corresponding simulations between 1 and 10 May 2017. The data are shown in Figure 4 and Figure 5.
The model generally simulated the observed wind speed and temperature variations at all three stations well. On 1 and 2 May (before the dust storm), the observed and simulated wind speeds at all three stations in the dust source region were <5 m s−1. As shown in Figure 4, the wind speeds at all three stations increased quickly from 3 May and reached maximum hourly wind speeds as high as 15 m s−1. The air temperature decreased markedly in the period 1–5 May. These are typical characteristics of a mesoscale cold front. It has previously been suggested that dust storms in Asia are generally accompanied by mesoscale cold fronts [29]. Our analysis of the dust storm in May 2017 matched this pattern in terms of the meteorological setting and characteristics.
We also assessed the mean spatial distribution and temporal variations in the wind-blown dust emission intensity in Northern China over the period 1–10 May 2017. The highest emission flux was found around the Gobi Desert (Figure 6). However, the Taklimakan Desert in Xinjiang Province was also an important dust source region. The strong cold front and rapidly increasing wind speed affected Inner Mongolia and Mongolia more than other regions, and caused dust to be emitted from the Gobi Desert. This was the main contributor to the dust storm event at the beginning of May 2017. Calculations using our optimized GOCART dust emission scheme gave dust emission rates up to 20 μg m−2 s−1 for particles with diameters <20 μm. However, the corresponding emission fluxes for most parts of the Taklimakan Desert were <5 μg m−2 s−1, confirming that the Gobi Desert was the dominant source of dust emissions during the dust storm event.
The dust emission rate for the Gobi Desert fluctuated during the event because the wind speed varied markedly during the evolution of the synoptic weather system. For example, the dust emission flux at the Bayan Mod Station in the source region started to increase on 2 May and reached a maximum of 325 μg m−2 s−1 on 4 May. The emission flux on 5 May remained at ~200 μg m−2 s−1 because of the relatively high surface wind speeds in the region. The wind speed decreased once the cold front had passed over the Gobi Desert, and the dust emission flux was <10 μg m−2 s−1 from 6 to 10 May.

3.3. Importance of Using A Local Dust-Size Distribution

We compared the simulated dust aerosol concentrations for 4 May (during the most intense phase of the dust storm) with MODIS satellite observations (MYD04 level-2 aerosol products, shown in Figure 7). The satellite images showed that the dust storm affected parts of Northern China (Gansu, Inner Mongolia, Ningxia, and Shanxi Provinces) but that the dust storm was most intense over the Beijing–Tianjin–Hebei region and Northeastern China. A simulation using the default configuration did not effectively represent the high AODs found over Northern China, even in and downwind of the dust source region. However, the spatial dust distribution and high AODs were represented well in simulations performed using the optimized GOCART dust emission scheme modified using the local particle size distribution. The optimized parameterization also captured the high dust load over the central and southern parts of the Hebei Province and the three northeastern provinces of China. The optimized scheme simulation results were therefore markedly better than the original scheme simulation results. This was probably because smaller dust particles in the optimized scheme decreased the dry deposition flux and increased the dust lifetime in the atmosphere.
Only the simulations performed using the optimized GOCART dust emission scheme based on the local dust size distribution adequately characterized the distribution pattern and AODs for the event from the satellite data. Differences between the particle mass concentrations predicted using the standard and optimized GOCART simulations were evaluated by comparing the simulation results with PM10 mass concentrations measured in situ at the two stations in the dust source region (Figure 8). The dust storm intensified strongly from 4 May, and the dust emission intensity started to decrease from 6 May, according to the PM10 mass concentration time series for the Yinchuan and Baotou Stations. The standard GOCART dust emission scheme using the default particle size distribution markedly underestimated the PM10 mass concentrations at both stations. Specifically, the simulated PM10 mass concentrations were ~300 μg m−3, but the observed PM10 mass concentrations were >1500 μg m−3. The simulated PM10 mass concentrations at the Yinchuan Station reached >1300 μg m−3 when the local particle size distribution was used in the optimized GOCART scheme, and these concentrations were consistent with the observed concentrations. The NMB between the simulated and observed PM10 mass concentrations therefore decreased from 57% in the non-optimized scheme to only 2% in the optimized scheme. The optimized dust scheme using the local dust size distribution gave much better simulation results (with a NMB of 40%) than did the non-optimized dust scheme (which gave a NMB of 77%).
It has been found, in previous studies, that the dust particle size distribution strongly influences dust emission, dust dispersion and transport in the atmosphere, and dry deposition rates. These processes determine ambient dust concentrations [30]. Field measurements of dust size distributions have been made in various parts of the world, and dust in Asia has generally been found to be smaller than dust in Africa and South America [27]. We found that including more small particles increased the emission rate for dust particles with diameters <10 μm. Smaller particles tend to have longer lifetimes in the atmosphere, are more likely to undergo long-range transport, and more strongly affect downwind areas than do larger particles.

4. Conclusions

We combined numerical simulations, air quality monitoring data, and satellite retrievals to investigate dust emission and transport during an intense dust storm in Northern China in May 2017. We found that the dust event was closely associated with a cold front, which rapidly increased the wind speed and increased the dust emission rate. PM10 mass concentrations near the dust source region reached 1500–2000 μg m−3 during the dust event, and this caused air quality over Northern China to deteriorate. We improved the dust parameterization scheme using the local dust size distribution in our simulations to better estimate the dust emission flux. Accurate parametrization of the dust size distribution played an important role when simulating both dust emission and regional transport. We compared our simulations with available in situ measurements of ambient particle mass concentrations and satellite-retrieved pollution distributions, and we found that using the local dust size distribution allowed better characterization of the spatial distribution of and temporal variations in the dust storm event than when the local dust size distribution was not used. Only one case study was considered, but it indicated the importance of the dust size distribution when modeling dust concentrations in the atmosphere. Sensitivity tests suggested that the dust size distribution also affected dust loading estimates and estimates of other climate effects. The results indicated that it is important to use accurate dust size distributions in future simulations, especially of dust storm events in Asia.

Author Contributions

Conceptualization, P.S. and J.F.; methodology, P.S.; software, P.S.; validation, P.S., J.F. and C.L.X.H.; formal analysis, P.S.; investigation, P.S.; resources, P.S. and. C.L.; data curation, S.P.; writing—original draft preparation, P.S.; writing—review and editing, P.S. and J.F.; visualization, P.S.; supervision, P.S.; project administration, P.S. and X.H.; funding acquisition, J.F.

Funding

This work was supported by the National Key Research and Development Program of China (grant nos. 2018YFC1507304 and 2018YFC1507402).

Acknowledgments

We thank Trudi Semeniuk and Gareth Thomas from Liwen Bianji, Edanz Editing China (www.liwenbianji.cn/ac), for editing the English text of a draft of this manuscript.

Conflicts of Interest

The authors declare no conflict of interest.

References

  1. Chow, J.C.; Watson, J.G.; Houck, J.E.; Pritchett, L.C.; Rogers, C.F.; Frazier, C.A.; Egami, R.T.; Ball, B.M. A Laboratory Resuspension Chamber to Measure Fugitive Dust Size Distributions and Chemical-Compositions. Atmos. Environ. 1994, 28, 3463–3481. [Google Scholar] [CrossRef]
  2. Huang, X.; Song, Y.; Zhao, C.; Cai, X.; Zhang, H.; Zhu, T. Direct radiative effect by multicomponent aerosol over China. J. Clim. 2015, 28, 3472–3495. [Google Scholar] [CrossRef]
  3. Duce, R.A.; Unni, C.K.; Ray, B.J.; Prospero, J.M.; Merrill, J.T. Long-range atmospheric transport of soil dust from Asia to the tropical North Pacific: Temporal variability. Science 1980, 209, 1522–1524. [Google Scholar] [CrossRef] [PubMed]
  4. Prospero, J.M. Long-term measurements of the transport of African mineral dust to the southeastern United States: Implications for regional air quality. J. Geophys. Res. Atmos. 1999, 104, 15917–15927. [Google Scholar] [CrossRef] [Green Version]
  5. Tegen, I.; Lacis, A.A.; Fung, I. The influence on climate forcing of mineral aerosols from disturbed soils. Nature 1996, 380, 419–422. [Google Scholar] [CrossRef]
  6. Li, L.; Sokolik, I.N. The Dust Direct Radiative Impact and Its Sensitivity to the Land Surface State and Key Minerals in the WRF-Chem-DuMo Model: A Case Study of Dust Storms in Central Asia. J. Geophys. Res. Atmos. 2018, 123, 4564–4582. [Google Scholar] [CrossRef]
  7. Huang, X.; Wang, Z.; Ding, A. Impact of Aerosol-PBL Interaction on Haze Pollution: Multi-Year Observational Evidences in North China. Geophys. Res. Lett. 2018, 45, 8596–8603. [Google Scholar] [CrossRef]
  8. Tang, M.J.; Huang, X.; Lu, K.D.; Ge, M.F.; Li, Y.J.; Cheng, P.; Zhu, T.; Ding, A.J.; Zhang, Y.H.; Gligorovski, S.; et al. Heterogeneous reactions of mineral dust aerosol: Implications for tropospheric oxidation capacity. Atmos. Chem. Phys. 2017, 17, 11727–11777. [Google Scholar] [CrossRef]
  9. Maring, H.B.; Duce, R.A. The Impact of Atmospheric Aerosols on Trace-Metal Chemistry in Open Ocean Surface Seawater. 3. Lead. J. Geophys. Res. Ocean. 1990, 95, 5341–5347. [Google Scholar] [CrossRef]
  10. Washington, R.; Todd, M.C. Atmospheric controls on mineral dust emission from the Bodele Depression, Chad: The role of the low level jet. Geophys. Res. Lett. 2005, 32. [Google Scholar] [CrossRef]
  11. Zhang, X.Y.; Arimoto, R.; An, Z.S. Dust emission from Chinese desert sources linked to variations in atmospheric circulation. J. Geophys. Res. Atmos. 1997, 102, 28041–28047. [Google Scholar] [CrossRef] [Green Version]
  12. Cakmur, R.; Miller, R.; Perlwitz, J.; Geogdzhayev, I.; Ginoux, P.; Koch, D.; Kohfeld, K.; Tegen, I.; Zender, C. Constraining the magnitude of the global dust cycle by minimizing the difference between a model and observations. J. Geophys. Res. Atmos. 2006, 111. [Google Scholar] [CrossRef] [Green Version]
  13. Xuan, J.; Liu, G.L.; Du, K. Dust emission inventory in Northern China. Atmos. Environ. 2000, 34, 4565–4570. [Google Scholar] [CrossRef]
  14. Gillette, D.A.; Passi, R. Modeling Dust Emission Caused by Wind Erosion. J. Geophys. Res. Atmos. 1988, 93, 14233–14242. [Google Scholar] [CrossRef]
  15. Tanaka, T.Y.; Chiba, M. A numerical study of the contributions of dust source regions to the global dust budget. Glob. Planet. Chang. 2006, 52, 88–104. [Google Scholar] [CrossRef]
  16. Zhang, D.F.; Zakey, A.S.; Gao, X.J.; Giorgi, F.; Solmon, F. Simulation of dust aerosol and its regional feedbacks over East Asia using a regional climate model. Atmos. Chem. Phys. 2009, 9, 1095–1110. [Google Scholar] [CrossRef] [Green Version]
  17. Ginoux, P.; Chin, M.; Tegen, I.; Prospero, J.M.; Holben, B.; Dubovik, O.; Lin, S.J. Sources and distributions of dust aerosols simulated with the GOCART model. J. Geophys. Res. Atmos. 2001, 106, 20255–20273. [Google Scholar] [CrossRef] [Green Version]
  18. Weaver, C.J.; Ginoux, P.; Hsu, N.C.; Chou, M.-D.; Joiner, J. Radiative forcing of Saharan dust: GOCART model simulations compared with ERBE data. J. Atmos. Sci. 2002, 59, 736–747. [Google Scholar] [CrossRef]
  19. Seinfeld, J.H.; Pandis, S.N. Atmospheric Chemistry and Physics: From Air Pollution to Climate Change; John Wiley & Sons: Hoboken, NJ, USA, 2016. [Google Scholar]
  20. Chen, S.Y.; Zhao, C.; Qian, Y.; Leung, L.R.; Huang, J.P.; Huang, Z.W.; Bi, J.R.; Zhang, W.; Shi, J.S.; Yang, L.; et al. Regional modeling of dust mass balance and radiative forcing over East Asia using WRF-Chem. Aeolian Res. 2014, 15, 15–30. [Google Scholar] [CrossRef]
  21. Maring, H.; Savoie, D.; Izaguirre, M.; Custals, L.; Reid, J. Mineral dust aerosol size distribution change during atmospheric transport. J. Geophys. Res. Atmos. 2003, 108. [Google Scholar] [CrossRef] [Green Version]
  22. Tanré, D.; Kaufman, Y.J.; Holben, B.E.A.; Chatenet, B.; Karnieli, A.; Lavenu, L.; Blarel, O.; Dubovik, L.A.; Remer, F.; Smirnov, A. Climatology of dust aerosol size distribution and optical properties derived from remotely sensed data in the solar spectrum. J. Geophys. Res. Atmos. 2001, 106, 18205–18217. [Google Scholar] [Green Version]
  23. Kok, J.F. A scaling theory for the size distribution of emitted dust aerosols suggests climate models underestimate the size of the global dust cycle. Proc. Natl. Acad. Sci. USA 2011, 108, 1016–1021. [Google Scholar] [CrossRef] [PubMed]
  24. Skamarock, W.C.; Klemp, J.B. Coauthors, 2008: A description of the Advanced Research WRF version 3. NCAR Tech. Note NCAR/TN-475+STR, 113.
  25. Zaveri, R.A.; Peters, L.K. A new lumped structure photochemical mechanism for large-scale applications. J. Geophys. Res. Atmos. 1999, 104, 30387–30415. [Google Scholar] [CrossRef] [Green Version]
  26. Zaveri, R.A.; Easter, R.C.; Fast, J.D.; Peters, L.K. Model for simulating aerosol interactions and chemistry (MOSAIC). J. Geophys. Res. Atmos. 2008, 113. [Google Scholar] [CrossRef]
  27. Su, L.; Fung, J.C.H. Sensitivities of WRF-Chem to dust emission schemes and land surface properties in simulating dust cycles during springtime over East Asia. J. Geophys. Res. Atmos. 2015, 120, 11215–11230. [Google Scholar] [CrossRef]
  28. Zhang, X.Y.; Gong, S.L.; Shen, Z.X.; Mei, F.M.; Xi, X.X.; Liu, L.C.; Zhou, Z.J.; Wang, D.; Wang, Y.Q.; Cheng, Y. Characterization of soil dust aerosol in China and its transport and distribution during 2001 ACE-Asia: 1. Network observations. J. Geophys. Res. Atmos. 2003, 108. [Google Scholar] [CrossRef] [Green Version]
  29. Aoki, I.; Kurosaki, Y.; Osada, R.; Sato, T.; Kimura, F. Dust storms generated by mesoscale cold fronts in the Tarim Basin, Northwest China. Geophys. Res. Lett. 2005, 32. [Google Scholar] [CrossRef] [Green Version]
  30. Shao, Y.; Dong, C.H. A review on East Asian dust storm climate, modelling and monitoring. Glob. Planet Chang. 2006, 52, 1–22. [Google Scholar] [CrossRef]
Figure 1. Map showing the erodibility distribution and dust source regions in the model domain. The blue dot and diamond mark the air quality monitoring station and weather station locations, respectively.
Atmosphere 10 00135 g001
Figure 2. Weather charts for (a) 1 May 2017 (before the dust storm) and (b) 4 May 2017 (during the dust storm). The charts are available at https://web.kma.go.kr/eng/weather/images/analysischart.jsp.
Atmosphere 10 00135 g002
Figure 3. Time series of the PM10 concentrations measured at the Yinchuan and Baotou Stations between 1 and 10 May 2017.
Atmosphere 10 00135 g003
Figure 4. Modeled and observed wind speeds at the automatic weather stations (a) Bayan Mod, (b) Hails, and (c) Jartai.
Atmosphere 10 00135 g004
Figure 5. Modeled and observed air temperatures at the automatic weather stations (a) Bayan Mod, (b) Hails, and (c) Jartai.
Atmosphere 10 00135 g005
Figure 6. (a) Simulated spatial distribution of the mean emission rates for particles with diameters <20 μm, and (b) simulated time series for the emission rate of particles with diameters <20 μm at the automatic weather station at Bayan Mod over the period 1–10 May 2017.
Atmosphere 10 00135 g006
Figure 7. Spatial patterns of the 550 nm atmospheric optical depths (AODs) derived from (a) MODIS data, (b) the corresponding Weather Research and Forecasting model coupled with Chemistry model simulations using the default Goddard Global Ozone Chemistry Aerosol Radiation and Transport (GOCART) dust emission scheme, and (c) the optimized GOCART dust emission scheme at 13:00 local time on 4 May 2017. No valid data were available for the gray area in (a).
Atmosphere 10 00135 g007
Figure 8. Temporal variations in the observed PM10 concentrations at the Yinchuan and Baotou Stations, and the corresponding simulated values predicted using the default and modified dust size distributions for the period 1–10 May 2017.
Atmosphere 10 00135 g008
Table 1. Model domain settings and configuration options used in the study.
Domain Setting
Horizontal grid281 × 231
Grid spacing20 km × 20 km
Vertical layers30 eta levels
Map projectionLambert conformal conic
Configuration Options
Longwave radiationRRTMG
Shortwave radiationRRTMG
Cumulus parameterizationGrell-Deveny
Land surfaceunified Noah
Boundary layerYSU
MicrophysicsLin et al.
PhotolysisFast-J
Dust emission estimationGOCART
Gas-phase chemistry and aerosol schemeCBMZ and MOSAIC
Notes: RRTMG—rapid radiative transfer model for general circulation models; YSU—Yonsei University; GOCART—Goddard Global Ozone Chemistry Aerosol Radiation and Transport; CBMZ—Carbon Bond mechanism version Z; MOSAIC—model for simulating aerosol interactions and chemistry.

