PM2.5 Pollution in Xingtai, China: Chemical Characteristics, Source Apportionment, and Emission Control Measures
Abstract
1. Introduction
2. Experimental Section
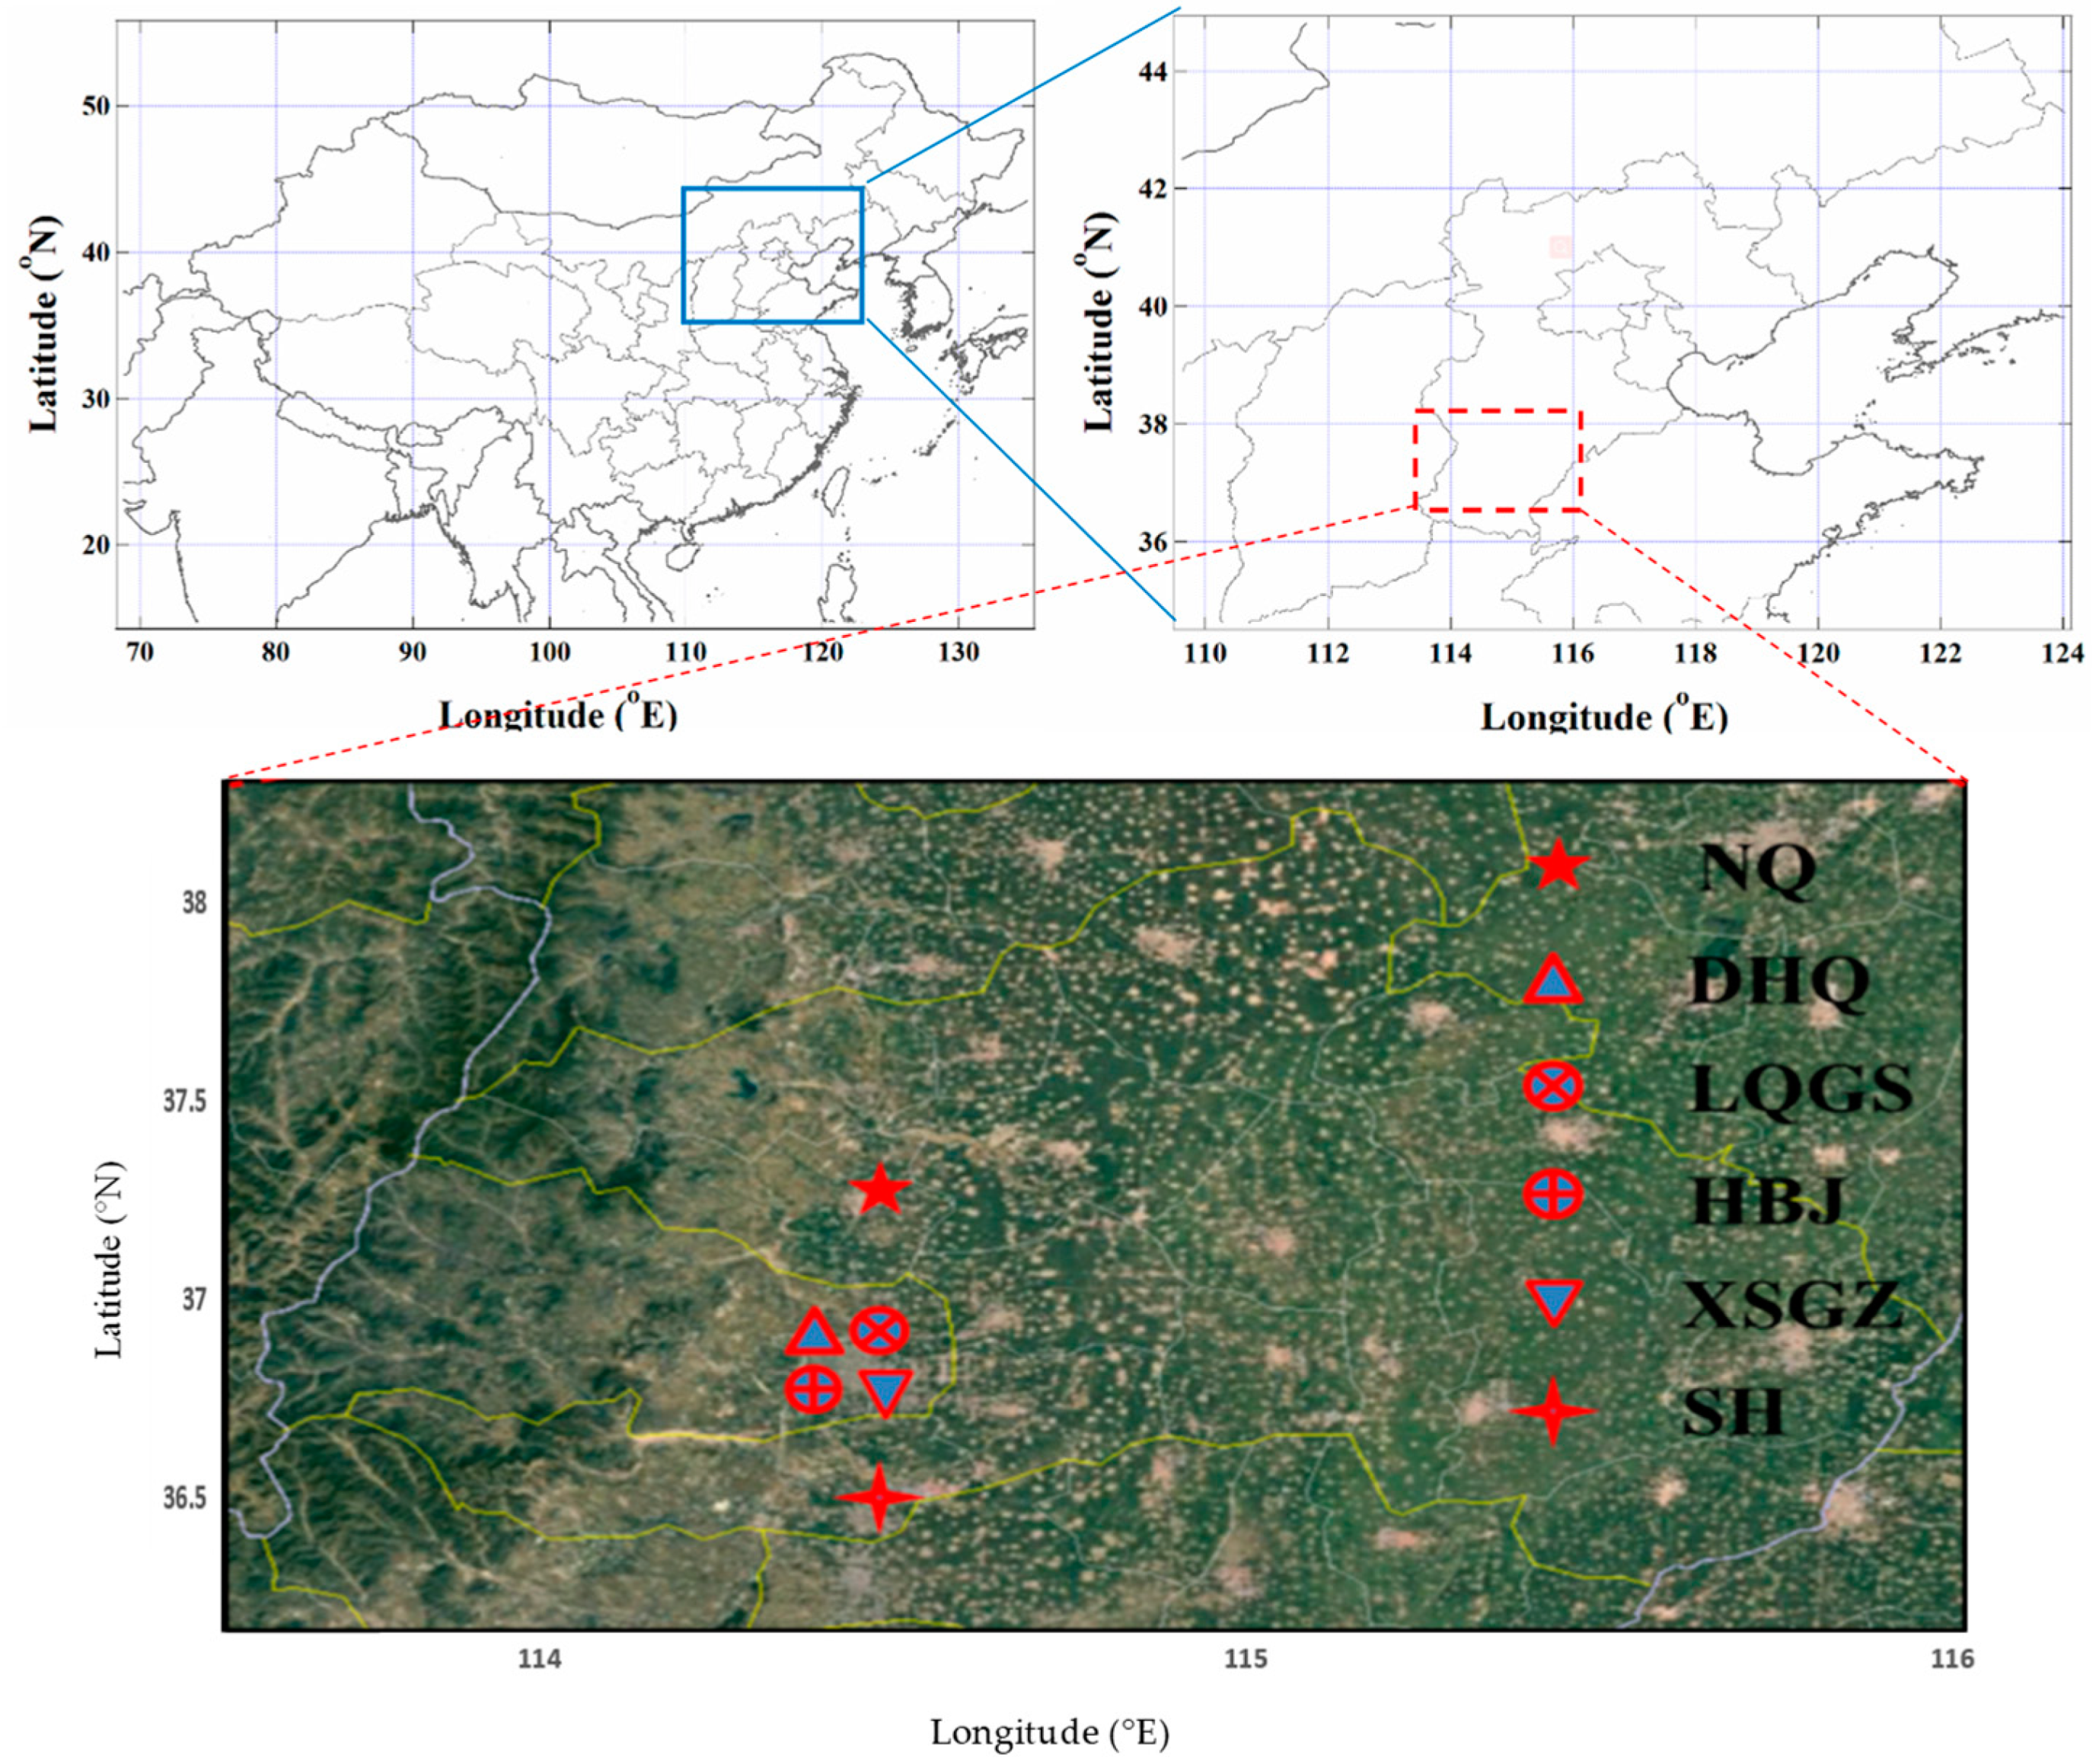
2.1. Sampling Site Description
2.2. Sample Collection
2.2.1. Ambient Sample Collection
2.2.2. Source Sample Collection
2.2.3. Other Pollutants
2.3. Chemical Analysis
2.4. CMB Analysis and Source Identification
3. Results and Discussions
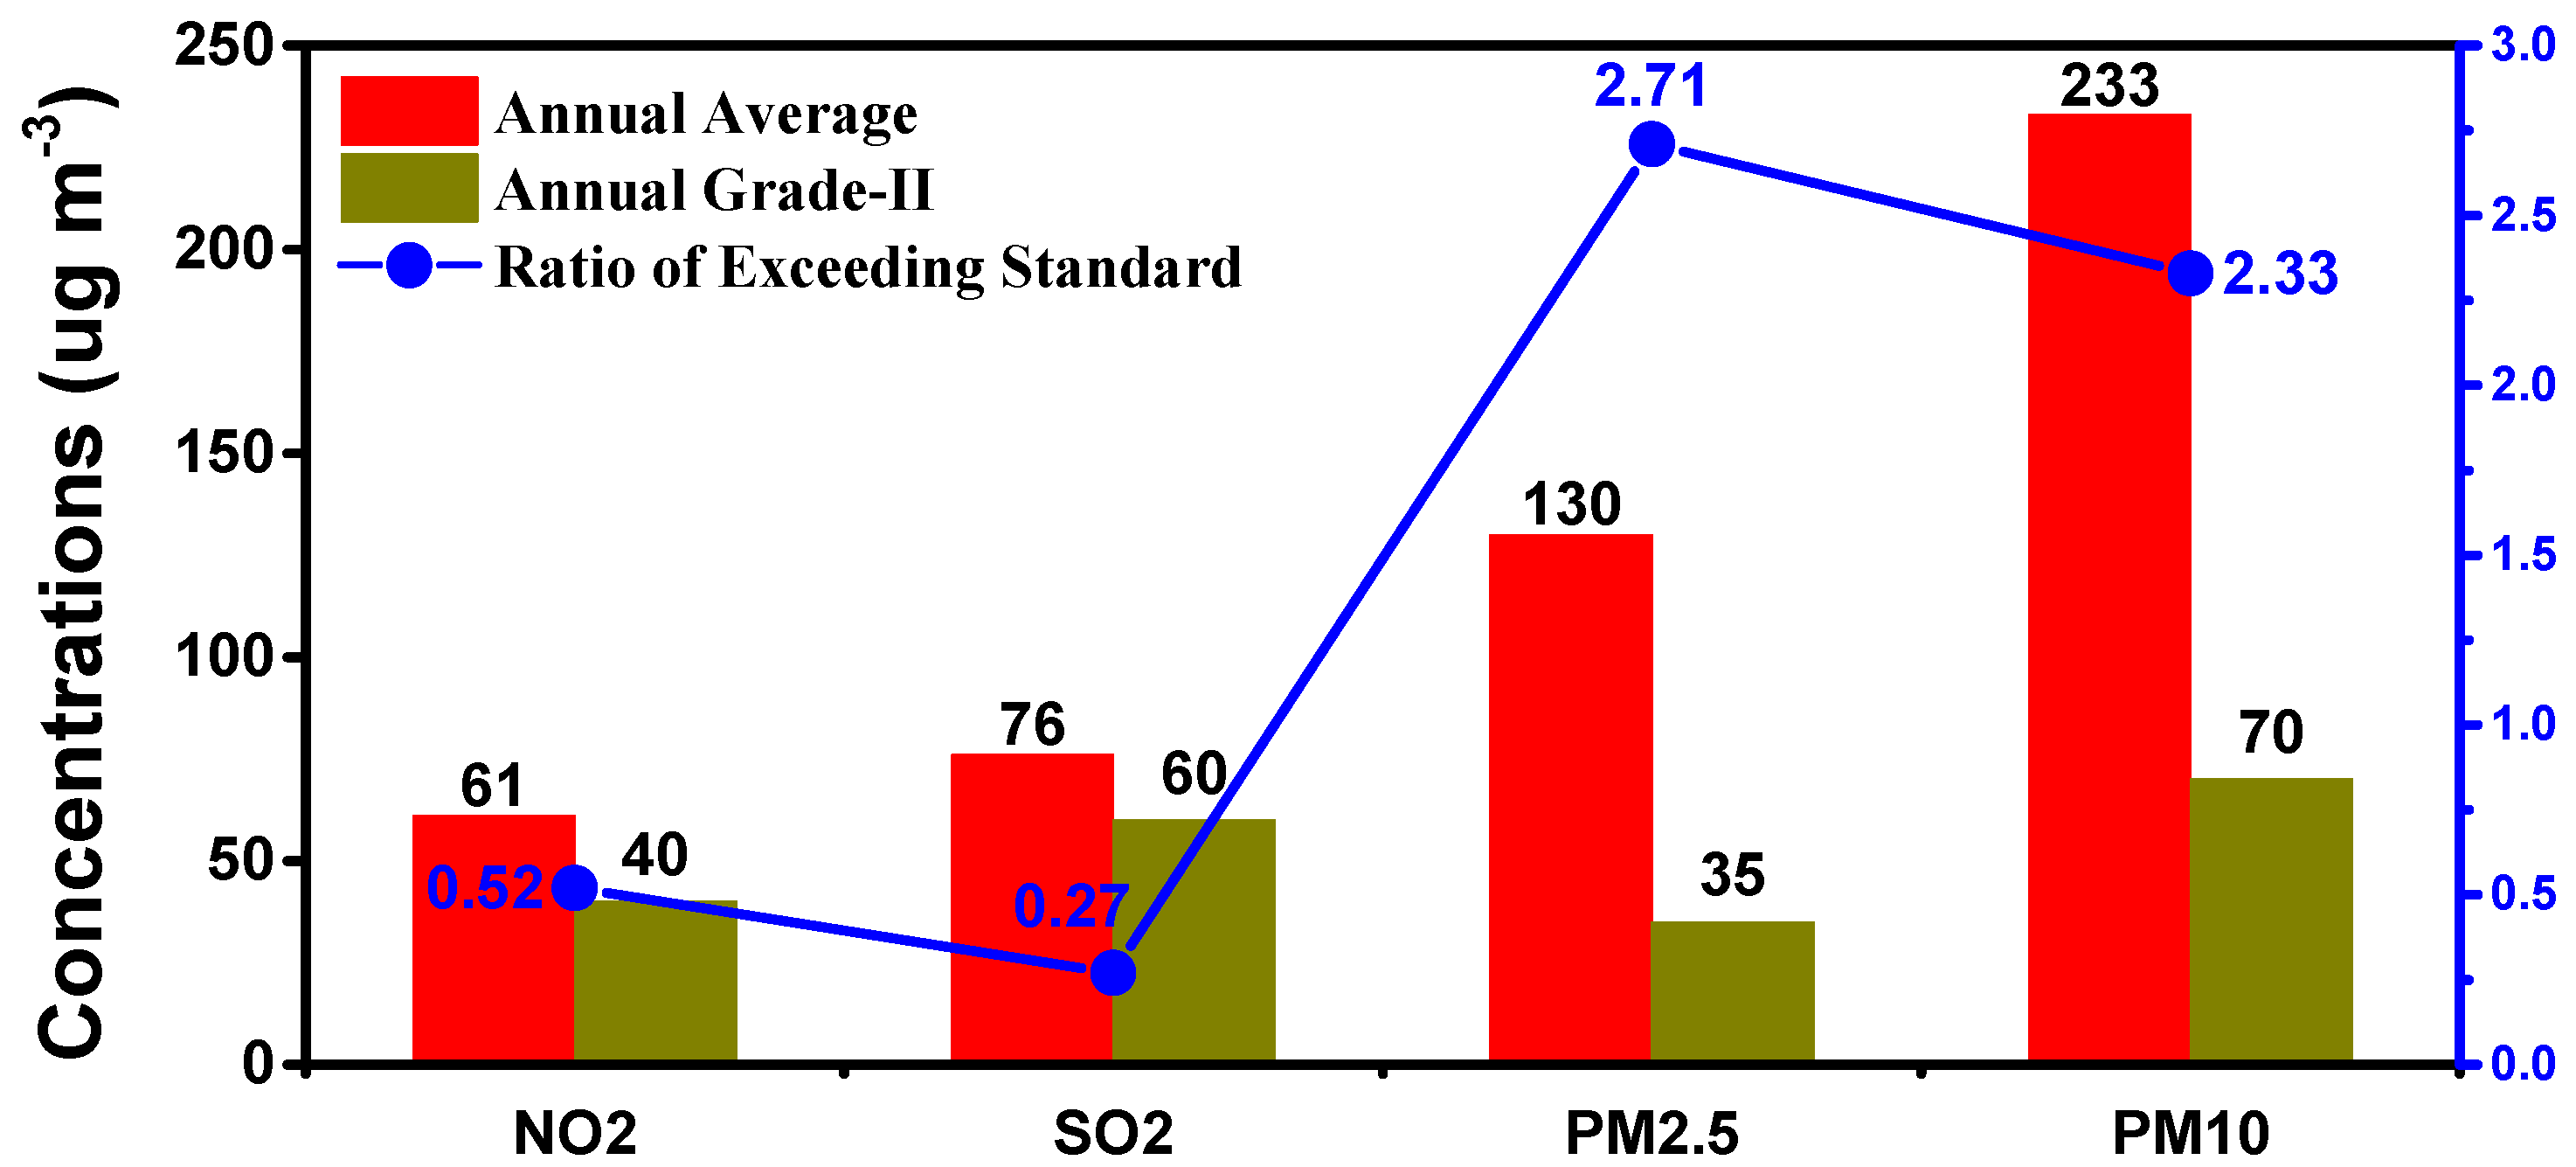
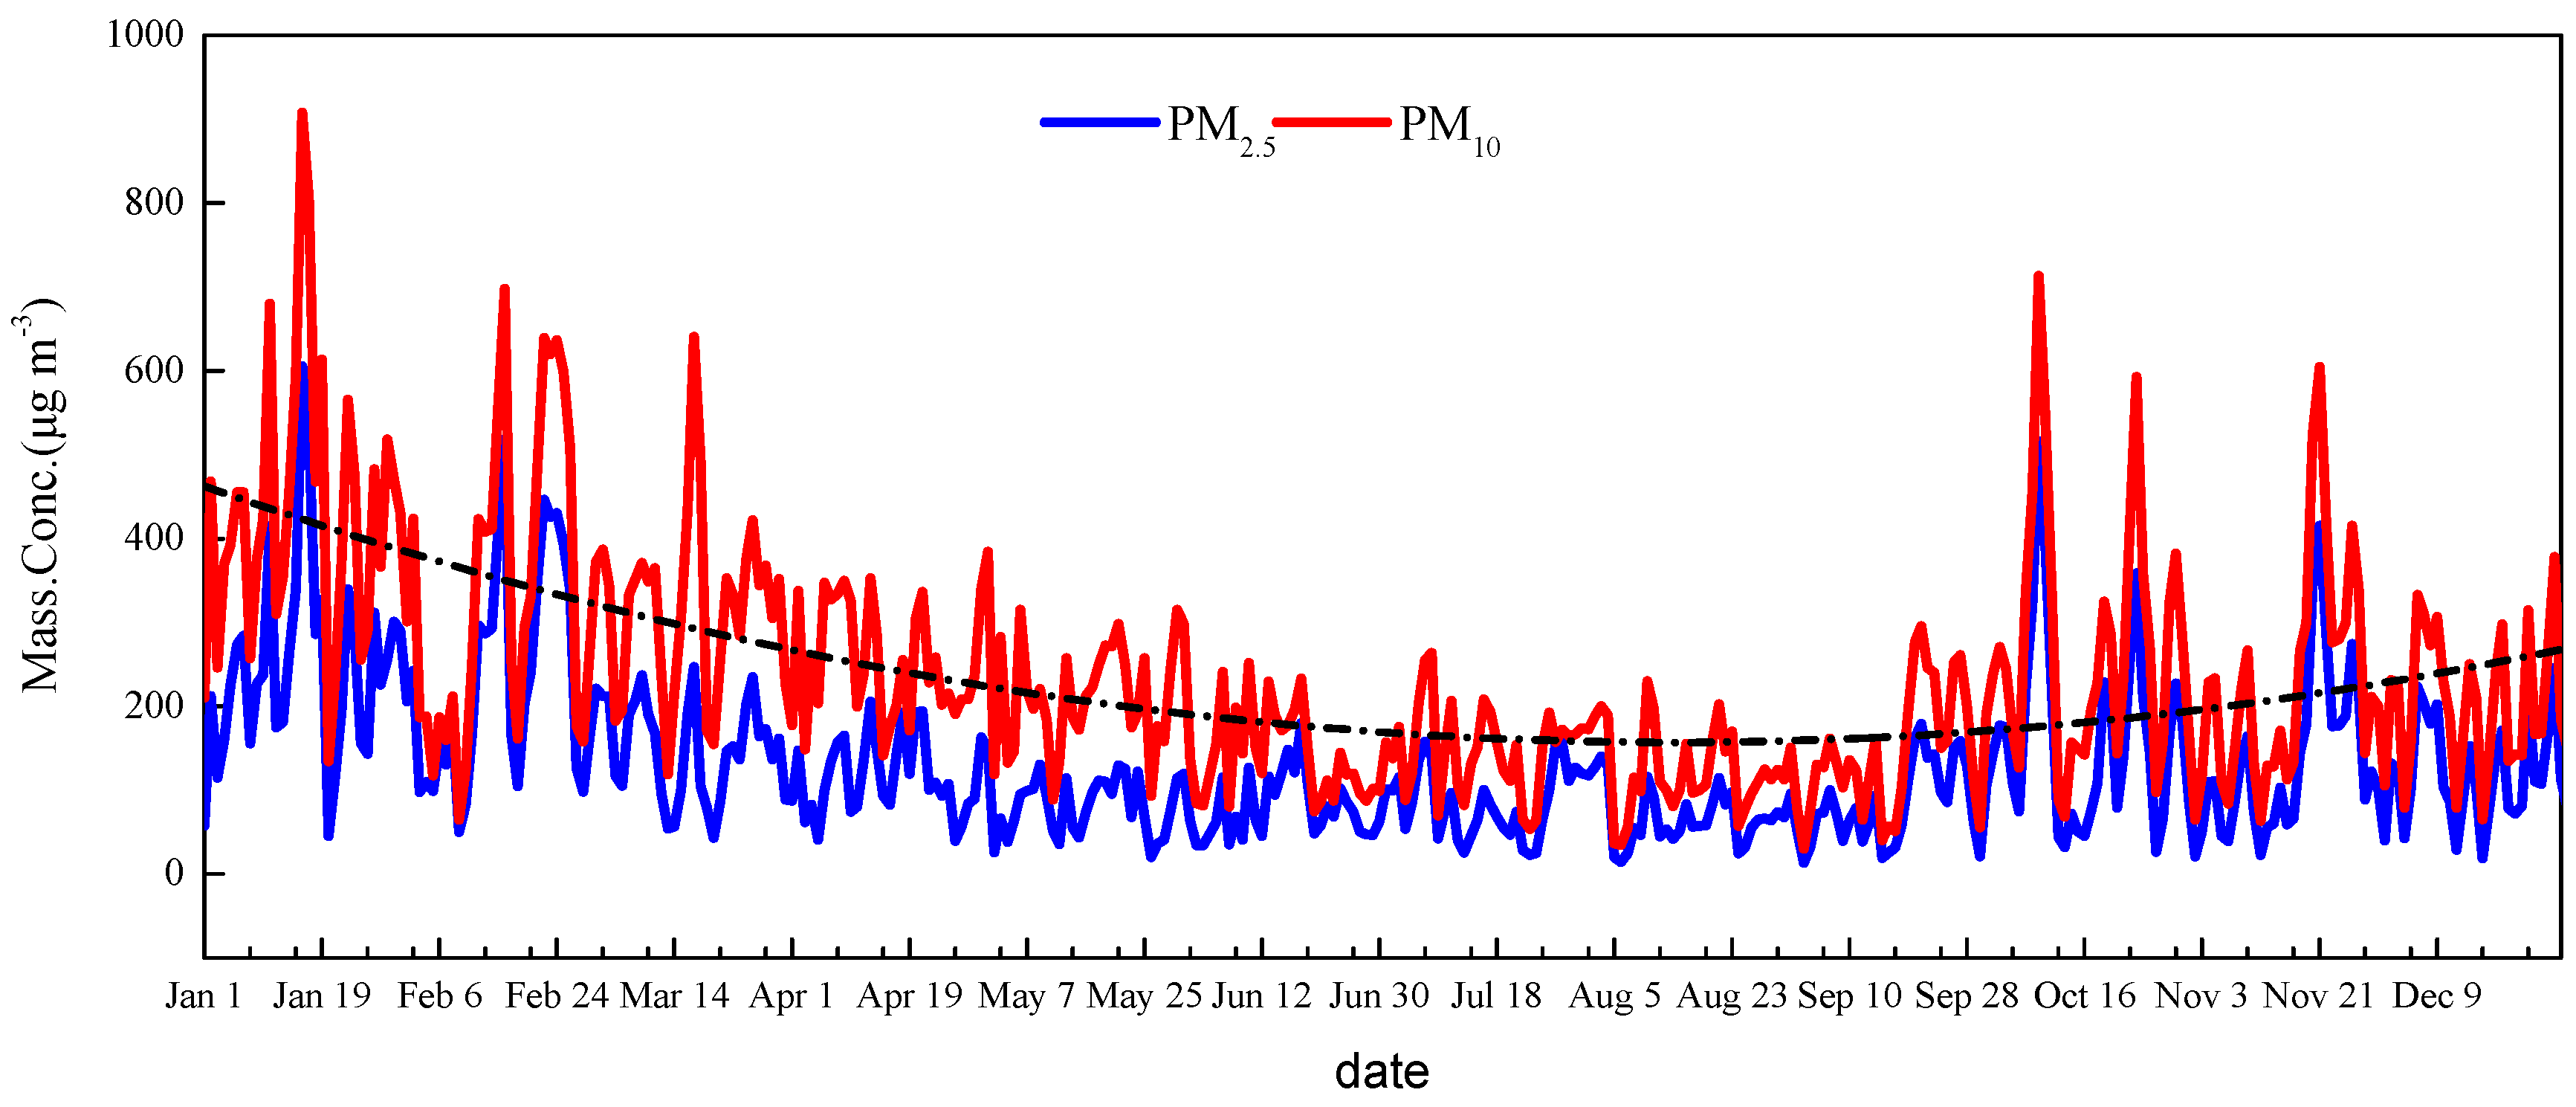
3.1. Levels of PM2.5 Mass Concentrations in Xingtai
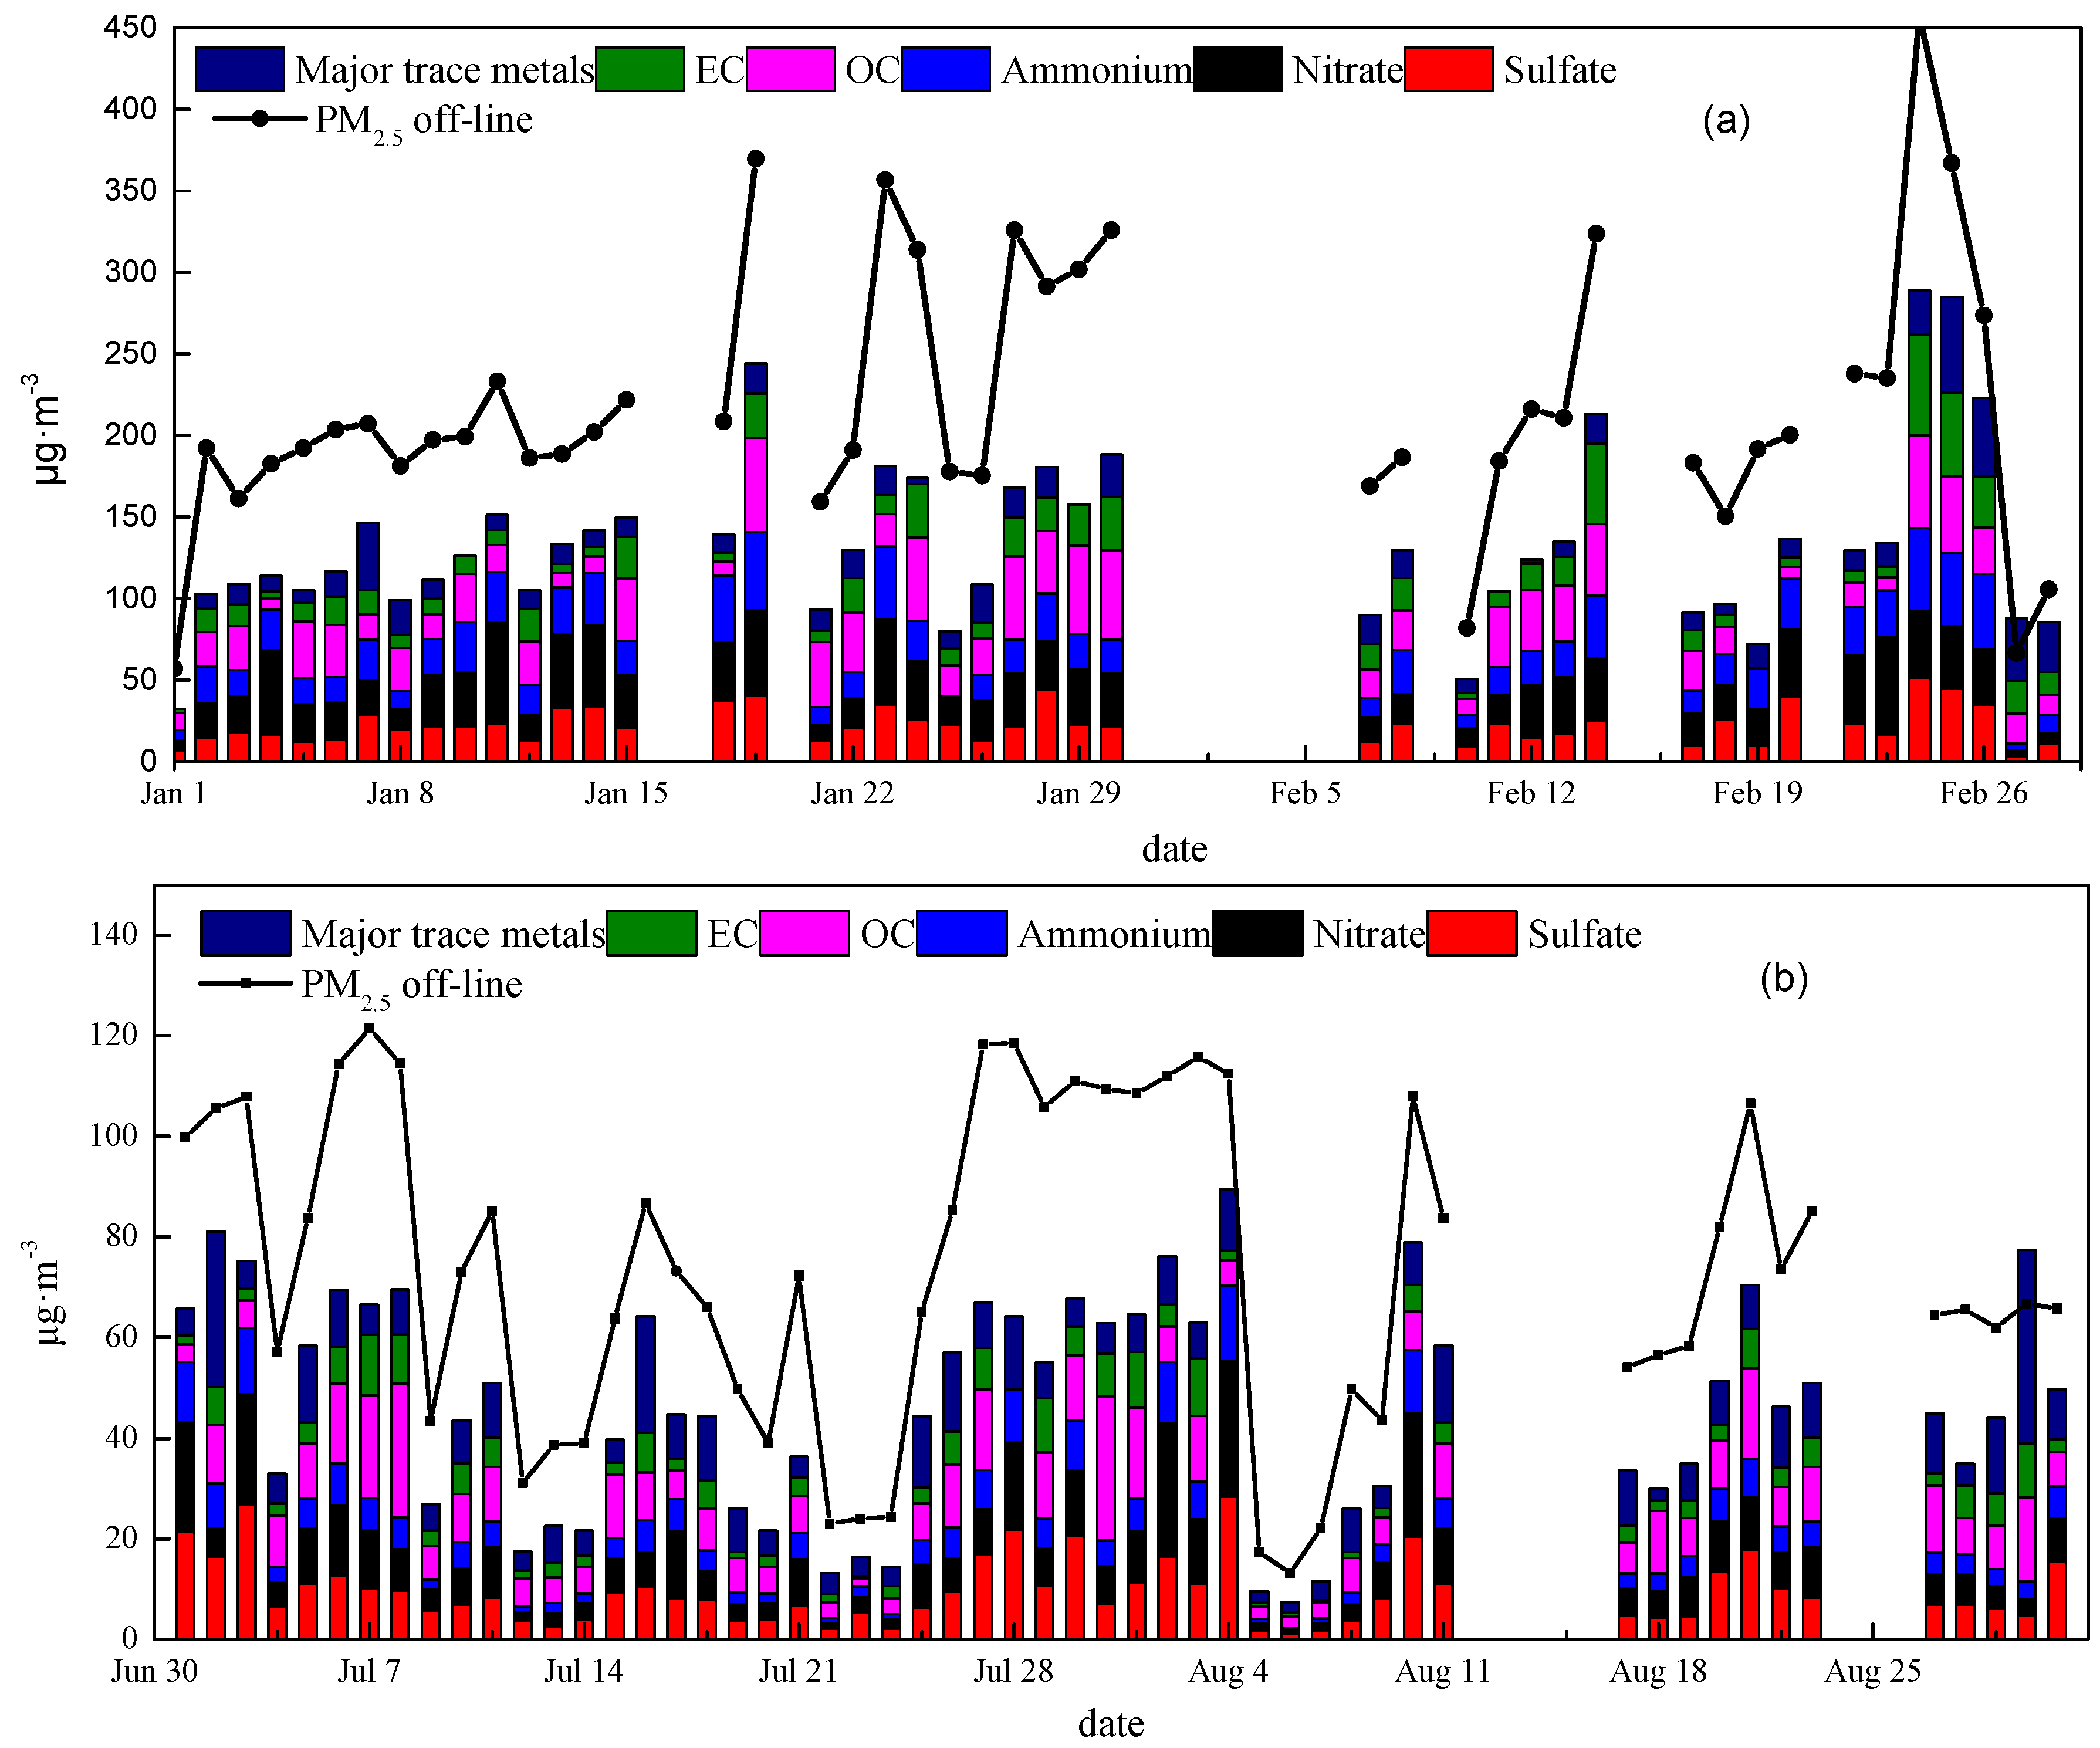
3.2. Chemical Composition of PM2.5
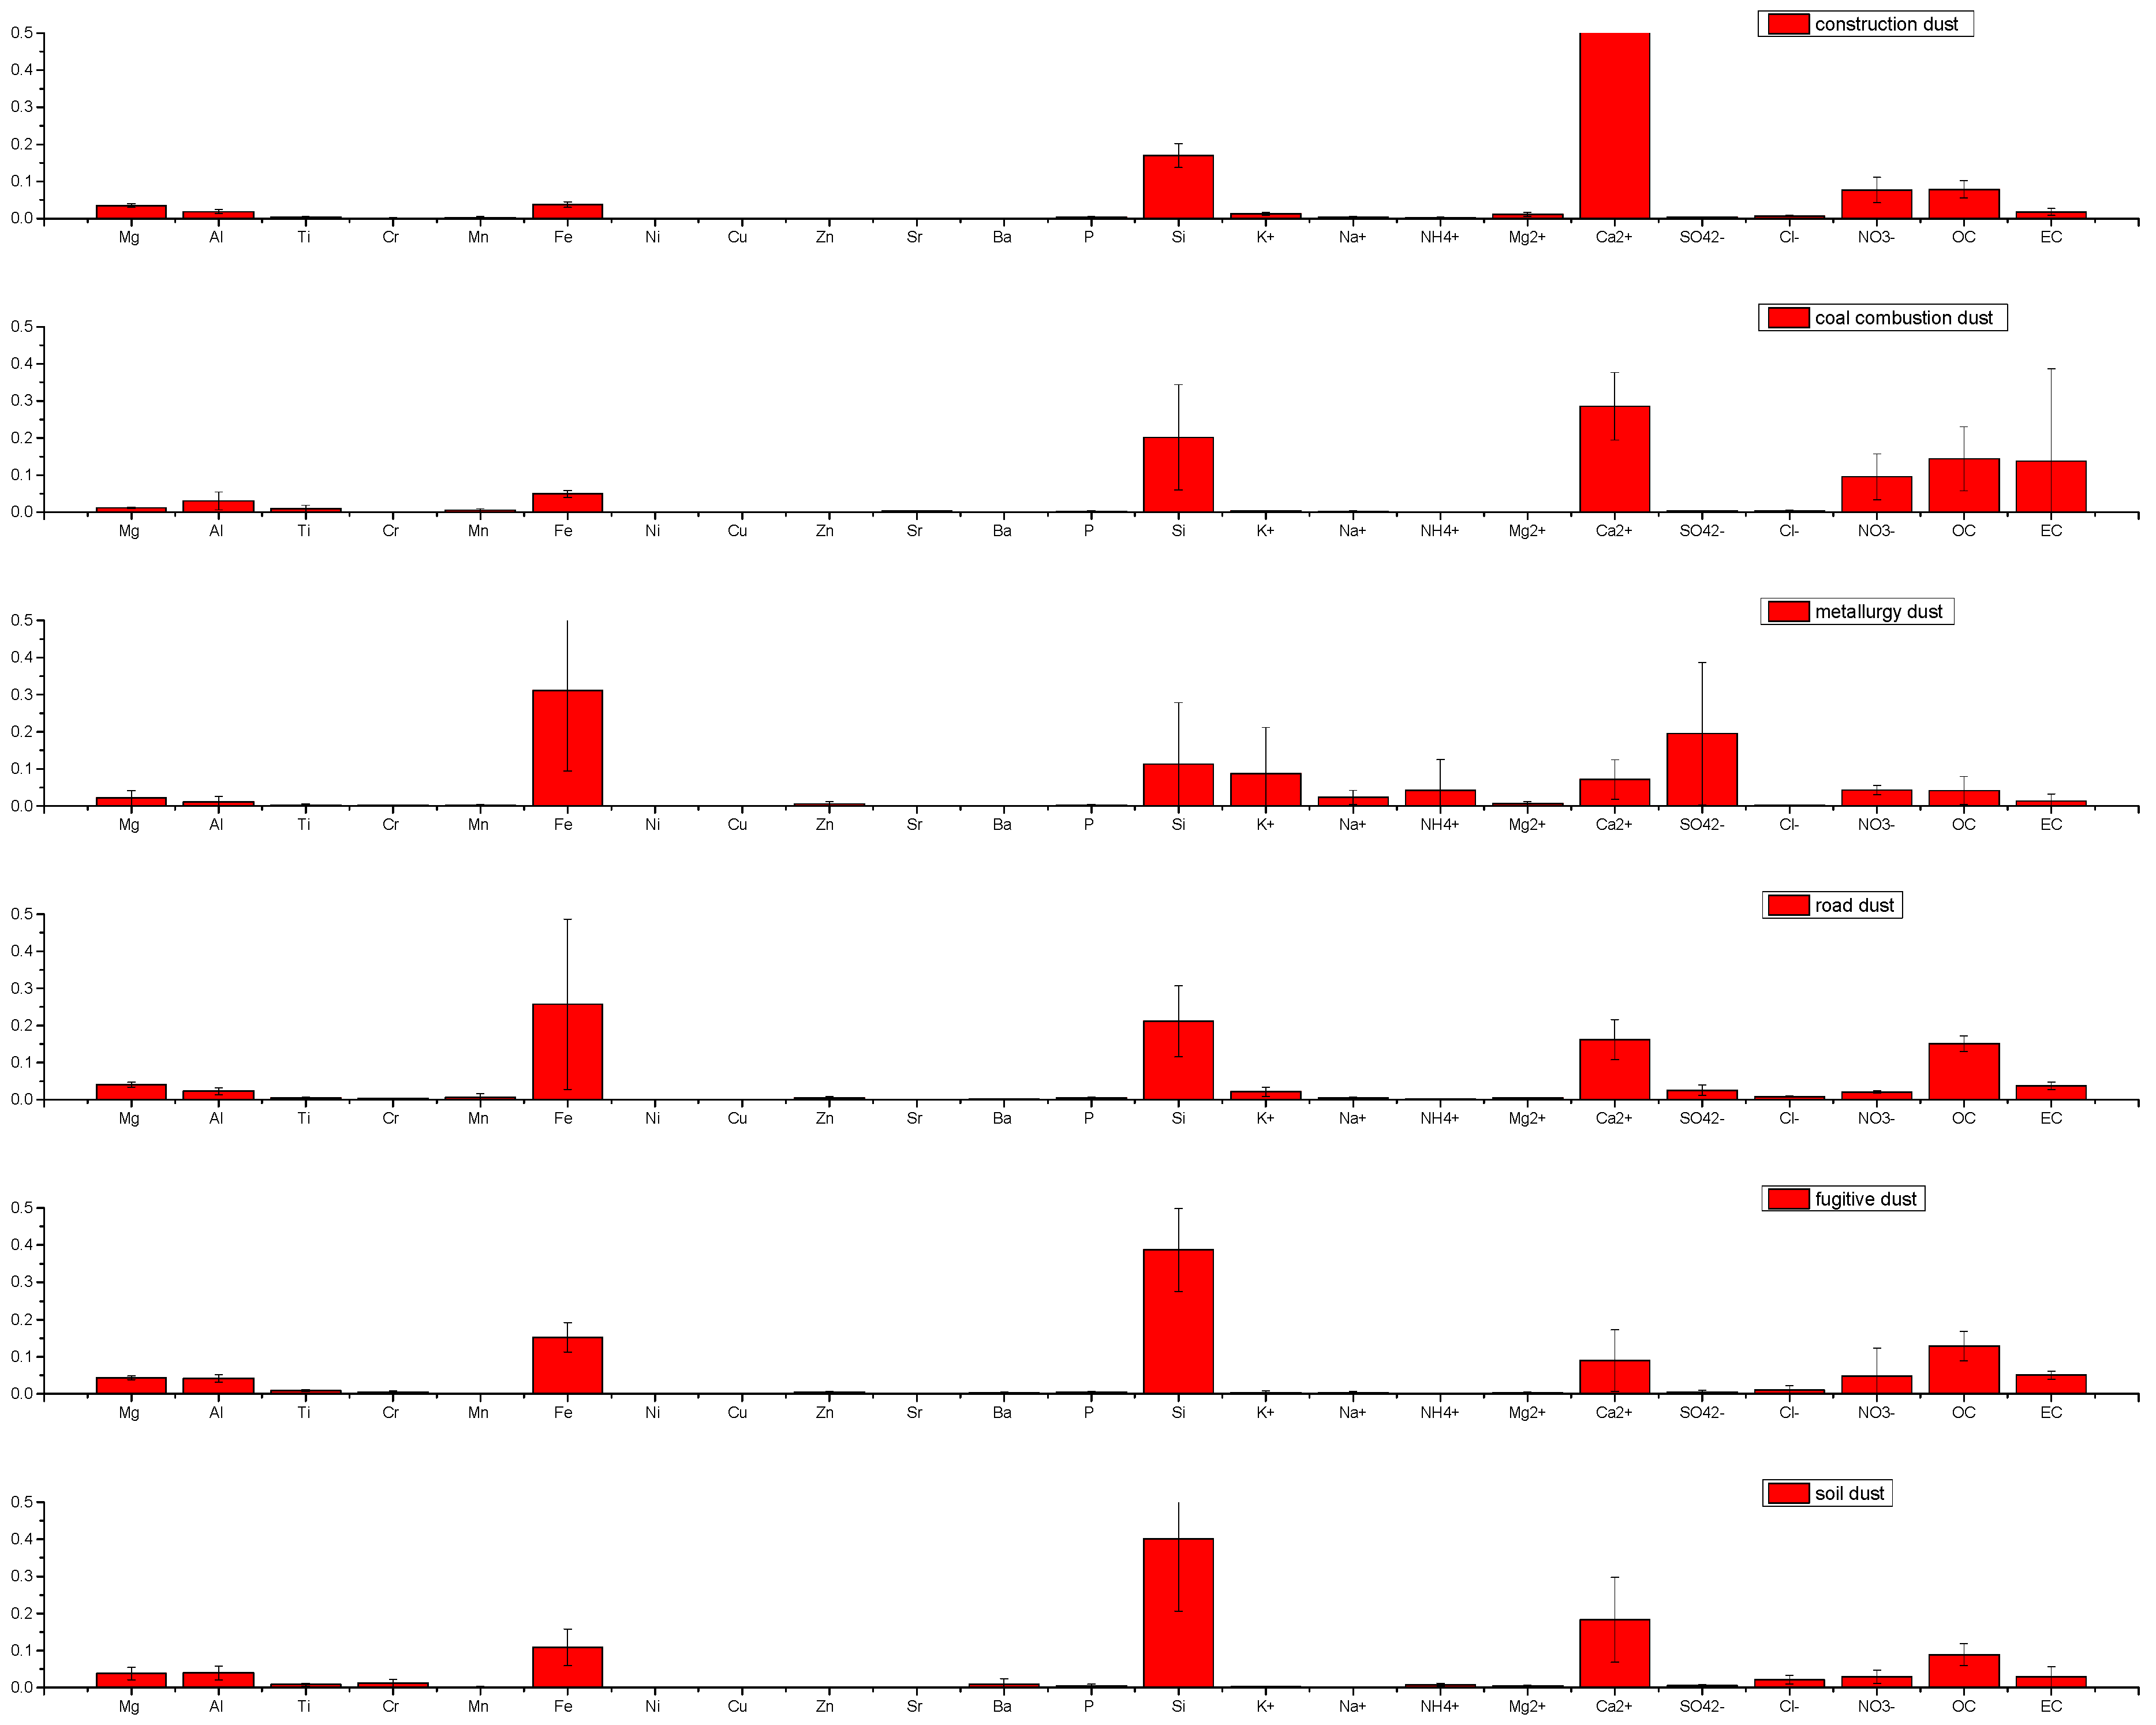
3.3. Source Profiles of PM2.5
3.4. Source Apportionment of PM2.5
3.5. Emission Control Measures
4. Conclusions
Author Contributions
Funding
Acknowledgments
Conflicts of Interest
References
- Zhang, R.; Jing, J.; Tao, J.; Hsu, S.C.; Wang, G.; Cao, J.; Lee, S.L.; Zhu, L.; Chen, Z.; Zhao, Y.; Shen, Z. Chemical characterization and source apportionment of PM2.5 in Beijing: seasonal perspective. Atmos. Chem. Phys. 2013, 13, 7053–7074. [Google Scholar] [CrossRef]
- Zhang, H.; Wang, S.; Hao, J.; Wang, X.; Wang, S.; Chai, F.; Li, M. Air pollution and control action in Beijing. J. Clean. Prod. 2016, 112, 1519–1527. [Google Scholar] [CrossRef]
- Tao, J.; Gao, J.; Zhang, L.; Zhang, R.; Che, H.; Zhang, Z.; Lin, Z.; Jing, J.; Cao, J.; Hsu, S.C. PM2.5 pollution in a megacity of southwest China: Source apportionment and implication. Atmos. Chem. Phys. 2014, 14, 8679–8699. [Google Scholar] [CrossRef]
- Maji, K.; Dikshit, A.; Arora, M.; Deshpande, A. Estimating premature mortality attributable to PM2.5 exposure and benefit of air pollution control policies in China for 2020. Sci. Total Environ. 2018, 612, 683–693. [Google Scholar] [CrossRef] [PubMed]
- Yang, L.; Cheng, S.; Wang, X.; Nie, W.; Xu, P.; Gao, X.; Yuan, C.; Wang, W. Source identification and health impact of PM2.5 in a heavily polluted urban atmosphere in China. Atmos. Environ. 2013, 75, 65–269. [Google Scholar] [CrossRef]
- Lim, S.S.; Vos, T.; Flaxman, A.D.; Danaei, G.; Shibuya, K.; Adair-Rohani, H.; AlMazroa, M.A.; Amann, M.; Anderson, P.H.R.; Andrews, K.G.; et al. A comparative risk assessment of burden of disease and injury attributable to 67 risk factors and risk factor clusters in 21 regions, 1990–2010: A systematic analysis for the Global Burden of Disease Study 2010. Lancet 2013, 380, 2224–2260. [Google Scholar] [CrossRef]
- Zhang, H.; Hu, J.; Qi, Y.; Li, C.; Chen, J.; Wang, X.; He, J.; Wang, X.; Hao, J.; Zhang, L.; et al. Emission characterization, environmental impact, and control measure of PM2.5 emitted from agricultural crop residue burning in China. J. Clean. Prod. 2017, 149, 629–635. [Google Scholar] [CrossRef]
- Ministry of Ecology and Environment of the People’s Republic of China. 2012. Available online: http://kjs.mee.gov.cn/hjbhbz/bzwb/dqhjbh/dqhjzlbz/201203/t20120302_224165.shtml (accessed on 31 December 2018).
- Ministry of Ecology and Environment of the People’s Republic of China. 2014. Available online: http://www.mee.gov.cn/hjzl/zghjzkgb/lnzghjzkgb/ (accessed on 31 December 2018).
- Ministry of Ecology and Environment of the People’s Republic of China. 2015. Available online: http://www.mee.gov.cn/hjzl/zghjzkgb/lnzghjzkgb/ (accessed on 31 December 2018).
- Chow, J.C.; Watson, J.G.; Lowenthal, D.H.; Chen, L.W.A.; Zielinska, B.; Mazzoleni, L.R.; Magliano, K.L. Valuation of organic markers for chemical mass balance source apportionment at the Fresno Supersite. Atmos. Chem. Phys. 2007, 7, 1741–1754. [Google Scholar] [CrossRef]
- Watson, J.G.; Chen, L.W.A.; Chow, J.C.; Doraiswamy, P.; Lowenthal, D.H. Source apportionment: findings from the U.S. supersites program. J. Air Waste Manag. Assoc. 2008, 58, 265–288. [Google Scholar] [CrossRef] [PubMed]
- Shi, G.L.; Tian, Y.Z.; Zhang, Y.F.; Ye, W.Y.; Li, X.; Tie, X.X.; Feng, Y.C.; Zhu, T. Estimation of the concentrations of primary and secondary organic carbon in ambient particulate matter: Application of the CMB-Iteration method. Atmos. Environ. 2011, 45, 5692–5698. [Google Scholar] [CrossRef]
- Zhang, Y.; Cai, J.; Wang, S.; He, K.; Zheng, M. Review of receptor-based source apportionment research of fine particulate matter and its challenges in China. Sci. Total Environ. 2017, 586, 917–929. [Google Scholar] [CrossRef] [PubMed]
- Chow, J.C.; Watson, J.G.; Houck, J.E.; Pritchett, L.C.; Fred Rogers, C.; Frazier, C.A.; Egami, R.T.; Ball, B.M. A laboratory resuspension chamber to measure fugitive dust size distributions and chemical compositions. Atmos. Environ. 1994, 28, 3463–3481. [Google Scholar] [CrossRef]
- Carvacho, O.F.; Ashbaugh, L.L.; Brown, M.S.; Flocchini, R.G. Measurement of PM2.5 emission potential from soil using the uc davis resuspension test chamber. Geomorphology 2004, 59, 75–80. [Google Scholar] [CrossRef]
- Bi, X.; Feng, Y.; Wu, J.; Wang, Y.; Zhu, T. Source apportionment of PM10 in six cities of northern China. Atmos. Environ. 2007, 41, 903–912. [Google Scholar] [CrossRef]
- Hsu, S.C.; Liu, S.C.; Huang, Y.T.; Lung, S.C.C.; Tsai, F.; Tu, J.Y.; Kao, S.J. A criterion for identifying Asian dust events based on Al concentration data collected from northern Taiwan between 2002 and early 2007. J. Geophys. Res. Atmos. 2008, 113, D18306. [Google Scholar] [CrossRef]
- Hsu, S.C.; Liu, S.C.; Kao, S.J.; Jeng, W.L.; Huang, Y.T.; Tseng, C.M.; Tsai, F.; Tu, J.Y.; Yang, Y. Water-soluble species in the marine aerosol from the northern South China Sea: High chloride depletion related to air pollution. J. Geophys. Res. Atmos. 2007, 112, D19304. [Google Scholar] [CrossRef]
- Hsu, S.C.; Liu, S.C.; Tsai, F.; Engling, G.; Lin, I.I.; Chou, C.K.C.; Kao, S.J.; Lung, S.C.C.; Chan, C.Y.; Lin, S.C. High wintertime particulate matter pollution over an offshore island (Kinmen) off southeastern China: An overview. J. Geophys. Res. Atmos. 2010, 115, 1383–1392. [Google Scholar] [CrossRef]
- Tian, S.; Pan, Y.; Liu, Z.; Wen, T.; Wang, Y. Size-resolved aerosol chemical analysis of extreme haze pollution events during early 2013 in urban Beijing, China. J. Hazard. Mater. 2014, 279, 452–460. [Google Scholar] [CrossRef] [PubMed]
- Liu, B.S.; Song, N.; Dai, Q.L.; Mei, R.B.; Sui, B.H.; Bi, X.H.; Feng, Y.C. Chemical composition and source apportionment of ambient PM2.5 during the nonheating period in Taian, China. Atmos. Res. 2016, 170, 23–33. [Google Scholar] [CrossRef]
- Chow, J.C.; Watson, J.G.; Chen, L.W.A.; Chang, M.C.O.; Robinson, N.F.; Trimble, D.; Kohl, S. The IMPROVE_A temperature protocol for thermal/optical carbon analysis: maintaining consistency with a long term database. J. Air Waste Manag. Assoc. 2007, 57, 1014–1023. [Google Scholar] [CrossRef] [PubMed]
- Zhang, Y.L.; Perron, N.; Ciobanu, V.G.; Zotter, P.; Minguillon, M.C.; Wacker, L.; Prevot, A.S.H.; Baltensperger, U.; Szidat, S. On the isolation of OC and EC and the optical strategy of radiocarbon-based source apportionment of carbonaceous aerosols. Atmos. Chem. Phys. 2012, 12, 10841–10856. [Google Scholar] [CrossRef]
- Ke, L.; Ding, X.; Tanner, R.L.; Schauer, J.J.; Zheng, M. Source contributions to carbonaceous aerosols in the Tennessee Valley Region. Atmos. Environ. 2007, 41, 8898–8923. [Google Scholar] [CrossRef]
- Stone, E.A.; Snyder, D.C.; Sheesley, R.J.; Sullivan, A.P.; Weber, R.J.; Schauer, J.J. Source apportionment of fine organic aerosol in Mexico City during the MILAGRO experiment 2006. Atmos. Chem. Phys. 2008, 8, 1249–1259. [Google Scholar] [CrossRef]
- Kleeman, M.J.; Riddle, S.G.; Robert, M.A.; Jakober, C.A.; Fine, P.M.; Hays, M.D.; Schauer, J.J.; Hannigan, M.P. Source apportionment of fine (PM1.8) and ultrafine (PM0.1) airborne particulate matter during a severe winter pollution episode. Environ. Sci. Technol. 2009, 43, 272–279. [Google Scholar] [CrossRef] [PubMed]
- Yin, J.; Harrison, R.M.; Chen, Q.; Rutter, A.; Schauer, J.J. Source apportionment of fine particles at urban background and rural sites in the UK atmosphere. Atmos. Environ. 2010, 44, 841–851. [Google Scholar] [CrossRef]
- Perrone, M.G.; Larsen, B.R.; Ferrero, L.; Sangiorgi, G.; Gennaro, G.D.; Udisti, R.; Zangrando, R.; Gambaro, A.; Bolzacchini, E. Sources of high PM2.5 concentrations in Milan, Northern Italy: Molecular marker data and CMB modelling. Sci. Total Environ. 2012, 414, 343–355. [Google Scholar] [CrossRef] [PubMed]
- Villalobos, A.M.; Barraza, F.; Jorquera, H.; Schauer, J.J. Chemical speciation and source apportionment of fine particulate matter in Santiago, Chile, 2013. Sci. Total Environ. 2015, 512–513, 133–142. [Google Scholar] [CrossRef] [PubMed]
- Henry, R.C.; Lewis, C.W.; Hopke, P.K.; Williamson, H.J. Review of receptor model fundamentals. Atmos. Environ. 1984, 18, 1507–1515. [Google Scholar] [CrossRef]
- Wu, L.; Shen, J.D.; Feng, Y.C.; Bi, X.H.; Jiao, L.; Liu, S.X. Source Apportionment of Particulate Matters in Different Size Bins during Hazy and Non-Hazy Episodes in Hangzhou City. Res. Environ. Sci. 2014, 27, 373–381. [Google Scholar]
- Cao, J.J.; Chow, J.C.; Watson, J.G.; Wu, F.; Han, Y.M.; Jin, Z.D.; Shen, Z.X.; An, Z.S. Size-differentiated source profiles for fugitive dust in the Chinese Loess Plateau. Atmos. Environ. 2008, 42, 2261–2275. [Google Scholar] [CrossRef]
- Shuang, D.; Shi, Y.; Yu, L.; Chen, Z.; Wang, X.; Cao, Q.; Li, S.; Fan, Z. Emission characteristics of Cd, Pb and Mn from coal combustion: Field study at coal-fired power plants in China. Fuel Process. Technol. 2014, 126, 469–475. [Google Scholar]
- Wang, Y.F.; Huang, K.L.; Li, C.T.; Mi, H.H.; Luo, J.H.; Tsai, P.J. Emissions of fuel metals content from a diesel vehicle engine. Atmos. Environ. 2003, 37, 4637–4643. [Google Scholar] [CrossRef]
- Jansen, J.J.; Edgerton, E.S.; Hansen, D.A.; Hartsell, B.E. Sampling Artifacts in the Federal Reference Method for PM2.5. 2002. Available online: www.atmospheric-research.com (accessed on 31 December 2018).
- Tolocka, M.; Solomon, P.; Mitchell, W.; Norris, G.; Gemmill, D.; Wiener, R.; Vanderpool, R.; Homolya, J.; Rice, J. East versus West in the US: Chemical Characteristics of PM2.5 during the Winter of 1999. Aerosol Sci. Technol. 2001, 34, 88–96. [Google Scholar] [CrossRef]
- Turpin, B.; Lim, H.-J. Species Contributions to PM2.5 Mass Concentrations: Revisiting Common Assumptions for Estimating Organic Mass. Aerosol Sci. Technol. 2001, 35, 602–610. [Google Scholar] [CrossRef]
- Malm, W.C.; Gebhart, K.A.; Molenar, J.; Cahill, T.; Eldred, R.; Huffman, D. Examining the relationship between atmospheric aerosols and light extinction at Mount Rainier and North Cascades National Parks. Atmosp. Environ. 1994, 28, 347–360. [Google Scholar] [CrossRef]
- Malm, W.C.; Sisler, J.F.; Huffman, D.; Eldred, R.A.; Cahill, T.A. Spatial and Seasonal Trends in Particle Concentration and Optical Extinction in the United-States. J. Geophys. Res. Atmos. 1994, 99, 1347–1370. [Google Scholar] [CrossRef]
- Chow, J.C.; Watson, J.G.; Kuhns, H.; Etyemezian, V.; Low-enthal, D.H.; Crow, D.; Kohl, S.D.; Engelbrecht, J.P.; Green, M.C. Source profiles for industrial, mobile, and areasources in the big bend regional aerosol visibility and observational study. Chemosphere 2004, 54, 185–208. [Google Scholar] [CrossRef] [PubMed]
- Huang, X.; Liu, Z.; Liu, J.; Hu, B.; Wen, T.; Tang, G.; Zhang, J.; Wu, F.; Ji, D.; Wang, L.; et al. Chemical characterization and source identification of PM2.5 at multiple sites in the Beijing-Tianjin-Hebei region, China. Atmos. Chem. Phys. 2017, 17, 12941–12962. [Google Scholar] [CrossRef]
- Li, X.; Zhang, Q.; Zhang, Y.; Zheng, B.; Wang, K.; Chen, Y.; Wallington, T.J.; Han, W.; Shen, W.; Zhang, X.; et al. Source contributions of urban PM2.5 in the Beijing–Tianjin–Hebei region: Changes between 2006 and 2013 and relative impacts of emissions and meteorology. Atmos. Environ. 2015, 123, 229–239. [Google Scholar] [CrossRef]
| Species | Cold Period (μg m−3) (n = 236) | Warm Period (μg m−3) (n = 240) | ||
|---|---|---|---|---|
| Ave. | SD | Ave. | SD | |
| PM2.5 | 214.53 | 87.46 | 81.43 | 35.08 |
| EC | 16.18 | 9.53 | 4.40 | 2.32 |
| OC | 27.32 | 17.82 | 9.13 | 2.60 |
| SO42− | 24.12 | 16.16 | 9.72 | 7.61 |
| NO3− | 24.84 | 15.98 | 7.18 | 6.76 |
| Cl− | 5.82 | 3.04 | 2.08 | 1.56 |
| NH4+ | 24.15 | 16.40 | 5.22 | 4.89 |
| Ca2+ | 1.63 | 0.73 | 1.45 | 0.61 |
| K+ | 1.20 | 0.80 | 1.19 | 0.61 |
| Mg2+ | 0.24 | 0.09 | 0.23 | 0.15 |
| Na+ | 0.86 | 0.46 | 0.64 | 0.32 |
| Si | 13.38 | 6.02 | 6.29 | 5.49 |
| Al | 5.04 | 2.22 | 1.78 | 2.21 |
| K | 2.36 | 0.99 | 1.66 | 0.69 |
| Fe | 1.18 | 0.37 | 1.04 | 0.29 |
| Pb | 0.33 | 0.29 | 0.23 | 0.16 |
| Ba | 0.04 | 0.02 | 0.03 | 0.03 |
| Sn | 0.01 | 0.01 | - | - |
| Cd | 0.01 | - | - | - |
| Se | 0.01 | 0.01 | 0.01 | 0.01 |
| As | 0.02 | 0.01 | 0.01 | 0.01 |
| Zn | 0.42 | 0.29 | 0.24 | 0.15 |
| Cu | 0.03 | 0.02 | 0.02 | 0.01 |
| Ni | 0.01 | 0.01 | 0.01 | 0.01 |
| Mn | 0.07 | 0.02 | 0.06 | 0.03 |
| Cr | 0.02 | 0.02 | 0.02 | 0.03 |
| Ti | 0.07 | 0.03 | 0.05 | 0.03 |
| Source | Cold Period | Warm Period | Average | |||
|---|---|---|---|---|---|---|
| (%) | μg m−3 | (%) | μg m−3 | (%) | μg m−3 | |
| Fugitive dust | 6.7% | 14.4 ± 4.3 | 10.6% | 8.6 ± 3.1 | 9.7% | 14.3 ± 5.3 |
| Soil dust | 2.8% | 6.0 ± 2.1 | 3.6% | 2.9 ± 1.1 | 3.4% | 5.0 ± 2.4 |
| Metallurgy dust | 0.7% | 1.6 ± 2.7 | 2.3% | 1.9 ± 1.3 | 1.6% | 2.3 ± 2.4 |
| Coal combustion dust | 28.4% | 60.9 ± 25.9 | 17.4% | 14.1 ± 6.2 | 24.4% | 36.1 ± 14.7 |
| Construction dust | 5.0% | 10.7 ± 4.8 | 4.9% | 4.0 ± 1.7 | 5.5% | 8.1 ± 2.9 |
| Secondary sulfate | 20.8% | 44.6 ± 19.6 | 22.5% | 18.2 ± 9.3 | 22.2% | 32.9 ± 18.3 |
| Secondary nitrate | 21.9% | 46.9 ± 18.3 | 17.0% | 13.8 ± 6.7 | 18.4% | 27.2 ± 16.1 |
| Vehicle exhaust dust | 11.8% | 25.4 ± 10.8 | 14.8% | 12.0 ± 5.9 | 12.4% | 18.3 ± 12.2 |
| Unknown source | 1.8% | - | 6.9% | - | 2.6% | - |
© 2019 by the authors. Licensee MDPI, Basel, Switzerland. This article is an open access article distributed under the terms and conditions of the Creative Commons Attribution (CC BY) license (http://creativecommons.org/licenses/by/4.0/).
Share and Cite
Hu, J.; Wang, H.; Zhang, J.; Zhang, M.; Zhang, H.; Wang, S.; Chai, F. PM2.5 Pollution in Xingtai, China: Chemical Characteristics, Source Apportionment, and Emission Control Measures. Atmosphere 2019, 10, 121. https://doi.org/10.3390/atmos10030121
Hu J, Wang H, Zhang J, Zhang M, Zhang H, Wang S, Chai F. PM2.5 Pollution in Xingtai, China: Chemical Characteristics, Source Apportionment, and Emission Control Measures. Atmosphere. 2019; 10(3):121. https://doi.org/10.3390/atmos10030121
Chicago/Turabian StyleHu, Jun, Han Wang, Jingqiao Zhang, Meng Zhang, Hefeng Zhang, Shulan Wang, and Fahe Chai. 2019. "PM2.5 Pollution in Xingtai, China: Chemical Characteristics, Source Apportionment, and Emission Control Measures" Atmosphere 10, no. 3: 121. https://doi.org/10.3390/atmos10030121
APA StyleHu, J., Wang, H., Zhang, J., Zhang, M., Zhang, H., Wang, S., & Chai, F. (2019). PM2.5 Pollution in Xingtai, China: Chemical Characteristics, Source Apportionment, and Emission Control Measures. Atmosphere, 10(3), 121. https://doi.org/10.3390/atmos10030121


